Notebookcheck Logo

AMD Radeon R5 (Beema/Carrizo-L)

AMD Radeon R5 (Beema/Carrizo-L)

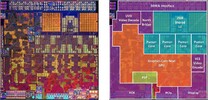
L'AMD Radeon R5 è una scheda grafica integrata DirectX 11.2 che si trova su alcune APUs AMD Beema (ad esempio, l'A8-6410). Offre 128 shader cores su due Compute Units e si basa sull'architettura GCN. La velocità clock può arrivare ad 800 MHz. La scheda grafica non ha VRAM dedicata ed accederà alla memoria di sistema (single-channel DDR3L-1866).

Utilizzando il suo UVD (Unified Video Decoder), la GPU supporta la CPU nella decodifica di videos fino a 4K. In aggiunta, il chip integra uno specifico video encoder chiamato VCE. I flussi Video possono uscire da VGA, DVI, HDMI 1.4a e DisplayPort 1.2 anche su due monitors esterni.

Le prestazioni della Radeon R5 sono leggermente superiori ad una Radeon HD 7470M o una Intel HD Graphics 4200. Solo i giochi più vecchi o meno datati risultano fluidi come FIFA.

Radeon R Serie

Radeon R5 (Beema/Carrizo-L) 128 @ 0.85 GHz64 Bit
Radeon R4 (Beema) 128 @ 0.8 GHz64 Bit
Radeon R3 (Mullins/Beema) 128 @ 0.35 - 0.69 GHz64 Bit
Radeon R2 (Mullins/Beema/Carrizo-L) 128 @ 0.3 - 0.6 GHz64 Bit
Radeon R6 (Mullins) 128 @ 0.5 GHz64 Bit
Nome in codiceBeema
ArchitetturaGCN 1.1
Pipelines128 - unified
Velocità del core850 (Boost) MHz
Larghezza del bus di memoria64 Bit
Memoria condivisasi
APIDirectX 12 (FL 12_0), Shader 5.0
tecnologia28 nm
Data dell'annuncio29.04.2014
CPU in Radeon R5 (Beema/Carrizo-L)GPU Base SpeedGPU Boost / Turbo
AMD A8-74104 x 2200 MHz, 12 - 25 W300 MHz850 MHz
AMD A8-64104 x 2000 MHz, 15 W? MHz800 MHz
min. - max.300 - ? MHz800 - 850 MHz

Benchmark

Performance Rating - 3DMark 11 + Fire Strike + Time Spy
0.2 pt (1%)
AMD Radeon HD 8180
0.06259 -73%
...
Intel HD Graphics (Broadwell)
0.1999 -14%
0.2005 -14%
0.205 -12%
0.2072 -11%
0.2145 -8%
AMD Radeon R2 (Stoney Ridge)
0.2208 -5%
0.221 -5%
0.2223 -4%
Intel UHD Graphics (Elkhart Lake 16 EU)
0.2258 -3%
AMD Radeon R5 (Beema/Carrizo-L)
0.2327
0.2456 6%
0.2456 6%
0.2456 6%
0.2469 6%
AMD Radeon R4 (Stoney Ridge)
0.2516 8%
0.2611 12%
0.2622 13%
0.2681 15%
0.2689 16%
...
NVIDIA GeForce RTX 4090 Laptop GPU
20 8495%
0%
100%
3DMark - 3DMark Ice Storm Unlimited Graphics
36807 Points (4%)
3DMark - 3DMark Cloud Gate Score
min: 2071     media: 2757     media: 2882 (3%)     massimo: 3024 Points
3DMark - 3DMark Cloud Gate Graphics
min: 3225     media: 3352     media: 3317 (1%)     massimo: 3479 Points
3DMark - 3DMark Fire Strike Standard Score
min: 480     media: 503     media: 510 (1%)     massimo: 522 Points
3DMark - 3DMark Fire Strike Standard Graphics
min: 515     media: 538     media: 539 (1%)     massimo: 560 Points
3DMark - 3DMark Ice Storm Graphics
min: 35815     media: 36863     media: 36890 (5%)     massimo: 38840 Points
3DMark 11 - 3DM11 Performance Score
min: 815     media: 849     media: 831 (1%)     massimo: 970 Points
3DMark 11 - 3DM11 Performance GPU
min: 744     media: 777     media: 764 (1%)     massimo: 899 Points
171.8 -78%
...
700 -10%
701 -10%
721 -7%
AMD Radeon R2 (Stoney Ridge)
731 -6%
743 -4%
753 -3%
755 -3%
756 -3%
757 -3%
AMD Radeon R5 (Beema/Carrizo-L)
777
799 3%
819 5%
825 6%
841 8%
847 9%
856 10%
AMD Radeon R4 (Stoney Ridge)
861 11%
868 12%
887 14%
...
NVIDIA GeForce RTX 4090 Laptop GPU
65540 8335%
0%
100%
3DMark Vantage
3DM Vant. Perf. total +
3DMark Vantage - 3DM Vant. Perf. total
2698 Points (1%)
3DM Vant. Perf. GPU no PhysX +
3DMark Vantage - 3DM Vant. Perf. GPU no PhysX
2259 Points (1%)
62 -97%
...
Intel HD Graphics (Broadwell)
2196 -3%
2201 -3%
2203 -2%
2207 -2%
2212 -2%
ATI Mobility Radeon HD 560v
2216 -2%
2220 -2%
2222 -2%
AMD Radeon R4 (Stoney Ridge)
2243 -1%
AMD Radeon R5 (Beema/Carrizo-L)
2259
2322 3%
ATI Mobility Radeon HD 5165
2362 5%
2392 6%
2441 8%
2453 9%
2478 10%
2527 12%
2552 13%
AMD Radeon HD 6755G2
2593 15%
...
NVIDIA GeForce RTX 4090 Laptop GPU
132443 5763%
0%
100%
3DMark 06 3DMark 06 - Standard 1280x1024 +
3DMark 06
min: 4731     media: 4956     media: 4956 (7%)     massimo: 5181 Points
3DMark 06 - Standard 1024x768 +
3DMark 06
5181 Points (7%)
Cinebench R10 Cinebench R10 Shading (32bit) +
Cinebench R10 - Cinebench R10 Shading (32bit)
min: 1746     media: 2576     media: 2779 (2%)     massimo: 2860 punti
Cinebench R11.5 Cinebench R11.5 OpenGL 64 Bit +
Cinebench R11.5 - Cinebench R11.5 OpenGL 64 Bit
min: 14.51     media: 15.5     media: 15.4 (6%)     massimo: 16.29 fps
Cinebench R15
Cinebench R15 OpenGL 64 Bit +
Cinebench R15 - Cinebench R15 OpenGL 64 Bit
min: 15.92     media: 17     media: 17 (4%)     massimo: 17.77 fps
Cinebench R15 OpenGL Ref. Match 64 Bit +
Cinebench R15 - Cinebench R15 OpenGL Ref. Match 64 Bit
98 % (98%)
GLBenchmark 2.5 - GLBench 2.5 Egypt HD
52 fps (87%)
GFXBench (DX / GLBenchmark) 2.7
GFXBench 2.7 T-Rex HD Onscreen C24Z16 +
GFXBench T-Rex HD Offscreen C24Z16 +
GFXBench (DX / GLBenchmark) 2.7 - GFXBench T-Rex HD Offscreen C24Z16
51 fps (0%)
LuxMark v2.0 64Bit - LuxMark v2.0 Room GPU
88 Samples/s (0%)
LuxMark v2.0 64Bit - LuxMark v2.0 Sala GPU
149 Samples/s (0%)
ComputeMark v2.1 - ComputeMark v2.1 Result
min: 445     media: 494.5     media: 494.5 (1%)     massimo: 544 punti
- Valori di benchmark per questa scheda grafica
- Valori medi di benchmark per questa scheda grafica
* Numeri più piccoli rappresentano prestazioni supeiori

Benchmarks per i giochi

I seguenti benchmarks deirivano dai benchmarks dei portatili recensiti. Le prestazioni dipendono dalla scheda grafica utilizzata, dal clock rate, dal processore, dai settaggi di sistema, dai drivers, e dai sistemi operativi. Quindi i risultati non sono rappresentativi per i portatili con questa GPU. Per informazioni dettagliate sui risultati del benchmark, cliccate sul numero di fps.

basso 1280x720
3  fps    + Confronta
» Il Benchmark indica che il gioco non è utilizzabile con i settaggi testati.
basso 1280x720
7.1  fps    + Confronta
» Il Benchmark indica che il gioco non è utilizzabile con i settaggi testati.
Control

Control

2019
basso 1280x720
7.3  fps    + Confronta
» Il Benchmark indica che il gioco non è utilizzabile con i settaggi testati.
F1 2019

F1 2019

2019
basso 1280x720
9  fps    + Confronta
» Il Benchmark indica che il gioco non è utilizzabile con i settaggi testati.
basso 1280x720
7.6  fps    + Confronta
» Il Benchmark indica che il gioco non è utilizzabile con i settaggi testati.
Anno 1800

Anno 1800

2019
basso 1280x720
8.1  fps    + Confronta
» Il Benchmark indica che il gioco non è utilizzabile con i settaggi testati.
basso 1280x720
6  fps    + Confronta
» Il Benchmark indica che il gioco non è utilizzabile con i settaggi testati.
basso 1280x720
18.2  fps    + Confronta
» Il Benchmark indica che il gioco non è utilizzabile con i settaggi testati.
Anthem

Anthem

2019
basso 1280x720
2  fps    + Confronta
» Il Benchmark indica che il gioco non è utilizzabile con i settaggi testati.
basso 1280x720
5  fps    + Confronta
» Il Benchmark indica che il gioco non è utilizzabile con i settaggi testati.
basso 1280x720
4  fps    + Confronta
» Il Benchmark indica che il gioco non è utilizzabile con i settaggi testati.
basso 1280x720
7.3  fps    + Confronta
» Il Benchmark indica che il gioco non è utilizzabile con i settaggi testati.
basso 1280x720
7.3  fps    + Confronta
» Il Benchmark indica che il gioco non è utilizzabile con i settaggi testati.
basso 1280x720
11.1  fps    + Confronta
» Il Benchmark indica che il gioco non è utilizzabile con i settaggi testati.
basso 1280x720
5.4  fps    + Confronta
» Il Benchmark indica che il gioco non è utilizzabile con i settaggi testati.
basso 1280x720
20.3  fps    + Confronta
» Il Benchmark indica che il gioco non è utilizzabile con i settaggi testati.
basso 1280x720
7.3  fps    + Confronta
» Il Benchmark indica che il gioco non è utilizzabile con i settaggi testati.
Hitman 2

Hitman 2

2018
basso 1280x720
5.2  fps    + Confronta
» Il Benchmark indica che il gioco non è utilizzabile con i settaggi testati.
basso 1280x720
7.6  fps    + Confronta
» Il Benchmark indica che il gioco non è utilizzabile con i settaggi testati.
basso 1280x720
7  fps    + Confronta
» Il Benchmark indica che il gioco non è utilizzabile con i settaggi testati.
basso 1280x720
10  fps    + Confronta
» Il Benchmark indica che il gioco non è utilizzabile con i settaggi testati.
FIFA 19

FIFA 19

2018
basso 1280x720
28.5  fps    + Confronta
» Il Benchmark indica che il gioco non è utilizzabile con i settaggi testati.
basso 1280x720
7  fps    + Confronta
» Il Benchmark indica che il gioco non è utilizzabile con i settaggi testati.
F1 2018

F1 2018

2018
basso 1280x720
12  fps    + Confronta
» Il Benchmark indica che il gioco non è utilizzabile con i settaggi testati.
basso 1280x720
7.4  fps    + Confronta
» Il Benchmark indica che il gioco non è utilizzabile con i settaggi testati.
basso 1280x720
8.9  fps    + Confronta
» Il Benchmark indica che il gioco non è utilizzabile con i settaggi testati.
Far Cry 5

Far Cry 5

2018
basso 1280x720
7  fps    + Confronta
» Il Benchmark indica che il gioco non è utilizzabile con i settaggi testati.
World of Tanks enCore

World of Tanks enCore

2018
basso 1366x768
56.7  fps    + Confronta
» Giocabile con tutti i portatili testati con dettagli basso.
basso 1280x720
7.1  fps    + Confronta
» Il Benchmark indica che il gioco non è utilizzabile con i settaggi testati.
basso 1280x720
8.6  fps    + Confronta
» Il Benchmark indica che il gioco non è utilizzabile con i settaggi testati.
basso 1280x720
5.5  fps    + Confronta
» Il Benchmark indica che il gioco non è utilizzabile con i settaggi testati.
Fortnite

Fortnite

2018
basso 1280x720
16.2  fps    + Confronta
» Il Benchmark indica che il gioco non è utilizzabile con i settaggi testati.
basso 1280x720
6.1  fps    + Confronta
» Il Benchmark indica che il gioco non è utilizzabile con i settaggi testati.
basso 1280x720
8.4  fps    + Confronta
» Il Benchmark indica che il gioco non è utilizzabile con i settaggi testati.
ELEX

ELEX

2017
basso 1280x720
9.5  fps    + Confronta
» Il Benchmark indica che il gioco non è utilizzabile con i settaggi testati.
basso 1280x720
11  fps    + Confronta
» Il Benchmark indica che il gioco non è utilizzabile con i settaggi testati.
F1 2017

F1 2017

2017
basso 1280x720
15  fps    + Confronta
» Il Benchmark indica che il gioco non è utilizzabile con i settaggi testati.
basso 1280x720
11.2  fps    + Confronta
» Il Benchmark indica che il gioco non è utilizzabile con i settaggi testati.
basso 1280x720
23  fps    + Confronta
medio 1366x768
22  fps    + Confronta
» Il Benchmark indica che il gioco non è utilizzabile con i settaggi testati.
Dirt 4

Dirt 4

2017
basso 1280x720
23.4  fps    + Confronta
medio 1920x1080
13.3  fps    + Confronta
» Il Benchmark indica che il gioco non è utilizzabile con i settaggi testati.
basso 1280x720
29  fps    + Confronta
» Il Benchmark indica che il gioco non è utilizzabile con i settaggi testati.
Prey

Prey

2017
basso 1280x720
13.1  fps    + Confronta
» Il Benchmark indica che il gioco non è utilizzabile con i settaggi testati.
basso 1280x720
9.6  fps    + Confronta
» Il Benchmark indica che il gioco non è utilizzabile con i settaggi testati.
basso 1280x720
8.8  fps    + Confronta
medio 1920x1080
2.9  fps    + Confronta
» Il Benchmark indica che il gioco non è utilizzabile con i settaggi testati.
For Honor

For Honor

2017
basso 1280x720
14.5  fps    + Confronta
medio 1920x1080
4.9  fps    + Confronta
» Il Benchmark indica che il gioco non è utilizzabile con i settaggi testati.
basso 1280x720
19.8  fps    + Confronta
medio 1920x1080
11.9  fps    + Confronta
» Il Benchmark indica che il gioco non è utilizzabile con i settaggi testati.
basso 1280x720
7.1  fps    + Confronta
medio 1366x768
5.1  fps    + Confronta
» Il Benchmark indica che il gioco non è utilizzabile con i settaggi testati.
basso 1280x720
17.6  fps    + Confronta
medio 1366x768
14.7  fps    + Confronta
» Il Benchmark indica che il gioco non è utilizzabile con i settaggi testati.
basso 1280x720
41.5  fps    + Confronta
medio 1366x768
28.3  fps    + Confronta
» Giocabile con tutti i portatili testati con dettagli basso.
basso 1280x720
13.2  fps    + Confronta
medio 1366x768
9.3  fps    + Confronta
» Il Benchmark indica che il gioco non è utilizzabile con i settaggi testati.
basso 1024x768
18.3  fps    + Confronta
medio 1366x768
7  fps    + Confronta
» Il Benchmark indica che il gioco non è utilizzabile con i settaggi testati.
basso 1280x720
7.7  fps    + Confronta
medio 1366x768
5.6  fps    + Confronta
» Il Benchmark indica che il gioco non è utilizzabile con i settaggi testati.
basso 1280x720
10.5  fps    + Confronta
» Il Benchmark indica che il gioco non è utilizzabile con i settaggi testati.
Overwatch

Overwatch

2016
basso 1280x720
20.4  fps    + Confronta
medio 1366x768
17.1  fps    + Confronta
» Il Benchmark indica che il gioco non è utilizzabile con i settaggi testati.
Doom

Doom

2016
basso 1280x720
9.3  fps    + Confronta
» Il Benchmark indica che il gioco non è utilizzabile con i settaggi testati.
basso 1280x720
7.2  fps    + Confronta
medio 1366x768
4.1  fps    + Confronta