Intel HD Graphics 4600
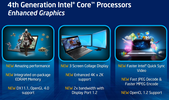
L'Intel HD Graphics 4600 (GT2) è una scheda grafica inclusa in alcuni processori Haswell del 2013. Il clock base può subire l'overclock automatico utilizzando la tecnologia Turbo Boost. In base al modello di processore, i clock rates base e turbo possono differire di parecchio con evidenti variazioni di prestazioni grafiche tra i vari modelli di CPU.
In confronto alla HD 4000, il core grafico è stato modificato parecchio. La GPU supporta DirectX 11.1, OpenCL 1.2 ed OpenGL 4.0. Inoltre ha un miglior decoder per video da 4K ed un veloce encoder Quick Sync.
Stando ai benchmarks Intel del 3DMark 11, l'HD Graphics 4600 sarà fino al 60 percento più veloce rispetto alla precedente HD 4000. Nei nostri gaming benchmarks, tuttavia, il miglioramento è stato di appena il 30 percento. Questa crescita di prestazioni è stata ottenuta con miglioramenti dell'architettura e con l'incremento del numero di execution units: La versione GT2 integra 20 EUs, rispetto alle 16 EUs della vecchia HD 4000. Pertanto, l'HD 4600 non solo arriva al livello di alcune GPUs dedicate come la GeForce GT 620M/630M, ma compete anche con le più veloci GPUs AMD integrate come la Radeon HD 8650G.
Grazie al processo di produzione 3D Tri-Gate in 22nm, il consumo energetico dovrebbe essere relativamente basso. L'HD Graphics 4600 si trova su modelli dual- e quad-core Haswell nella fascia da 37 - 57 Watt di TDP.
HD Graphics Serie
| ||||||||||||||||||||||||||||||||||||||||||||||||||||||||||||||||||||||
| Nome in codice | Haswell GT2 | |||||||||||||||||||||||||||||||||||||||||||||||||||||||||||||||||||||
| Architettura | Gen. 7.5 Haswell | |||||||||||||||||||||||||||||||||||||||||||||||||||||||||||||||||||||
| iGPU | Integrated Graphics | |||||||||||||||||||||||||||||||||||||||||||||||||||||||||||||||||||||
| Pipelines | 20 - unified | |||||||||||||||||||||||||||||||||||||||||||||||||||||||||||||||||||||
| Velocità del core | 200 - 1350 (Boost) MHz | |||||||||||||||||||||||||||||||||||||||||||||||||||||||||||||||||||||
| Larghezza del bus di memoria | 64/128 Bit | |||||||||||||||||||||||||||||||||||||||||||||||||||||||||||||||||||||
| Memoria condivisa | si | |||||||||||||||||||||||||||||||||||||||||||||||||||||||||||||||||||||
| API | DirectX 11.1, Shader 5.0, OpenGL 4.0 | |||||||||||||||||||||||||||||||||||||||||||||||||||||||||||||||||||||
| tecnologia | 22 nm | |||||||||||||||||||||||||||||||||||||||||||||||||||||||||||||||||||||
| Caratteristiche | QuickSync | |||||||||||||||||||||||||||||||||||||||||||||||||||||||||||||||||||||
| Data dell'annuncio | 01.06.2013 | |||||||||||||||||||||||||||||||||||||||||||||||||||||||||||||||||||||
| ||||||||||||||||||||||||
Benchmark
3DM Vant. Perf. total +
specvp11 snx-01 +
specvp12 sw-03 +
Cinebench R15 OpenGL 64 Bit +
GFXBench T-Rex HD Offscreen C24Z16 +
* Numeri più piccoli rappresentano prestazioni supeiori
Benchmarks per i giochi
I seguenti benchmarks deirivano dai benchmarks dei portatili recensiti. Le prestazioni dipendono dalla scheda grafica utilizzata, dal clock rate, dal processore, dai settaggi di sistema, dai drivers, e dai sistemi operativi. Quindi i risultati non sono rappresentativi per i portatili con questa GPU. Per informazioni dettagliate sui risultati del benchmark, cliccate sul numero di fps.

New World
2021
Days Gone
2021
Yakuza Like a Dragon
2020
Hunt Showdown
2020
Escape from Tarkov
2020
Need for Speed Heat
2019
FIFA 20
2019
Borderlands 3
2019
Control
2019
F1 2019
2019
Anno 1800
2019
The Division 2
2019
Dirt Rally 2.0
2019
Anthem
2019
Far Cry New Dawn
2019
Metro Exodus
2019
Apex Legends
2019
Just Cause 4
2018
Darksiders III
2018
Battlefield V
2018
Farming Simulator 19
2018
Fallout 76
2018
Hitman 2
2018
Forza Horizon 4
2018
FIFA 19
2018
F1 2018
2018
Monster Hunter World
2018
The Crew 2
2018
Far Cry 5
2018
X-Plane 11.11
2018
Fortnite
2018
Call of Duty WWII
2017
Destiny 2
2017
ELEX
2017
The Evil Within 2
2017
FIFA 18
2017
Ark Survival Evolved
2017
F1 2017
2017
Team Fortress 2
2017
Dirt 4
2017
Rocket League
2017
Prey
2017
For Honor
2017
Resident Evil 7
2017
Watch Dogs 2
2016
Dishonored 2
2016
Titanfall 2
2016
Farming Simulator 17
2016
Battlefield 1
2016
Civilization 6
2016
Mafia 3
2016
FIFA 17
2016
No Man's Sky
2016
Overwatch
2016
Need for Speed 2016
2016
Hitman 2016
2016
The Division
2016
Far Cry Primal
2016
XCOM 2
2016
Rainbow Six Siege
2015
Just Cause 3
2015
Fallout 4
2015
Anno 2205
2015
FIFA 16
2015
World of Warships
2015
Metal Gear Solid V
2015
Mad Max
2015
Dota 2 Reborn
2015
The Witcher 3
2015
Dirt Rally
2015
GTA V
2015
Battlefield Hardline
2015
Evolve
2015
The Crew
2014
Far Cry 4
2014
F1 2014
2014
The Evil Within
2014
Ryse: Son of Rome
2014
Alien: Isolation
2014
Fifa 15
2014
Sims 4
2014
Risen 3: Titan Lords
2014
GRID: Autosport
2014
Watch Dogs
2014
Titanfall
2014
Thief
2014
X-Plane 10.25
2013
Call of Duty: Ghosts
2013
Battlefield 4
2013
F1 2013
2013
Fifa 14
2013
Total War: Rome II
2013
Saints Row IV
2013
Company of Heroes 2
2013
Metro: Last Light
2013
BioShock Infinite
2013
SimCity
2013
Tomb Raider
2013
Crysis 3
2013
Dead Space 3
2013
Far Cry 3
2012
Assassin´s Creed III
2012
Hitman: Absolution
2012
Dishonored
2012
Counter-Strike: GO
2012
Sleeping Dogs
2012
Max Payne 3
2012
Dirt Showdown
2012
Diablo III
2012
Risen 2: Dark Waters
2012
Mass Effect 3
2012
Alan Wake
2012
Anno 2070
2011
Battlefield 3
2011
Batman: Arkham City
2011
Dirt 3
2011
Mafia 2
2010
StarCraft 2
2010
Metro 2033
2010Per conoscere altri giochi che potrebbero essere utilizzabili e per una lista completa di tutti i giochi e delle schede grafiche visitate la nostra Gaming List
Recensioni Notebook con Intel HD Graphics 4600 la scheda grafica

Recensione breve del portatile Fujitsu LifeBook E554
Recensione breve del convertibile Fujitsu LifeBook T734
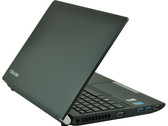
Recensione Breve del Portatile Toshiba Portégé R30-A-15C
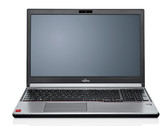
Recensione Breve Aggiornamento Portatile Fujitsu Lifebook E744 (E7440MXP11DE)
Fujitsu Lifebook E734: Intel Core i5-4200M, 13.30", 1.7 kg
recensione » Aggiornamento Recensione Portatile Fujitsu Lifebook E734 (E7340MXEA1DE)
Lenovo G510-59416358: Intel Core i5-4200M, 15.60", 2.5 kg
recensione » Recensione breve del Notebook Lenovo G510
Lenovo ThinkPad L540 20AV002YGE: Intel Core i5-4200M, 15.60", 2.3 kg
recensione » Recensione breve del Notebook Lenovo ThinkPad L540 20AV002YGE
HP ProBook 640 G1 H5G66ET: Intel Core i5-4200M, 14.00", 2.1 kg
recensione » Recensione breve notebook HP ProBook 640 G1 H5G66ET
Fujitsu LifeBook A544: Intel Core i5-4200M, 15.60", 2.2 kg
recensione » Recensione breve del portatile Fujitsu LifeBook A544
HP ProBook 650 G1 H5G74E: Intel Core i3-4000M, 15.60", 2.3 kg
recensione » Recensione breve del Notebook HP ProBook 650 G1 H5G74E
Lenovo Thinkpad L440: Intel Core i5-4330M, 14.00", 2.3 kg
recensione » Recensione breve del portatil Lenovo ThinkPad L440
Toshiba Satellite P75-A7200: Intel Core i7-4700MQ, 17.30", 2.9 kg
recensione » Recensione breve del Notebook Toshiba Satellite P75-A7200
Fujitsu LifeBook E744: Intel Core i5-4200M, 14.00", 1.8 kg
Recensioni esterne » Fujitsu LifeBook E744
Toshiba Portege R30-A-17H: Intel Core i3-4100M, 13.30", 1.5 kg
Recensioni esterne » Toshiba Portege R30-A-17H
Asus ASUSPRO Advanced B451JA-WO076G: Intel Core i5-4210M, 14.00", 2.2 kg
Recensioni esterne » Asus ASUSPRO Advanced B451JA-WO076G
Toshiba Portege R30-A-17R: Intel Core i5-4210M, 13.30", 1.5 kg
Recensioni esterne » Toshiba Portege R30-A-17R
Fujitsu LifeBook T734: Intel Core i5-4200M, 12.50", 2 kg
Recensioni esterne » Fujitsu LifeBook T734
MSI CR70 2M: Intel Core i3-4100M, 17.30", 2.7 kg
Recensioni esterne » MSI CR70 2M
Medion Akoya E6241-MD98562: Intel Core i3-4100M, 15.60", 2.4 kg
Recensioni esterne » Medion Akoya E6241-MD98562
Lenovo ThinkPad L540-20AU002QGE: Intel Core i5-4330M, 15.60", 2.5 kg
Recensioni esterne » Lenovo ThinkPad L540-20AU002QGE
Fujitsu Lifebook E544: Intel Core i5-4210M, 14.00", 2.1 kg
Recensioni esterne » Fujitsu Lifebook E544
Fujitsu LifeBook A544: Intel Core i5-4200M, 15.60", 2.2 kg
Recensioni esterne » Fujitsu LifeBook A544
Fujitsu LifeBook E554: Intel Core i5-4210M, 15.60", 2.3 kg
Recensioni esterne » Fujitsu LifeBook E554
Asus K750JA: Intel Core i7-4700HQ, 17.30", 3.1 kg
Recensioni esterne » Asus K750JA
HP ProBook 640-F1Q08ES: Intel Core i7-4702MQ, 14.00", 2 kg
Recensioni esterne » HP ProBook 640-F1Q08ES
Toshiba Portege R30-A-15C: Intel Core i7-4600M, 13.30", 1.4 kg
Recensioni esterne » Toshiba Portege R30-A-15C
Samsung 940X5J-K01US: Intel Core i5-4200U, 15.60", 1.8 kg
Recensioni esterne » Samsung 940X5J-K01US
Toshiba Portege R30-A-13C: Intel Core i5-4200M, 13.30", 1.5 kg
Recensioni esterne » Toshiba Portege R30-A-13C
Lenovo G510-59416358: Intel Core i5-4200M, 15.60", 2.5 kg
Recensioni esterne » Lenovo G510
Lenovo G410-59410763: Intel Core i3-4000M, 14.00", 2.2 kg
Recensioni esterne » Lenovo G410-59410763
Toshiba Satellite Pro C50-A-1KV: Intel Core i5-4200M, 15.60", 2.3 kg
Recensioni esterne » Toshiba Satellite Pro C50-A-1KV
Toshiba Portege R30-A1302: Intel Core i7-4600M, 13.30", 1.5 kg
Recensioni esterne » Toshiba Portege R30-A1302
Toshiba Satellite P50-A-13C: Intel Core i7-4700MQ, 15.60", 1.7 kg
Recensioni esterne » Toshiba Satellite P50-A-13C
Toshiba Portege R30-A-14K: Intel Core i3-4000M, 13.30", 1.5 kg
Recensioni esterne » Toshiba Portege R30-A-14K
Lenovo ThinkPad Edge E540 20C60041: Intel Core i3-4000M, 15.60", 2.5 kg
Recensioni esterne » Lenovo ThinkPad Edge E540 20C60041
HP ProBook 450 G1: Intel Core i5-4200M, 15.60", 2.3 kg
Recensioni esterne » HP ProBook 450 G1
MSI CR61-i5U45FHDW7: Intel Core i5-4200M, 15.60", 2.5 kg
Recensioni esterne » MSI CR61-i5U45FHDW7
HP Spectre 13t-3000: Intel Core i5-4200U, 13.30", 1.4 kg
Recensioni esterne » HP Spectre 13t-3000
Toshiba Satellite C75-A-13P: Intel Core i5-4200M, 17.30", 2.7 kg
Recensioni esterne » Toshiba Satellite C75-A-13P
HP Split 13-m115sg x2: Intel Core i5-4200U, 13.30", 2.3 kg
Recensioni esterne » HP Split 13-m115sg x2
Toshiba Satellite P75-A7200: Intel Core i7-4700MQ, 17.30", 2.9 kg
Recensioni esterne » Toshiba Satellite P75-A7200
MSI CX61-20D-011UK: Intel Core i7-4702MQ, 15.60", 2.4 kg
Recensioni esterne » MSI CX61-20D-011UK
Lenovo ThinkPad L540 20AV005GGE: Intel Core i5-4300M, 15.60", 2.5 kg
» Il supporto di Windows 10 terminerà nel 2025: Provi i sistemi operativi alternativi senza installarli


