Notebookcheck Logo

Nvidia GeForce RTX 5080 Laptop

NVIDIA GeForce RTX 5080 Laptop

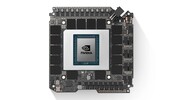
Nvidia GeForce RTX 5080 Laptop è una scheda grafica per notebook di fascia alta, presentata al CES 2025 e in vendita da aprile 2025.

Architettura

GeForce RTX 5080 Mobile utilizza il chip Blackwell GB203 e impiega 8.192 dei 10.752 core del chip. Rispetto ai chip desktop di nome simile, è quindi più vicino alla RTX 5070 desktop (6.144 core) che alla RTX 5080 desktop di nome simile (10.752 core). Il bus di memoria è tuttavia come quello della RTX 5080 desktop, un bus a 256 bit per 16 GB GDDR7.

Come novità, Blackwell offre il supporto per la Generazione Multi-Frame (MFG) con DLSS4, grazie alla quinta generazione di core Tensor.

Prestazioni

Le prestazioni teoriche medie della RTX 5080 per laptop sono simili a quelle della RTX 5070 per desktop e della vecchia GPU RTX 4090 per laptop (Time Spy GPU). Nei giochi (ad esempio Doom: The dark ages), le prestazioni sono alla pari con la vecchia GPU RTX 4090 Laptop, anche se la RTX 5080 supporta la già citata opzione MFG per ottenere frame rate impressionanti. La latenza è comunque la stessa, quindi si dovrebbe partire da almeno 60 fps senza generazione di fotogrammi.

Consumo di energia

Il GB203 è prodotto presso TSMC utilizzando il processo 4N FinFET (personalizzato 4NP 5nm). Il TGP massimo della scheda può raggiungere i 150 watt (125 watt + 25 watt Dynamic Boost).

GeForce RTX 5000 Laptop GPU Serie

GeForce RTX 5090 Laptop 10496 @ 0.99 - 1.52 GHz256 Bit @ 28000 MHz
GeForce RTX 5080 Laptop 8192 @ 0.98 - 2.29 GHz256 Bit @ 28000 MHz
GeForce RTX 5070 Ti Laptop 5888 192 Bit @ 32000 MHz
GeForce RTX 5070 Laptop 4608 @ 2.24 - 2.52 GHz128 Bit @ 32000 MHz
GeForce RTX 5060 Laptop 3328 @ 0.95 - 1.46 GHz128 Bit @ 24000 MHz
GeForce RTX 5050 Laptop 2560 @ 1.02 - 2.66 GHz128 Bit @ 14000 MHz
Nome in codiceGN22-X9
ArchitetturaBlackwell
Pipelines8192 - unified
TMUs256
ROPs96
Raytracing Cores64
Tensor / AI Cores256
Velocità del core975 - 2287 (Boost) MHz
CacheL1: 8 MB, L2: 64 MB
Velocità della memoria28000 effective = 1750 MHz
Larghezza del bus di memoria256 Bit
Tipo di memoriaGDDR7
Max. quantità di memoria16 GB
Memoria condivisano
Memory Bandwidth896 GB/s
APIDirectX 12_2, OpenGL 4.6, OpenCL 3.0, Vulkan 1.4
Consumo di corrente150 Watt (80 - 150 Watt TGP)
tecnologia5 nm
PCIe5
Displays4 Displays (max.), HDMI 2.1b, DisplayPort 2.1b
Dimensione del portatilegrande
Data dell'annuncio02.01.2025
PredecessorNVIDIA GeForce RTX 4080 Laptop GPU

Benchmark

Performance Rating - 3DMark 11 + Fire Strike + Time Spy
18 pt (54%)
Restrict / Search: Model: Max. age: years
3DMark - 3DMark Time Spy Score
min: 15055     media: 19289     media: 19736 (53%)     massimo: 21992 Points
3DMark - 3DMark Time Spy Graphics
min: 16644     media: 20756     media: 21242 (43%)     massimo: 23003 Points
Restrict / Search: Model: Max. age: years
3DMark - 3DMark Cloud Gate Score
min: 61468     media: 66671     media: 65589 (62%)     massimo: 72956 Points
3DMark - 3DMark Cloud Gate Graphics
min: 125367     media: 132070     media: 129942 (32%)     massimo: 140900 Points
3DMark - 3DMark Fire Strike Standard Score
min: 30780     media: 37027     media: 36403.5 (55%)     massimo: 45940 Points
3DMark - 3DMark Fire Strike Standard Graphics
min: 40859     media: 47871     media: 48129 (44%)     massimo: 56116 Points
3DMark - 3DMark Ice Storm Graphics
378821 Points (42%)
3DMark - 3DMark Wild Life Extreme Unlimited
min: 31990     media: 38962     media: 40742 (47%)     massimo: 44155 Points
3DMark 11 - 3DM11 Performance Score
min: 39151     media: 47100     media: 47539 (58%)     massimo: 51993 Points
3DMark 11 - 3DM11 Performance GPU
min: 54868     media: 64819     media: 65874 (50%)     massimo: 71866 Points
171.8 -100%
...
43219 -33%
43332 -33%
Nvidia GeForce RTX 5070 Laptop
43400 -33%
46877 -28%
51979 -20%
54921 -15%
56791 -12%
56866 -12%
59943 -8%
Nvidia GeForce RTX 5080 Laptop
64819
65041 0%
67885 5%
...
59943 -8%
max:
NVIDIA GeForce RTX 5090
129772 100%
0%
100%
Restrict / Search: Model: Max. age: years
3DMark Vantage
3DM Vant. Perf. total +
3DMark Vantage - 3DM Vant. Perf. total
134668 Points (39%)
3DM Vant. Perf. GPU no PhysX +
3DMark Vantage - 3DM Vant. Perf. GPU no PhysX
151016 Points (82%)
Restrict / Search: Model: Max. age: years
3DMark 06 3DMark 06 - Standard 1280x1024 +
3DMark 06
69181 Points (90%)
Unigine Valley 1.0 - Unigine Valley 1.0 DX
250.9 fps (76%)
Blender - Blender 3.3 Classroom CUDA *
min: 18     media: 23.1     media: 20 (3%)     massimo: 49 Seconds
Blender - Blender 3.3 Classroom OPTIX *
min: 11.6     media: 14.7     media: 13 (5%)     massimo: 26 Seconds
Cinebench R10 Cinebench R10 Shading (32bit) +
Cinebench R10 - Cinebench R10 Shading (32bit)
24952 punti (18%)
Cinebench R11.5 Cinebench R11.5 OpenGL 64 Bit +
Cinebench R11.5 - Cinebench R11.5 OpenGL 64 Bit
227.9 fps (75%)
Cinebench R15
Cinebench R15 OpenGL 64 Bit +
Cinebench R15 - Cinebench R15 OpenGL 64 Bit
min: 248     media: 294     media: 291.5 (17%)     massimo: 346 fps
Cinebench R15 OpenGL Ref. Match 64 Bit +
Cinebench R15 - Cinebench R15 OpenGL Ref. Match 64 Bit
99.6 % (100%)
GFXBench - GFXBench 5.0 4K Aztec Ruins High Tier Offscreen
min: 233.5     media: 234     media: 234 (88%)     massimo: 234.4 fps
GFXBench - GFXBench 5.0 Aztec Ruins High Tier Offscreen
min: 502.8     media: 505     media: 504.8 (91%)     massimo: 506.8 fps
Restrict / Search: Model: Max. age: years
GFXBench - GFXBench 5.0 Aztec Ruins Normal Tier Offscreen
min: 1074     media: 1086     media: 1085.8 (80%)     massimo: 1097.6 fps
GFXBench - GFXBench Car Chase Offscreen
min: 997     media: 1005     media: 1005.3 (95%)     massimo: 1013.6 fps
GFXBench 3.1 - GFXBench Manhattan ES 3.1 Offscreen
min: 1108     media: 1129     media: 1129.2 (24%)     massimo: 1150.3 fps
GFXBench 3.0 - GFXBench 3.0 Manhattan Offscreen
min: 1062     media: 1087     media: 1087.4 (45%)     massimo: 1112.8 fps
GFXBench (DX / GLBenchmark) 2.7
GFXBench T-Rex HD Offscreen C24Z16 +
GFXBench (DX / GLBenchmark) 2.7 - GFXBench T-Rex HD Offscreen C24Z16
min: 4018     media: 4077     media: 4077.5 (32%)     massimo: 4136.9 fps
Basemark GPU 1.2 - Basemark GPU 1.2 Vulkan Official Medium Offscreen 1080
min: 104.6     media: 1121     media: 1131.5 (28%)     massimo: 2141 fps
Basemark GPU 1.2 - Basemark GPU 1.2 Vulkan Official High Offscreen 2160
3.6 fps (1%)
Geekbench 6.4 - Geekbench 6.4 GPU OpenCL
min: 159452     media: 192241     media: 194861 (51%)     massimo: 208371 punti
Geekbench 6.4 - Geekbench 6.4 GPU Vulkan
min: 18501     media: 107191     media: 140128 (35%)     massimo: 181551 punti
LuxMark v2.0 64Bit - LuxMark v2.0 Room GPU
9029 Samples/s (32%)
LuxMark v2.0 64Bit - LuxMark v2.0 Sala GPU
19188 Samples/s (34%)
ComputeMark v2.1 - ComputeMark v2.1 Result
49349 punti (41%)
Power Consumption - Furmark Stress Test Power Consumption - external Monitor *
min: 145.3     media: 213.1     media: 232 (31%)     massimo: 253 Watt
0153045607590105120135150165180195210225240255Tooltip
Power Consumption - The Witcher 3 Power Consumption - external Monitor *
281 Watt (39%)
0153045607590105120135150165180195210225240255270285Tooltip
Power Consumption - Power Efficiency - Witcher 3 ultra external Monitor
0.7 fps per Watt (60%)
Power Consumption - Cyberpunk 2077 Power Consumption 150cd *
min: 157.4     media: 258.3     media: 256 (75%)     massimo: 318 Watt
020406080100120140160180200220240260280300320Tooltip
Power Consumption - Cyberpunk 2077 Power Consumption - external Monitor *
min: 155.5     media: 258.5     media: 270 (34%)     massimo: 319 Watt
020406080100120140160180200220240260280300320Tooltip
Power Consumption - Power Efficiency - Cyberpunk 2077 ultra
min: 0.4412     media: 0.5     media: 0.5 (2%)     massimo: 0.664 fps per Watt
- Valori di benchmark per questa scheda grafica
red legend - Valori medi di benchmark per questa scheda grafica
* Numeri più piccoli rappresentano prestazioni supeiori

Benchmarks per i giochi

I seguenti benchmarks deirivano dai benchmarks dei portatili recensiti. Le prestazioni dipendono dalla scheda grafica utilizzata, dal clock rate, dal processore, dai settaggi di sistema, dai drivers, e dai sistemi operativi. Quindi i risultati non sono rappresentativi per i portatili con questa GPU. Per informazioni dettagliate sui risultati del benchmark, cliccate sul numero di fps.

F1 25

F1 25

2025
basso 1920x1080
177.7  fps    + Confronta
medio 1920x1080
176.1  fps    + Confronta
alto 1920x1080
169.9  fps    + Confronta
ultra 1920x1080
44.3  fps    + Confronta
QHD 2560x1440
27.3  fps    + Confronta
4K 3840x2160
12.8  fps    + Confronta
4K DLSS 3840x2160
24.8  fps    + Confronta
QHD DLSS 2560x1440
48.7  fps    + Confronta
» Giocabile con tutti i portatili testati con dettagli ultra.
Additional Benchmarks
Ultra High Preset 16xAF TAA 1920x1080
89.4
basso 1920x1080
117.1  fps    + Confronta
medio 1920x1080
102.5 113 ~ 108 fps    + Confronta
alto 1920x1080
95.6 104 ~ 100 fps    + Confronta
ultra 1920x1080
88 94.8 101 ~ 95 fps    + Confronta
QHD 2560x1440
64 65 72 ~ 67 fps    + Confronta
4K 3840x2160
36.6  fps    + Confronta
4K DLSS 3840x2160
55  fps    + Confronta
QHD DLSS 2560x1440
85 89.1 97 ~ 90 fps    + Confronta
» Giocabile con tutti i portatili testati con dettagli ultra.
medio 1920x1080
106.3  fps    + Confronta + 📈 Graph
alto 1920x1080
94.1  fps    + Confronta + 📈 Graph
ultra 1920x1080
50.6  fps    + Confronta + 📈 Graph
QHD 2560x1440
36.6  fps    + Confronta + 📈 Graph
QHD DLSS 2560x1440
53.2  fps    + Confronta + 📈 Graph
» Giocabile con tutti i portatili testati con dettagli ultra.
basso 1920x1080
91 110 111 115 ~ 107 fps    + Confronta
medio 1920x1080
81 95 104 104 ~ 96 fps    + Confronta
alto 1920x1080
68 88 90 91 ~ 84 fps    + Confronta
ultra 1920x1080
48 58 58 63 64 65 69 ~ 61 fps    + Confronta
QHD 2560x1440
41 46 50 50 55 55 55 ~ 50 fps    + Confronta
4K 3840x2160
32 34 38 39 40 ~ 37 fps    + Confronta
4K DLSS 3840x2160
44 48 52 54 55 ~ 51 fps    + Confronta
QHD DLSS 2560x1440
54 60 65 66 117 ~ 72 fps    + Confronta
» Giocabile con tutti i portatili testati con dettagli ultra.
Additional Benchmarks
Ultra High + GI + DLSS Quality + FG 2560x1440
87
82
94
Ultra High + GI + DLSS Quality + FG 3840x2160
67
61
73
medio 1920x1080
173.4  fps    + Confronta + 📈 Graph
alto 1920x1080
165.5  fps    + Confronta + 📈 Graph
QHD 2560x1440
158  fps    + Confronta + 📈 Graph
» Giocabile con tutti i portatili testati con dettagli alto.
basso 1920x1080
102.5 110.1 127.6 ~ 113 fps    + Confronta
medio 1920x1080
97.2 104.4 111 ~ 104 fps    + Confronta
ultra 1920x1080
65.7 82.5 83.1 90 90 ~ 82 fps    + Confronta
QHD 2560x1440
58.9 67.7 69.8 70.6 73.2 ~ 68 fps    + Confronta
4K 3840x2160
38.6 42.7 42.9 45.2 47.6 ~ 43 fps    + Confronta
4K DLSS 3840x2160
50.9 57.9 59.3 60 61.8 ~ 58 fps    + Confronta
QHD DLSS 2560x1440
64.9 80.1 80.8 87.7 ~ 78 fps    + Confronta
» Giocabile con tutti i portatili testati con dettagli ultra.
medio 1920x1080
173.8  fps    + Confronta + 📈 Graph
alto 1920x1080
145.6  fps    + Confronta + 📈 Graph
ultra 1920x1080
101.6  fps    + Confronta + 📈 Graph
QHD 2560x1440
74.5  fps    + Confronta + 📈 Graph
QHD DLSS 2560x1440
98.9  fps    + Confronta + 📈 Graph
» Giocabile con tutti i portatili testati con dettagli ultra.
basso 1920x1080
142.4 186.4 187.9 189.3 ~ 177 fps    + Confronta + 📈 Graph
alto 1920x1080
109 141.8 145.8 145.9 ~ 136 fps    + Confronta + 📈 Graph
ultra 1920x1080
95.7 110.7 124.2 127.2 127.2 129.2 ~ 119 fps    + Confronta + 📈 Graph
QHD 2560x1440
72.4 85.1 87.8 99.3 99.5 100.1 102.4 ~ 92 fps    + Confronta + 📈 Graph
4K 3840x2160
53.8 55.2 57.2 61.8 62.5 63.2 ~ 59 fps    + Confronta + 📈 Graph
QHD DLSS 2560x1440
86.8 101.2 117.1 118.1 120.1 ~ 109 fps    + Confronta
» Giocabile con tutti i portatili testati con dettagli ultra.
Additional Benchmarks
Very Ultra Preset + Full Path Tracing + Quality DLSS + Frame Generation 2560x1440
150
73.4
77.1
64.2
67.1
Very Ultra Preset + Full Path Tracing + Quality DLSS + Frame Generation 3840x2160
28.4
22.5
Stalker 2

Stalker 2

2024
medio 1920x1080
90.7  fps    + Confronta + 📈 Graph
alto 1920x1080
78.1  fps    + Confronta + 📈 Graph
ultra 1920x1080
72.6  fps    + Confronta + 📈 Graph
QHD 2560x1440
58.5  fps    + Confronta + 📈 Graph
QHD DLSS 2560x1440
122.1  fps    + Confronta + 📈 Graph
» Giocabile con tutti i portatili testati con dettagli ultra.
basso 1920x1080
155 210 ~ 183 fps    + Confronta
medio 1920x1080
143 190 ~ 167 fps    + Confronta
alto 1920x1080
106 150 ~ 128 fps    + Confronta
ultra 1920x1080
99 138 ~ 119 fps    + Confronta
QHD 2560x1440
73 109 ~ 91 fps    + Confronta
4K 3840x2160
4K DLSS 3840x2160
QHD DLSS 2560x1440
98 117 ~ 108 fps    + Confronta
» Giocabile con tutti i portatili testati con dettagli ultra.
medio 1920x1080
92.9  fps    + Confronta + 📈 Graph
alto 1920x1080
91  fps    + Confronta + 📈 Graph
ultra 1920x1080
81.6  fps    + Confronta + 📈 Graph
QHD 2560x1440
59  fps    + Confronta + 📈 Graph
QHD DLSS 2560x1440
74.4  fps    + Confronta + 📈 Graph
» Giocabile con tutti i portatili testati con dettagli ultra.
medio 1920x1080
90  fps    + Confronta + 📈 Graph
alto 1920x1080
89.7  fps    + Confronta + 📈 Graph
ultra 1920x1080
88.7  fps    + Confronta + 📈 Graph
QHD 2560x1440
86.2  fps    + Confronta + 📈 Graph
QHD DLSS 2560x1440
86.9  fps    + Confronta + 📈 Graph
» Giocabile con tutti i portatili testati con dettagli ultra.
medio 1920x1080 cinem.
79.8  fps    + Confronta + 📈 Graph
alto 1920x1080 cinem.
72.7  fps    + Confronta + 📈 Graph
ultra 1920x1080 cinem.
67.8  fps    + Confronta + 📈 Graph
QHD 2560x1440 cinem.
51.4  fps    + Confronta + 📈 Graph
QHD DLSS 2560x1440 cinem.
64.8  fps    + Confronta + 📈 Graph
» Giocabile con tutti i portatili testati con dettagli ultra.
basso 1920x1080
171  fps    + Confronta
medio 1920x1080
124 128 ~ 126 fps    + Confronta
alto 1920x1080
96 99 ~ 98 fps    + Confronta
ultra 1920x1080
50 56 57 58 ~ 55 fps    + Confronta
QHD 2560x1440
41 43 43 44 ~ 43 fps    + Confronta
4K 3840x2160
23 24 26 26 ~ 25 fps    + Confronta
4K DLSS 3840x2160
39 42 45 45 ~ 43 fps    + Confronta
QHD DLSS 2560x1440
54 62 64 ~ 60 fps    + Confronta
» Giocabile con tutti i portatili testati con dettagli ultra.
Additional Benchmarks
low TSR 100 1280x720
0
cinematic RT: Very High DLSS 68 FG 3840x2160
43
37
40
cinematic RT: Very High DLSS 68 FG 2560x1440
74
64
72
F1 24

F1 24

2024
basso 1920x1080
396  fps    + Confronta
medio 1920x1080
349 399 ~ 374 fps    + Confronta
alto 1920x1080
225 277 318 354 ~ 294 fps    + Confronta
ultra 1920x1080
103.6 110.3 127.5 132.5 134.8 137.7 ~ 124 fps    + Confronta
QHD 2560x1440
66.8 77 79.3 84.5 84.7 91.4 ~ 81 fps    + Confronta
4K 3840x2160
38.8 39.4 41.9 46.1 ~ 42 fps    + Confronta
4K DLSS 3840x2160
65.9 68.2 71.8 76.7 ~ 71 fps    + Confronta
QHD DLSS 2560x1440
109.1 126.9 129.1 134.2 139.1 ~ 128 fps    + Confronta
» Giocabile con tutti i portatili testati con dettagli ultra.
medio 1920x1080
99.3  fps    + Confronta + 📈 Graph
alto 1920x1080
76  fps    + Confronta + 📈 Graph
QHD 2560x1440
55.1  fps    + Confronta + 📈 Graph
QHD DLSS 2560x1440
81  fps    + Confronta + 📈 Graph
» Giocabile con tutti i portatili testati con dettagli alto.
medio 1920x1080
110.7  fps    + Confronta + 📈 Graph
alto 1920x1080
105.7  fps    + Confronta + 📈 Graph
ultra 1920x1080
97.5  fps    + Confronta + 📈 Graph
QHD 2560x1440
76.7  fps    + Confronta + 📈 Graph
QHD DLSS 2560x1440
96.1  fps    + Confronta + 📈 Graph
» Giocabile con tutti i portatili testati con dettagli ultra.
medio 1920x1080
148.2  fps    + Confronta + 📈 Graph
alto 1920x1080
117.7  fps    + Confronta + 📈 Graph
ultra 1920x1080
115.5  fps    + Confronta + 📈 Graph
QHD 2560x1440
90.7  fps    + Confronta + 📈 Graph
QHD DLSS 2560x1440
110.6  fps    + Confronta + 📈 Graph
» Giocabile con tutti i portatili testati con dettagli ultra.
alto 1920x1080
84.8  fps    + Confronta + 📈 Graph
QHD 2560x1440
82.3  fps    + Confronta + 📈 Graph
» Giocabile con tutti i portatili testati con dettagli alto.
medio 1920x1080
135.9  fps    + Confronta + 📈 Graph
alto 1920x1080
134.5  fps    + Confronta + 📈 Graph
ultra 1920x1080
131.9  fps    + Confronta + 📈 Graph
QHD 2560x1440
127.8  fps    + Confronta + 📈 Graph
» Giocabile con tutti i portatili testati con dettagli ultra.
medio 1920x1080
356  fps    + Confronta + 📈 Graph
alto 1920x1080
356  fps    + Confronta + 📈 Graph
ultra 1920x1080
356  fps    + Confronta + 📈 Graph
QHD 2560x1440
356  fps    + Confronta + 📈 Graph
» Giocabile con tutti i portatili testati con dettagli ultra.
basso 1920x1080
92.2 130.6 134.7 135.6 ~ 123 fps    + Confronta + 📈 Graph
medio 1920x1080
89.7 125.7 125.9 131.9 ~ 118 fps    + Confronta + 📈 Graph
alto 1920x1080
83.8 99.1 112.6 113.5 115.7 116.4 124.2 ~ 109 fps    + Confronta + 📈 Graph
QHD 2560x1440
60.3 67.2 74.3 76.5 78.3 80.2 83.8 ~ 74 fps    + Confronta + 📈 Graph
4K 3840x2160
35.4 39.7 40.7 42.3 43.1 ~ 40 fps    + Confronta + 📈 Graph
4K DLSS 3840x2160
57.8 59.9 63.1 ~ 60 fps    + Confronta + 📈 Graph
» Giocabile con tutti i portatili testati con dettagli alto.
Additional Benchmarks
High Preset + High Ray Tracing 1920x1080
64.5
53.7
56.7
High Preset + High Ray Tracing 3840x2160
20
16.9
18.5
High Preset + Ultra Ray Tracing 3840x2160
18
18.5
16
17.3
High Preset + Ultra Ray Tracing + Quality DLSS 3840x2160
34.6
34.9
29.5
32.6
High Preset + Ultra Ray Tracing + Quality DLSS + FG 2x 3840x2160
61.7
62.8
53
58.3
High Preset + Ultra Ray Tracing + Quality DLSS + FG 4x 3840x2160
109.6
112.8
91.1
105.8
medio 1920x1080
345  fps    + Confronta + 📈 Graph
alto 1920x1080
290  fps    + Confronta + 📈 Graph
ultra 1920x1080
255  fps    + Confronta + 📈 Graph
QHD 2560x1440
205  fps    + Confronta + 📈 Graph
» Giocabile con tutti i portatili testati con dettagli ultra.
basso 1920x1080
125.1 171.8 176.3 187.9 198.4 211 225 ~ 185 fps    + Confronta
medio 1920x1080
122.3 157.8 160.2 170.3 180.5 192 192.9 197.1 ~ 172 fps    + Confronta
alto 1920x1080
111.8 118.4 143.9 148.1 150.4 160.9 167.2 167.9 172.5 ~ 149 fps    + Confronta
ultra 1920x1080
109.8 109.9 135.1 136.6 139.6 139.8 144.3 149.9 151.9 156.2 ~ 137 fps    + Confronta
QHD 2560x1440
79.6 85.9 90 94.6 95.1 96.4 99.5 99.7 99.8 102.4 104 ~ 95 fps    + Confronta
4K 3840x2160
39.1 40.9 42 42.7 46.3 46.5 47.1 47.5 ~ 44 fps    + Confronta
4K DLSS 3840x2160
59.3 59.6 62.2 69.2 71.5 72.3 73.4 ~ 67 fps    + Confronta
4K FSR 3840x2160
34.4 43 ~ 39 fps    + Confronta
QHD DLSS 2560x1440
89 94 103.8 103.9 110.6 111 115.6 117.9 119 ~ 107 fps    + Confronta
» Giocabile con tutti i portatili testati con dettagli ultra.
Additional Benchmarks
Low Preset (FSR off) 1280x720
240
Ray Tracing Ultra Preset (DLSS off) 1920x1080
73.4
60.7
68.2
71.1
65.3
Ultra Preset (FSR2 on) 1920x1080
169.7
173.1
Ray Tracing Ultra Preset (DLSS off, no Path Tracing) 3840x2160
22.4
21.4
18.6
21.8
22.1
18.4
19.7
30min Start Ultra Preset (FSR off) 1920x1080
141.2
140.9
128.4
103.2
133.4
100.7
144.6
129.1
141.1
123.2
Ray Tracing Overdrive Preset (no DLSS, no FG) 3840x2160
12
12
10.3
11.4
Ray Tracing Overdrive Preset + DLSS 4 Transformer Quality (no FG) 3840x2160
24.8
25.3
21.6
24.7
24.5
Ray Tracing Overdrive Preset + DLSS 4 Transformer Quality + Frame Generation (M)FG 2x 3840x2160
45.1
41.7
39.6
44.8
44.6
Ray Tracing Overdrive Preset + DLSS 4 Transformer Quality + Frame Generation MFG 4x 3840x2160
83.4
84.4
69.8
81.7
81.9
basso 1920x1080
172.8 203 232 244 244.8 260 276.1 ~ 233 fps    + Confronta + 📈 Graph
medio 1920x1080
159.8 160 195.5 202 206 209.1 220.6 250.5 ~ 200 fps    + Confronta + 📈 Graph
alto 1920x1080
141 144.9 171.9 181.6 182.4 185.4 194.5 220.1 ~ 178 fps    + Confronta + 📈 Graph
ultra 1920x1080
144 163.3 166.3 169.3 178 179.6 180.3 191.9 202.6 211.5 ~ 179 fps    + Confronta + 📈 Graph
QHD 2560x1440
106.9 118.3 120.7 123 130.5 132.8 133.1 136.7 154.4 155.8 ~ 131 fps    + Confronta + 📈 Graph
4K 3840x2160
55.7 69.8 70.6 74.3 79.8 81.1 ~ 72 fps    + Confronta + 📈 Graph
4K DLSS 3840x2160
30.6 83.2 105.6 114.4 114.6 129.6 132.4 ~ 101 fps    + Confronta + 📈 Graph
QHD DLSS 2560x1440
167.3 181 207.5 ~ 185 fps    + Confronta
» Giocabile con tutti i portatili testati con dettagli ultra.
Additional Benchmarks
Low Preset SMAA 1280x720
278
Strange Brigade

Strange Brigade

2018
basso 1280x720
408 549 553 600 613 ~ 545 fps    + Confronta
medio 1920x1080
352 406 429 434 456 495 ~ 429 fps    + Confronta
alto 1920x1080
323 386 393 403 406 451 481 ~ 406 fps    + Confronta
ultra 1920x1080
299 314 356 367 371 371 397 412 434 ~ 369 fps    + Confronta
QHD 2560x1440
235 261 265 278 281 283 296 303 304 ~ 278 fps    + Confronta
4K 3840x2160
144 148.9 150 156.1 159 169.7 ~ 155 fps    + Confronta
» Giocabile con tutti i portatili testati con dettagli ultra.
basso 1280x720
107 118.9 135.7 143 145.8 156.6 158 158.5 163.7 182.7 ~ 147 fps    + Confronta
medio 1920x1080
98.4 104.3 127.5 131.1 132.2 135.5 136.3 138.2 139.5 153.7 ~ 130 fps    + Confronta
alto 1920x1080
76.9 84.2 105.1 108.8 108.9 110.6 111.9 113.9 123.7 124.5 ~ 107 fps    + Confronta
4K 3840x2160
69.6 86.6 90.8 98.7 100.7 101.8 124.1 ~ 96 fps    + Confronta
» Giocabile con tutti i portatili testati con dettagli alto.
basso 1280x720
194.4 231 233 233 233 234 ~ 226 fps    + Confronta
medio 1920x1080
175.6 207 218 220 229 232 232 ~ 216 fps    + Confronta
alto 1920x1080
146 152.3 176.3 183.7 189.6 189.6 189.9 191.7 194.8 210 ~ 182 fps    + Confronta
QHD 2560x1440
111.2 118.8 131.3 144.5 149.4 151.2 152.1 153 158.8 173.1 ~ 144 fps    + Confronta
4K 3840x2160
68.6 76.7 87 88.9 96.5 101.3 ~ 87 fps    + Confronta
» Giocabile con tutti i portatili testati con dettagli alto.
basso 1280x720
164.2 171.5 201 211 220 224 228 240 265 327 ~ 225 fps    + Confronta
medio 1366x768
141.9 155.7 177.5 186.4 188.9 193.1 201 216 229 304 ~ 199 fps    + Confronta
alto 1920x1080
139.7 145.8 173.2 175.1 180.4 185.9 191.6 203 212 271 ~ 188 fps    + Confronta
ultra 1920x1080
128.5 134.2 158.3 160.4 162.3 171.7 175.5 188.9 194.7 239 ~ 171 fps    + Confronta
4K 3840x2160
119 152.9 155.9 167.9 180.2 182.1 199.2 ~ 165 fps    + Confronta
» Giocabile con tutti i portatili testati con dettagli ultra.
ultra 1920x1080
» Giocabile con tutti i portatili testati con dettagli ultra.
GTA V

GTA V

2015
basso 1024x768
185.9 186.5 190.2 ~ 188 fps    + Confronta
medio 1366x768
184.1 184.6 185.4 189.5 ~ 186 fps    + Confronta
alto 1920x1080
170.6 181.3 181.5 186.5 189 ~ 182 fps    + Confronta
ultra 1920x1080
124.8 139.5 146.1 158.7 164.1 168.2 185 ~ 155 fps    + Confronta
QHD 2560x1440
120.6 137.4 143.9 151.7 156.2 163.3 177.8 ~ 150 fps    + Confronta
4K 3840x2160
173.3 182.8 ~ 178 fps    + Confronta
» Giocabile con tutti i portatili testati con dettagli ultra.
Additional Benchmarks
Highest Settings possible 16xAF 4xMSAA + FXAA 3840x2160
102.2
92.5
96.7
Normal/Off 4xAF 1920x1080
189.7
183.4
184.3
Lowest Settings possible 1920x1080
186.2
187
bassomedioaltoultraQHD4K
F1 25177.7176.1169.944.327.312.8
Doom: The Dark Ages117.1108100956736.6
The Elder Scrolls IV Oblivion Remastered106.394.150.636.6
Assassin's Creed Shadows1079684615037
Civilization 7173.4165.5158
Monster Hunter Wilds113104826843
Kingdom Come Deliverance 2173.8145.6101.674.5
Indiana Jones and the Great Circle1771361199259
Stalker 290.778.172.658.5
Call of Duty Black Ops 61831671281199172
Until Dawn92.99181.659
Space Marine 29089.788.786.2
Star Wars Outlaws79.872.767.851.4
Black Myth: Wukong17112698554325
F1 243963742941248142
Senua's Saga Hellblade 299.37655.1
Ghost of Tsushima110.7105.797.576.7
Horizon Forbidden West148.2117.7115.590.7
Dragon's Dogma 284.882.3
Helldivers 2135.9134.5131.9127.8
Prince of Persia The Lost Crown356356356356
Alan Wake 21231181097440
Counter-Strike 2345290255205
Cyberpunk 2077 2.2 Phantom Liberty1851721491379544
Baldur's Gate 323320017817913172
Strange Brigade545429406369278155
X-Plane 11.1114713010796
Final Fantasy XV Benchmark22621618214487
Dota 2 Reborn225199188171165
The Witcher 3203
GTA V188186182155150178
bassomedioaltoultraQHD4K
< 30 fps
< 60 fps
< 120 fps
≥ 120 fps


3
13


11
17


14
15

3
12
10
1
7
12
8
2
7
4
3

Per conoscere altri giochi che potrebbero essere utilizzabili e per una lista completa di tutti i giochi e delle schede grafiche visitate la nostra Gaming List

v1.33
log 29. 21:45:08

#0 ran 0s before starting gpusingle class +0s ... 0s

#1 no ids found in url (should be separated by "_") +0s ... 0s

#2 not redirecting to Ajax server +0s ... 0s

#3 did not recreate cache, as it is less than 5 days old! Created at Mon, 28 Jul 2025 05:39:32 +0200 +0.001s ... 0.001s

#4 no comparison url found in template nbc.compare_page_1 needed +0.035s ... 0.036s

#5 no comparison url found in template nbc.compare_page_1 needed +0s ... 0.036s

#6 no comparison url found in template nbc.compare_page_1 needed +0s ... 0.036s

#7 no comparison url found in template nbc.compare_page_1 needed +0s ... 0.037s

#8 no comparison url found in template nbc.compare_page_1 needed +0s ... 0.037s

#9 composed specs +0.001s ... 0.038s

#10 did output specs +0s ... 0.038s

#11 start showIntegratedCPUs +0s ... 0.038s

#12 getting avg benchmarks for device 12927 +0.028s ... 0.067s

#13 got single benchmarks 12927 +0.058s ... 0.125s

#14 got avg benchmarks for devices +0s ... 0.125s

#15 min, max, avg, median took s +1.499s ... 1.624s

#16 before gaming benchmark output +0s ... 1.625s

#17 Got 693 rows for game benchmarks. +0.383s ... 2.008s

#18 composed SQL query for gamebenchmarks +0s ... 2.008s

#19 got data and put it in $dataArray +0.186s ... 2.194s

#20 benchmarks composed for output. +1.153s ... 3.347s

#21 no comparison url found in template nbc.compare_page_1 needed +0.004s ... 3.351s

#22 return log +0s ... 3.351s

Recensioni Notebook con Nvidia GeForce RTX 5080 Laptop la scheda grafica

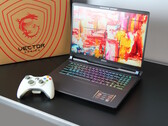
Recensione del portatile gaming MSI Vector 17 HX AI: L'ultimo Blackwell Mohican da 17"

Recensione del portatile gaming MSI Vector 17 HX AI: L'ultimo Blackwell Mohican da 17"

Dopo MSI Vector 16, testiamo anche il nuovo Vector 17 con RTX 5080, uno degli ultimi laptop da 17 pollici con una GPU Blackwell, poiché i modelli da 16 e 18 pol...
Intel Core Ultra 9 275HX | Nvidia GeForce RTX 5080 Laptop | 17.00" | 3 kg
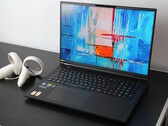
Recensione dell'Acer Predator Helios 18 AI: Finalmente un portatile gaming più silenzioso, ma a quale costo?

Recensione dell'Acer Predator Helios 18 AI: Finalmente un portatile gaming più silenzioso, ma a quale costo?

Con il suo Core Ultra 9 275HX e il laptop RTX 5080, il sostituto del desktop da gioco da 18 pollici rientra effettivamente nella categoria dei giochi di fascia ...
Intel Core Ultra 9 275HX | Nvidia GeForce RTX 5080 Laptop | 18.00" | 3.5 kg
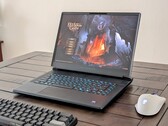
Recensione del notebook Alienware 16 Area-51: Il miglior portatile gaming di punta di Dell

Recensione del notebook Alienware 16 Area-51: Il miglior portatile gaming di punta di Dell

Quest'anno Dell sta rinnovando da zero la sua linea Alienware con nuove CPU Arrow Lake, nuove GPU Blackwell e un nuovo linguaggio di design AW30. L'Area-51 ha u...
Intel Core Ultra 9 275HX | Nvidia GeForce RTX 5080 Laptop | 16.00" | 3.3 kg
Recensione del portatile MSI Raider A18 HX A9W: AMD porta il fuoco con la Ryzen 9 9955HX3D

Recensione del portatile MSI Raider A18 HX A9W: AMD porta il fuoco con la Ryzen 9 9955HX3D

Prestazioni o mobilità? Nel caso di MSI Raider A18 HX, si tratta chiaramente di prestazioni! Con AMD Ryzen 9 9955HX3D e Nvidia GeForce RTX 5080, questo gigantes...
AMD Ryzen 9 9955HX3D | Nvidia GeForce RTX 5080 Laptop | 18.00" | 3.6 kg
Recensione del portatile Razer Blade 16 RTX 5080: Quasi la stesa velocità, ma molto più economico

Recensione del portatile Razer Blade 16 RTX 5080: Quasi la stesa velocità, ma molto più economico

Tutti preferiamo avere la configurazione RTX 5090 di GeForce, ovviamente, ma quando l'opzione RTX 5080 costa 1.000 dollari in meno, la SKU più lenta diventa imp...
AMD Ryzen AI 9 365 | Nvidia GeForce RTX 5080 Laptop | 16.00" | 2.1 kg

Medion Erazer Beast 18 X1 MD62731: Intel Core Ultra 9 275HX, 18.00", 3.6 kg
  recensione » Recensione del computer portatile Medion Erazer Beast 18 X1: Come si comporta la RTX 5080 nel gigante del gaming?

Asus ROG Zephyrus G14 2025 GA403WW: AMD Ryzen AI 9 HX 370, 14.00", 1.6 kg
  recensione » Recensione Asus ROG Zephyrus G14 2025: 14 pollici con GeForce RTX 5080

Asus ROG Strix G16 G615: Intel Core Ultra 9 275HX, 16.00", 2.6 kg
  recensione » Recensione dell'Asus ROG Strix G16 G615 - portatile RTX 5080 ottimale per il gaming in WQHD

Lenovo Legion Pro 7i 16 Gen 10: Intel Core Ultra 9 275HX, 16.00", 2.6 kg
  recensione » Recensione del computer portatile Lenovo Legion Pro 7i 16 Gen 10: alimentatore da 400 W quasi senza compromessi

SCHENKER XMG Neo 16 A25 5080 Engineering Sample: AMD Ryzen 9 9955HX
  recensione » Anteprima dell'XMG Neo 16 2025 - Il notebook gaming più veloce ora con AMD, RTX 5000 e Mini-LED a 300 Hz

  recensione » Analisi del computer portatile Nvidia GeForce RTX 5090 - Più veloce, ma c'è di più in arrivo

MSI Stealth 18 HX AI A2XWIG: Intel Core Ultra 9 275HX, 17.00", 2.9 kg
  Recensioni esterne » MSI Stealth 18 HX AI A2XWIG

Asus ROG Zephyrus G16 GU605CW: Intel Core Ultra 9 285H, 16.00", 2 kg
  Recensioni esterne » Asus ROG Zephyrus G16 GU605CW

Alienware 16 Area-51, RTX 5080: Intel Core Ultra 9 275HX, 16.00", 3.4 kg
  Recensioni esterne » Alienware 16 Area-51, RTX 5080

Asus ROG Strix G16 G615: Intel Core Ultra 9 275HX, 16.00", 2.6 kg
  Recensioni esterne » Asus ROG Strix G16 G615

Asus ROG Strix Scar 16 G635LW: Intel Core Ultra 9 275HX, 16.00", 2.8 kg
  Recensioni esterne » Asus ROG Strix Scar 16 G635LW

Lenovo Legion Pro 7i 16 Gen 10: Intel Core Ultra 9 275HX, 16.00", 2.6 kg
  Recensioni esterne » Lenovo Legion Pro 7i 16 Gen 10

MSI Vector A18 HX A9WIG: AMD Ryzen 9 9955HX, 18.00", 3.6 kg
  Recensioni esterne » MSI Vector A18 HX A9WIG

Asus ROG Strix Scar 18 G835LW: Intel Core Ultra 9 275HX, 18.00", 3.3 kg
  Recensioni esterne » Asus ROG Strix Scar 18 G835LW

MSI Vector 16 HX AI A2XWIG: Intel Core Ultra 9 275HX, 16.00", 2.7 kg
  Recensioni esterne » MSI Vector 16 HX AI A2XWIG

Aorus Master 16 AM6H, RTX 5080 (BYH): Intel Core Ultra 9 275HX, 16.00", 2.5 kg
  Recensioni esterne » Aorus Master 16 AM6H, RTX 5080 (BYH)

MSI Raider 18 HX AI A2XWIG: Intel Core Ultra 9 285HX, 18.00", 3.6 kg
  Recensioni esterne » MSI Raider 18 HX AI A2XWIG

Razer Blade 16 RTX 5080: AMD Ryzen AI 9 365, 16.00", 2.1 kg
  Recensioni esterne » Razer Blade 16 RTX 5080

Lenovo Legion Pro 7 16IAX10H : Intel Core Ultra 9 275HX, 16.00", 2.3 kg
  Recensioni esterne » Lenovo Legion Pro 7 16IAX10H

HP Omen Max 16-ah0000ng: Intel Core Ultra 9 275HX, 16.00", 2.7 kg
  Recensioni esterne » HP Omen Max 16-ah0000ng

Alienware 16 Area-51: Intel Core Ultra 9 275HX, 16.00", 3.3 kg
   » Le dimensioni contano ancora: Alienware 16 Area-51 RTX 5080 può superare Razer Blade 16 RTX 5090

   » Alienware 16 Area-51 blocca la sua modalità grafica TGP da 175 W, la più veloce, dietro l'impostazione della ventola più rumorosa

MSI Raider A18 HX A9WIG-080: AMD Ryzen 9 9955HX3D, 18.00", 3.6 kg
   » Laptop da 18 pollici: Questa categoria non dovrebbe essere riservata solo ai computer portatili da gioco, come MSI Raider A18

Asus ROG Zephyrus G14 2025 GA403WW: AMD Ryzen AI 9 HX 370, 14.00", 1.6 kg
   » Asus ROG Zephyrus G14: il gamer da 14 pollici più veloce, ma l'assenza di 5090 è un'opportunità mancata

Asus ROG Strix G16 G615: Intel Core Ultra 9 275HX, 16.00", 2.6 kg
   » Il verdetto della recensione di Asus ROG Strix G16 2025: Buon portatile da gioco con RTX 5080, ma il più veloce Ryzen 9 9955HX è disponibile solo con RTX 5070 Ti

Please share our article, every link counts!
Mail Logo

Classe 1

Classe 2

GeForce RTX 2080 Super Mobile
RTX PRO 2000 Blackwell Generation Laptop *
M1 Max 32-Core GPU *
GeForce RTX 2070 Super Mobile
M1 Max 24-Core GPU *
Radeon RX 8050S *
Radeon RX 5700M *
M1 Pro 16-Core GPU *
Radeon PRO W6600M *
GeForce RTX 2070 Super Max-Q
M1 Pro 14-Core GPU *
RTX PRO 1000 Blackwell Generation Laptop *
Quadro P4200
RTX PRO 500 Blackwell Generation Laptop *
Radeon RX 8040S *
Arc 140T *
Quadro P5000 Max-Q *
Arc 130T *
GeForce RTX 3050 4GB Laptop GPU

Classe 3

Quadro P4000 Max-Q
Radeon RX 580X (Laptop) *
Radeon RX 580 (Laptop)
Radeon Pro 5300M
Radeon RX 5300M
Quadro P3000 Max-Q *
Radeon Pro WX 7100 *
Radeon RX 570X (Laptop) *
Radeon RX 570 (Laptop) *
Radeon RX 470 (Laptop) *
GeForce GTX 1050 Ti Mobile
Radeon 680M
Quadro P2000 Max-Q
Radeon R9 M395X
GeForce GTX 1050 Ti Max-Q *
WX Vega M GL
Radeon R9 M485X
GeForce GTX 1050 Max-Q *
Radeon 660M
Radeon RX 560X (Laptop)
Radeon RX 560 (Laptop)
Radeon Pro 560X
Radeon Pro 560
Radeon Pro 460
Radeon Pro WX 4130 *
Quadro P620 *
Radeon RX 550X (Laptop)
Radeon Pro 555X
Radeon Pro 555
Radeon Pro 455
Quadro P600
Arc Graphics 3-core (Arrow Lake) *
Radeon RX 540X *
Radeon Pro WX 2100 *
Radeon Pro WX 3100 *
Arc Graphics 2-core (Arrow Lake) *
Radeon Pro 450
Radeon 630
Radeon 540X *
Quadro P520
Quadro P500 *
Iris Plus Graphics G7 (Ice Lake 64 EU) *
Vega 10 *
Iris Pro Graphics 580
Vega 9
FirePro W5130M
UHD Graphics Xe G4 48EUs *
UHD Graphics 32EUs
UHD Graphics Xe 32EUs (Tiger Lake-H) *
UHD Graphics 750
UHD Graphics 730
Vega 7
Radeon R7 M465
Vega 8
Iris Plus Graphics G4 (Ice Lake 48 EU)
Quadro M600M
FirePro W4190M
Radeon R7 M445
UHD Graphics 24EUs (Alder Lake-N) *
Radeon R7 M340
Radeon 610M *
UHD Graphics G1 (Ice Lake 32 EU)
UHD Graphics Xe 16EUs (Tiger Lake-H) *
Radeon R5 (Bristol Ridge)
Adreno 690 *
Adreno 685 *
Adreno 680 *

Classe 4

Posizione approssimativa dell'adattatore grafico

Klaus Hinum, 2025-07-29 (Update: 2025-07-29)