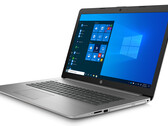
Recensione dell'HP 470 G7: Desktop Replacement da 17.3"
Intel Core i7-10510U | AMD Radeon 530 | 17.30" | 2.4 kg
La Radeon 530 è una scheda grafica dedicata entry-level per portatili lanciata nel 2017. Stando ad AMD, ci sono molte diverse versioni con 384 o 320 unità shader e memoria grafica 64-bit DDR3 o GDDR5. Tuttavia, non si basano sui recenti chips RX series Polaris, ma probabilmente usano la stessa architettura delle Radeon R7 M445 / M440 / M340 / M260 / 8650M / 8590M (384 unità shader, 28 nm GCN) e M430 / M330 / M230 (320 unità shader, 28 nm Sun GCN). AMD dichiara che la velocità clock della Radeon 530 raggiunge 1,024 MHz.
Considerando quanto abbiamo appena detto, le prestazioni di gioco della Radeon 530 dovrebbero attestarsi tra la Radeon R7 M440 (320 unità shader, DDR3), una Radeon R7 M460 (384 unità shader, DDR3) e una Radeon R7 M445 (320 unità shader, GDDR5) (guardate queste pagine per i gaming benchmarks dettagliati). I giochi con grafica intensiva come Dishonored 2, Call of Duty: Infinite Warfare o XCOM 2 non dovrebbero risultare fluidi con questa GPU. I giochi meno pesanti come Overwatch, Fifa 17 (con una CPU veloce), o Farming Simulator 17, gireranno bene, ma con dettagli medi o bassi. Per benchmarks dettagliati sui giochi, guardate le pagine delle schede precedentemente linkate. Stando alle specifiche, la versione DDR3 potrebbe essere più lenta rispetto alla Radeon 520, che ha 320 shaders e GDDR5.
Radeon 500 Serie
| |||||||
| Architettura | GCN | ||||||
| Pipelines | 384 - unified | ||||||
| Velocità del core | 1024 MHz | ||||||
| Velocità della memoria | 2250 MHz | ||||||
| Larghezza del bus di memoria | 64 Bit | ||||||
| Tipo di memoria | DDR3, GDDR5 | ||||||
| Max. quantità di memoria | 2048 MB | ||||||
| Memoria condivisa | no | ||||||
| API | DirectX 12, Shader 5.0, OpenGL 4.5 | ||||||
| tecnologia | 28 nm | ||||||
| Caratteristiche | DirectX 12, Mantle, OpenGL, OpenCL 1.2, Vulkan | ||||||
| Data dell'annuncio | 21.03.2017 | ||||||
| Link alla pagina del produttore | www.amd.com | ||||||
I seguenti benchmarks deirivano dai benchmarks dei portatili recensiti. Le prestazioni dipendono dalla scheda grafica utilizzata, dal clock rate, dal processore, dai settaggi di sistema, dai drivers, e dai sistemi operativi. Quindi i risultati non sono rappresentativi per i portatili con questa GPU. Per informazioni dettagliate sui risultati del benchmark, cliccate sul numero di fps.


Per conoscere altri giochi che potrebbero essere utilizzabili e per una lista completa di tutti i giochi e delle schede grafiche visitate la nostra Gaming List


HP 15-bw082nd: AMD A10-9620P, 15.60", 1.9 kg
Recensioni esterne » HP 15-bw082nd
HP 470 G7, i5-10210U, Radeon 530: Intel Core i5-10210U, 17.30", 2.4 kg
Recensioni esterne » HP 470 G7, i5-10210U, Radeon 530
Dell Inspiron 13 5370-MRFG2: Intel Core i7-8550U, 13.30", 1.4 kg
Recensioni esterne » Dell Inspiron 13 5370-MRFG2
HP 15-db0024ns: AMD A9-9425, 15.60", 1.8 kg
Recensioni esterne » HP 15-db0024ns
Dell Inspiron 15 3576-9HRPY: Intel Core i5-8250U, 15.60", 2.3 kg
Recensioni esterne » Dell Inspiron 15 3576-9HRPY
HP Pavilion x360 15-cr0004tx: Intel Core i7-8565U, 15.60", 2 kg
Recensioni esterne » HP Pavilion x360 15-cr0004tx
Lenovo Ideapad 330-15IKB-81DE014NIN: Intel Core i5-8250U, 15.60", 2.2 kg
Recensioni esterne » Lenovo Ideapad 330-15IKB-81DE014NIN
Dell Vostro 14 5471-5MPNF: Intel Core i7-8550U, 14.00", 1.7 kg
Recensioni esterne » Dell Vostro 14 5471-5MPNF
Dell Inspiron 15 5570-37HG8: Intel Core i7-8550U, 15.60", 2.3 kg
Recensioni esterne » Dell Inspiron 15 5570-37HG8
Dell Vostro 14 5471-48619955SLV: Intel Core i5-8250U, 14.00", 1.7 kg
Recensioni esterne » Dell Vostro 14 5471-48619955SLV
HP 17-by0016ng: Intel Core i5-8250U, 17.30", 2.5 kg
Recensioni esterne » HP 17-by0016ng
HP 15-bs116ns: Intel Core i7-8550U, 15.60", 2.1 kg
Recensioni esterne » HP 15-bs116ns
Lenovo V330-15IKB-81AX00AQCK: Intel Core i5-8250U, 15.60", 2 kg
Recensioni esterne » Lenovo V330-15IKB-81AX00AQCK
Dell Inspiron 15 5570-0302: Intel Core i5-8250U, 15.60", 2.1 kg
Recensioni esterne » Dell Inspiron 15 5570-0302
Dell Inspiron 17 5770-0364: Intel Core i7-8550U, 17.30", 2.7 kg
Recensioni esterne » Dell Inspiron 17 5770-0364
HP 17-BS100NS: Intel Core i5-8250U, 17.30", 2.6 kg
Recensioni esterne » HP 17-BS100NS
Dell Inspiron 15 5570-5441: Intel Core i7-8550U, 15.60", 2.3 kg
Recensioni esterne » Dell Inspiron 15 5570-5441
HP 17-bs191nd: Intel Core i5-8250U, 17.30", 2.5 kg
Recensioni esterne » HP 17-bs191nd
HP 15-bs044ns: Intel Core i7-7500U, 15.60", 2.1 kg
Recensioni esterne » HP 15-bs044ns
Posizione approssimativa dell'adattatore grafico
I nostri Top 10
» Top 10 Portatili Multimedia
» Top 10 Portatili Gaming
» Top 10 Portatili Gaming Leggeri
» Top 10 Portatili da Ufficio e Business economici
» Top 10 Portatili Premium da Ufficio/Business
» Top 10 Portatili sotto i 300 Euro
» Top 10 Portatili sotto i 500 Euro
» Top 10 dei Portatili Workstation
» Top 10 Subnotebooks
» Top 10 Ultrabooks
» Top 10 Convertibili
» Top 10 Tablets
» Top 10 Tablets Windows
» Top 10 Smartphones