AMD Radeon R5 M430
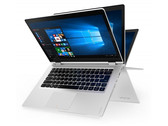
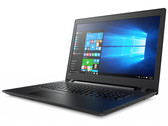
L'AMD Radeon R5 M430 è una scheda grafica entry level per portatili. E' stata annunciata nel Lenovo Yoga 510 (modello da 14") ad inizio 2016. Tecnicamente è simile alla vecchia Radeon R5 M330 / M335 o alla R7 M340 ma con un core clock inferiore da appena 955 MHz (nell'IdeaPad 110). Ha 320 unified shaders e un bus di memoria 64 Bit DDR3 con clock da appena 873 MHz.
Le prestazioni gaming sono simili alla Radeon r5 M330 e di conseguenza si colloca nel segmento entry level. Solo i giochi leggeri come Overwatch o Farming Simulator 2017 possono essere fluidi con settaggi bassi. Guardate la lista di tutti i giochi testati per ulteriori benchmarks.
La Radeon R5 M430 si basa ancora sulla vecchia architettura GCN 1.0 (non verificato) e supporta DirectX 12 (11_1 secondo GPU-Z).
Produttore | AMD |
Radeon R5 M400 Serie | Radeon R5 M430 | 320 @ 0.96 GHz | 64 Bit @ 1746 MHz | Radeon R5 M420 | 320 @ 0.78 GHz | 64 Bit @ 2000 MHz |
|
Nome in codice | Mars |
Architettura | GCN |
Pipelines | 320 - unified |
Velocità del core | 955 MHz |
Velocità della memoria | 1746 MHz |
Larghezza del bus di memoria | 64 Bit |
Tipo di memoria | DDR3 |
Memoria condivisa | no |
DirectX | DirectX 12 (11_1) |
tecnologia | 28 nm |
Caratteristiche | OpenCL, DirectCompute 5.0 |
Data dell'annuncio | 01.05.2016 |
Link alla pagina del produttore | http://www.amd.com/en-us/products/graphi... |
Benchmark
Performance Rating - 3DMark 11 + Fire Strike + Time Spy
4.7 pt (5%)
...
AMD Radeon R5 (Carrizo) 7%
...
AMD Radeon RX 6800 XT 1919%
3DMark - 3DMark Cloud Gate Score
4744 Points (6%)
...
Intel UHD Graphics 615 -3%
AMD Radeon HD 6450 GDDR5 -3%
Intel UHD Graphics 617 2%
...
AMD Radeon RX 6800 XT 1411%
3DMark - 3DMark Cloud Gate Graphics
min: 5249 media: 5493 media: 5493 (3%) massimo: 5737 Points
...
AMD Radeon R7 M260 2%
AMD Radeon R5 (Carrizo) 6%
...
3DMark - 3DMark Fire Strike Standard Score
899 Points (2%)
...
Intel UHD Graphics 617 -1%
Intel HD Graphics 630 -1%
AMD Radeon R5 (Carrizo) 0%
NVIDIA GeForce GT 710 4%
AMD Radeon R7 M260 6%
...
AMD Radeon RX 6900 XT 4244%
3DMark - 3DMark Fire Strike Standard Graphics
min: 989 media: 1004 media: 1004 (2%) massimo: 1019 Points
...
NVIDIA GeForce GT 710 -6%
Intel HD Graphics 630 -4%
Intel UHD Graphics 617 -1%
AMD Radeon R5 (Carrizo) 0%
AMD Radeon R7 M260 7%
AMD FirePro W2100 8%
...
AMD Radeon RX 6900 XT 4939%
3DMark - 3DMark Ice Storm Graphics
42396 Points (6%)
...
AMD Radeon R7 M260 -6%
NVIDIA GeForce GTX 1050 Max-Q 3%
AMD Radeon R7 M340 4%
Intel UHD Graphics 615 5%
...
AMD Radeon RX 6800 XT 970%
3DMark 11 - 3DM11 Performance Score
min: 1772 media: 1822 media: 1821.5 (4%) massimo: 1871 Points
...
AMD Radeon R5 (Bristol Ridge) 0%
...
AMD Radeon RX 6900 XT 2228%
3DMark 11 - 3DM11 Performance GPU
min: 1643 media: 1689 media: 1689 (3%) massimo: 1735 Points
...
Intel HD Graphics 630 0%
Intel UHD Graphics 630 1%
AMD Radeon R5 (Bristol Ridge) 1%
AMD Radeon R5 (Carrizo) 1%
...
AMD Radeon RX 6900 XT 3400%
3DMark Vantage
3DM Vant. Perf. total +3DMark Vantage - 3DM Vant. Perf. total
4697 Points (5%)
...
ATI Mobility Radeon HD 5830 2%
...
AMD Radeon RX 6800 XT 1955%
3DM Vant. Perf. GPU no PhysX +3DMark Vantage - 3DM Vant. Perf. GPU no PhysX
3995 Points (4%)
...
AMD Radeon HD 6730M -6%
...
3DMark 06 3DMark 06 - Standard 1280x1024 +6246 Points (12%)
...
ATI Mobility Radeon HD 5165 -2%
AMD Radeon HD 6450 GDDR5 -1%
AMD Radeon HD 6720G2 -1%
ATI Mobility Radeon HD 560v 0%
NVIDIA Quadro NVS 5100M 1%
...
AMD Radeon RX 6800 XT 655%
Unigine Heaven 2.1 - Heaven 2.1 high
15.9 fps (3%)
...
AMD Radeon HD 6750M -4%
AMD Radeon R6 M340DX -4%
ATI Radeon HD 5570 -1%
...
Cinebench R10 Cinebench R10 Shading (32bit) +Cinebench R10 - Cinebench R10 Shading (32bit)
min: 6225 media: 7430 media: 7430 (35%) massimo: 8635 punti
Intel Graphics Media Accelerator (GMA) 500 -100%
...
AMD Radeon HD 6730M -2%
AMD Radeon 540X 2%
...
AMD Radeon RX 5700 XT (Desktop) 185%
Cinebench R11.5 Cinebench R11.5 OpenGL 64 Bit +Cinebench R11.5 - Cinebench R11.5 OpenGL 64 Bit
25.8 fps (11%)
...
AMD Radeon HD 6550D 3%
AMD Radeon R7 M340 4%
...
AMD Radeon RX 6800 XT 559%
Cinebench R15
Cinebench R15 OpenGL 64 Bit +Cinebench R15 - Cinebench R15 OpenGL 64 Bit
min: 27.7 media: 29.9 media: 29.9 (8%) massimo: 32 fps
...
AMD Radeon R5 (Bristol Ridge) 0%
...
AMD Radeon RX 6800 XT 796%
Cinebench R15 OpenGL Ref. Match 64 Bit +Cinebench R15 - Cinebench R15 OpenGL Ref. Match 64 Bit
98 % (98%)
...
Intel UHD Graphics 615 0%
Intel Iris Pro Graphics 580 0%
Intel Iris Plus Graphics G7 (Ice Lake 64 EU) 0%
Intel Iris Plus Graphics G4 (Ice Lake 48 EU) 0%
Intel Iris Plus Graphics 640 0%
Intel UHD Graphics 617 1%
...
GFXBench (DX / GLBenchmark) 2.7
GLBench 2.7 T-Rex HD Offscreen C24Z16 +GFXBench (DX / GLBenchmark) 2.7 - GLBench 2.7 T-Rex HD Offscreen C24Z16
77 fps (1%)
...
AMD Radeon R6 M340DX -6%
Qualcomm Adreno 619L -5%
Apple A9 / PowerVR GT7600 4%
ARM Mali-G76 MP4 4%
ARM Mali-T880 MP12 6%
...
GLBench 2.7 T-Rex HD Onscreen C24Z16 +GFXBench (DX / GLBenchmark) 2.7 - GLBench 2.7 T-Rex HD Onscreen C24Z16
29.7 fps (1%)
...
ARM Mali-G71 MP2 -12%
ARM Mali-T880 MP2 -6%
ARM Mali-T760 MP6 -2%
Qualcomm Adreno 508 -2%
...
GFXBench 3.0 - GFXBench 3.0 Manhattan Offscreen
23.5 fps (3%)
...
Qualcomm Adreno 612 -13%
ARM Mali-G72 MP3 -12%
Intel HD Graphics (Broadwell) -9%
Qualcomm Adreno 512 -6%
PowerVR GM9446 15%
...
AMD Radeon RX 5700 XT (Desktop) 3794%
GFXBench 3.0 - GFXBench 3.0 Manhattan
18.7 fps (5%)
...
PowerVR GE8320 -16%
ARM Mali-G51 MP4 -5%
AMD Radeon R6 M340DX -5%
Qualcomm Adreno 612 2%
PowerVR GM9446 7%
ARM Mali-G72 MP3 9%
AMD Radeon R2 (Stoney Ridge) 10%
Qualcomm Adreno 512 13%
Intel Iris Plus Graphics G7 (Ice Lake 64 EU) 17%
AMD Radeon R4 (Stoney Ridge) 20%
...
LuxMark v2.0 64Bit - LuxMark v2.0 Room GPU
340 Samples/s (3%)
...
Intel Iris Plus Graphics 640 -4%
NVIDIA GeForce GTX 680M -4%
Intel Iris Plus Graphics G4 (Ice Lake 48 EU) -2%
Intel Iris Plus Graphics 650 -1%
AMD Radeon 540X 1%
AMD Radeon RX Vega 8 (Ryzen 2000/3000) 1%
NVIDIA Quadro P500 1%
Intel UHD Graphics G1 (Ice Lake 32 EU) 2%
AMD FirePro W5130M 5%
Intel Iris Pro Graphics 580 6%
...
LuxMark v2.0 64Bit - LuxMark v2.0 Sala GPU
699 Samples/s (2%)
...
AMD Radeon 540X -4%
Intel UHD Graphics 630 0%
Intel UHD Graphics G1 (Ice Lake 32 EU) 7%
...
AMD Radeon RX 6900 XT 4392%
ComputeMark v2.1 - ComputeMark v2.1 Result
1219 punti (3%)
...
AMD Radeon R5 (Bristol Ridge) -8%
NVIDIA GeForce 920MX -7%
Intel UHD Graphics G1 (Ice Lake 32 EU) 6%
AMD Radeon R7 M260 9%
...
- Valori di benchmark per questa scheda grafica

- Valori medi di benchmark per questa scheda grafica
* Numeri più piccoli rappresentano prestazioni supeiori
Benchmarks per i giochi
I seguenti benchmarks deirivano dai benchmarks dei portatili recensiti. Le prestazioni dipendono dalla scheda grafica utilizzata, dal clock rate, dal processore, dai settaggi di sistema, dai drivers, e dai sistemi operativi. Quindi i risultati non sono rappresentativi per i portatili con questa GPU. Per informazioni dettagliate sui risultati del benchmark, cliccate sul numero di fps.
Intel HD Graphics 630 9%
AMD Radeon RX Vega 8 (Ryzen 2000/3000) 87%
...
AMD Radeon RX Vega 8 (Ryzen 2000/3000) 74%
AMD Radeon R7 M445 93%
...
» Il Benchmark indica che il gioco non è utilizzabile con i settaggi testati.
Intel Iris Plus Graphics 650 9%
Intel HD Graphics 630 18%
AMD Radeon RX Vega 10 54%
AMD Radeon R7 M445 70%
NVIDIA GeForce 930MX 71%
...
NVIDIA GeForce GTX 1080 (Desktop) 777%
AMD Radeon R7 M445 71%
AMD Radeon RX Vega 10 78%
NVIDIA GeForce 930MX 81%
AMD Radeon RX Vega 8 (Ryzen 2000/3000) 89%
...
NVIDIA Titan RTX 992%
» Il Benchmark indica che il gioco non è utilizzabile con i settaggi testati.
Intel HD Graphics 630 16%
AMD Radeon R7 M445 30%
NVIDIA GeForce 930MX 36%
...
NVIDIA Titan X Pascal 504%
AMD Radeon R7 M445 33%
NVIDIA GeForce 930MX 41%
...
NVIDIA Titan X Pascal 591%
» Il Benchmark indica che il gioco non è utilizzabile con i settaggi testati.
...
AMD Radeon R5 (Bristol Ridge) -27%
Intel HD Graphics 630 15%
Intel Iris Plus Graphics 640 15%
NVIDIA GeForce 920MX 22%
...
NVIDIA Titan X Pascal 278%
...
AMD Radeon R5 (Bristol Ridge) -15%
Intel Iris Plus Graphics 640 15%
NVIDIA GeForce 920MX 23%
Intel HD Graphics 630 24%
...
NVIDIA Titan X Pascal 426%
» Giocabile con tutti i portatili testati con dettagli basso.
...
AMD Radeon R5 (Bristol Ridge) -9%
AMD Radeon R7 M445 -3%
...
...
AMD Radeon R5 (Bristol Ridge) -11%
AMD Radeon R7 M445 0%
AMD Radeon RX Vega 10 3%
...
AMD Radeon RX Vega 10 -14%
AMD Radeon R7 M445 -2%
...
NVIDIA GeForce GTX 1060 (Desktop) 1334%
» Giocabile con tutti i portatili testati con dettagli medio.
AMD Radeon R4 (Stoney Ridge) -65%
...
AMD Radeon R5 (Bristol Ridge) -30%
...
NVIDIA GeForce GTX 1080 (Desktop) 744%
...
AMD Radeon R5 (Bristol Ridge) -25%
Intel HD Graphics 630 22%
...
» Il Benchmark indica che il gioco non è utilizzabile con i settaggi testati.
...
AMD Radeon R7 M445 -8%
Intel HD Graphics 630 7%
NVIDIA GeForce GTX 1050 Ti Mobile 138%
...
NVIDIA GeForce GTX 1060 (Desktop) 551%
Intel HD Graphics 630 13%
AMD Radeon R7 M445 19%
...
AMD Radeon RX 480 (Desktop) 760%
» Giocabile con tutti i portatili testati con dettagli medio.
...
AMD Radeon R5 (Bristol Ridge) 3%
Intel HD Graphics 630 33%
...
» Il Benchmark indica che il gioco non è utilizzabile con i settaggi testati.
...
Intel HD Graphics 630 1%
NVIDIA GeForce 920MX 29%
...
...
AMD Radeon R5 (Bristol Ridge) -17%
Intel UHD Graphics 630 -16%
Intel HD Graphics 630 -2%
NVIDIA GeForce 920MX 26%
...
NVIDIA GeForce GTX 1080 (Desktop) 974%
» Il Benchmark indica che il gioco non è utilizzabile con i settaggi testati.
...
AMD Radeon R5 (Bristol Ridge) -21%
Intel Iris Plus Graphics G4 (Ice Lake 48 EU) -1%
AMD Radeon RX Vega 10 12%
...
NVIDIA Titan RTX 626%
...
AMD Radeon R5 (Bristol Ridge) -7%
Intel Iris Plus Graphics 640 23%
Intel Iris Plus Graphics G4 (Ice Lake 48 EU) 25%
Intel HD Graphics 630 28%
...
NVIDIA Titan RTX 858%
AMD Radeon R5 (Bristol Ridge) 10%
Intel HD Graphics 630 21%
...
NVIDIA Titan RTX 1969%
» Giocabile con tutti i portatili testati con dettagli basso.
AMD Radeon R4 (Stoney Ridge) -26%
AMD Radeon R5 (Bristol Ridge) -19%
Intel HD Graphics 630 11%
...
» Il Benchmark indica che il gioco non è utilizzabile con i settaggi testati.
...
AMD Radeon R5 (Bristol Ridge) -11%
NVIDIA GeForce 920MX 35%
...
AMD Radeon R5 (Bristol Ridge) -17%
NVIDIA GeForce 920MX 36%
...
NVIDIA GeForce GTX 1080 (Desktop) 679%
» Il Benchmark indica che il gioco non è utilizzabile con i settaggi testati.
...
...
...
...
AMD Radeon R5 (Bristol Ridge) -11%
AMD Radeon Pro WX 3100 22%
...
NVIDIA GeForce GTX 1080 (Desktop) 1467%
» Il Benchmark indica che il gioco non è utilizzabile con i settaggi testati.
...
AMD Radeon R5 (Bristol Ridge) 7%
AMD Radeon R6 M340DX 10%
...
» Il Benchmark indica che il gioco non è utilizzabile con i settaggi testati.
...
Intel UHD Graphics 617 -14%
AMD Radeon R5 (Carrizo) 1%
AMD Radeon R6 M340DX 3%
AMD Radeon R5 (Bristol Ridge) 10%
...
AMD Radeon RX 6800 XT 2230%
...
AMD Radeon R5 (Bristol Ridge) -3%
AMD Radeon R6 M340DX 3%
AMD Radeon R5 (Carrizo) 6%
...
» Il Benchmark indica che il gioco non è utilizzabile con i settaggi testati.
...
Intel HD Graphics 630 -15%
AMD Radeon R6 M340DX -6%
Intel UHD Graphics G1 (Ice Lake 32 EU) -3%
Intel UHD Graphics 630 10%
Intel Iris Plus Graphics 640 10%
...
...
AMD Radeon R5 (Bristol Ridge) -17%
Intel HD Graphics 630 -15%
AMD Radeon R6 M340DX -7%
Intel Iris Plus Graphics 640 5%
Intel UHD Graphics G1 (Ice Lake 32 EU) 8%
...
...
AMD Radeon R6 M340DX -6%
Intel HD Graphics 630 13%
Intel UHD Graphics G1 (Ice Lake 32 EU) 15%
...
» Giocabile con tutti i portatili testati con dettagli basso.
...
Intel HD Graphics 630 -2%
NVIDIA GeForce 920MX 25%
...
NVIDIA Titan X Pascal 601%
...
AMD Radeon R6 M340DX -18%
Intel HD Graphics 630 11%
NVIDIA GeForce 920MX 27%
...
NVIDIA GeForce GTX 1080 (Desktop) 746%
» Il Benchmark indica che il gioco non è utilizzabile con i settaggi testati.
Intel HD Graphics (Cherry Trail) -76%
...
AMD Radeon R6 M340DX -7%
Intel HD Graphics 630 -6%
NVIDIA GeForce 920MX 17%
Intel Iris Plus Graphics 640 23%
...
Intel HD Graphics (Cherry Trail) -78%
...
Intel HD Graphics 630 -12%
AMD Radeon R6 M340DX -8%
NVIDIA GeForce 920MX 15%
Intel Iris Plus Graphics 640 18%
...
NVIDIA GeForce GTX 1080 (Desktop) 801%
...
AMD Radeon R7 M340 -14%
AMD Radeon R6 M340DX -6%
NVIDIA GeForce 920MX 12%
Intel Iris Plus Graphics 640 28%
...
» Giocabile con tutti i portatili testati con dettagli basso.
...
AMD Radeon R6 M340DX 0%
Intel HD Graphics 630 12%
AMD Radeon R5 (Bristol Ridge) 14%
...
AMD Radeon R6 M340DX 0%
AMD Radeon R5 (Bristol Ridge) 19%
...
» Il Benchmark indica che il gioco non è utilizzabile con i settaggi testati.
Intel HD Graphics (Cherry Trail) -71%
...
AMD FirePro W2100 -17%
AMD Radeon R6 M340DX 10%
...
Intel HD Graphics (Cherry Trail) -72%
...
AMD Radeon R5 (Bristol Ridge) -22%
AMD FirePro W2100 6%
...
» Il Benchmark indica che il gioco non è utilizzabile con i settaggi testati.
...
AMD Radeon R5 (Bristol Ridge) -6%
AMD Radeon R6 M340DX 9%
...
NVIDIA GeForce GTX 1080 (Desktop) 439%
...
AMD Radeon HD 6450 GDDR5 -7%
AMD Radeon R5 (Bristol Ridge) -6%
AMD Radeon R6 M340DX 9%
Intel UHD Graphics 615 11%
...
NVIDIA GeForce GTX 1080 (Desktop) 524%
» Giocabile con tutti i portatili testati con dettagli basso.
...
AMD Radeon R2 (Stoney Ridge) -30%
AMD Radeon R4 (Stoney Ridge) -22%
...
Intel UHD Graphics 630 79%
...
AMD Radeon R4 (Stoney Ridge) -21%
AMD Radeon R2 (Stoney Ridge) -19%
...
» Il Benchmark indica che il gioco non è utilizzabile con i settaggi testati.
...
AMD Radeon RX Vega 8 (Ryzen 2000/3000) -5%
Intel UHD Graphics G1 (Ice Lake 32 EU) -4%
AMD Radeon 540X -4%
Intel Iris Plus Graphics G4 (Ice Lake 48 EU) -3%
Intel UHD Graphics Xe G4 48EUs -1%
Intel Iris Xe Graphics G7 80EUs 3%
Intel UHD Graphics 630 6%
Intel Iris Plus Graphics G7 (Ice Lake 64 EU) 8%
AMD Radeon RX 560X (Laptop) 8%
Intel Iris Plus Graphics 640 8%
Intel Iris Xe Graphics G7 96EUs 8%
...
AMD Radeon RX 6800 XT 199%
...
Intel Iris Plus Graphics G7 (Ice Lake 64 EU) -4%
Intel UHD Graphics 630 -2%
NVIDIA GeForce GT 710 -2%
AMD Radeon RX Vega 10 0%
Intel Iris Xe Graphics G7 80EUs 2%
Intel Iris Plus Graphics 640 17%
...
AMD Radeon RX 6800 XT 236%
...
AMD Radeon R5 (Bristol Ridge) -14%
Intel Iris Plus Graphics G4 (Ice Lake 48 EU) -14%
NVIDIA GeForce GT 710 -5%
Intel UHD Graphics 630 -3%
AMD Radeon R7 M340 2%
Intel UHD Graphics G1 (Ice Lake 32 EU) 4%
Intel UHD Graphics Xe G4 48EUs 7%
...
AMD Radeon RX 6800 XT 706%
...
AMD Radeon R5 (Bristol Ridge) -13%
Intel UHD Graphics 630 -8%
Intel Iris Plus Graphics G4 (Ice Lake 48 EU) -8%
AMD Radeon R7 M340 -6%
NVIDIA GeForce GT 710 -5%
Intel UHD Graphics G1 (Ice Lake 32 EU) 4%
Intel UHD Graphics Xe G4 48EUs 5%
Intel Iris Plus Graphics 640 12%
Intel HD Graphics 630 16%
...
AMD Radeon VII 670%
» Giocabile con tutti i portatili testati con dettagli medio.
...
NVIDIA GeForce GT 710 -12%
Intel UHD Graphics 630 -10%
Intel HD Graphics 630 -6%
AMD FirePro W2100 -6%
AMD Radeon R6 M340DX -2%
AMD Radeon R7 M260 2%
AMD Radeon R7 M340 4%
Intel Iris Plus Graphics 640 7%
...
AMD Radeon RX 6800 XT 3211%
» Il Benchmark indica che il gioco non è utilizzabile con i settaggi testati.
...
AMD Radeon R7 M340 11%
...
...
Intel UHD Graphics 630 10%
...
NVIDIA GeForce GTX 1060 (Desktop) 537%
...
Intel UHD Graphics 630 -4%
Intel HD Graphics 630 1%
...
» Giocabile con tutti i portatili testati con dettagli basso.
...
Intel Iris Plus Graphics G7 (Ice Lake 64 EU) 5%
AMD Radeon R5 (Bristol Ridge) 6%
Intel UHD Graphics G1 (Ice Lake 32 EU) 11%
Intel Iris Plus Graphics G4 (Ice Lake 48 EU) 24%
Intel UHD Graphics 630 25%
...
AMD Radeon RX 6800 XT 417%
...
Intel Iris Plus Graphics 640 -5%
Intel HD Graphics 630 12%
Intel UHD Graphics 630 13%
Intel UHD Graphics G1 (Ice Lake 32 EU) 14%
AMD Radeon R5 (Bristol Ridge) 15%
...
AMD Radeon RX 6800 XT 507%
» Giocabile con tutti i portatili testati con dettagli basso.
AMD Radeon R2 (Stoney Ridge) -85%
...
AMD Radeon R6 M340DX 4%
AMD Radeon R7 M260 8%
...
AMD Radeon R2 (Stoney Ridge) -84%
...