Recensione breve del Portatile Lenovo Ideapad 110-17IKB 80VK0001GE
| SD Card Reader | |
| average JPG Copy Test (av. of 3 runs) | |
| Acer Aspire E5-774-54HJ | |
| Lenovo Ideapad 110-17IKB 80VK0001GE | |
| Lenovo G70-35 80Q5000BGE | |
| Lenovo IdeaPad V110-17IKB 80V20006GE | |
| Lenovo IdeaPad 300-17ISK 80QH001EGE | |
| maximum AS SSD Seq Read Test (1GB) | |
| Acer Aspire E5-774-54HJ | |
| Lenovo G70-35 80Q5000BGE | |
| Lenovo IdeaPad V110-17IKB 80V20006GE | |
| Lenovo Ideapad 110-17IKB 80VK0001GE | |
| Lenovo IdeaPad 300-17ISK 80QH001EGE | |
| Networking | |
| iperf Server (receive) TCP 1 m | |
| Acer Aspire E5-774-54HJ (jseb) | |
| iperf Client (transmit) TCP 1 m | |
| Acer Aspire E5-774-54HJ (jseb) | |
| iperf3 receive AX12 | |
| Lenovo Ideapad 110-17IKB 80VK0001GE | |
| Lenovo IdeaPad V110-17IKB 80V20006GE | |
| iperf3 transmit AX12 | |
| Lenovo Ideapad 110-17IKB 80VK0001GE | |
| Lenovo IdeaPad V110-17IKB 80V20006GE | |
| |||||||||||||||||||||||||
Distribuzione della luminosità: 83 %
Al centro con la batteria: 231 cd/m²
Contrasto: 624:1 (Nero: 0.37 cd/m²)
ΔE ColorChecker Calman: 9.83 | ∀{0.5-29.43 Ø4.71}
ΔE Greyscale Calman: 12.46 | ∀{0.09-98 Ø4.96}
73% sRGB (Argyll 1.6.3 3D)
48% AdobeRGB 1998 (Argyll 1.6.3 3D)
52.6% AdobeRGB 1998 (Argyll 3D)
73.4% sRGB (Argyll 3D)
51.1% Display P3 (Argyll 3D)
Gamma: 2.43
CCT: 13115 K
| Lenovo Ideapad 110-17IKB 80VK0001GE TN LED, 1600x900, 17.3" | Acer Aspire E5-774-54HJ TN LED, 1920x1080, 17.3" | Lenovo IdeaPad 300-17ISK 80QH001EGE TN LED, 1600x900, 17.3" | Lenovo G70-35 80Q5000BGE TN LED, 1600x900, 17.3" | HP Pavilion 17-g013ng IPS, 1920x1080, 17.3" | Lenovo IdeaPad V110-17IKB 80V20006GE TN LED, 1600x900, 17.3" | |
|---|---|---|---|---|---|---|
| Display | 31% | 3% | 10% | 31% | 8% | |
| Display P3 Coverage (%) | 51.1 | 71.3 40% | 52.4 3% | 55.9 9% | 66.5 30% | 56.6 11% |
| sRGB Coverage (%) | 73.4 | 91.7 25% | 76.1 4% | 81.7 11% | 97.1 32% | 77.2 5% |
| AdobeRGB 1998 Coverage (%) | 52.6 | 67.1 28% | 54.2 3% | 57.8 10% | 68.4 30% | 56.5 7% |
| Response Times | 6% | 4% | 2% | -1% | ||
| Response Time Grey 50% / Grey 80% * (ms) | 50 ? | 42 ? 16% | 42 ? 16% | 41 ? 18% | 44 ? 12% | |
| Response Time Black / White * (ms) | 22 ? | 23 ? -5% | 24 ? -9% | 25 ? -14% | 25 ? -14% | |
| PWM Frequency (Hz) | 50 ? | 1000 ? | 200 ? | 50 ? | ||
| Screen | 29% | -5% | 5% | 39% | -18% | |
| Brightness middle (cd/m²) | 231 | 353 53% | 205 -11% | 225 -3% | 321 39% | 213 -8% |
| Brightness (cd/m²) | 210 | 320 52% | 182 -13% | 220 5% | 308 47% | 203 -3% |
| Brightness Distribution (%) | 83 | 82 -1% | 77 -7% | 83 0% | 89 7% | 86 4% |
| Black Level * (cd/m²) | 0.37 | 0.38 -3% | 0.43 -16% | 0.35 5% | 0.32 14% | 0.67 -81% |
| Contrast (:1) | 624 | 929 49% | 477 -24% | 643 3% | 1003 61% | 318 -49% |
| Colorchecker dE 2000 * | 9.83 | 5.07 48% | 9.75 1% | 10.14 -3% | 3.79 61% | 12.3 -25% |
| Colorchecker dE 2000 max. * | 18.35 | 10.12 45% | 16.02 13% | 15.12 18% | 21.48 -17% | |
| Greyscale dE 2000 * | 12.46 | 13.38 -7% | 12.09 3% | 12.12 3% | 4.75 62% | 14.13 -13% |
| Gamma | 2.43 91% | 2.69 82% | 2.62 84% | 2.78 79% | 2.37 93% | 2.11 104% |
| CCT | 13115 50% | 15991 41% | 12875 50% | 14052 46% | 7130 91% | 17705 37% |
| Color Space (Percent of AdobeRGB 1998) (%) | 48 | 60.1 25% | 49 2% | 53 10% | 62 29% | 50 4% |
| Color Space (Percent of sRGB) (%) | 73 | 91.6 25% | 76 4% | 81 11% | 97 33% | 77 5% |
| Media totale (Programma / Settaggio) | 22% /
26% | 1% /
-2% | 6% /
6% | 35% /
37% | -4% /
-11% |
* ... Meglio usare valori piccoli
Sfarfallio dello schermo / PWM (Pulse-Width Modulation)
| flickering dello schermo / PWM rilevato | 50 Hz | ≤ 70 % settaggio luminosita' | 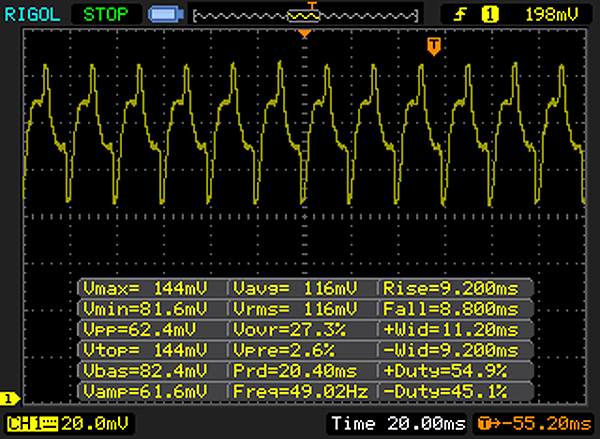 |
Il display sfarfalla a 50 Hz (Probabilmente a causa dell'uso di PWM) Flickering rilevato ad una luminosita' di 70 % o inferiore. Non dovrebbe verificarsi flickering o PWM sopra questo valore di luminosita'. La frequenza di 50 Hz è molto bassa, quindi il flickering potrebbe causare stanchezza agli occhi e mal di testa con un utilizzo prolungato. In confronto: 52 % di tutti i dispositivi testati non utilizza PWM per ridurre la luminosita' del display. Se è rilevato PWM, una media di 7757 (minimo: 5 - massimo: 343500) Hz è stata rilevata. | |||
Tempi di risposta del Display
| ↔ Tempi di risposta dal Nero al Bianco | ||
|---|---|---|
| 22 ms ... aumenta ↗ e diminuisce ↘ combinato | ↗ 6 ms Incremento | 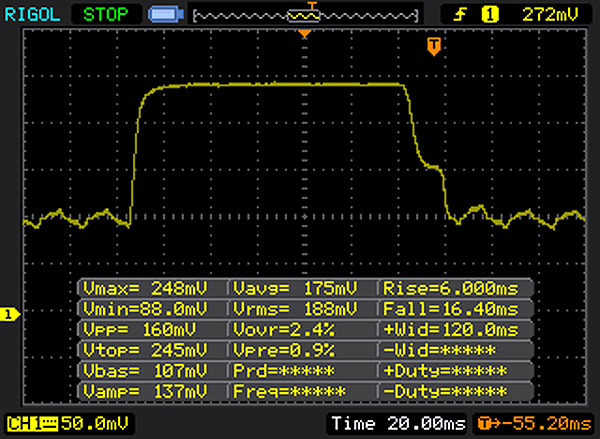 |
| ↘ 16 ms Calo | ||
| Lo schermo mostra buoni tempi di risposta durante i nostri tests, ma potrebbe essere troppo lento per i gamers competitivi. In confronto, tutti i dispositivi di test variano da 0.1 (minimo) a 240 (massimo) ms. » 49 % di tutti i dispositivi è migliore. Questo significa che i tempi di risposta rilevati sono peggiori rispetto alla media di tutti i dispositivi testati (19.8 ms). | ||
| ↔ Tempo di risposta dal 50% Grigio all'80% Grigio | ||
| 50 ms ... aumenta ↗ e diminuisce ↘ combinato | ↗ 19 ms Incremento | 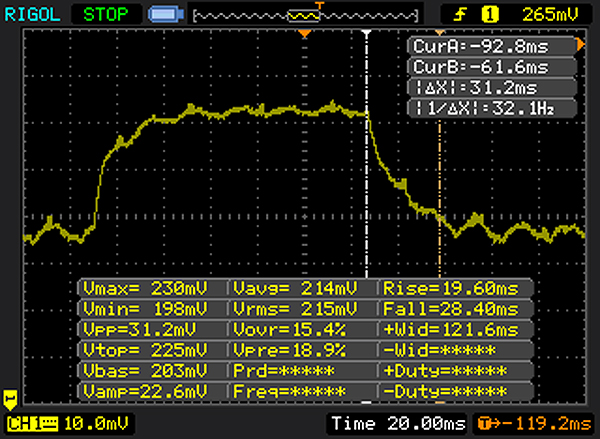 |
| ↘ 31 ms Calo | ||
| Lo schermo mostra tempi di risposta lenti nei nostri tests e sarà insoddisfacente per i gamers. In confronto, tutti i dispositivi di test variano da 0.165 (minimo) a 636 (massimo) ms. » 86 % di tutti i dispositivi è migliore. Questo significa che i tempi di risposta rilevati sono peggiori rispetto alla media di tutti i dispositivi testati (31 ms). | ||
| Cinebench R15 | |
| CPU Single 64Bit | |
| Lenovo Ideapad 110-17IKB 80VK0001GE | |
| Lenovo IdeaPad V110-17IKB 80V20006GE | |
| Acer Aspire E5-774-54HJ | |
| HP Pavilion 17-g013ng | |
| Lenovo IdeaPad 300-17ISK 80QH001EGE | |
| Acer Aspire ES1-731G-P5UR | |
| Lenovo G70-35 80Q5000BGE | |
| CPU Multi 64Bit | |
| Lenovo Ideapad 110-17IKB 80VK0001GE | |
| Acer Aspire E5-774-54HJ | |
| Lenovo IdeaPad V110-17IKB 80V20006GE | |
| Lenovo IdeaPad 300-17ISK 80QH001EGE | |
| HP Pavilion 17-g013ng | |
| Acer Aspire ES1-731G-P5UR | |
| Lenovo G70-35 80Q5000BGE | |
| Cinebench R10 | |
| Rendering Multiple CPUs 32Bit | |
| Acer Aspire E5-774-54HJ | |
| Lenovo Ideapad 110-17IKB 80VK0001GE | |
| Lenovo IdeaPad V110-17IKB 80V20006GE | |
| Lenovo IdeaPad 300-17ISK 80QH001EGE | |
| HP Pavilion 17-g013ng | |
| Acer Aspire ES1-731G-P5UR | |
| Lenovo G70-35 80Q5000BGE | |
| Rendering Single 32Bit | |
| Lenovo IdeaPad V110-17IKB 80V20006GE | |
| Lenovo Ideapad 110-17IKB 80VK0001GE | |
| Acer Aspire E5-774-54HJ | |
| HP Pavilion 17-g013ng | |
| Lenovo IdeaPad 300-17ISK 80QH001EGE | |
| Acer Aspire ES1-731G-P5UR | |
| Lenovo G70-35 80Q5000BGE | |
| Geekbench 3 | |
| 32 Bit Single-Core Score | |
| Lenovo Ideapad 110-17IKB 80VK0001GE | |
| Lenovo IdeaPad V110-17IKB 80V20006GE | |
| HP Pavilion 17-g013ng | |
| Acer Aspire E5-774-54HJ | |
| Lenovo IdeaPad 300-17ISK 80QH001EGE | |
| Lenovo G70-35 80Q5000BGE | |
| 32 Bit Multi-Core Score | |
| Lenovo Ideapad 110-17IKB 80VK0001GE | |
| Lenovo IdeaPad V110-17IKB 80V20006GE | |
| Acer Aspire E5-774-54HJ | |
| HP Pavilion 17-g013ng | |
| Lenovo IdeaPad 300-17ISK 80QH001EGE | |
| Lenovo G70-35 80Q5000BGE | |
| Geekbench 4.0 | |
| 64 Bit Single-Core Score | |
| Lenovo Ideapad 110-17IKB 80VK0001GE | |
| Lenovo IdeaPad V110-17IKB 80V20006GE | |
| Acer Aspire E5-774-54HJ | |
| 64 Bit Multi-Core Score | |
| Lenovo Ideapad 110-17IKB 80VK0001GE | |
| Lenovo IdeaPad V110-17IKB 80V20006GE | |
| Acer Aspire E5-774-54HJ | |
| JetStream 1.1 - 1.1 Total | |
| Lenovo Ideapad 110-17IKB 80VK0001GE | |
| Lenovo IdeaPad V110-17IKB 80V20006GE | |
| Acer Aspire E5-774-54HJ | |
| Lenovo IdeaPad 300-17ISK 80QH001EGE | |
| Lenovo G70-35 80Q5000BGE | |
| PCMark 8 Home Score Accelerated v2 | 3434 punti | |
| PCMark 8 Work Score Accelerated v2 | 4411 punti | |
Aiuto | ||
| PCMark 8 - Home Score Accelerated v2 | |
| Lenovo IdeaPad V110-17IKB 80V20006GE | |
| Lenovo Ideapad 110-17IKB 80VK0001GE | |
| HP Pavilion 17-g013ng | |
| Lenovo IdeaPad 300-17ISK 80QH001EGE | |
| Acer Aspire E5-774-54HJ | |
| Lenovo G70-35 80Q5000BGE | |
| Acer Aspire ES1-731G-P5UR | |

| Lenovo Ideapad 110-17IKB 80VK0001GE WDC Scorpio Blue WD10JPCX-24UE4T0 | Acer Aspire E5-774-54HJ Western Digital Scorpio Blue WD5000LPCX-24C6HT0 | Acer Aspire ES1-731G-P5UR Toshiba MQ01ABD100 | Lenovo IdeaPad 300-17ISK 80QH001EGE Toshiba MQ01ABD100 | HP Pavilion 17-g013ng Seagate ST1000LM014 Solid State Hybrid Drive | Lenovo IdeaPad V110-17IKB 80V20006GE WDC Scorpio Blue WD10JPCX-24UE4T0 | |
|---|---|---|---|---|---|---|
| CrystalDiskMark 3.0 | -15% | -23% | -26% | 5% | 6% | |
| Read Seq (MB/s) | 110.3 | 88.9 -19% | 105 -5% | 100.6 -9% | 115.8 5% | 115.2 4% |
| Write Seq (MB/s) | 109 | 70.9 -35% | 96 -12% | 96.3 -12% | 119.9 10% | 112.8 3% |
| Read 512 (MB/s) | 39.19 | 33.01 -16% | 32.89 -16% | 28.15 -28% | 40.55 3% | 39.67 1% |
| Write 512 (MB/s) | 52.9 | 51.6 -2% | 25.77 -51% | 43.34 -18% | 73.2 38% | 55.9 6% |
| Read 4k (MB/s) | 0.45 | 0.381 -15% | 0.324 -28% | 0.312 -31% | 0.544 21% | 0.487 8% |
| Write 4k (MB/s) | 1.201 | 1.117 -7% | 0.755 -37% | 0.792 -34% | 0.806 -33% | 1.287 7% |
| Read 4k QD32 (MB/s) | 1.079 | 0.891 -17% | 0.892 -17% | 0.708 -34% | 1.228 14% | 1.175 9% |
| Write 4k QD32 (MB/s) | 1.234 | 1.13 -8% | 1 -19% | 0.764 -38% | 1.007 -18% | 1.37 11% |
| 3DMark 11 Performance | 1871 punti | |
Aiuto | ||
| 3DMark 11 - 1280x720 Performance GPU | |
| HP Pavilion 17-g013ng | |
| Lenovo Ideapad 110-17IKB 80VK0001GE | |
| Lenovo B70-80 80MR0006GE | |
| Acer Aspire E5-774-54HJ | |
| Lenovo IdeaPad V110-17IKB 80V20006GE | |
| Lenovo IdeaPad 300-17ISK 80QH001EGE | |
| Acer Aspire ES1-731G-P5UR | |
| Acer Aspire E5-774-54HJ | |
| Lenovo G70-35 80Q5000BGE | |
| basso | medio | alto | ultra | |
|---|---|---|---|---|
| Tomb Raider (2013) | 54.8 | 28 | 21.5 | |
| BioShock Infinite (2013) | 41.1 | 24 | 19.8 | |
| Sims 4 (2014) | 123.4 | 35.7 | ||
| F1 2014 (2014) | 75 | 52 | ||
| Dragon Age: Inquisition (2014) | 32.6 | 21.4 | ||
| Battlefield Hardline (2015) | 45.8 | 31.4 | ||
| GTA V (2015) | 36 | 30.5 | ||
| Metal Gear Solid V (2015) | 33.5 | 22.8 | ||
| World of Warships (2015) | 43.6 | 31.1 | ||
| Rise of the Tomb Raider (2016) | 18.8 | 11.5 | ||
| XCOM 2 (2016) | 14.9 | |||
| Need for Speed 2016 (2016) | 20.8 | 18.1 | ||
| Ashes of the Singularity (2016) | 9.9 | |||
| FIFA 17 (2016) | 67.3 | 50.1 | ||
| Battlefield 1 (2016) | 23.7 | 16.1 | ||
| Titanfall 2 (2016) | 38.1 | 27.4 | ||
| Call of Duty Infinite Warfare (2016) | 20.7 | 18.1 | ||
| Dishonored 2 (2016) | 13.8 | 10.9 | ||
| Watch Dogs 2 (2016) | 15.8 | 12.5 |
| BioShock Infinite - 1280x720 Very Low Preset | |
| Lenovo IdeaPad V110-17IKB 80V20006GE | |
| Acer Aspire E5-774-54HJ | |
| Acer Aspire ES1-731G-P5UR | |
| Lenovo IdeaPad 300-17ISK 80QH001EGE | |
| Lenovo Ideapad 110-17IKB 80VK0001GE | |
| Acer Aspire E5-774-54HJ | |
| Lenovo G70-35 80Q5000BGE | |
| Tomb Raider - 1024x768 Low Preset | |
| HP Pavilion 17-g013ng | |
| Lenovo B70-80 80MR0006GE | |
| Acer Aspire ES1-731G-P5UR | |
| Lenovo Ideapad 110-17IKB 80VK0001GE | |
| Sims 4 - 1024x768 Low Preset | |
| Dell Inspiron 17-5758 | |
| Lenovo Ideapad 110-17IKB 80VK0001GE | |
| Lenovo B70-80 80MR0006GE | |
| World of Warships - 1366x768 Low Preset AF:Trilinear | |
| Lenovo IdeaPad 300-17ISK 80QH001EGE | |
| Lenovo Ideapad 110-17IKB 80VK0001GE | |
| Acer Aspire ES1-731G-P5UR | |
| F1 2014 - 1366x768 Medium Preset | |
| Lenovo Ideapad 110-17IKB 80VK0001GE | |
| Acer Aspire ES1-731G-P5UR | |
Rumorosità
| Idle |
| 32.5 / 32.5 / 32.5 dB(A) |
| HDD |
| 32.3 dB(A) |
| DVD |
| 36.3 / dB(A) |
| Sotto carico |
| 34.6 / 38.3 dB(A) |
 | ||
30 dB silenzioso 40 dB(A) udibile 50 dB(A) rumoroso |
||
min: | ||
(±) La temperatura massima sul lato superiore è di 40 °C / 104 F, rispetto alla media di 34.3 °C / 94 F, che varia da 21.2 a 62.5 °C per questa classe Office.
(±) Il lato inferiore si riscalda fino ad un massimo di 42.5 °C / 109 F, rispetto alla media di 36.8 °C / 98 F
(+) In idle, la temperatura media del lato superiore è di 23.6 °C / 74 F, rispetto alla media deld ispositivo di 29.5 °C / 85 F.
(-) I poggiapolsi e il touchpad possono diventare molto caldi al tatto con un massimo di 40 °C / 104 F.
(-) La temperatura media della zona del palmo della mano di dispositivi simili e'stata di 27.5 °C / 81.5 F (-12.5 °C / -22.5 F).
Lenovo Ideapad 110-17IKB 80VK0001GE analisi audio
(-) | altoparlanti non molto potenti (58 dB)
Bassi 100 - 315 Hz
(-) | quasi nessun basso - in media 22.2% inferiori alla media
(±) | la linearità dei bassi è media (9.1% delta rispetto alla precedente frequenza)
Medi 400 - 2000 Hz
(±) | medi elevati - circa 5.9% superiore alla media
(±) | linearità dei medi adeguata (11.8% delta rispetto alla precedente frequenza)
Alti 2 - 16 kHz
(+) | Alti bilanciati - appena 3.3% dalla media
(±) | la linearità degli alti è media (7.8% delta rispetto alla precedente frequenza)
Nel complesso 100 - 16.000 Hz
(-) | suono nel complesso non lineare (32.7% di differenza rispetto alla media
Rispetto alla stessa classe
» 95% di tutti i dispositivi testati in questa classe è stato migliore, 2% simile, 3% peggiore
» Il migliore ha avuto un delta di 7%, medio di 21%, peggiore di 53%
Rispetto a tutti i dispositivi testati
» 92% di tutti i dispositivi testati in questa classe è stato migliore, 1% similare, 7% peggiore
» Il migliore ha avuto un delta di 4%, medio di 23%, peggiore di 134%
Apple MacBook 12 (Early 2016) 1.1 GHz analisi audio
(+) | gli altoparlanti sono relativamente potenti (83.6 dB)
Bassi 100 - 315 Hz
(±) | bassi ridotti - in media 11.3% inferiori alla media
(±) | la linearità dei bassi è media (14.2% delta rispetto alla precedente frequenza)
Medi 400 - 2000 Hz
(+) | medi bilanciati - solo only 2.4% rispetto alla media
(+) | medi lineari (5.5% delta rispetto alla precedente frequenza)
Alti 2 - 16 kHz
(+) | Alti bilanciati - appena 2% dalla media
(+) | alti lineari (4.5% delta rispetto alla precedente frequenza)
Nel complesso 100 - 16.000 Hz
(+) | suono nel complesso lineare (10.2% differenza dalla media)
Rispetto alla stessa classe
» 7% di tutti i dispositivi testati in questa classe è stato migliore, 2% simile, 90% peggiore
» Il migliore ha avuto un delta di 5%, medio di 18%, peggiore di 53%
Rispetto a tutti i dispositivi testati
» 5% di tutti i dispositivi testati in questa classe è stato migliore, 1% similare, 94% peggiore
» Il migliore ha avuto un delta di 4%, medio di 23%, peggiore di 134%
| Off / Standby | |
| Idle | |
| Sotto carico |
|
Leggenda:
min: | |
| Battery Runtime - WiFi Websurfing | |
| Lenovo IdeaPad 300-17ISK 80QH001EGE | |
| Acer Aspire E5-774-54HJ | |
| Acer Aspire ES1-731G-P5UR | |
| Lenovo G70-35 80Q5000BGE | |
| HP Pavilion 17-g013ng | |
| Lenovo Ideapad 110-17IKB 80VK0001GE | |
| Lenovo IdeaPad V110-17IKB 80V20006GE | |
Pro
Contro
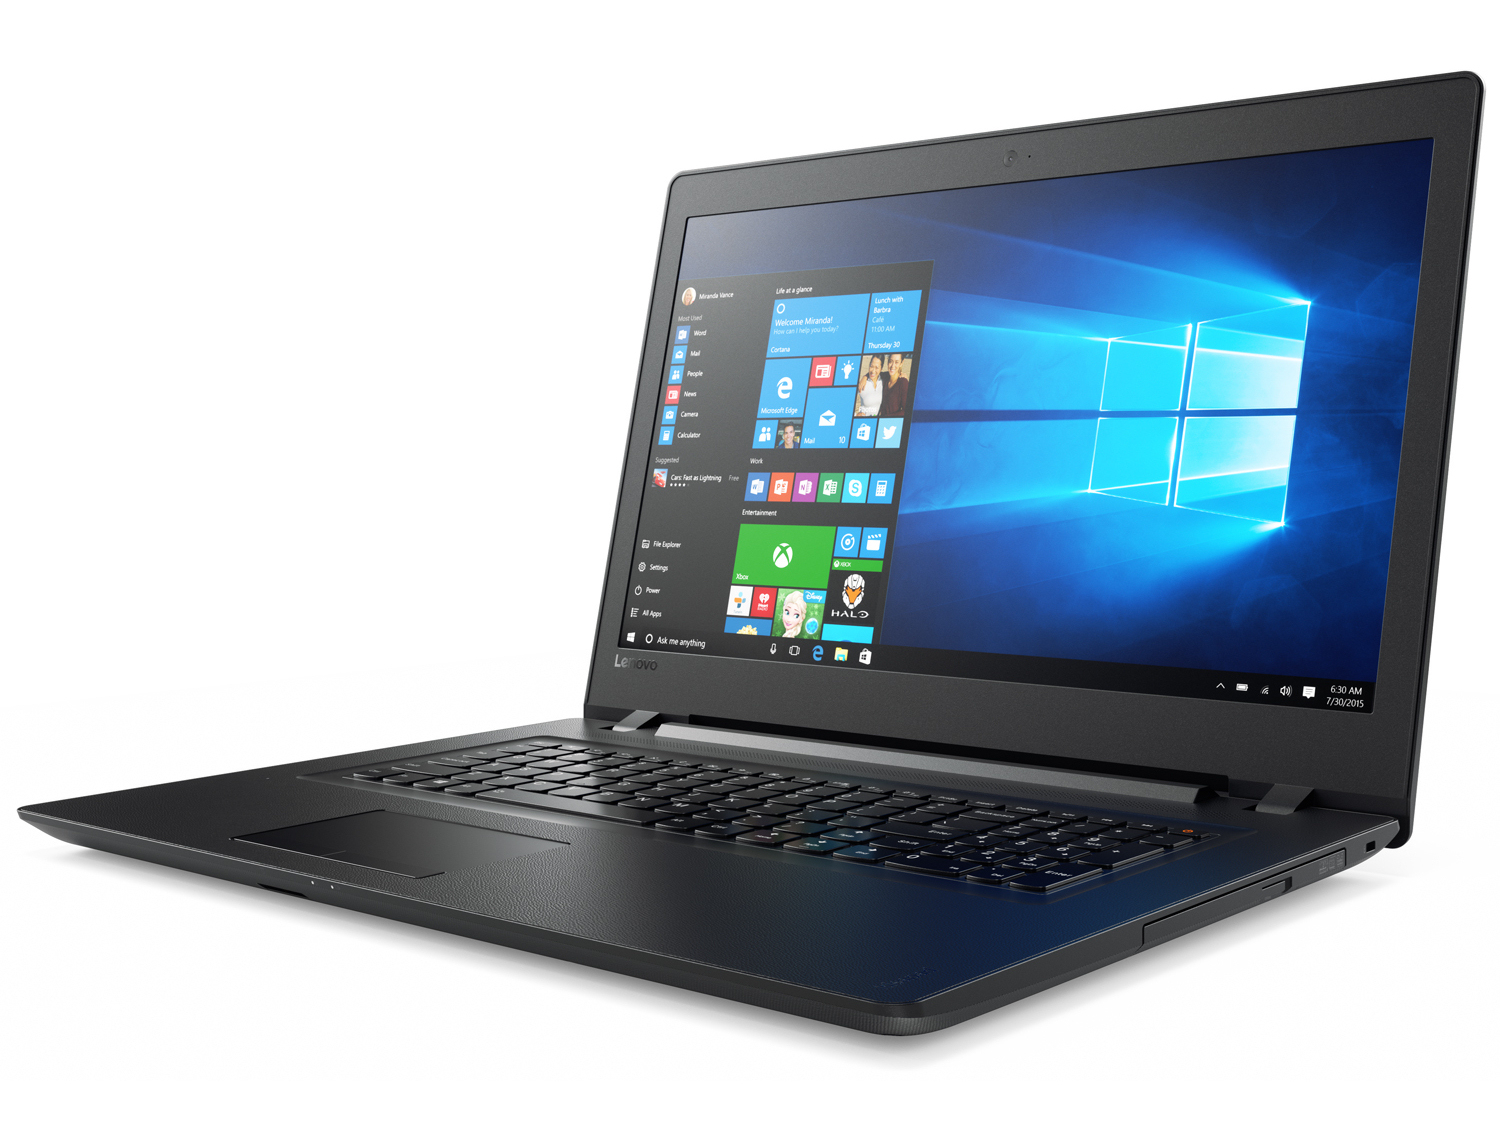
Il modello da 17.3" Lenovo è pensato per utenti privati che hanno bisogno di un portatile semplice.
Il processore Core i5 del nostro test model è stata la scelta giusta. Tuttavia, la GPU Radeon sembra essere più "bella che indispensabile", in quanto non offre un incremento di prestazioni significativo. Il produttore avrebbe potuto evitarla o installare un modello più potente. Il portatile si scalda poco ed è silenzioso in idle. Non appena la ventola aumenta la velocità, inizia ad emettere un fastidioso mormorio. Grazie all'HDD da 1 TB avrete sempre abbastanza spazio, ma è possibile sostituire l'HDD con un SSD. Questo è possibile aprendo il case.
Riguardo il case: il portatile deve essere poggiato su un tavolo stabile. La base del portatile è debole e la scheda madre potrebbe danneggiarsi se si muove troppo il portatile. La tastiera del modello testato è adatta per l'utilizzo domestico. Mentre lo schermo è scarso come luminosità, angoli di visuale e superficie riflettente. Il contrasto e la batteria sono accettabili.
Nota: si tratta di una recensione breve, con alcune sezioni non tradotte, per la versione integrale in inglese guardate qui.
Lenovo Ideapad 110-17IKB 80VK0001GE
- 12/30/2016 v6 (old)
Sascha Mölck