Recensioni Notebook con NVIDIA GeForce GTX 1650 Max-Q la scheda grafica
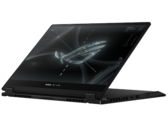
Asus ROG Flow X13 in recensione: Convertibile gaming con un AMD Ryzen 9 5980H e una RTX 3080 opzionale
L'Asus Flow X13 è un convertibile ultra-compatto da 13 pollici con un display ad alta risoluzione. Con il display dock opzionale, dotato di una GPU Nvidia Geforce RTX 3080, il Flow X13, insieme alla CPU AMD Ryzen 9 5980H integrata nel portatile, farebbe teoricamente sembrare vecchi anche i computer desktop. A causa della mancanza di disponibilità, per ora recensiremo solo il Flow X13 senza l'eGPU.
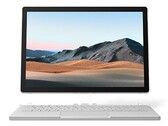
AMD Ryzen 9 5980HS, NVIDIA GeForce GTX 1650 Max-Q, 13.4", 1.4 kgRecensione del convertibile Surface Book 3 13.5: convertibile Microsoft che diventa lentamente obsoleto
Con l'ultima edizione del Surface Book 3, Microsoft aggiorna il suo dispositivo multimediale alla generazione Ice Lake di Intel. Otteniamo un quadro complessivo della variante i7 con Nvidia GeForce GTX 1650 e chiariamo quali prestazioni gli utenti possono aspettarsi da essa nella nostra recensione.
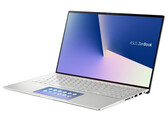
Intel Core i7-1065G7, NVIDIA GeForce GTX 1650 Max-Q, 13.5", 1.6 kgRecensione del Notebook Asus ZenBook 15 UX534FTC: schermo matto ed autonomia eccezionale
Asus ha dotato questo sottile laptop di un processore a quattro cores e di una scheda grafica dedicata. Le caratteristiche sono eccellenti anche per il resto: Schermo IPS opaco, SSD NVMe, 16 GB di RAM (in modalità dual-channel), tastiera retroilluminata. Inoltre, l'eccezionale durata della batteria completa bene l'intero pacchetto.
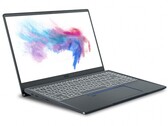
Intel Core i7-10510U, NVIDIA GeForce GTX 1650 Max-Q, 15.6", 1.6 kgRecensione del laptop MSI Prestige 14 A10SC-009: Comet Lake per creatori di contenuti
L'MSI Prestige 14 è una piccola centrale elettrica con un design e dotazioni convincenti. Ci piace molto anche la tastiera con i suoi tasti a freccia di dimensioni normali. La nostra recensione dettagliata chiarisce come si comporta questo portatile da 14" per i creativi.
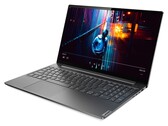
Intel Core i7-10710U, NVIDIA GeForce GTX 1650 Max-Q, 14", 1.3 kgRecensione del Lenovo IdeaPad S740-15IRH: è ancora l'IdeaPad migliore
Anche se il nome IdeaPad è comunemente associato a offerte economiche di fascia medio-bassa, l'IdeaPad S740 è il più lussuoso e potente della sua famiglia. La grande novità è che vi costerà circa lo stesso prezzo del più noto Dell XPS 15 o HP Spectre x360 15.
Intel Core i7-9750H, NVIDIA GeForce GTX 1650 Max-Q, 15.6", 1.9 kgMSI GF63 Thin 9SC: Intel Core i5-9300H, 15.60", 1.8 kg
recensione » Recensione del Laptop MSI GF63 Thin 9SC: un leggero gamer per poco meno di $1000
Lenovo Yoga C940-15IRH: Intel Core i7-9750H, 15.60", 2 kg
recensione » Recensione del Convertibile Lenovo Yoga C940-15IRH
Razer Blade Stealth 13, Core i7-1065G7: Intel Core i7-1065G7, 13.30", 1.5 kg
recensione » Recensione dell Laptop Razer Blade Stealth (GTX 1650 Max-Q): schermo 4K, autonomia e prestazioni CPU deludenti
MSI Prestige 15 A10SC: Intel Core i7-10710U, 15.60", 1.7 kg
recensione » Recensione del Laptop MSI Prestige 15 A10SC: una delle migliori alternative al Dell XPS 15
Lenovo IdeaPad S540-15IWL 81SW0015GE: Intel Core i7-8565U, 15.60", 1.9 kg
recensione » Recensione del Laptop Lenovo IdeaPad S540-15IWL: un ottimo tuttofare con una sola vera pecca
Asus ZenBook 15 UX534FT-DB77: Intel Core i7-8565U, 15.60", 1.7 kg
recensione » Recensione del Laptop Asus ZenBook 15 UX534F: Sembra un Ultrabook, Gioca come un Gamer
MSI Prestige 14 i7-10710U: Intel Core i7-10710U, 14.00", 1.3 kg
recensione » Recensione del Laptop MSI Prestige 14: più veloce ed ottimo per i creatori di contenuti
MSI PS63 Modern 8SC: Intel Core i7-8565U, 15.60", 1.7 kg
recensione » Un vero tuttofare: Recensione del Computer portatile MSI PS63 Modern 8SC
Asus VivoBook Pro 15 K3500PH: Intel Core i7-11370H, 15.60", 1.7 kg
Recensioni esterne » Asus VivoBook Pro 15 K3500PH
MSI GV15 Thin 11SC-633: Intel Core i5-11400H, 15.60", 1.9 kg
Recensioni esterne » MSI GV15 Thin 11SC-633
Acer Swift X SFX14-41G-R6BZ: AMD Ryzen 5 5500U, 14.00", 1.5 kg
Recensioni esterne » Acer Swift X SFX14-41G-R6BZ
Acer Swift X SFX14-41G-R9Q5: AMD Ryzen 5 5500U, 14.00", 1.5 kg
Recensioni esterne » Acer Swift X SFX14-41G-R9Q5
Asus ROG Flow X13 GV301QH-K6069T: AMD Ryzen 7 5800HS, 13.40", 1.3 kg
Recensioni esterne » Asus ROG Flow X13 GV301QH-K6069T
Asus ZenBook Pro 15 UX535LH-BN150T : Intel Core i7-10870H, 15.60", 1.8 kg
Recensioni esterne » Asus ZenBook Pro 15 UX535LH-BN150T
Asus ZenBook Pro 15 UX535LH-BN024T: Intel Core i5-10300H, 15.60", 1.8 kg
Recensioni esterne » Asus ZenBook Pro 15 UX535LH-BN024T
Lenovo ThinkBook 15p IMH-20V30007GE: Intel Core i5-10300H, 15.60", 1.9 kg
Recensioni esterne » Lenovo ThinkBook 15p IMH-20V30007GE
Asus ZenBook Flip 15 UX564PH-EZ007R: Intel Core i7-11370H, 15.60", 1.9 kg
Recensioni esterne » Asus ZenBook Flip 15 UX564PH-EZ007R
MSI GF63 Thin 10SC-206: Intel Core i5-10300H, 15.60", 1.9 kg
Recensioni esterne » MSI GF63 Thin 10SC-206
Asus ROG Flow X13 GV301QH-K6034T-BE: AMD Ryzen 7 5800HS, 13.40", 1.3 kg
Recensioni esterne » Asus ROG Flow X13 GV301QH-K6034T-BE
MSI Prestige 15 A11SCX-019XES: Intel Core i7-1185G7, 15.60", 1.7 kg
Recensioni esterne » MSI Prestige 15 A11SCX-019XES
MSI Prestige 15 A10SC-014: Intel Core i7-10710U, 15.60", 1.7 kg
Recensioni esterne » MSI Prestige 15 A10SC-014
Asus ROG Flow X13 GV301QH: AMD Ryzen 9 5980HS, 13.40", 1.4 kg
Recensioni esterne » Asus ROG Flow X13 GV301QH
Lenovo ThinkPad X1 Extreme-20QV000WGE: Intel Core i7-9750H, 15.60", 1.7 kg
Recensioni esterne » Lenovo ThinkPad X1 Extreme-20QV000WGE
Microsoft Surface Book 3 13.5: Intel Core i7-1065G7, 13.50", 1.6 kg
Recensioni esterne » Microsoft Surface Book 3 13.5
MSI Prestige 14 A10SC-009: Intel Core i7-10710U, 14.00", 1.3 kg
Recensioni esterne » MSI Prestige 14 A10SC-009
Lenovo ThinkPad X1 Extreme G2-20QV000KUS: Intel Core i7-9850H, 15.60", 1.8 kg
Recensioni esterne » Lenovo ThinkPad X1 Extreme G2-20QV000KUS
Razer Blade Stealth i7-1065G7, GTX 1650 Max-Q: Intel Core i7-1065G7, 13.30", 1.5 kg
Recensioni esterne » Razer Blade Stealth i7-1065G7, GTX 1650 Max-Q
Lenovo ThinkPad X1 Extreme G2-20QV00CEGE: Intel Core i9-9880H, 15.60", 1.8 kg
Recensioni esterne » Lenovo ThinkPad X1 Extreme G2-20QV00CEGE
Lenovo ThinkPad X1 Extreme G2-20QV00CMGE: Intel Core i7-9750H, 15.60", 1.7 kg
Recensioni esterne » Lenovo ThinkPad X1 Extreme G2-20QV00CMGE
Lenovo Yoga C940-15IRH: Intel Core i7-9750H, 15.60", 2 kg
Recensioni esterne » Lenovo Yoga C940-15IRH
MSI Prestige 15 A10SC-029NL: Intel Core i7-10710U, 15.60", 1.6 kg
Recensioni esterne » MSI Prestige 15 A10SC-029NL
MSI Prestige 15 A10SC-044XES: Intel Core i7-10710U, 15.60", 1.7 kg
Recensioni esterne » MSI Prestige 15 A10SC-044XES
MSI Prestige 14 A10SC-004NL: Intel Core i7-10710U, 14.00", 1.3 kg
Recensioni esterne » MSI Prestige 14 A10SC-004NL
MSI Prestige 15 A10SC-060XES: Intel Core i7-10710U, 15.60", 1.7 kg
Recensioni esterne » MSI Prestige 15 A10SC-060XES
Lenovo ThinkPad X1 Extreme G2-20QV000UGE: Intel Core i5-9300H, 15.60", 1.7 kg
Recensioni esterne » Lenovo ThinkPad X1 Extreme G2-20QV000UGE
Asus ZenBook 15 UX534FT-DB77: Intel Core i7-8565U, 15.60", 1.7 kg
Recensioni esterne » Asus ZenBook 15 UX534FT-DB77
Asus ZenBook 15 UX534FTC-A8078R: Intel Core i7-10510U, 15.60", 1.7 kg
Recensioni esterne » Asus ZenBook 15 UX534FTC-A8078R
MSI Prestige 15 A10SC: Intel Core i7-10710U, 15.60", 1.7 kg
Recensioni esterne » MSI Prestige 15 A10SC
Asus ZenBook 15 UX534FT-A8145T: Intel Core i7-8565U, 15.60", 1.7 kg
Recensioni esterne » Asus ZenBook 15 UX534FT-A8145T
MSI Prestige 15 A10SC-011: Intel Core i7-10710U, 15.60", 1.6 kg
Recensioni esterne » MSI Prestige 15 A10SC-011
Lenovo ThinkPad X1 Extreme G2-20QV000WGE: Intel Core i7-9750H, 15.60", 1.7 kg
Recensioni esterne » Lenovo ThinkPad X1 Extreme G2-20QV000WGE
MSI GF63 9SC-662: Intel Core i5-9300H, 15.60", 1.9 kg
Recensioni esterne » MSI GF63 9SC-662
MSI Prestige 14 i7-10710U: Intel Core i7-10710U, 14.00", 1.3 kg
Recensioni esterne » MSI Prestige 14 i7-10710U
Lenovo Ideapad S540-15IWL 81SW001SMH: Intel Core i5-8265U, 15.60", 1.8 kg
Recensioni esterne » Lenovo Ideapad S540-15IWL 81SW001SMH
MSI GF75 Thin 9SC-039XES: Intel Core i7-9750H, 15.60", 2.2 kg
Recensioni esterne » MSI GF75 Thin 9SC-039XES
Asus ZenBook 15 UX534FT, i7-8565U: Intel Core i7-8565U, 15.60", 1.7 kg
Recensioni esterne » Asus ZenBook 15 UX534FT, i7-8565U
MSI PS63 8SC-003NL: Intel Core i7-8565U, 15.60", 1.6 kg
Recensioni esterne » MSI PS63 8SC-003NL