Recensioni Notebook con Intel UHD Graphics 64EUs (Alder Lake 12th Gen) la scheda grafica
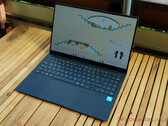
Recensione del Samsung Galaxy Chromebook Plus: Bello, veloce, ma affamato
Il Samsung Galaxy Chromebook Plus colpisce per il suo corpo ultrasottile in alluminio e per il display AMOLED eccezionalmente brillante che stabilisce nuovi standard in questa categoria. Offre anche buone prestazioni grazie all'Intel Core 3, ma ha un prezzo elevato.
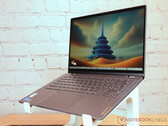
Intel Core 3 100U, UHD Graphics 64EUs, 15.6", 1.2 kgRecensione del Lenovo IdeaPad Flex 5 Chromebook Plus: Elegante convertibile con ottime prestazioni
Questo funziona bene insieme e copre molte aree di utilizzo. Il portatile 2-in-1 di Lenovo funge anche da potente tablet con input tramite penna ed è pienamente compatibile con molte applicazioni di Android, grazie a un solido processore Intel Core. Con Gemini, l'utente ha anche un'AI versatile al suo fianco.
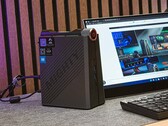
Intel Core i3-1315U, UHD Graphics 64EUs, 14", 1.6 kgRecensione del mini PC Nipogi AD08: L'elegante PC con un Intel Core i7-12650H presenta un design mini-tower e tre modalità di alimentazione
NiPoGi ha dotato il suo AD08 di un Intel Core i7-12650H che offre prestazioni sufficienti per affrontare le attività quotidiane in ufficio. Essendo un PC da gioco compatto in formato tower, il produttore ha scelto una strada leggermente diversa per quanto riguarda il suo design. In questa recensione, può leggere quali sono i vantaggi che ne derivano e come si comporta NiPoGi AD08 rispetto ai mini PC con equipaggiamento simile.
Intel Core i7-12650H, UHD Graphics 64EUs, 878 grRecensione del mini PC Nipogi AD08: L'elegante PC con un Intel Core i7-12650H presenta un design mini-tower e tre modalità di alimentazione
NiPoGi ha dotato il suo AD08 di un Intel Core i7-12650H che offre prestazioni sufficienti per affrontare le attività quotidiane in ufficio. Essendo un PC da gioco compatto in formato tower, il produttore ha scelto una strada leggermente diversa per quanto riguarda il suo design. In questa recensione, può leggere quali sono i vantaggi che ne derivano e come si comporta NiPoGi AD08 rispetto ai mini PC con equipaggiamento simile.
Intel Core i7-12650H, UHD Graphics 64EUs, 878 grHP 250 G9 7N029ES: Intel Core i3-1215U, 15.60", 1.7 kg
recensione » Recensione dell'HP 250 G9 - Un portatile da ufficio economico con un Core i3 e un pannello IPS
Geekom Mini IT12: Intel Core i5-12450H, 0.6 kg
recensione » Recensione del Geekom Mini IT12 con Intel Core i5-12450H - Mini PC con buone prestazioni e due porte USB 4
NiPoGi CK10: Intel Core i5-12450H, 0.5 kg
recensione » Recensione del NiPoGi CK10 - Il mini PC con un Intel Core i5-12450H e 16 GB di RAM è al di sotto delle aspettative
Minisforum Venus Series UN1245: Intel Core i5-12450H, 0.5 kg
recensione » Recensione del Minisforum Venus Series UN1245: Un potente mini PC con Intel Core i5-12450H a partire da 310 dollari
Minisforum Venus Series NAB6: Intel Core i7-12650H, 0.6 kg
recensione » Recensione del Minisforum Venus Series NAB6: L'elegante mini PC con il veloce Intel Core i7-12650H e il raffreddamento attivo dell'SSD!
Lenovo IdeaPad Flex 5 14IAU7-82R7007TGE: Intel Core i3-1215U, 14.00", 1.6 kg
recensione » Recensione del convertibile Lenovo IdeaPad Flex 5: L'ingresso potente del piccolo i3-1215U
Dell Pro 15 Essential, Core 3 100U: Intel Core 3 100U, 15.60", 1.9 kg
Recensioni esterne » Dell Pro 15 Essential, Core 3 100U - Recensioni e Specifiche
Lenovo V15 G4 IRU, i3-1315U: Intel Core i3-1315U, 15.60", 1.7 kg
Recensioni esterne » Lenovo V15 G4 IRU, i3-1315U
Acer Chromebook Plus 516 GE CBG516-2H, Core 3 100U: Intel Core 3 100U, 16.00", 0 kg
Recensioni esterne » Acer Chromebook Plus 516 GE CBG516-2H, Core 3 100U
Acer Aspire Go 15 AG15-71P: Intel Core i7-13620H, 15.60", 1.8 kg
Recensioni esterne » Acer Aspire Go 15 AG15-71P
Asus Vivobook S16 S3607VA: Intel Core i7-13620H, 16.00", 1.8 kg
Recensioni esterne » Asus Vivobook S16 S3607VA
Asus ExpertBook P3 P3405CVA: Intel Core i7-13620H, 14.00", 1.4 kg
Recensioni esterne » Asus ExpertBook P3 P3405CVA
Asus VivoBook 16 X1605VA, i3-1315U: Intel Core i3-1315U, 16.00", 1.9 kg
Recensioni esterne » Asus VivoBook 16 X1605VA, i3-1315U
Acer Chromebook Plus 514 CBE594-2T: Intel Core 3 100U, 14.00", 1.4 kg
Recensioni esterne » Acer Chromebook Plus 514 CBE594-2T
Asus ExpertBook P3 P3605CVA: Intel Core i7-13620H, 16.00", 1.8 kg
Recensioni esterne » Asus ExpertBook P3 P3605CVA
Asus ExpertBook P1 P1403CVA: Intel Core i7-13620H, 14.00", 1.4 kg
Recensioni esterne » Asus ExpertBook P1 P1403CVA
Lenovo V15 G5 IRL: Intel Core 7 240H, 15.60", 1.6 kg
Recensioni esterne » Lenovo V15 G5 IRL
Asus ExpertBook P1 P1503CVA, i7-13620H: Intel Core i7-13620H, 15.60", 1.6 kg
Recensioni esterne » Asus ExpertBook P1 P1503CVA, i7-13620H
Lenovo IP Flex 5 Chromebook Plus 14IAU7: Intel Core i3-1215U, 14.00", 1.6 kg
Recensioni esterne » Lenovo IP Flex 5 Chromebook Plus 14IAU7
Dell Vostro 14 3440: Intel Core i3-1305U, 14.00", 1.6 kg
Recensioni esterne » Dell Vostro 14 3440
Infinix Inbook X2 2025: Intel Core i5-1334U, 14.00", 1.2 kg
Recensioni esterne » Infinix Inbook X2 2025
Acer Chromebook Plus 515 CBE595, Core 3 100U: Intel Core 3 100U, 15.60", 1.7 kg
Recensioni esterne » Acer Chromebook Plus 515 CBE595, Core 3 100U
Acer Extensa 15 EX215-55: Intel Core i3-1215U, 15.60", 1.8 kg
Recensioni esterne » Acer Extensa 15 EX215-55
Dell Inspiron 5440, i3-1305U: Intel Core i3-1305U, 14.00", 1.5 kg
Recensioni esterne » Dell Inspiron 5440, i3-1305U
Acer Aspire 5 A515-57, i7-12650H: Intel Core i7-12650H, 15.60", 1.8 kg
Recensioni esterne » Acer Aspire 5 A515-57, i7-12650H
Acer Chromebook Plus Spin 514 CP514-4HN: Intel Core 3 100U, 14.00", 1.5 kg
Recensioni esterne » Acer Chromebook Plus Spin 514 CP514-4HN
Acer Aspire 5 A515-58P: Intel Core i3-1315U, 15.60", 1.8 kg
Recensioni esterne » Acer Aspire 5 A515-58P
Samsung Galaxy Chromebook Plus XE550XGA: Intel Core 3 100U, 15.60", 1.2 kg
Recensioni esterne » Samsung Galaxy Chromebook Plus XE550XGA
Acer Aspire Lite AL15-53: Intel Core i3-1305U, 15.60", 1.6 kg
Recensioni esterne » Acer Aspire Lite AL15-53
Lenovo IdeaPad Slim 5 16IRL8: Intel Core i7-13620H, 16.00", 1.9 kg
Recensioni esterne » Lenovo IdeaPad Slim 5 16IRL8
HP 14-dq5000: Intel Core i3-1215U, 14.00", 1.5 kg
Recensioni esterne » HP 14-dq5000
Asus Vivobook 17 X1702, i3-1215: Intel Core i3-1215U, 17.30", 2.1 kg
Recensioni esterne » Asus Vivobook 17 X1702, i3-1215
Acer TravelMate P2 TMP214-55: Intel Core i3-1315U, 14.00", 1.6 kg
Recensioni esterne » Acer TravelMate P2 TMP214-55
Samsung Galaxy Book4 15: Intel Core 3 100U, 15.60", 1.6 kg
Recensioni esterne » Samsung Galaxy Book4 15
Lenovo IdeaPad Slim 3 15IRH8, i7-13620H: Intel Core i7-13620H, 15.60", 1.6 kg
Recensioni esterne » Lenovo IdeaPad Slim 3 15IRH8, i7-13620H
HP 14-ep0865no: Intel Core i3-1315U, 14.00", 2.2 kg
Recensioni esterne » HP 14-ep0865no
Infinix Inbook Y4 Max: Intel Core i3-1315U, 16.00", 1.8 kg
Recensioni esterne » Infinix Y4 Max
Asus Vivobook 14 X1404ZA: Intel Core i3-1215U, 14.00", 1.4 kg
Recensioni esterne » Asus Vivobook 14 X1404ZA
Dell Vostro 3520, i3-1215U: Intel Core i3-1215U, 15.60", 1.7 kg
Recensioni esterne » Dell Vostro 3520, i3-1215U
Dell Inspiron 15 3520, i3-1215U: Intel Core i3-1215U, 15.60", 1.9 kg
Recensioni esterne » Dell Inspiron 15 3520, i3-1215U
Lenovo IdeaPad Slim 5 14IRL8: Intel Core i7-13620H, 14.00", 1.5 kg
Recensioni esterne » Lenovo IdeaPad Slim 5 14IRL8
Lenovo IdeaPad Flex 5 14IRU8, i3-1315U: Intel Core i3-1315U, 14.00", 1.5 kg
Recensioni esterne » Lenovo IdeaPad Flex 5 14IRU8, i3-1315U
HP 14-ee0035ng: Intel Core i3-1315U, 14.00", 1.4 kg
Recensioni esterne » HP 14-ee0035ng
HP 240 G9: Intel Core i3-1215U, 14.00", 1.4 kg
Recensioni esterne » HP 240 G9
Lenovo IdeaPad Slim 3 15IRU8: Intel Core i3-1315U, 15.60", 1.6 kg
Recensioni esterne » Lenovo IdeaPad Slim 3 15IRU8
Acer Aspire 5 A514-55: Intel Core i3-1215U, 14.00", 1.7 kg
Recensioni esterne » Acer Aspire 5 A514-55
Lenovo IP Flex 5 Chrome 14IAU7 Plus: Intel Core i3-1315U, 14.00", 1.6 kg
Recensioni esterne » Lenovo IP Flex 5 Chrome 14IAU7
HP 15s-fq5000TU: Intel Core i3-1215U, 15.60", 1.7 kg
Recensioni esterne » HP 15s-fq5000TU
Acer Chromebook Plus 515 CB515-2H: Intel Core i3-1215U, 15.60", 1.7 kg
Recensioni esterne » Acer Chromebook Plus 515 CB515-2H
Asus Chromebook Plus CX3402: Intel Core i3-1215U, 14.00", 1.4 kg
Recensioni esterne » Asus Chromebook Plus CX3402
Lenovo IP 5 Chrome 16IAU7: Intel Core i3-1215U, 16.00", 1.8 kg
Recensioni esterne » Lenovo IP 5 Chrome 16IAU7
MSI Modern 15 B12M, i3-1215U: Intel Core i3-1215U, 15.60", 1.7 kg
Recensioni esterne » MSI Modern 15 B12M, i3-1215U
HP Chromebook x360 14c-cd000: Intel Core i3-1215U, 14.00", 1.5 kg
Recensioni esterne » HP Chromebook x360 14c-cd000
Acer Aspire 5 A515-58, i3-1315U: Intel Core i3-1315U, 15.60", 1.8 kg
Recensioni esterne » Acer Aspire 5 A515-58, i3-1315U
Lenovo IdeaPad 3 14IAU7: Intel Core i3-1215U, 14.00", 1.4 kg
Recensioni esterne » Lenovo IdeaPad 3 14IAU7
Asus ExpertBook B1 B1502CBA: Intel Core i3-1215U, 15.60", 1.7 kg
Recensioni esterne » Asus ExpertBook B1 B1502CBA
Asus Vivobook 14 A1405VA, i3-1315U: Intel Core i3-1315U, 14.00", 1.6 kg
Recensioni esterne » Asus Vivobook 14 A1405VA, i3-1315U
Asus Vivobook 14 A1405ZA: Intel Core i3-1215U, 14.00", 1.6 kg
Recensioni esterne » Asus Vivobook 14 A1405ZA
Asus VivoBook 14 F1402ZA, i3-1215U: Intel Core i3-1215U, 14.00", 1.5 kg
Recensioni esterne » Asus VivoBook 14 F1402ZA, i3-1215U
Acer Chromebook Vero 514 CBV514-1H-321H: Intel Core i3-1215U, 14.00", 1.5 kg
Recensioni esterne » Acer Chromebook Vero 514 CBV514-1H-321H
Lenovo IdeaPad Duet 5 12IAU7, i3-1215U: Intel Core i3-1215U, 12.40", 0.8 kg
Recensioni esterne » Lenovo IdeaPad Duet 5 12IAU7, i3-1215U
Nokia PureBook Pro 15, i3-1220P: Intel Core i3-1220P, 16.00", 2 kg
Recensioni esterne » Nokia PureBook Pro 15, i3-1220P
Asus Vivobook 15 X1502ZA, i3-1220P: Intel Core i3-1220P, 15.60", 1.7 kg
Recensioni esterne » Asus Vivobook 15 X1502ZA, i3-1220P
Asus Vivobook 16X X1603ZA, i3-1220P: Intel Core i3-1220P, 16.00", 1.9 kg
Recensioni esterne » Asus Vivobook 16X X1603ZA, i3-1220P
Acer Aspire 5 A515-57-335Y: Intel Core i3-1220P, 15.60", 1.8 kg
Recensioni esterne » Acer Aspire 5 A515-57-335Y
Lenovo IdeaPad Gaming Chromebook 16, i3-1215U: Intel Core i3-1215U, 16.00", 1.8 kg
Recensioni esterne » Lenovo IdeaPad Gaming Chromebook 16, i3-1215U
Lenovo Ideapad 3 15IAU7-82RK001VGE: Intel Core i3-1215U, 15.60", 1.6 kg
Recensioni esterne » Lenovo Ideapad 3 15IAU7-82RK001VGE
Acer Aspire 3 A315-59, i3-1215U: Intel Core i3-1215U, 15.60", 1.8 kg
Recensioni esterne » Acer Aspire 3 A315-59, i3-1215U
Acer Swift 3 SF314-71-79ZW: Intel Core i7-12650H, 14.00", 1.4 kg
Recensioni esterne » Acer Swift 3 SF314-71-79ZW
Acer Aspire 5 A515-57-3488: Intel Core i3-1215U, 15.60", 1.8 kg
Recensioni esterne » Acer Aspire 5 A515-57-3488
Nokia PureBook Pro 17: Intel Core i3-1220P, 17.30", 2.5 kg
Recensioni esterne » Nokia PureBook Pro 17