Notebookcheck Logo

Intel Graphics 2 Xe3 Wildcat Lake iGPU

Intel Intel Graphics 2 Xe3 WCL

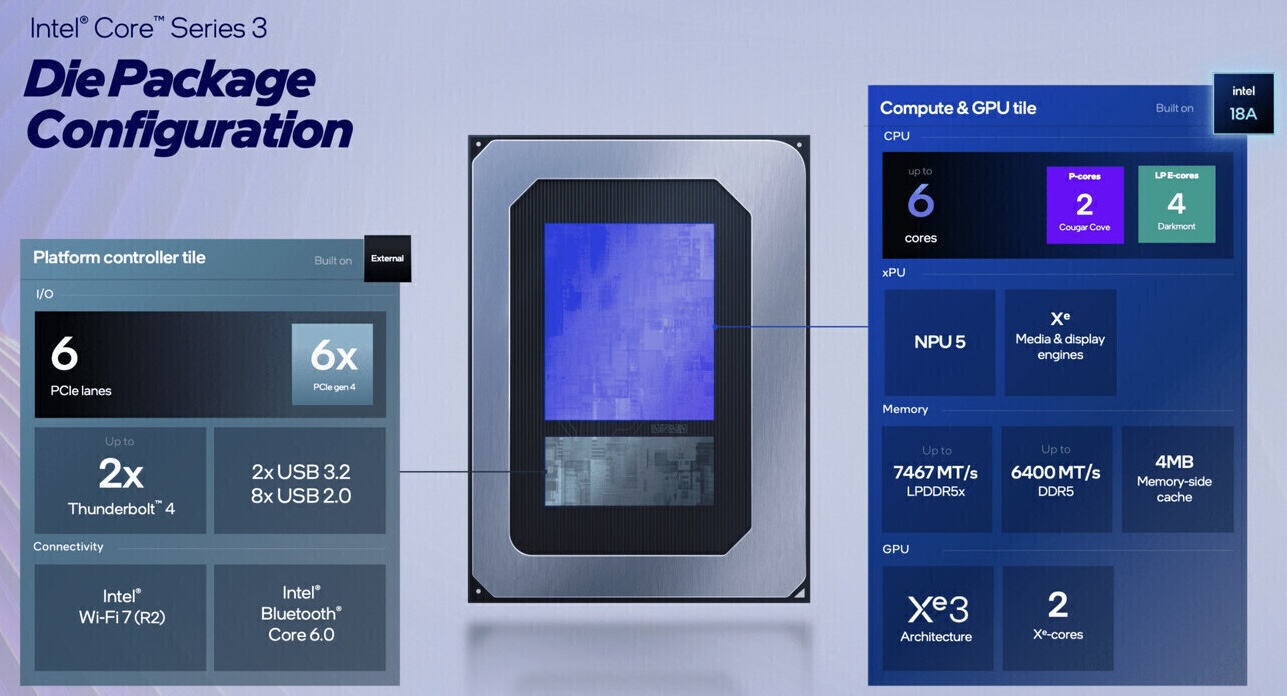
L'Intel Graphics 2-Core Xe3 è una scheda grafica integrata nei SoC Wildcat Lake con 2 core Xe3 (16 EU / 256 ALU) e 2 core di raytracing.

Il nuovo motore multimediale supporta ora la codifica e la decodifica AV1, la decodifica VVC, l'AVC a 10 bit e l'eDP 1.5.

La piccola iGPU non è adatta ai giochi 3D più esigenti. Solo i giochi poco impegnativi e molto vecchi dovrebbero funzionare senza problemi.

Il core grafico si trova nel tile Compute & GPU del chip WCL ed è prodotto nel moderno processo a 1,8 nm (Intel 18A).

Wildcat Lake Xe3 Serie

Intel Graphics 2 Xe3 WCL 16 @ 2.6 GHz
Intel Graphics 1 Xe3 WCL 8 @ 2.3 GHz
Nome in codiceWildcat Lake
ArchitetturaXe3
iGPUIntegrated Graphics
Pipelines16 - unified
Raytracing Cores2
Velocità del core2600 (Boost) MHz
AI GPU21 TOPS INT8
Memoria condivisano
APIDirectX 12_2
tecnologia1.8 nm
Data dell'annuncio01.05.2026
CPU in Intel Graphics 2 Xe3 WCLGPU Base SpeedGPU Boost / Turbo
Intel Core 7 3606 x 1400 MHz, 15 W? MHz2600 MHz
Intel Core 7 3506 x 1400 MHz, 15 W? MHz2600 MHz
Intel Core 5 3306 x 1400 MHz, 15 W? MHz2500 MHz
min. - max.? MHz2300 - 2600 MHz

Benchmark

3DMark - 3DMark Fire Strike Standard Score
3426 Points (5%)
3DMark - 3DMark Fire Strike Standard Graphics
3642 Points (3%)
3DMark - 3DMark Time Spy Score
1576 Points (4%)
3DMark - 3DMark Time Spy Graphics
1401 Points (3%)
107.5 -92%
...
1148 -18%
NVIDIA Quadro P600
1162 -17%
1175 -16%
unknown
1257 -10%
1281 -9%
1322 -6%
AMD Radeon Pro 560
1376 -2%
NVIDIA Quadro P620
1388 -1%
1395 0%
Intel Graphics 2 Xe3 Wildcat Lake iGPU
1401
1430 2%
AMD Radeon 660M
1450 3%
1493 7%
1496 7%
AMD Radeon Pro 560X
1614 15%
NVIDIA GeForce GTX 1050 Max-Q
1615 15%
1616 15%
1672 19%
1724 23%
...
NVIDIA RTX PRO 5000 Blackwell Generation Laptop
23277 1561%
max:
NVIDIA GeForce RTX 5090
44063 3045%
0%
100%
Restrict / Search: Model: Max. age: years
3DMark - 3DMark Cloud Gate Score
18182 Points (17%)
3DMark - 3DMark Cloud Gate Graphics
22468 Points (6%)
3DMark 11 - 3DM11 Performance Score
4159 Points (5%)
3DMark 11 - 3DM11 Performance GPU
3749 Points (3%)
171.8 -95%
...
3535 -6%
3553 -5%
Intel UHD Graphics Xe G4 48EUs
3554 -5%
3581 -4%
3587 -4%
3588 -4%
3616 -4%
3638 -3%
AMD Radeon Pro WX 3100
3691 -2%
Intel Graphics 2 Xe3 Wildcat Lake iGPU
3749
3761 0%
3761 0%
3913 4%
3949 5%
3979 6%
Intel Iris Plus Graphics G7 (Ice Lake 64 EU)
3996 7%
4070 9%
AMD Radeon 540X
4097 9%
4116 10%
...
NVIDIA RTX PRO 5000 Blackwell Generation Laptop
68271 1721%
max:
NVIDIA GeForce RTX 5090
129772 3362%
0%
100%
Restrict / Search: Model: Max. age: years
Cinebench R15
Cinebench R15 OpenGL 64 Bit +
Cinebench R15 - Cinebench R15 OpenGL 64 Bit
115.3 fps (7%)
Cinebench R15 OpenGL Ref. Match 64 Bit +
Cinebench R15 - Cinebench R15 OpenGL Ref. Match 64 Bit
97.8 % (98%)
Basemark GPU 1.2 - Basemark GPU 1.2 Vulkan Official Medium Offscreen 1080
104.6 fps (3%)
Basemark GPU 1.2 - Basemark GPU 1.2 Vulkan Official High Offscreen 2160
3.6 fps (1%)
Geekbench 6.7 - Geekbench 6.7.1 GPU OpenCL
12805 punti (3%)
Geekbench 6.7 - Geekbench 6.7.1 GPU Vulkan
13821 punti (3%)
Power Consumption - Furmark Stress Test Power Consumption - external Monitor *
19.8 Watt (3%)
05101520Tooltip
Power Consumption - Cyberpunk 2077 Power Consumption 150cd *
38.1 Watt (11%)
051015202530354045Tooltip
Power Consumption - Cyberpunk 2077 Power Consumption - external Monitor *
33.8 Watt (4%)
05101520253035Tooltip
- Valori di benchmark per questa scheda grafica
red legend - Valori medi di benchmark per questa scheda grafica
* Numeri più piccoli rappresentano prestazioni supeiori

Benchmarks per i giochi

I seguenti benchmarks deirivano dai benchmarks dei portatili recensiti. Le prestazioni dipendono dalla scheda grafica utilizzata, dal clock rate, dal processore, dai settaggi di sistema, dai drivers, e dai sistemi operativi. Quindi i risultati non sono rappresentativi per i portatili con questa GPU. Per informazioni dettagliate sui risultati del benchmark, cliccate sul numero di fps.

F1 24

F1 24

2024
basso 1920x1080
36.6  fps    + Confronta
medio 1920x1080
32.3  fps    + Confronta
alto 1920x1080
25.2  fps    + Confronta
ultra 1920x1080
17.2  fps    + Confronta
» Giocabile con tutti i portatili testati con dettagli basso.
basso 1920x1080
20.6  fps    + Confronta
medio 1920x1080
15.3  fps    + Confronta
alto 1920x1080
13  fps    + Confronta
ultra 1920x1080
10.8  fps    + Confronta
» Il Benchmark indica che il gioco non è utilizzabile con i settaggi testati.
Additional Benchmarks
Low Preset (FSR off) 1280x720
34.7
30min Start Ultra Preset (FSR off) 1920x1080
10.6
basso 1920x1080
17.1  fps    + Confronta + 📈 Graph
medio 1920x1080
13.9  fps    + Confronta + 📈 Graph
alto 1920x1080
12  fps    + Confronta + 📈 Graph
ultra 1920x1080
11.8  fps    + Confronta + 📈 Graph
» Il Benchmark indica che il gioco non è utilizzabile con i settaggi testati.
Additional Benchmarks
Low Preset SMAA 1280x720
26.9
Strange Brigade

Strange Brigade

2018
basso 1280x720
92  fps    + Confronta
medio 1920x1080
36.8  fps    + Confronta
alto 1920x1080
29.1  fps    + Confronta
ultra 1920x1080
25.5  fps    + Confronta
» Giocabile con tutti i portatili testati con dettagli medio.
basso 1280x720
32.6  fps    + Confronta
medio 1920x1080
26.2  fps    + Confronta
alto 1920x1080
17.8  fps    + Confronta
» Il Benchmark indica che il gioco non è utilizzabile con i settaggi testati.
basso 1280x720
39.4  fps    + Confronta
medio 1920x1080
20.3  fps    + Confronta
alto 1920x1080
15.2  fps    + Confronta
» Giocabile con tutti i portatili testati con dettagli basso.
basso 1280x720
99.2  fps    + Confronta
medio 1366x768
75.6  fps    + Confronta
alto 1920x1080
34.9  fps    + Confronta
ultra 1920x1080
32.8  fps    + Confronta
» Giocabile con tutti i portatili testati con dettagli medio.
GTA V

GTA V

2015
basso 1024x768
106.1  fps    + Confronta
medio 1366x768
98.1  fps    + Confronta
alto 1920x1080
27.2  fps    + Confronta
ultra 1920x1080
10.5  fps    + Confronta
» Giocabile con tutti i portatili testati con dettagli medio.
Additional Benchmarks
Normal/Off 4xAF 1920x1080
78.7
Lowest Settings possible 1920x1080
83.9
bassomedioaltoultraQHD4K
F1 2436.632.325.217.2
Cyberpunk 207720.615.31310.8
Baldur's Gate 317.113.91211.8
Strange Brigade9236.829.125.5
X-Plane 11.1132.626.217.8
Final Fantasy XV Benchmark39.420.315.2
Dota 2 Reborn99.275.634.932.8
GTA V106.198.127.210.5
bassomedioaltoultraQHD4K
< 30 fps
< 60 fps
< 120 fps
≥ 120 fps
2
3
3
4
2
2
7
1

5
1


Per conoscere altri giochi che potrebbero essere utilizzabili e per una lista completa di tutti i giochi e delle schede grafiche visitate la nostra Gaming List

v1.35
log 19. 03:22:38

#0 ran 1s before starting gpusingle class +0s ... 0s

#1 no ids found in url (should be separated by "_") +0s ... 0s

#2 not redirecting to Ajax server +0s ... 0s

#3 did not recreate cache, as it is less than 5 days old! Created at Thu, 16 Jul 2026 05:32:19 +0200 +0.004s ... 0.004s

#4 no comparison url found in template nbc.compare_page_1 needed +0.015s ... 0.019s

#5 composed specs +0s ... 0.019s

#6 did output specs +0s ... 0.019s

#7 start showIntegratedCPUs +0s ... 0.019s

#8 getting avg benchmarks for device 13534 +0.02s ... 0.039s

#9 got single benchmarks 13534 +0.011s ... 0.05s

#10 got avg benchmarks for devices +0s ... 0.05s

#11 min, max, avg, median took s +1.37s ... 1.421s

#12 before gaming benchmark output +0s ... 1.421s

#13 Got 30 rows for game benchmarks. +0.007s ... 1.427s

#14 composed SQL query for gamebenchmarks +0s ... 1.427s

#15 got data and put it in $dataArray +0.005s ... 1.432s

#16 benchmarks composed for output. +0.112s ... 1.544s

#17 no comparison url found in template nbc.compare_page_1 needed +0.347s ... 1.891s

#18 return log +0s ... 1.891s

Google LogoAdd as a preferred source on Google
Mail Logo

Classe 1

Classe 2

GeForce RTX 2080 Super Mobile
RTX PRO 2000 Blackwell Generation Laptop
M5 Max 32-Core GPU *
M1 Max 32-Core GPU *
M1 Max 24-Core GPU *
GeForce RTX 2070 Super Mobile
Radeon 8050S
Radeon RX 5700M *
M1 Pro 16-Core GPU *
Radeon PRO W6600M *
GeForce RTX 2070 Super Max-Q
RTX PRO 1000 Blackwell Generation Laptop *
M1 Pro 14-Core GPU *
Radeon 8040S *
Pro A60M *

Classe 3

GeForce RTX 3050 4GB Laptop GPU
Pro A30M
Radeon Pro 5300M
Radeon RX 5300M
GeForce GTX 1050 Ti Mobile
GeForce GTX 1050 Ti Max-Q
Radeon 680M
Arc 130T
GeForce GTX 1050 Max-Q
Radeon 660M
Radeon Pro 560X
Radeon Pro 560
Quadro P620
Radeon RX 550X (Laptop)
Radeon Pro 555X
Radeon Pro 555
Graphics 3-Core iGPU (Arrow Lake) *
Graphics 2-Core iGPU (Arrow Lake) *
Radeon 630
Quadro P520
Radeon 540X *
Vega 10
Vega 9
UHD Graphics 32EUs
UHD Graphics 750
Vega 7
UHD Graphics Xe 32EUs (Tiger Lake-H)
UHD Graphics Xe G4 48EUs
Vega 8
UHD Graphics 730
UHD Graphics 24EUs (Alder Lake-N) *
Radeon 610M *
UHD Graphics Xe 16EUs *
Adreno 690 *
Adreno 685 *
Adreno 680 *

Classe 4

Posizione approssimativa dell'adattatore grafico

Klaus Hinum, 2026-04-19 (Update: 2026-04-19)