Recensioni Notebook con NVIDIA GeForce RTX 2080 Max-Q la scheda grafica
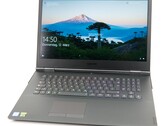
Recensione del Laptop Lenovo Legion Y740-17IRHg con GPU GeForce RTX 2080 Max-Q
I gamers gioiscono! Il Lenovo Legion Y740-17 offre prestazioni gaming elevate e vari elementi RGB per completare il design. In questa recensione, cercheremo di scoprire se ci sono degli inconvenienti esaminando numerose misure e benchmarks.
Intel Core i7-9750H, NVIDIA GeForce RTX 2080 Max-Q, 17.3", 3 kgRecensione del Laptop Dell Alienware m17 R2: valorizza il Core i9
L'Alienware m17 R2 riprogettato, che contiene sia una CPU Core i9-9980HK che una GPU GeForce RTX 2080 Max-Q nel telaio più sottile mai realizzato per la vecchia serie. Avevamo previsto prestazioni deboli per tenere sotto controllo le temperature, ma il sistema ci ha sorpreso per la sua velocità superiore alla media anche per un portatile da gioco di fascia alta.
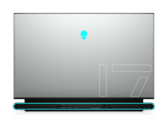
Intel Core i9-9980HK, NVIDIA GeForce RTX 2080 Max-Q, 17.3", 2.6 kgRecensione del Laptop Asus ROG Zephyrus S GX701GXR: sottile portatile gaming con un veloce display 300 Hz
L'hardware dello Zephyrus S GX701GXR gestisce tutti i giochi attuali senza problemi sul display IPS opaco a 300 Hz. Il portatile offre possibilità di espansione/aggiornamento solo in misura molto limitata.
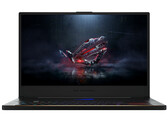
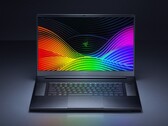
Intel Core i7-9750H, NVIDIA GeForce RTX 2080 Max-Q, 17.3", 2.7 kgRecensione del Laptop Razer Blade Pro 17 4K UHD 120 Hz: Finalmente un display da 17" 4K quasi senza Ghosting
Il pannello AU Optronics B173ZAN03.3 fa il suo debutto sul portatile Razer per offrire velocità di aggiornamento e tempi di risposta in bianco e nero più veloci di qualsiasi altro portatile da 17,3 pollici prima di lui. Il risultato finale è una migliore esperienza di gioco 4K rispetto a quello che altri laptop da 17,3 pollici hanno attualmente da offrire.
Intel Core i7-9750H, NVIDIA GeForce RTX 2080 Max-Q, 17.3", 2.8 kgArea-51m mini-me: Recensione del Laptop Dell Alienware m15 R2
Se avete mai desiderato un desktop replacement Alienware Area-51m da 17,3 pollici ma desiderate che fosse più piccolo, allora l'Alienware m15 R2 da 15,6 pollici dovrebbe andare bene. Il nuovo modello è una revisione completa del design dell'Alienware m15 R1 dello scorso anno, che purtroppo sembra più un passo di lato che un grande balzo in avanti.
Intel Core i7-9750H, NVIDIA GeForce RTX 2080 Max-Q, 15.6", 2.2 kgSchenker Key 16: Intel Core i7-8750H, 16.10", 2.2 kg
recensione » Recensione del Computer portatile Schenker Key 16 (Clevo P960EN-K): un notebook sottile con elevata potenza di calcolo
Origin PC EVO16-S i7-9750H RTX 2080 Max-Q: Intel Core i7-9750H, 16.10", 2.1 kg
recensione » Recensione del Computer portatile Origin PC EVO16-S (Clevo P960RD): un raro 16.1" Gaming
MSI GS75 Stealth 9SG: Intel Core i7-9750H, 17.30", 2.3 kg
recensione » Recensione del Computer Portatile MSI GS75 Stealth 9SG: un portatile gaming sottile e potente con una buona autonomia
Razer Blade Pro 17 RTX 2080 Max-Q: Intel Core i7-9750H, 17.30", 2.8 kg
recensione » Molto meglio rispetto a prima: Recensione del Computer portatile Razer Blade Pro 17
MSI GS65 Stealth 9SG: Intel Core i7-9750H, 15.60", 2 kg
recensione » Recensione del Computer Portatile MSI GS65 Stealth 9SG (i7-9750H, RTX 2080 Max-Q)
Razer Blade 15 RTX 2080 Max-Q: Intel Core i7-9750H, 15.60", 2.2 kg
recensione » Recensione del Computer Portatile Razer Blade 15 Advanced Model (i7-9750H, RTX 2080 Max-Q, 240 Hz)
Alienware m17 P37E: Intel Core i9-8950HK, 17.30", 2.6 kg
recensione » Recensione del Computer Portatile Alienware m17 (i9-8950HK, RTX 2080 Max-Q, 4K UHD)
Asus Zephyrus S GX531GX: Intel Core i7-8750H, 15.60", 2.1 kg
recensione » Recensione del Computer Portatile Asus Zephyrus S GX531GX (i7-8750H, RTX 2080 Max-Q)
MSI GS75 8SG Stealth: Intel Core i7-8750H, 17.30", 2.3 kg
recensione » Recensione del Computer Portatile MSI GS75 8SG Stealth (i7-8750H, RTX 2080 Max-Q)
Gigabyte Aero 15-Y9: Intel Core i9-8950HK, 15.60", 2.1 kg
recensione » Recensione del Computer Portatile Gigabyte Aero 15-Y9 (i9-8950HK, RTX 2080 Max-Q)
Lenovo Legion Y740-17ICH: Intel Core i7-8750H, 17.30", 2.8 kg
recensione » Recensione del Portatile Lenovo Legion Y740-17ICH (i7-8750H, RTX 2080 Max-Q)
Asus Zephyrus S GX701GX: Intel Core i7-8750H, 17.30", 2.6 kg
recensione » Recensione del Portatile Asus ROG Zephyrus S GX701GX (i7-8750H, RTX 2080 Max-Q)
Acer Predator Triton 500: Intel Core i7-8750H, 15.60", 2.1 kg
recensione » Recensione del Portatile Acer Predator Triton 500 (i7-8750H, RTX 2080 Max-Q)
Asus Zephyrus S GX701GXR-HG113R: Intel Core i7-9750H, 17.30", 2.6 kg
Recensioni esterne » Asus Zephyrus S GX701GXR-HG113R
HP Omen X 2S 15-dg0004ur: Intel Core i9-9880H, 15.60", 2.5 kg
Recensioni esterne » HP Omen X 2S 15-dg0004ur
Lenovo Legion Y740-17IRHg-81UJ001VGE: Intel Core i7-9750H, 17.30", 3 kg
Recensioni esterne » Lenovo Legion Y740-17IRHg-81UJ001VGE
Alienware m15 R2-N00AWm15R210: Intel Core i7-9750H, 15.60", 2.2 kg
Recensioni esterne » Alienware m15 R2-N00AWm15R210
MSI P75 Creator 9SG-1013NL: Intel Core i9-9880H, 17.30", 2.3 kg
Recensioni esterne » MSI P75 Creator 9SG-1013NL
MSI GS65 Stealth 9SG: Intel Core i7-9750H, 15.60", 2 kg
Recensioni esterne » MSI GS65 Stealth 9SG
Asus ROG Zephyrus S GX701GXR: Intel Core i7-9750H, 17.30", 2.7 kg
Recensioni esterne » Asus ROG Zephyrus S GX701GXR
Alienware m17 R2, i7-9750H, RTX 2080 Max-Q: Intel Core i7-9750H, 17.30", 2.6 kg
Recensioni esterne » Alienware m17 R2, i7-9750H, RTX 2080 Max-Q
HP Omen X2S 15-dg0901ng: Intel Core i7-9750H, 15.60", 2.5 kg
Recensioni esterne » HP Omen X2S 15-dg0901ng
MSI GT76 Titan 9SG-225ID: Intel Core i9-9900K, 17.30", 4.2 kg
Recensioni esterne » MSI GT76 Titan 9SG-225ID
Asus Zephyrus S GX531GXR-AZ044R: Intel Core i7-9750H, 15.60", 2.1 kg
Recensioni esterne » Asus Zephyrus S GX531GXR-AZ044R
Acer Predator Triton 500 PT515-51-75C9: Intel Core i7-9750H, 15.60", 2.1 kg
Recensioni esterne » Acer Predator Triton 500 PT515-51-75C9
Alienware m17 R2-C7XD9: Intel Core i9-9980HK, 17.30", 2.6 kg
Recensioni esterne » Alienware m17 R2-C7XD9
HP Omen 15-dh0009ng: Intel Core i7-9750H, 15.60", 2.6 kg
Recensioni esterne » HP Omen 15-dh0009ng
Asus Zephyrus S GX701GXR-H6081R: Intel Core i7-9750H, 17.30", 2.7 kg
Recensioni esterne » Asus Zephyrus S GX701GXR-H6081R
Alienware m15 R2 P87F: Intel Core i7-9750H, 15.60", 2.2 kg
Recensioni esterne » Alienware m15 R2 P87F
Lenovo Legion Y740-15ICHg-81UH0020GE: Intel Core i7-9750H, 15.60", 2.2 kg
Recensioni esterne » Lenovo Legion Y740-15ICHg-81UH0020GE
Origin PC EVO16-S i7-9750H RTX 2080 Max-Q: Intel Core i7-9750H, 16.10", 2.1 kg
Recensioni esterne » Origin PC EVO16-S i7-9750H RTX 2080 Max-Q
Asus ROG Zephyrus S GX701-EV020T: Intel Core i7-8750H, 17.30", 2.7 kg
Recensioni esterne » Asus ROG Zephyrus S GX701-EV020T
Acer Predator Triton 500 PT515-51-74JA: Intel Core i7-8750H, 15.60", 2 kg
Recensioni esterne » Acer Predator Triton 500 PT515-51-74JA
Razer Blade 15 RTX 2080 Max-Q, Core i7-8750H: Intel Core i7-8750H, 15.60", 2.1 kg
Recensioni esterne » Razer Blade 15 RTX 2080 Max-Q, Core i7-8750H
Origin PC EVO17-S 2019 (i7-9750H, RTX 2080 Max-Q): Intel Core i7-9750H, 17.30", 2.5 kg
Recensioni esterne » Origin PC EVO17-S 2019 (i7-9750H, RTX 2080 Max-Q)
Asus ROG Zephyrus S GX701GXR-EV013R: Intel Core i7-9750H, 17.30", 2.7 kg
Recensioni esterne » Asus ROG Zephyrus S GX701GXR-EV013R
MSI GS65 Stealth-666: Intel Core i9-9880H, 15.60", 2 kg
Recensioni esterne » MSI GS65 Stealth-666
MSI GS75 Stealth 9SG: Intel Core i7-9750H, 17.30", 2.3 kg
Recensioni esterne » MSI GS75 Stealth 9SG
Razer Blade Pro 17 RTX 2080 Max-Q: Intel Core i7-9750H, 17.30", 2.8 kg
Recensioni esterne » Razer Blade Pro 17 RTX 2080 Max-Q
Origin PC EVO16-S (i7-8750H, RTX 2080 Max-Q): Intel Core i7-8750H, 16.10", 2.1 kg
Recensioni esterne » Origin PC EVO16-S (i7-8750H, RTX 2080 Max-Q)
Asus Zephyrus S GX701GX-EV021R: Intel Core i7-8750H, 17.30", 2.7 kg
Recensioni esterne » Asus Zephyrus S GX701GX-EV021R
Acer ConceptD 7: Intel Core i7-9750H, 15.60", 2.1 kg
Recensioni esterne » Acer ConceptD 7
MSI GS65 8SG-005: Intel Core i7-8750H, 15.60", 1.9 kg
Recensioni esterne » MSI GS65 8SG-005
Alienware m15-565K7: Intel Core i9-8950HK, 15.60", 2.2 kg
Recensioni esterne » Alienware m15-565K7
Alienware m17 P37E: Intel Core i9-8950HK, 17.30", 2.6 kg
Recensioni esterne » Alienware m17 P37E
Razer Blade 15 RTX 2080 Max-Q: Intel Core i7-9750H, 15.60", 2.2 kg
Recensioni esterne » Razer Blade 15 RTX 2080 Max-Q
Lenovo Legion Y740-17ICHg-81HH001NGE: Intel Core i7-8750H, 17.30", 2.9 kg
Recensioni esterne » Lenovo Legion Y740-17ICHg-81HH001NGE
Asus Zephyrus S GX531GX: Intel Core i7-8750H, 15.60", 2.1 kg
Recensioni esterne » Asus Zephyrus S GX531GX
Asus Zephyrus S GX701GX-EV064T: Intel Core i7-8750H, 17.30", 2.6 kg
Recensioni esterne » Asus Zephyrus S GX701GX-EV064T
Gigabyte Aero 15-Y9: Intel Core i9-8950HK, 15.60", 2.1 kg
Recensioni esterne » Gigabyte Aero 15-Y9
Asus Zephyrus S GX531GX-ES036R: Intel Core i7-8750H, 15.60", 2.1 kg
Recensioni esterne » Asus Zephyrus S GX531GX-ES036R
Gigabyte Aero 15 Y9-9UK4720P: Intel Core i9-8950HK, 15.60", 2 kg
Recensioni esterne » Gigabyte Aero 15 Y9-9UK4720P
Acer Predator Triton 500: Intel Core i7-8750H, 15.60", 2.1 kg
Recensioni esterne » Acer Predator Triton 500
Lenovo Legion Y740-17ICH: Intel Core i7-8750H, 17.30", 2.8 kg
Recensioni esterne » Lenovo Legion Y740-17ICH
Asus Zephyrus S GX701GX: Intel Core i7-8750H, 17.30", 2.6 kg
Recensioni esterne » Asus Zephyrus S GX701GX
MSI GS65 8SG-055: Intel Core i7-8750H, 15.60", 1.9 kg
Recensioni esterne » MSI GS65 8SG-055
MSI GS75 8SG Stealth: Intel Core i7-8750H, 17.30", 2.3 kg
Recensioni esterne » MSI GS75 8SG Stealth