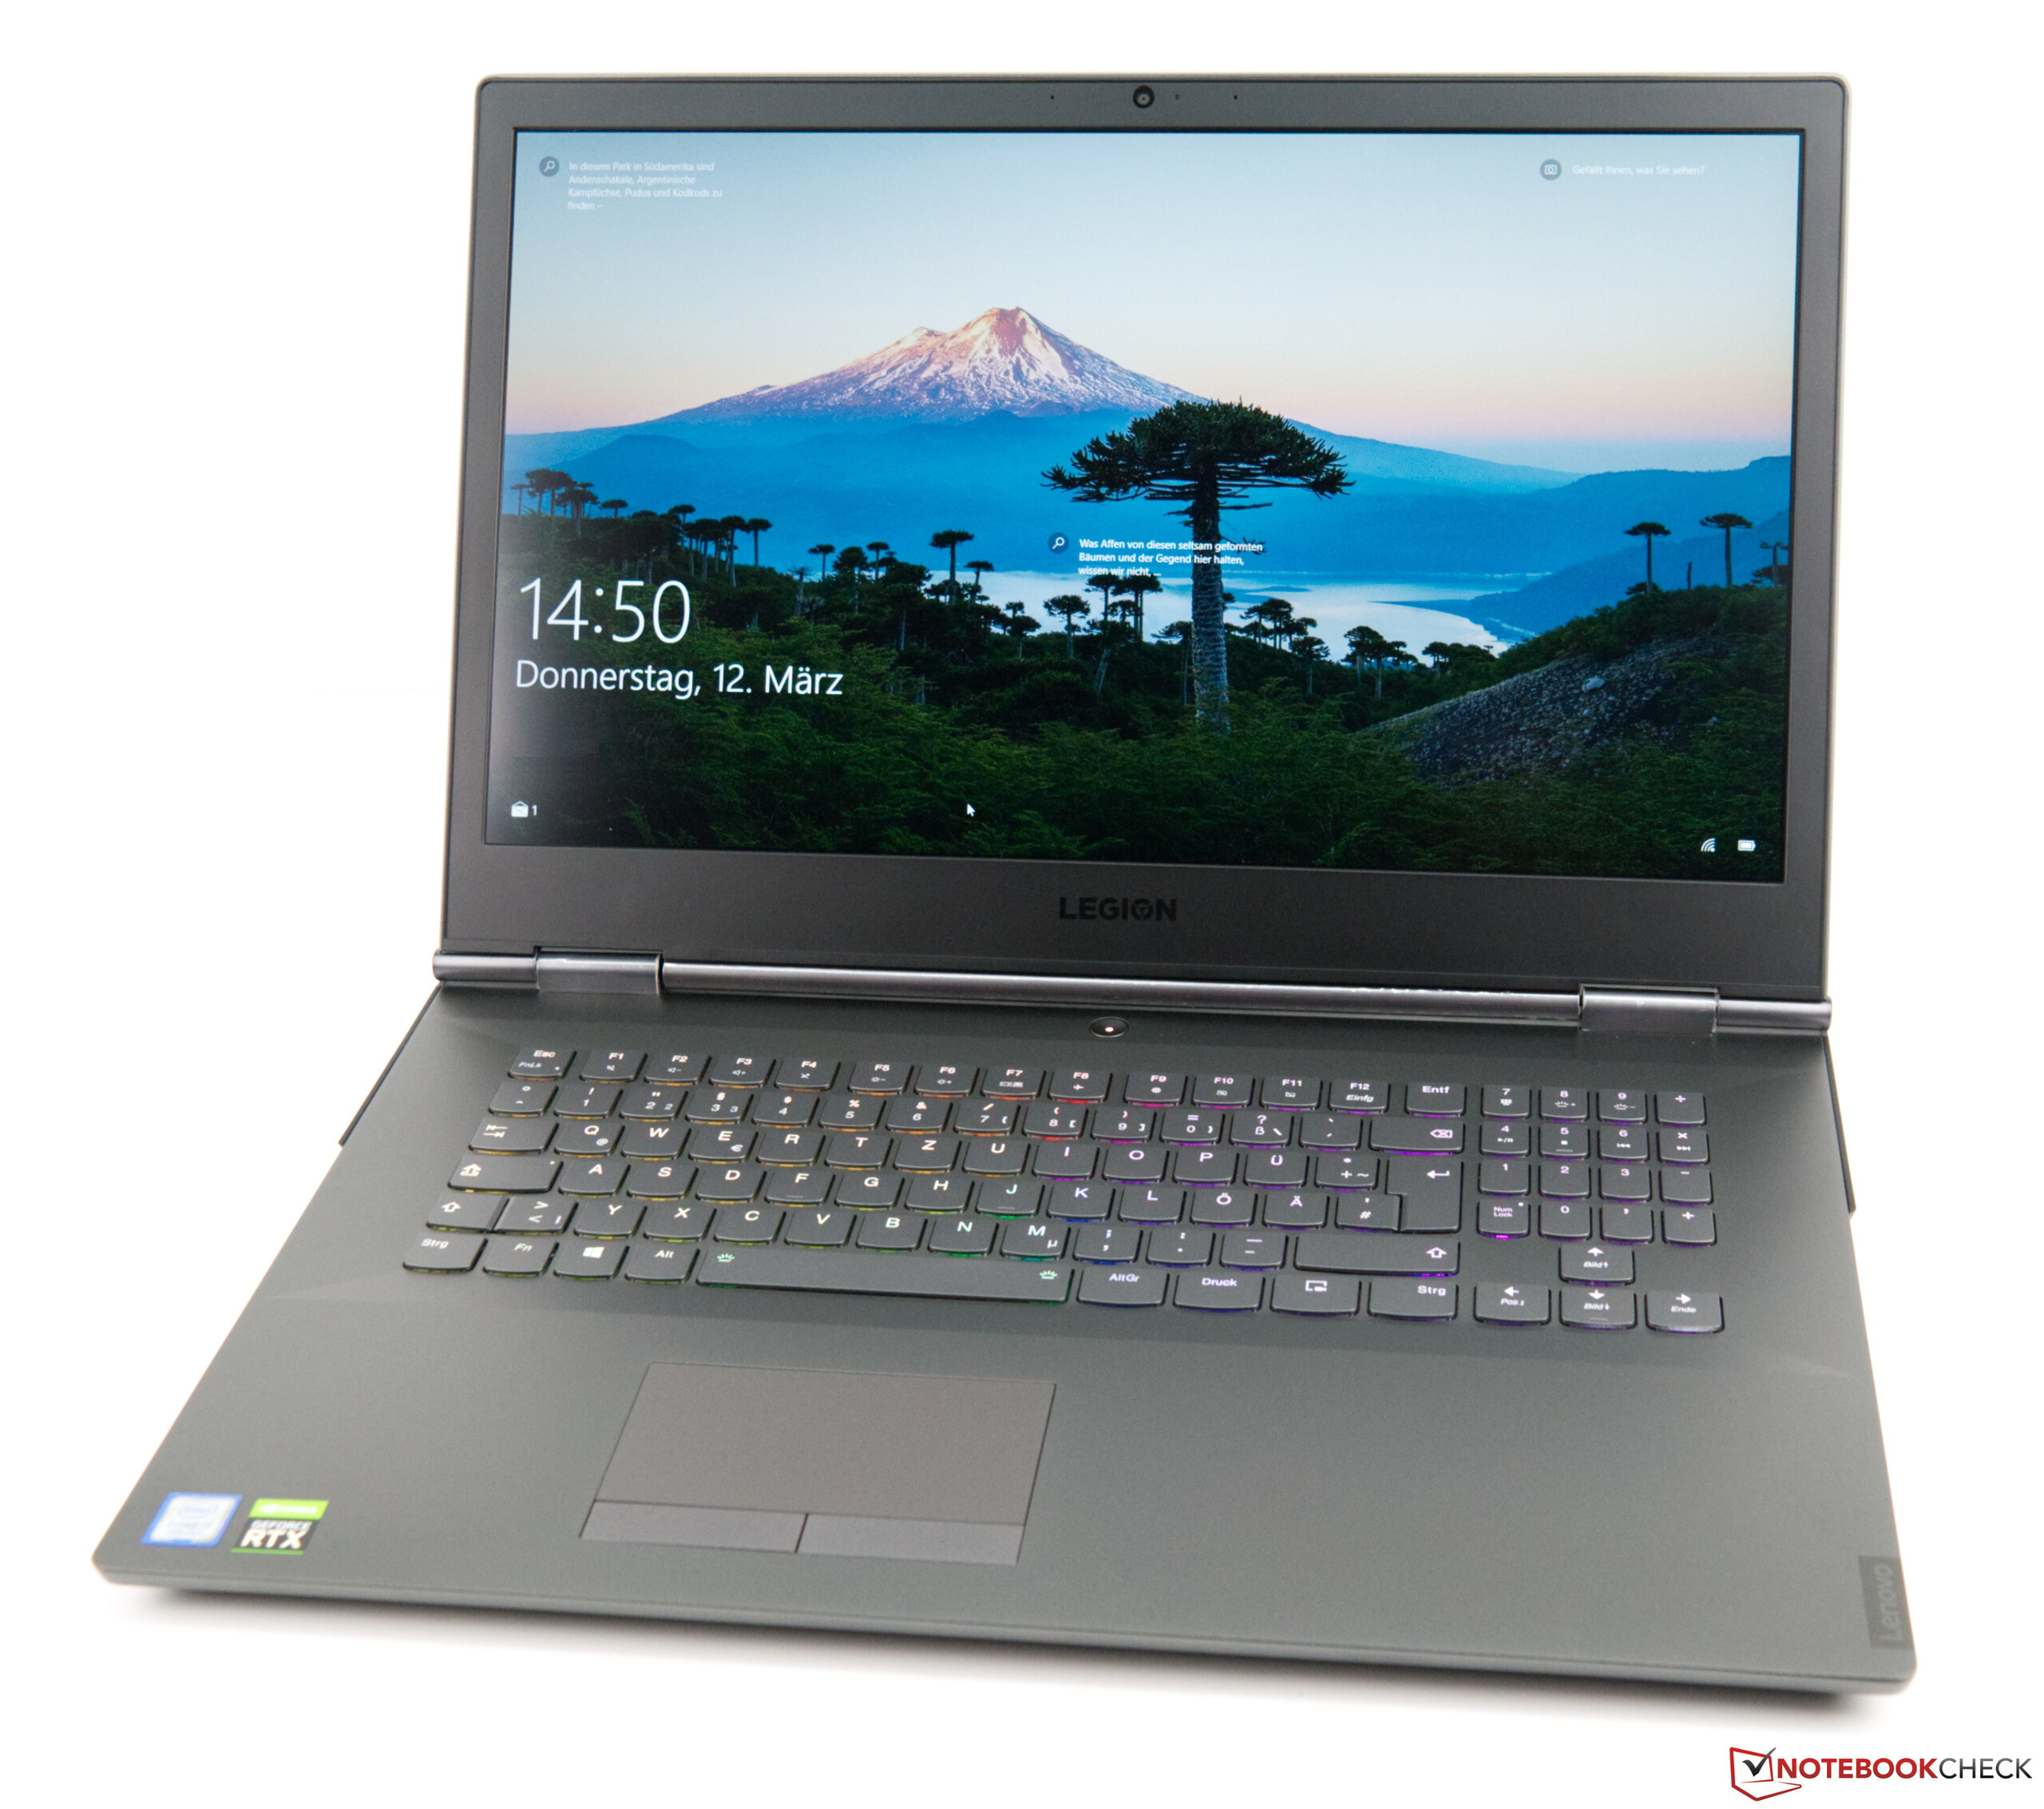
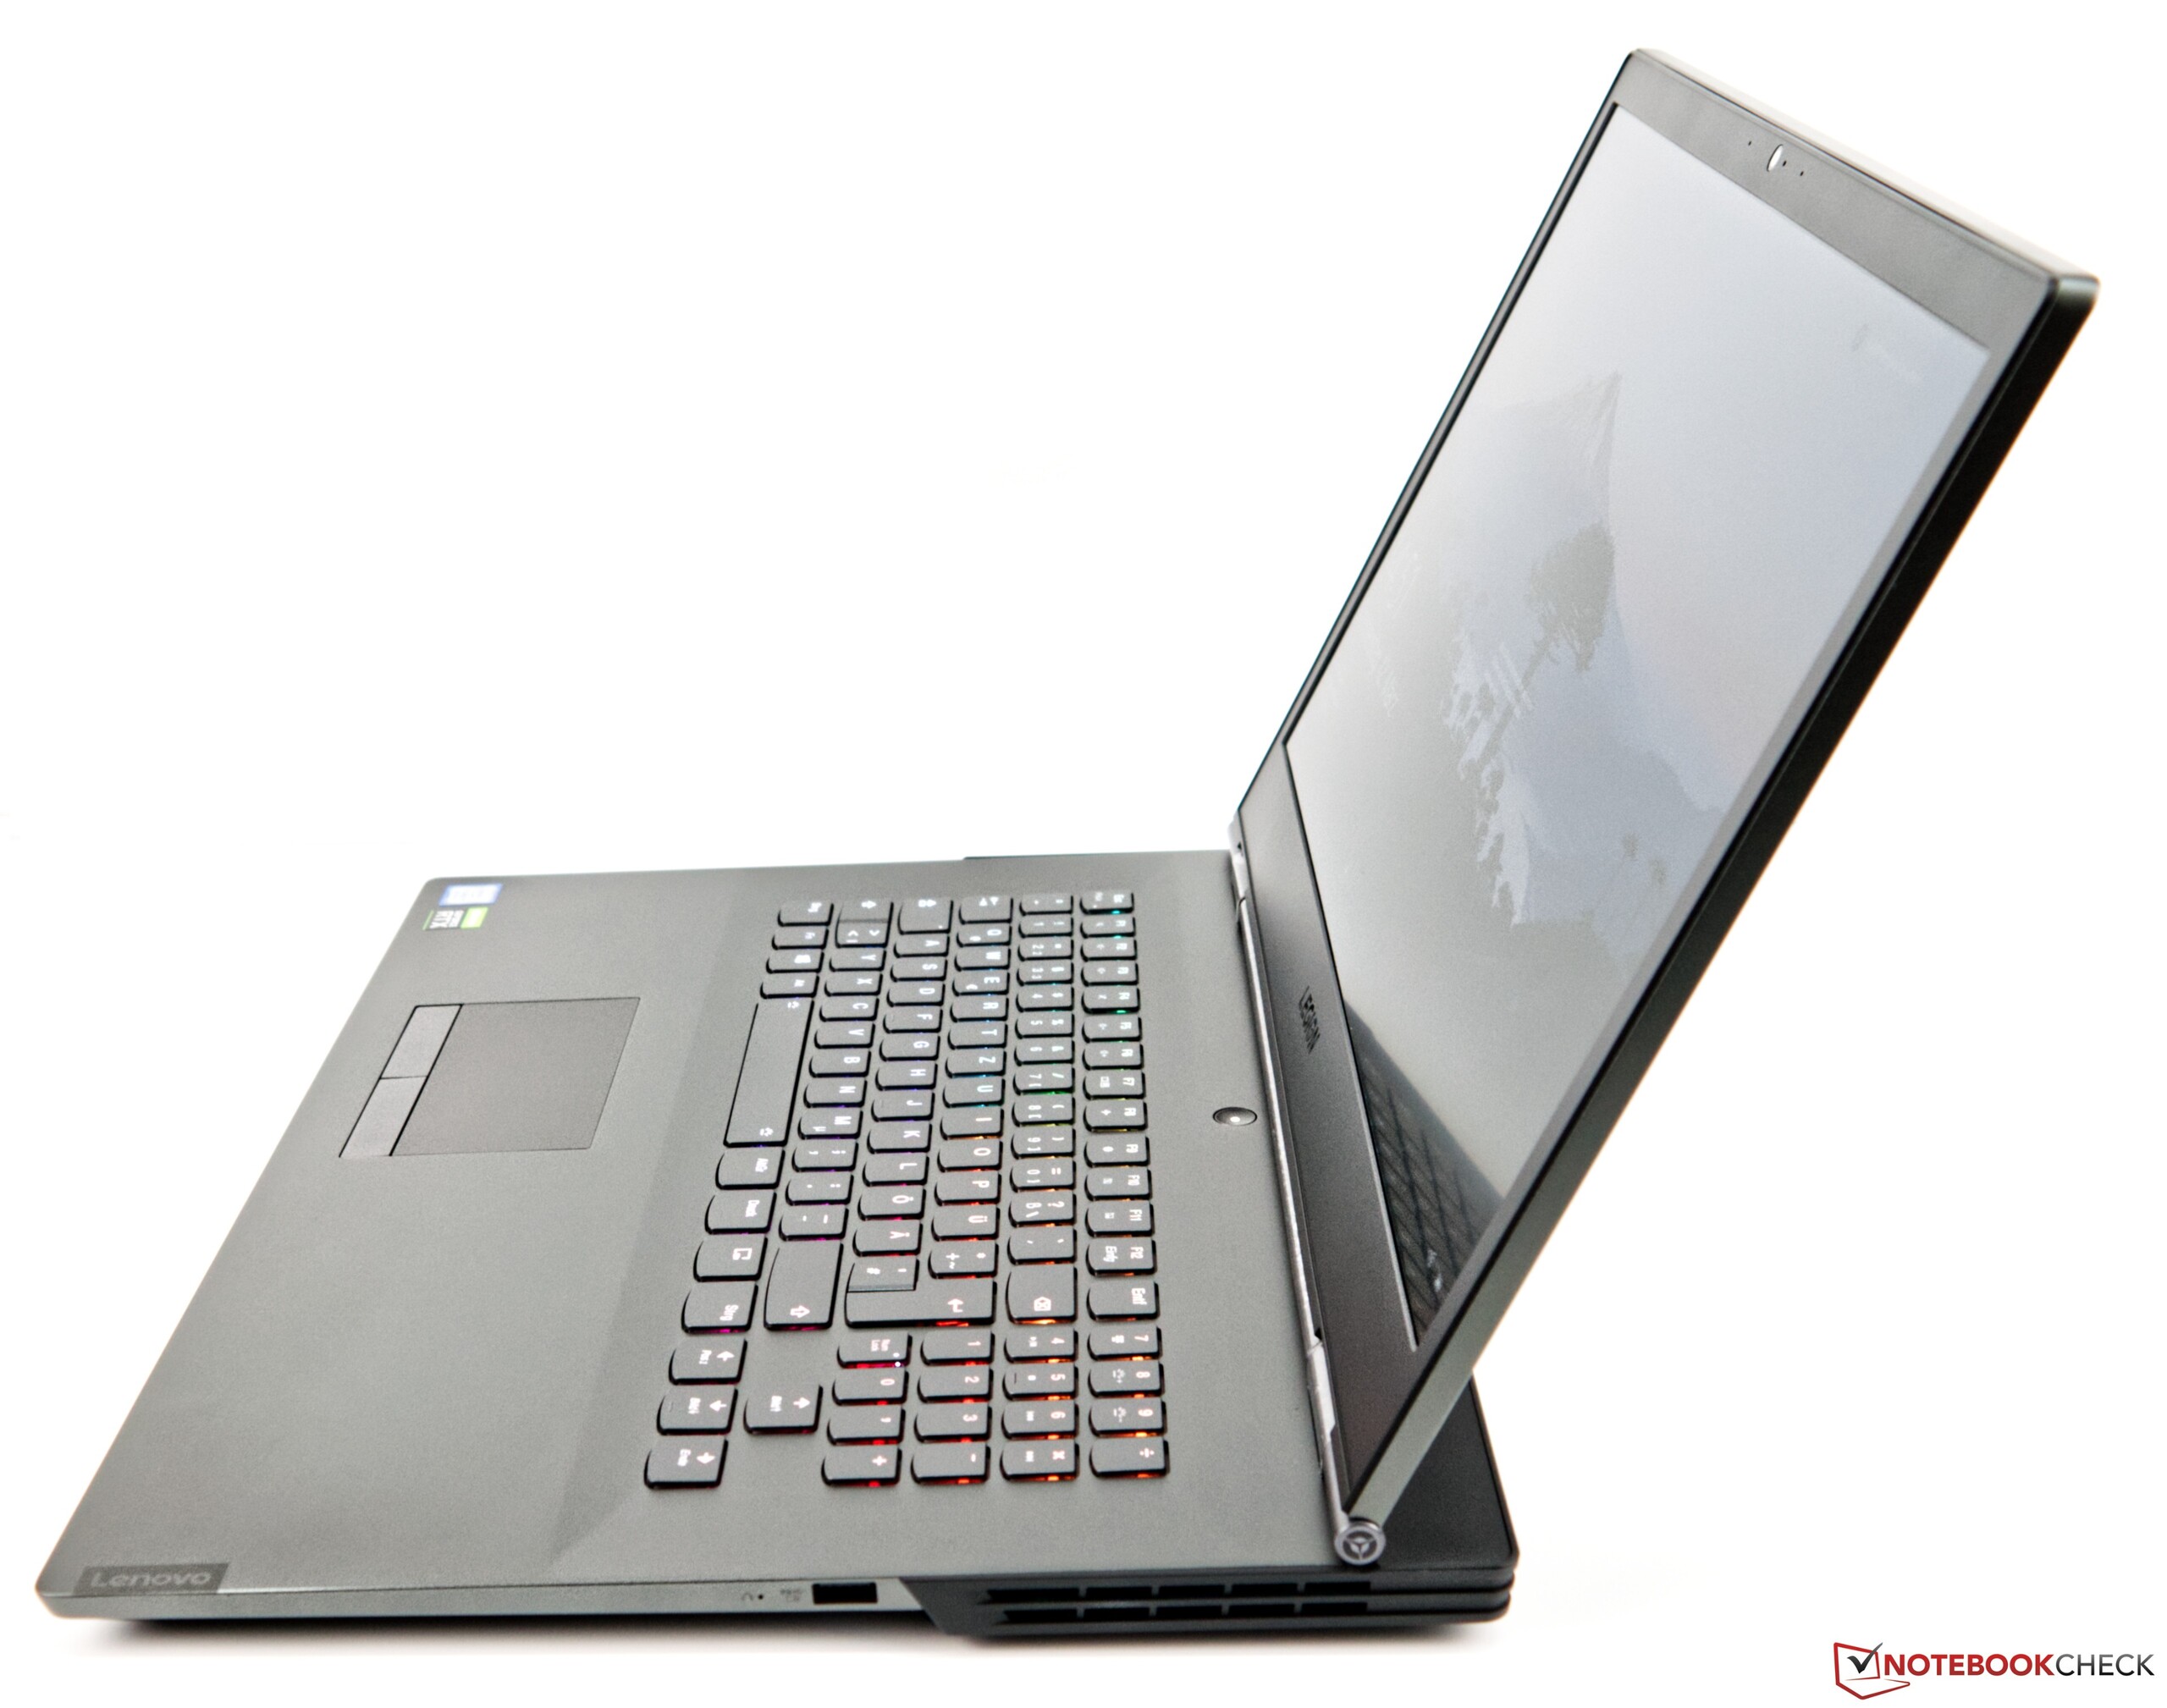
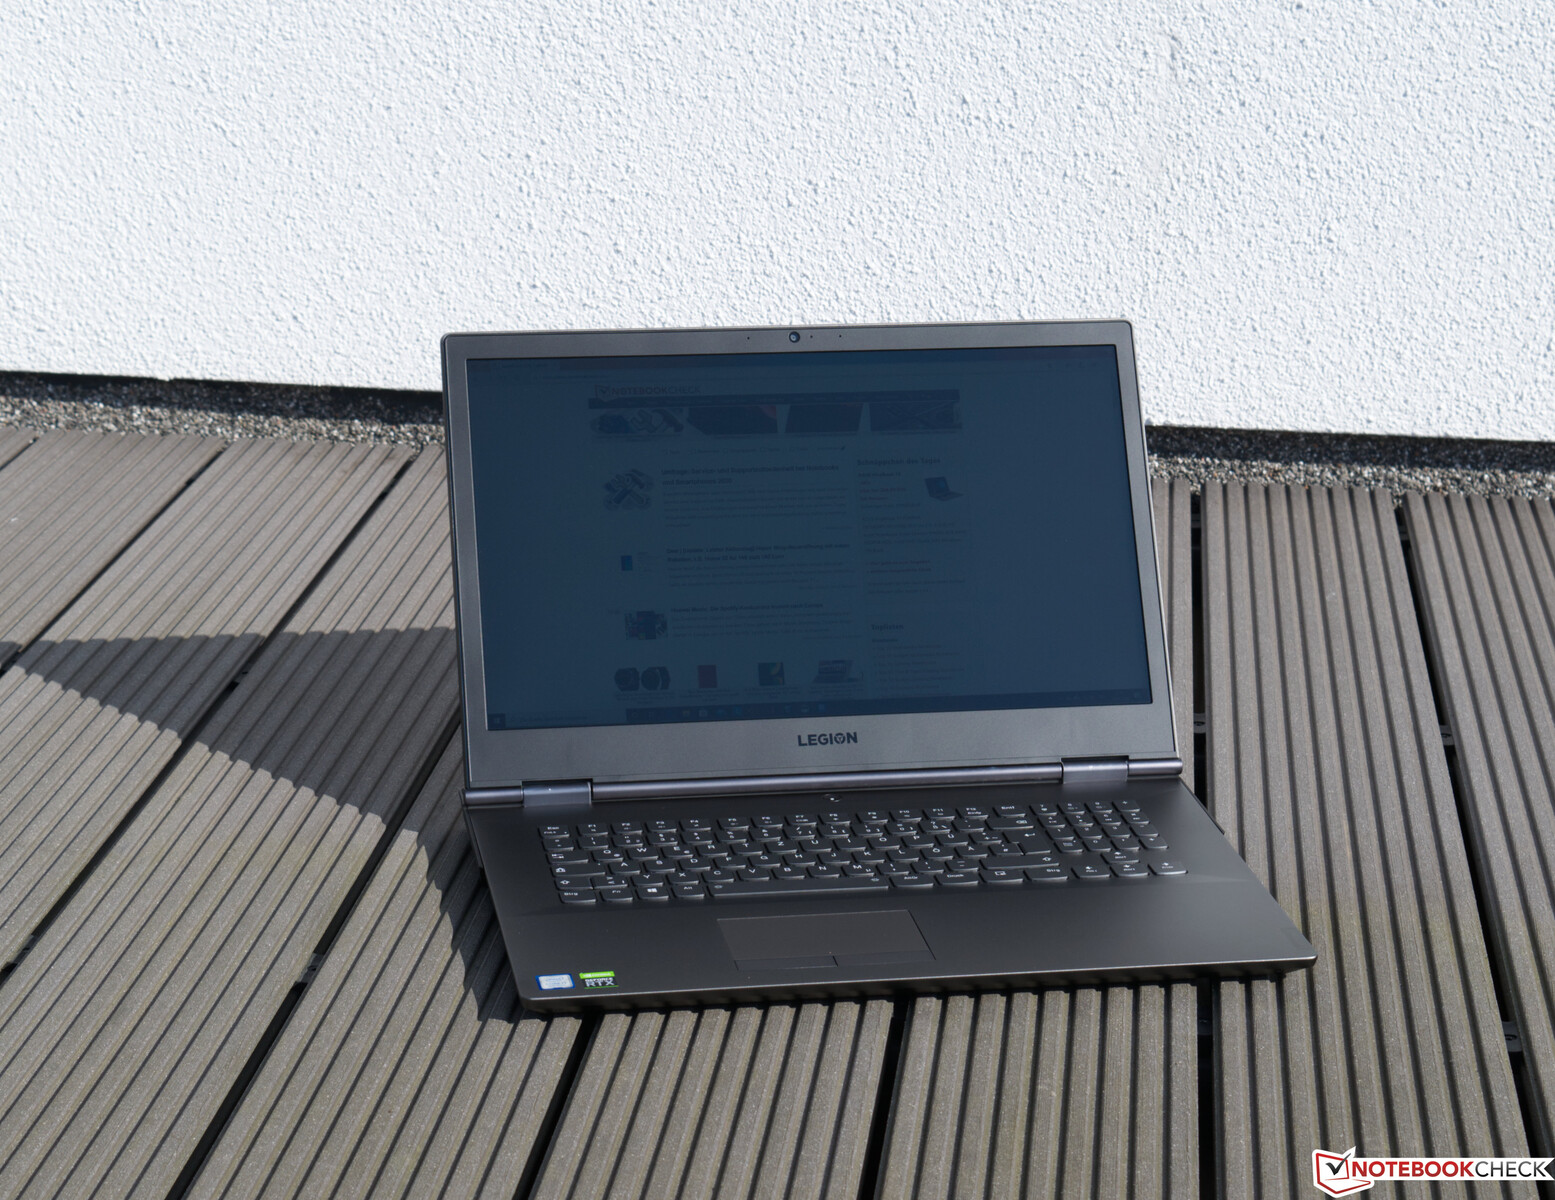
Recensione del Laptop Lenovo Legion Y740-17IRHg con GPU GeForce RTX 2080 Max-Q
Punteggio | Data | Modello | Peso | Altezza | Dimensione | Risoluzione | Prezzo |
|---|---|---|---|---|---|---|---|
| 84 % v7 (old) | 03/2020 | Lenovo Legion Y740-17IRHg-81UJ001VGE i7-9750H, GeForce RTX 2080 Max-Q | 3 kg | 25.5 mm | 17.30" | 1920x1080 | |
| 86.7 % v7 (old) | 11/2019 | Razer Blade Pro 17 4K UHD 120 Hz i7-9750H, GeForce RTX 2080 Max-Q | 2.8 kg | 19.9 mm | 17.30" | 3840x2160 | |
| 84.2 % v7 (old) | 02/2020 | Alienware m17 R2 P41E i9-9980HK, GeForce RTX 2080 Max-Q | 2.6 kg | 20.5 mm | 17.30" | 1920x1080 | |
| 81.2 % v7 (old) | 12/2019 | Asus ROG Zephyrus S GX701GXR i7-9750H, GeForce RTX 2080 Max-Q | 2.7 kg | 18.7 mm | 17.30" | 1920x1080 |
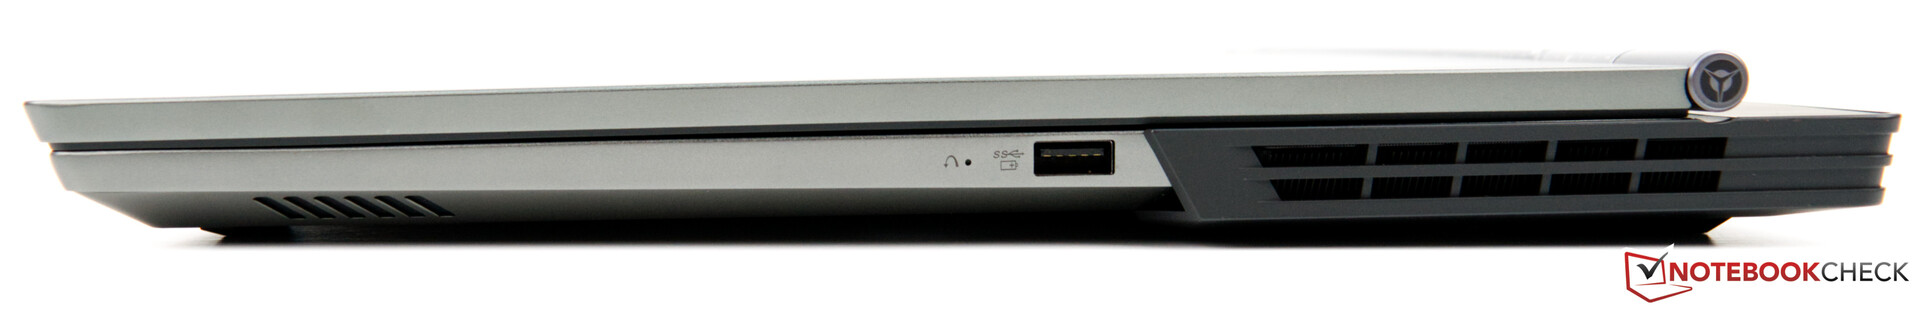
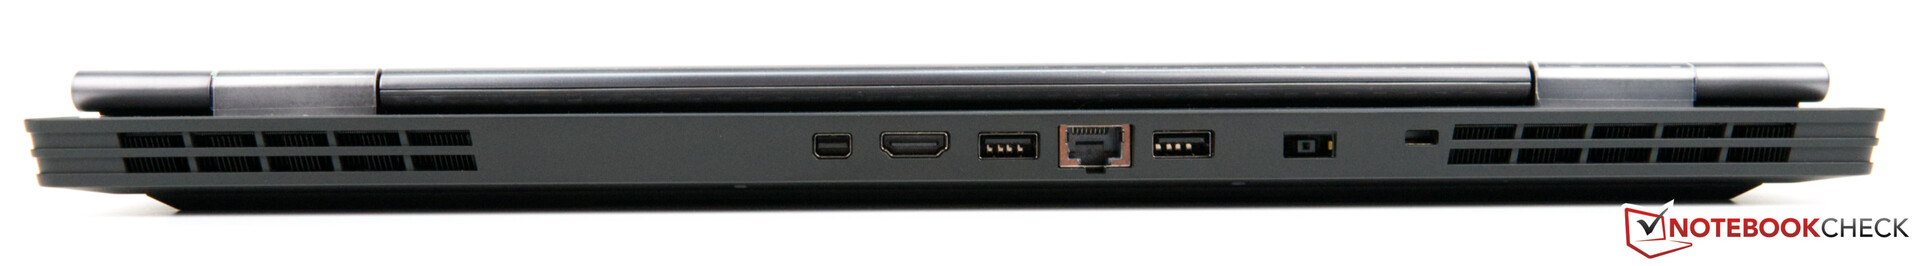
Connessioni


| |||||||||||||||||||||||||
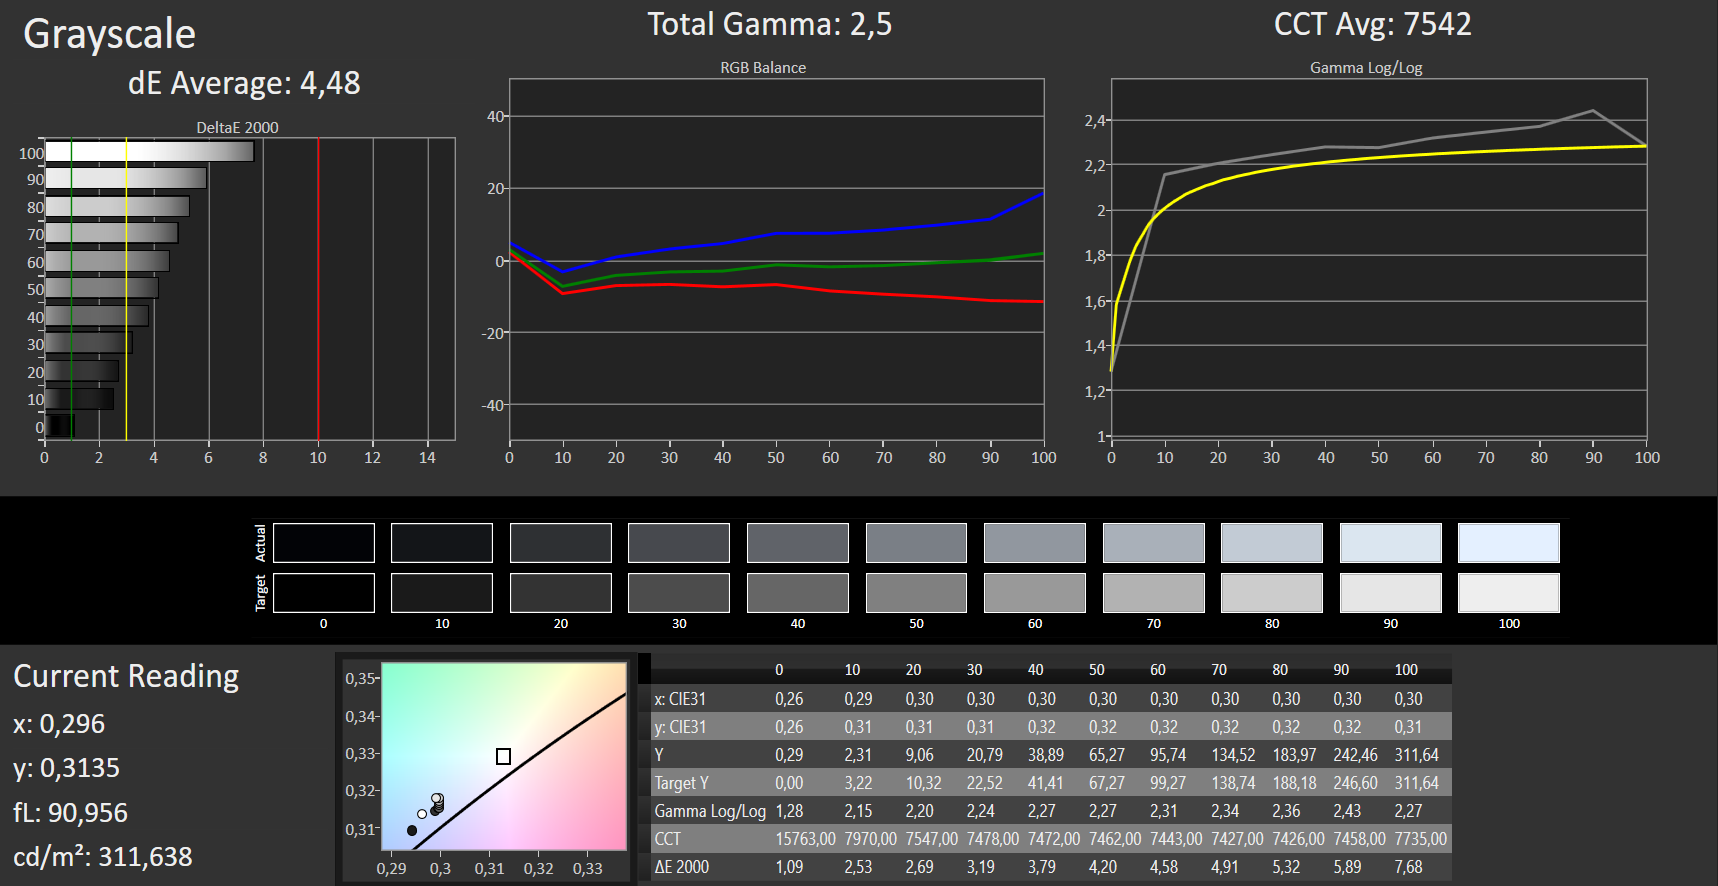
Distribuzione della luminosità: 85 %
Al centro con la batteria: 310 cd/m²
Contrasto: 1000:1 (Nero: 0.31 cd/m²)
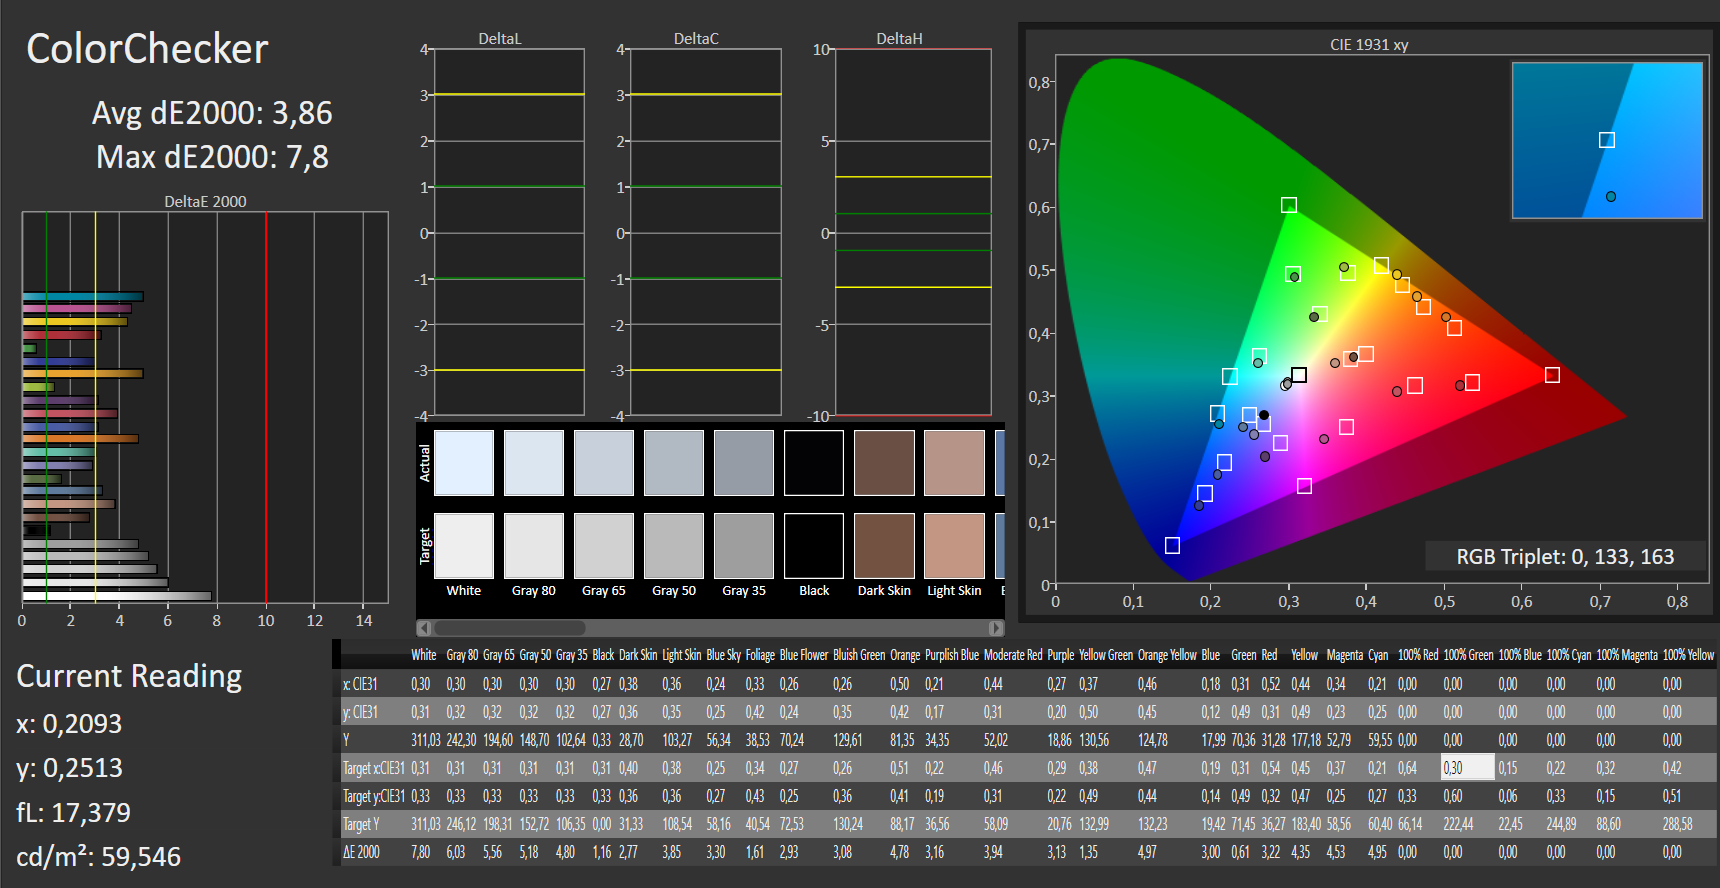
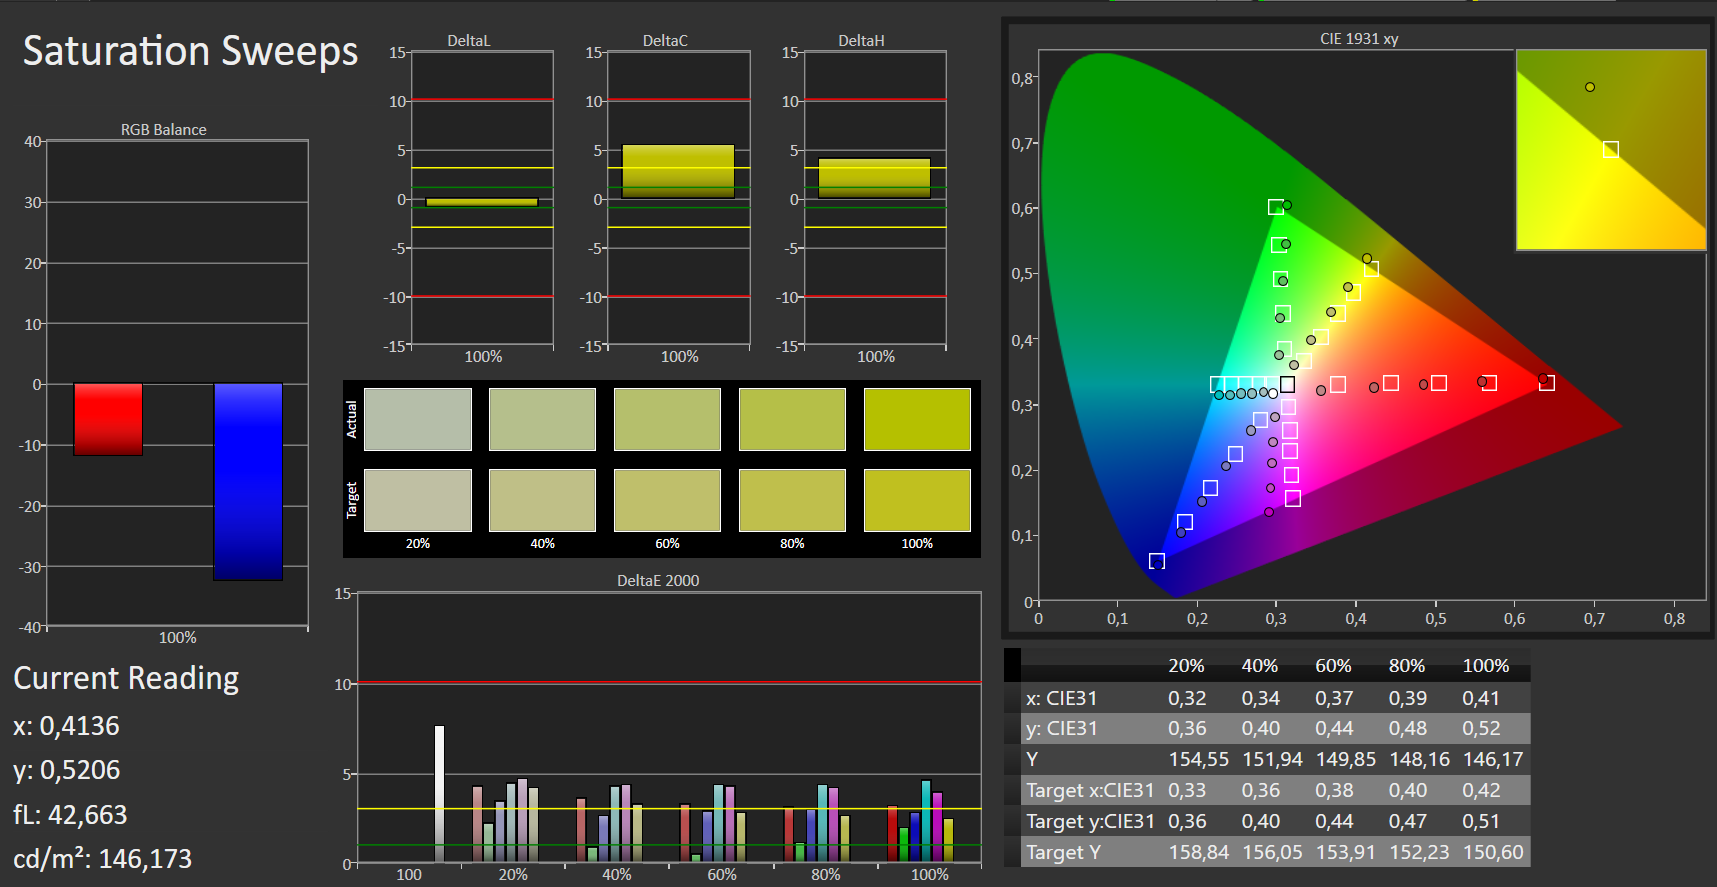
ΔE ColorChecker Calman: 3.86 | ∀{0.5-29.43 Ø4.73}
ΔE Greyscale Calman: 4.48 | ∀{0.09-98 Ø4.97}
93% sRGB (Argyll 1.6.3 3D)
60% AdobeRGB 1998 (Argyll 1.6.3 3D)
65.3% AdobeRGB 1998 (Argyll 3D)
92.7% sRGB (Argyll 3D)
63.8% Display P3 (Argyll 3D)
Gamma: 2.5
CCT: 7542 K
| Lenovo Legion Y740-17IRHg-81UJ001VGE AUO_B173HAN03, IPS, 1920x1080, 17.3" | Razer Blade Pro 17 4K UHD 120 Hz AU Optronics B173ZAN03.3, IPS, 3840x2160, 17.3" | Alienware m17 R2 P41E Chi Mei 173HCE, CMN175F, IPS, 1920x1080, 17.3" | Asus ROG Zephyrus S GX701GXR AU Optronics B173HAN05.1, IPS, 1920x1080, 17.3" | |
|---|---|---|---|---|
| Display | 31% | 9% | 8% | |
| Display P3 Coverage (%) | 63.8 | 84.8 33% | 70.8 11% | 70 10% |
| sRGB Coverage (%) | 92.7 | 99.9 8% | 98.5 6% | 96.6 4% |
| AdobeRGB 1998 Coverage (%) | 65.3 | 98.6 51% | 72.2 11% | 72.3 11% |
| Response Times | 5% | -3% | 48% | |
| Response Time Grey 50% / Grey 80% * (ms) | 16 ? | 15.2 ? 5% | 17.2 ? -8% | 5.6 ? 65% |
| Response Time Black / White * (ms) | 11 ? | 10.4 ? 5% | 10.8 ? 2% | 7.6 ? 31% |
| PWM Frequency (Hz) | 26320 ? | |||
| Screen | 4% | 31% | 18% | |
| Brightness middle (cd/m²) | 310 | 346.7 12% | 384.2 24% | 288 -7% |
| Brightness (cd/m²) | 281 | 332 18% | 357 27% | 276 -2% |
| Brightness Distribution (%) | 85 | 91 7% | 90 6% | 93 9% |
| Black Level * (cd/m²) | 0.31 | 0.27 13% | 0.29 6% | 0.24 23% |
| Contrast (:1) | 1000 | 1284 28% | 1325 33% | 1200 20% |
| Colorchecker dE 2000 * | 3.86 | 5.62 -46% | 1.35 65% | 1.92 50% |
| Colorchecker dE 2000 max. * | 7.8 | 9.36 -20% | 3.45 56% | 4.57 41% |
| Greyscale dE 2000 * | 4.48 | 5.5 -23% | 1.2 73% | 3.08 31% |
| Gamma | 2.5 88% | 2.25 98% | 2.23 99% | 2.42 91% |
| CCT | 7542 86% | 6175 105% | 6580 99% | 7055 92% |
| Color Space (Percent of AdobeRGB 1998) (%) | 60 | 87.2 45% | 65.5 9% | 65 8% |
| Color Space (Percent of sRGB) (%) | 93 | 100 8% | 98.5 6% | 96 3% |
| Colorchecker dE 2000 calibrated * | 3.81 | 1.42 | 1.14 | |
| Media totale (Programma / Settaggio) | 13% /
10% | 12% /
22% | 25% /
20% |
* ... Meglio usare valori piccoli
Tempi di risposta del Display
| ↔ Tempi di risposta dal Nero al Bianco | ||
|---|---|---|
| 11 ms ... aumenta ↗ e diminuisce ↘ combinato | ↗ 6 ms Incremento | 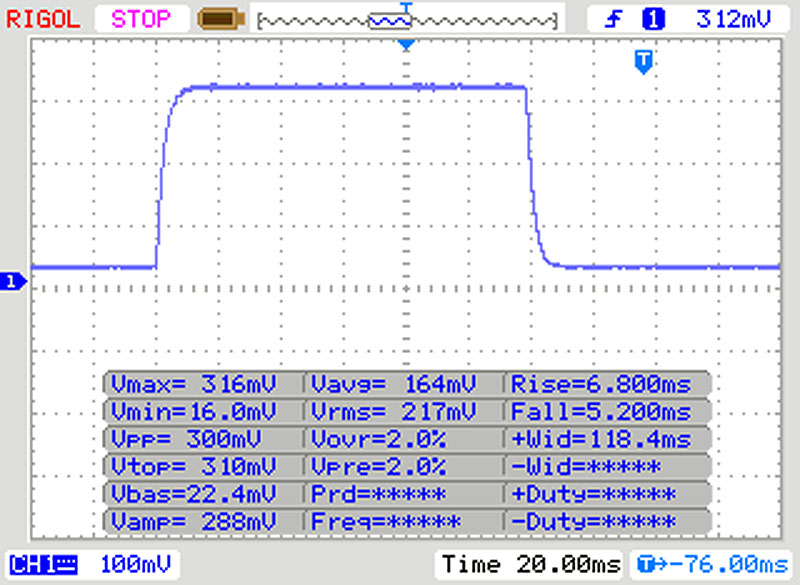 |
| ↘ 5 ms Calo | ||
| Lo schermo mostra buoni tempi di risposta durante i nostri tests, ma potrebbe essere troppo lento per i gamers competitivi. In confronto, tutti i dispositivi di test variano da 0.1 (minimo) a 240 (massimo) ms. » 29 % di tutti i dispositivi è migliore. Questo significa che i tempi di risposta rilevati sono migliori rispettto alla media di tutti i dispositivi testati (19.9 ms). | ||
| ↔ Tempo di risposta dal 50% Grigio all'80% Grigio | ||
| 16 ms ... aumenta ↗ e diminuisce ↘ combinato | ↗ 8 ms Incremento | 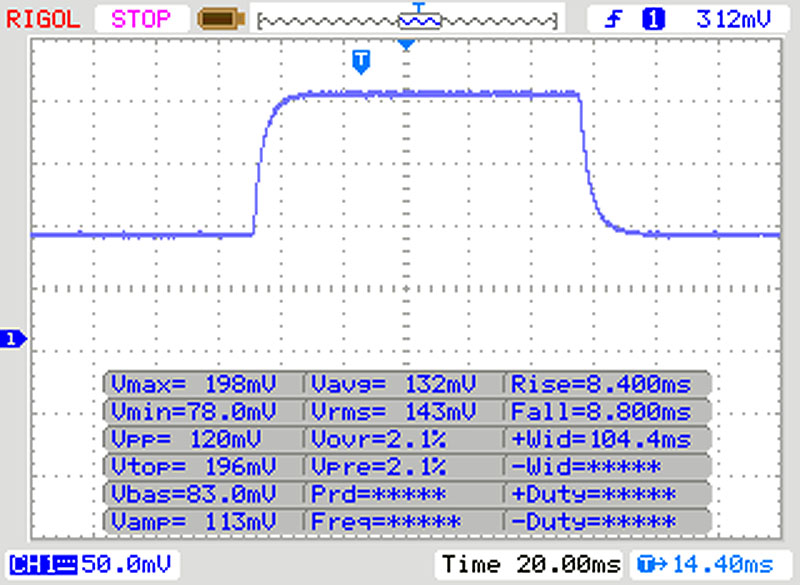 |
| ↘ 8 ms Calo | ||
| Lo schermo mostra buoni tempi di risposta durante i nostri tests, ma potrebbe essere troppo lento per i gamers competitivi. In confronto, tutti i dispositivi di test variano da 0.165 (minimo) a 636 (massimo) ms. » 30 % di tutti i dispositivi è migliore. Questo significa che i tempi di risposta rilevati sono migliori rispettto alla media di tutti i dispositivi testati (31.1 ms). | ||
Sfarfallio dello schermo / PWM (Pulse-Width Modulation)
| flickering dello schermo / PWM non rilevato |  | ||
In confronto: 52 % di tutti i dispositivi testati non utilizza PWM per ridurre la luminosita' del display. Se è rilevato PWM, una media di 7798 (minimo: 5 - massimo: 343500) Hz è stata rilevata. | |||

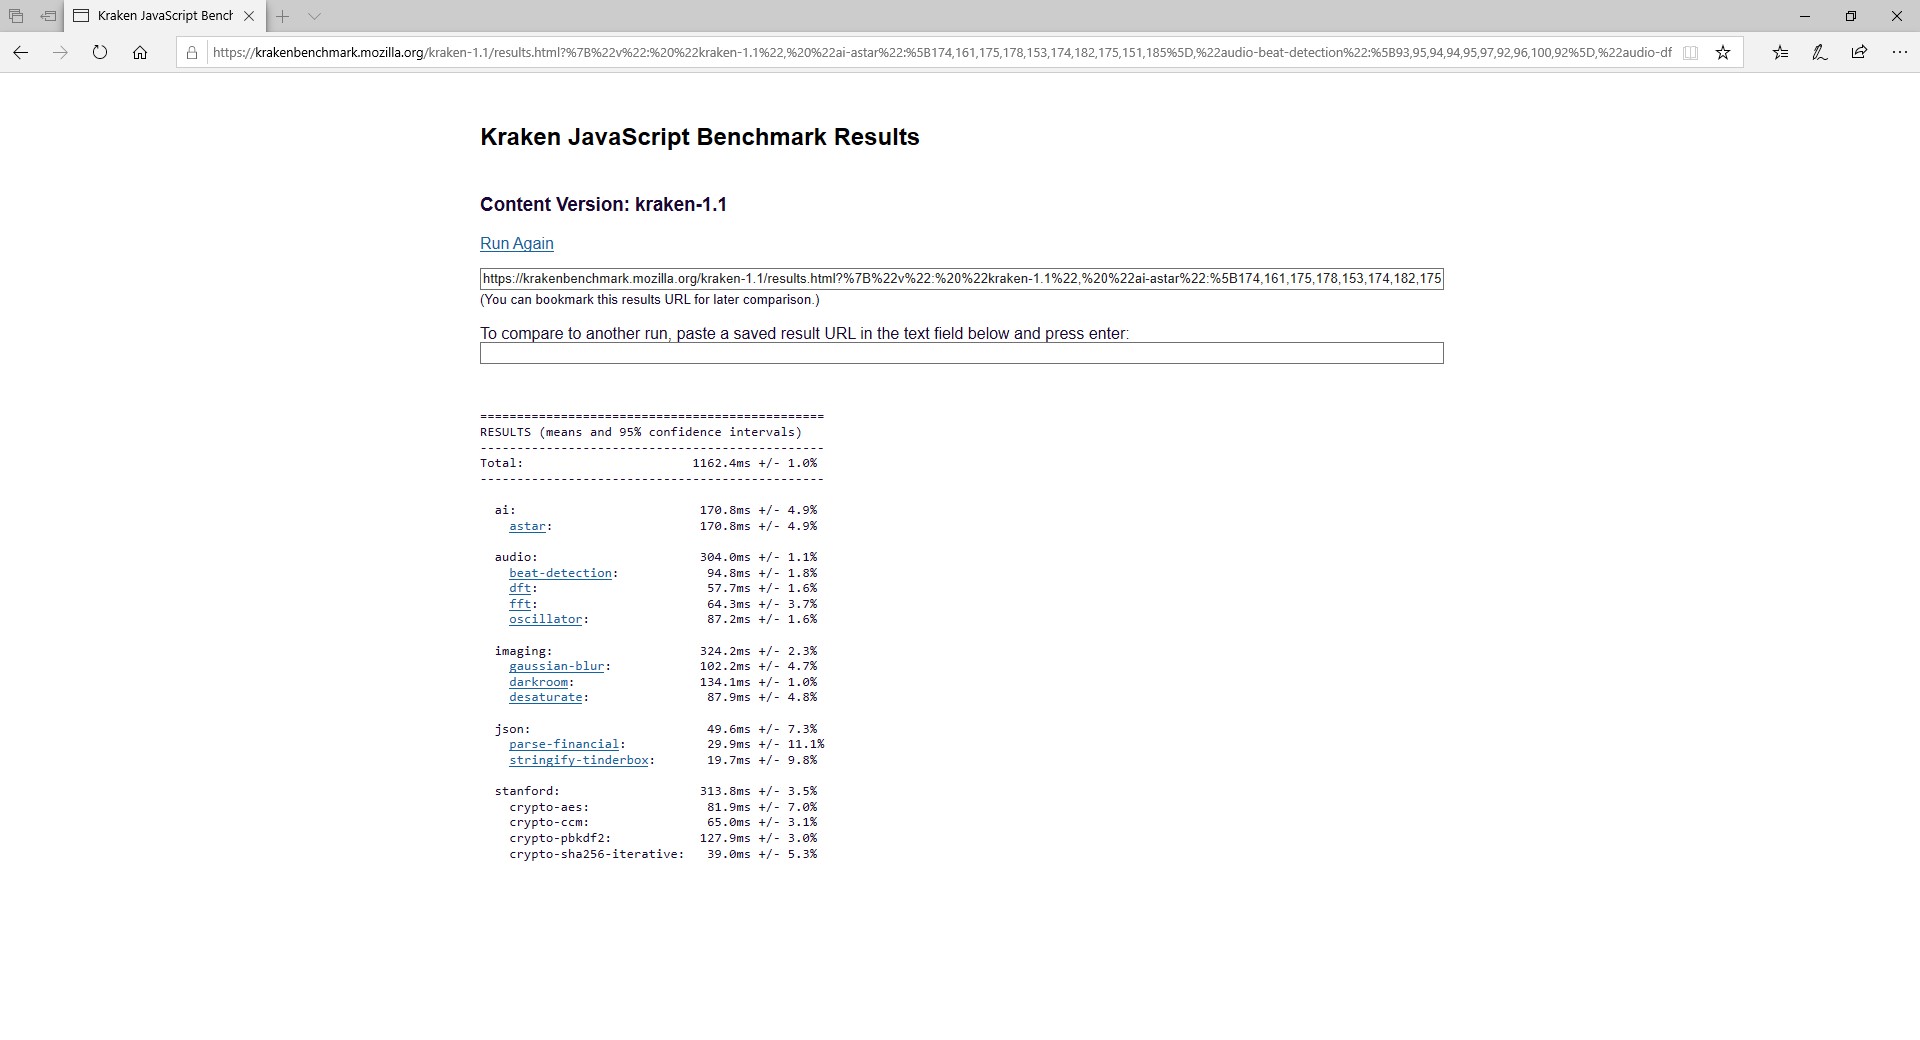
| 3DMark 11 - 1280x720 Performance Physics | |
| Alienware m17 R2 P41E | |
| Lenovo Legion Y740-17IRHg-81UJ001VGE | |
| Razer Blade Pro 17 4K UHD 120 Hz | |
| Media Intel Core i7-9750H (9704 - 14337, n=80) | |
| Asus ROG Zephyrus S GX701GXR | |
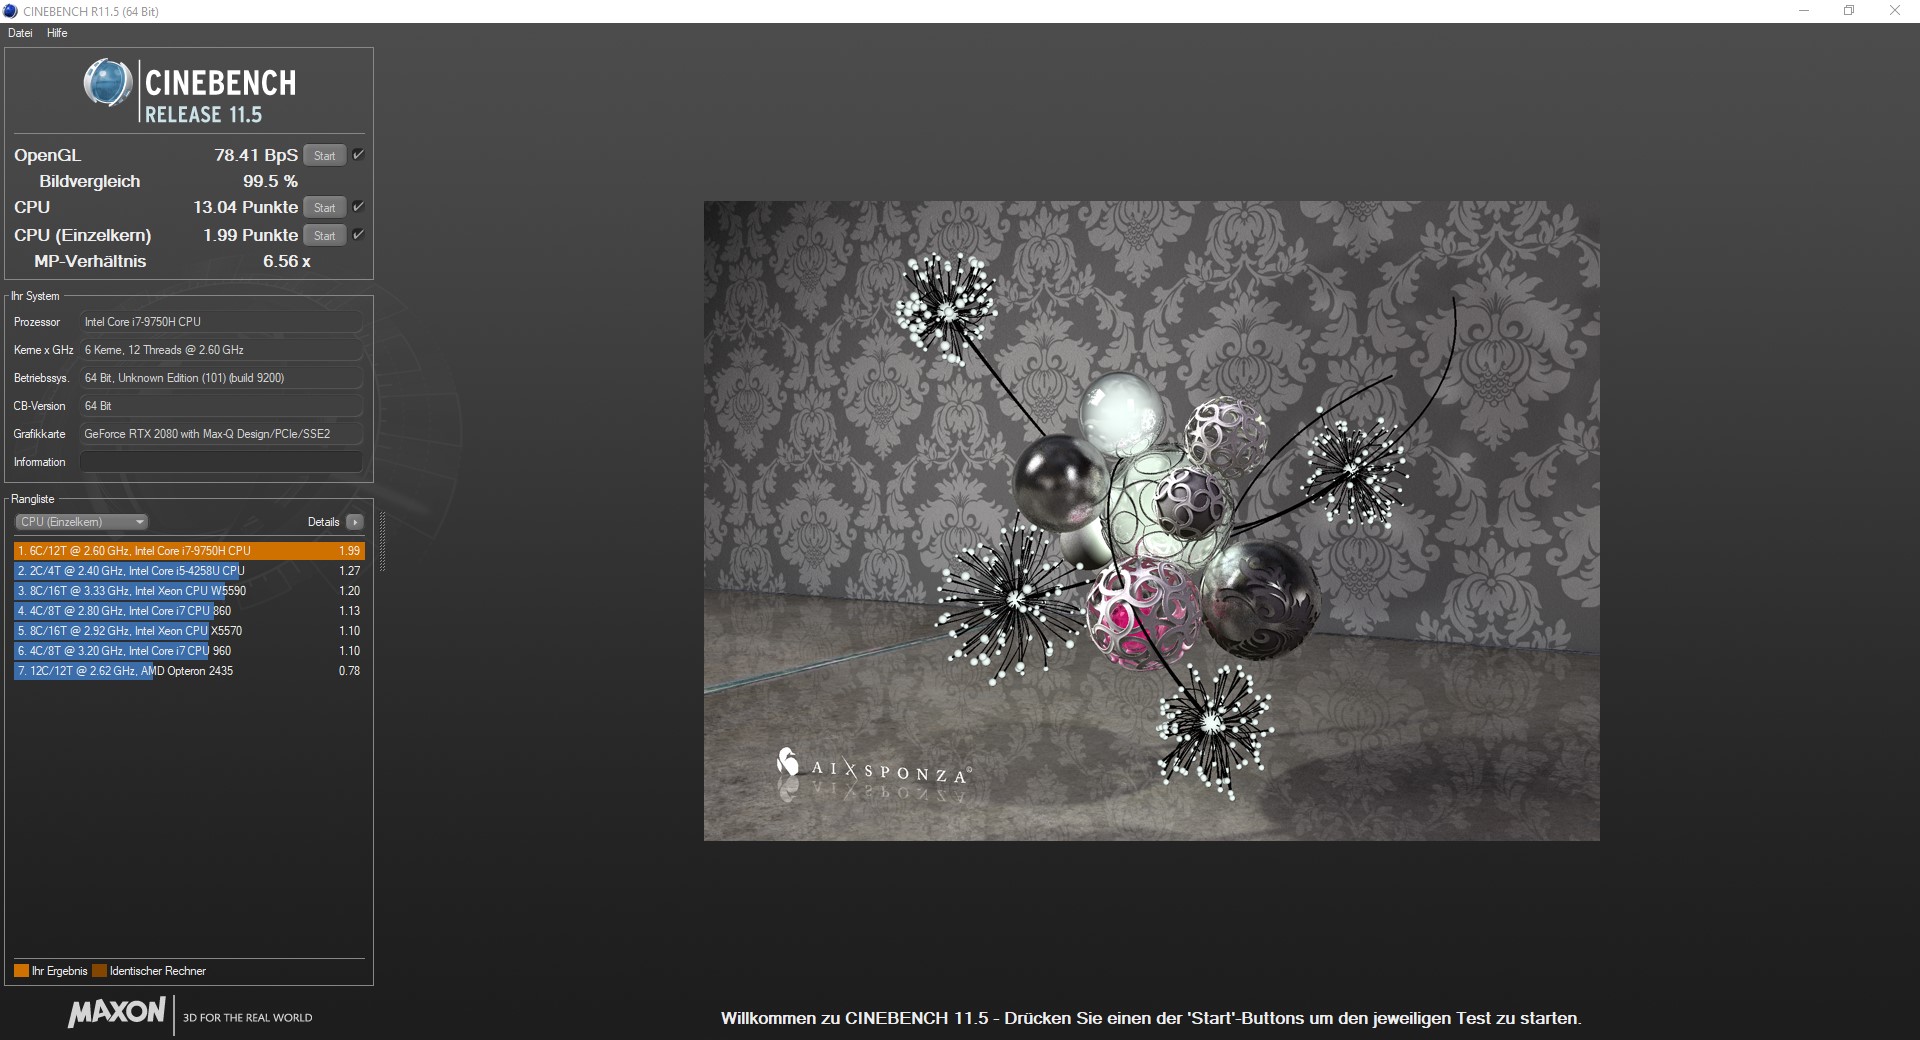
| Blender - v2.79 BMW27 CPU | |
| Media Intel Core i7-9750H (342 - 495, n=21) | |
| Lenovo Legion Y740-17IRHg-81UJ001VGE | |
| Geekbench 4.4 | |
| 64 Bit Single-Core Score | |
| Media Intel Core i7-9750H (4440 - 5511, n=27) | |
| Asus ROG Zephyrus S GX701GXR | |
| Lenovo Legion Y740-17IRHg-81UJ001VGE | |
| 64 Bit Multi-Core Score | |
| Lenovo Legion Y740-17IRHg-81UJ001VGE | |
| Asus ROG Zephyrus S GX701GXR | |
| Media Intel Core i7-9750H (17054 - 25043, n=27) | |
| 7-Zip 18.03 | |
| 7z b 4 | |
| Lenovo Legion Y740-17IRHg-81UJ001VGE | |
| Media Intel Core i7-9750H (28512 - 35174, n=21) | |
| 7z b 4 -mmt1 | |
| Media Intel Core i7-9750H (4580 - 5090, n=21) | |
| Lenovo Legion Y740-17IRHg-81UJ001VGE | |
* ... Meglio usare valori piccoli
| PCMark 8 Home Score Accelerated v2 | 5539 punti | |
| PCMark 8 Creative Score Accelerated v2 | 8491 punti | |
| PCMark 8 Work Score Accelerated v2 | 5949 punti | |
| PCMark 10 Score | 5922 punti | |
Aiuto | ||
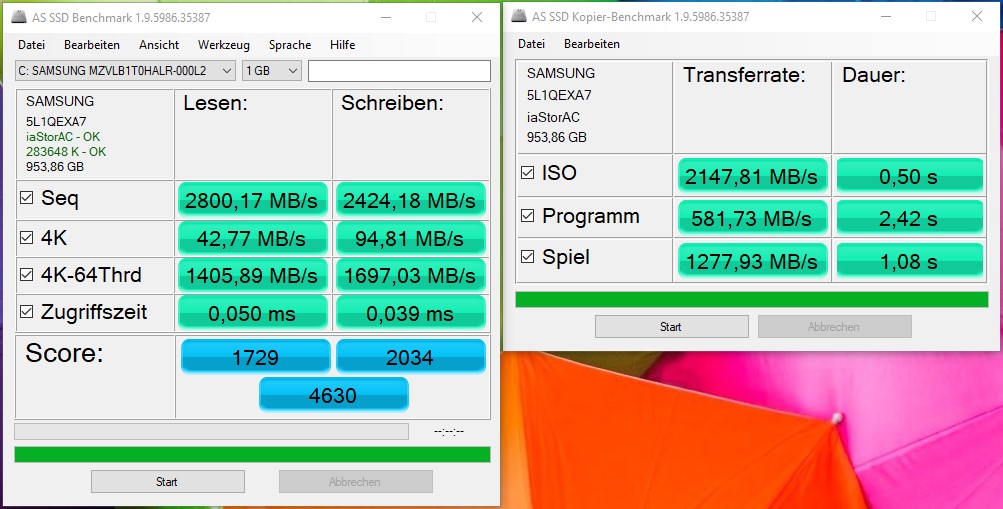
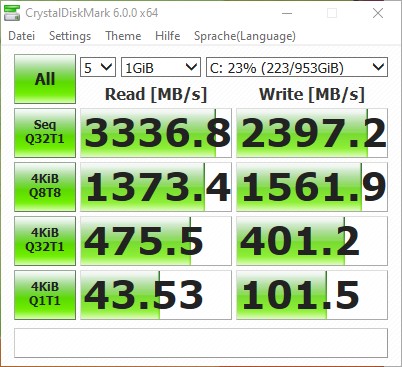
| Lenovo Legion Y740-17IRHg-81UJ001VGE Samsung SSD PM981 MZVLB1T0HALR | Razer Blade Pro 17 4K UHD 120 Hz Samsung SSD PM981 MZVLB1T0HALR | Alienware m17 R2 P41E 2x SK Hynix PC601 NVMe 512 GB (RAID 0) | Asus ROG Zephyrus S GX701GXR Samsung SSD PM981 MZVLB1T0HALR | Media Samsung SSD PM981 MZVLB1T0HALR | Media della classe Gaming | |
|---|---|---|---|---|---|---|
| AS SSD | -10% | -25% | -7% | -5% | 51% | |
| Seq Read (MB/s) | 2800 | 1881 -33% | 1938 -31% | 1662 -41% | 1993 ? -29% | 5490 ? 96% |
| Seq Write (MB/s) | 2424 | 2354 -3% | 2094 -14% | 2266 -7% | 2036 ? -16% | 3914 ? 61% |
| 4K Read (MB/s) | 42.77 | 43.42 2% | 25.88 -39% | 46.86 10% | 46.4 ? 8% | 70 ? 64% |
| 4K Write (MB/s) | 94.8 | 104.1 10% | 100.8 6% | 101.1 7% | 109.7 ? 16% | 215 ? 127% |
| 4K-64 Read (MB/s) | 1406 | 1805 28% | 1217 -13% | 1419 1% | 1502 ? 7% | 1633 ? 16% |
| 4K-64 Write (MB/s) | 1697 | 1775 5% | 1137 -33% | 1746 3% | 1625 ? -4% | 2875 ? 69% |
| Access Time Read * (ms) | 0.05 | 0.049 2% | 0.051 -2% | 0.047 6% | 0.05158 ? -3% | 0.06415 ? -28% |
| Access Time Write * (ms) | 0.039 | 0.106 -172% | 0.107 -174% | 0.037 5% | 0.05581 ? -43% | 0.03953 ? -1% |
| Score Read (Points) | 1729 | 2037 18% | 1437 -17% | 1632 -6% | 1747 ? 1% | 2252 ? 30% |
| Score Write (Points) | 2034 | 2115 4% | 1447 -29% | 2074 2% | 1942 ? -5% | 3481 ? 71% |
| Score Total (Points) | 4630 | 5215 13% | 3624 -22% | 4576 -1% | 4588 ? -1% | 6815 ? 47% |
| Copy ISO MB/s (MB/s) | 2148 | 1877 -13% | 1926 -10% | 1398 -35% | 2280 ? 6% | 3074 ? 43% |
| Copy Program MB/s (MB/s) | 582 | 539 -7% | 626 8% | 438.9 -25% | 558 ? -4% | 951 ? 63% |
| Copy Game MB/s (MB/s) | 1278 | 1368 7% | 1533 20% | 996 -22% | 1302 ? 2% | 2035 ? 59% |
* ... Meglio usare valori piccoli

| 3DMark 11 Performance | 20810 punti | |
| 3DMark Ice Storm Standard Score | 181500 punti | |
| 3DMark Cloud Gate Standard Score | 38493 punti | |
| 3DMark Fire Strike Score | 16706 punti | |
| 3DMark Fire Strike Extreme Score | 8320 punti | |
| 3DMark Time Spy Score | 7475 punti | |
Aiuto | ||
| The Witcher 3 | |
| 1920x1080 High Graphics & Postprocessing (Nvidia HairWorks Off) | |
| Media della classe Gaming (181 - 341, n=3, ultimi 2 anni) | |
| Razer Blade Pro 17 4K UHD 120 Hz | |
| Asus ROG Zephyrus S GX701GXR | |
| Alienware m17 R2 P41E | |
| Lenovo Legion Y740-17IRHg-81UJ001VGE | |
| Media NVIDIA GeForce RTX 2080 Max-Q (117.3 - 179.9, n=19) | |
| 1920x1080 Ultra Graphics & Postprocessing (HBAO+) | |
| Media della classe Gaming (95 - 240, n=8, ultimi 2 anni) | |
| Razer Blade Pro 17 4K UHD 120 Hz | |
| Lenovo Legion Y740-17IRHg-81UJ001VGE | |
| Asus ROG Zephyrus S GX701GXR | |
| Media NVIDIA GeForce RTX 2080 Max-Q (65.7 - 92.7, n=22) | |
| Alienware m17 R2 P41E | |
| basso | medio | alto | ultra | |
|---|---|---|---|---|
| BioShock Infinite (2013) | 330 | 295 | 278 | 166 |
| GTA V (2015) | 171 | 166 | 144 | 77.2 |
| The Witcher 3 (2015) | 299 | 234 | 145 | 81 |
| Dota 2 Reborn (2015) | 144.9 | 132.2 | 126.4 | 119.6 |
| Rise of the Tomb Raider (2016) | 246 | 185 | 139 | 126 |
| X-Plane 11.11 (2018) | 108 | 97.4 | 81.6 | |
| Metro Exodus (2019) | 150 | 97 | 75 | 59 |
Rumorosità
| Idle |
| 30.3 / 30.3 / 30.5 dB(A) |
| Sotto carico |
| 40.8 / 40.8 dB(A) |
 | ||
30 dB silenzioso 40 dB(A) udibile 50 dB(A) rumoroso |
||
min: | ||
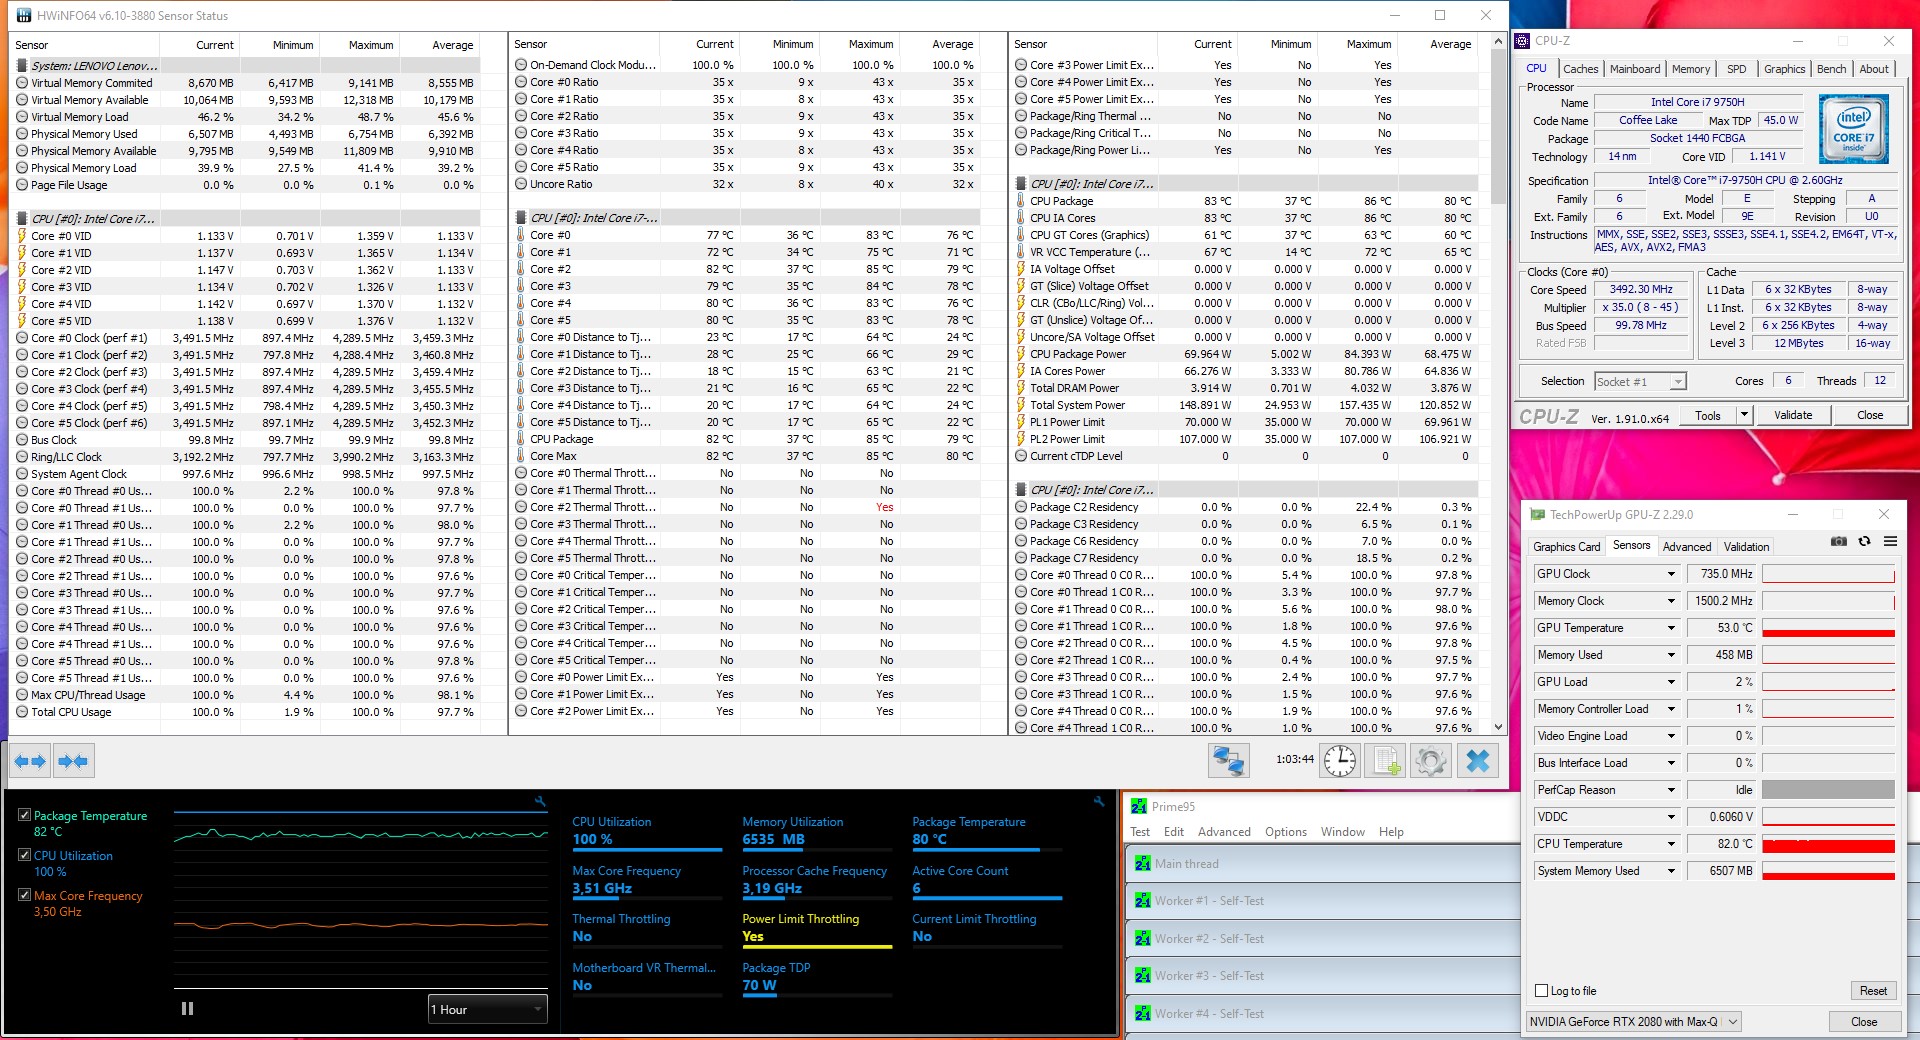
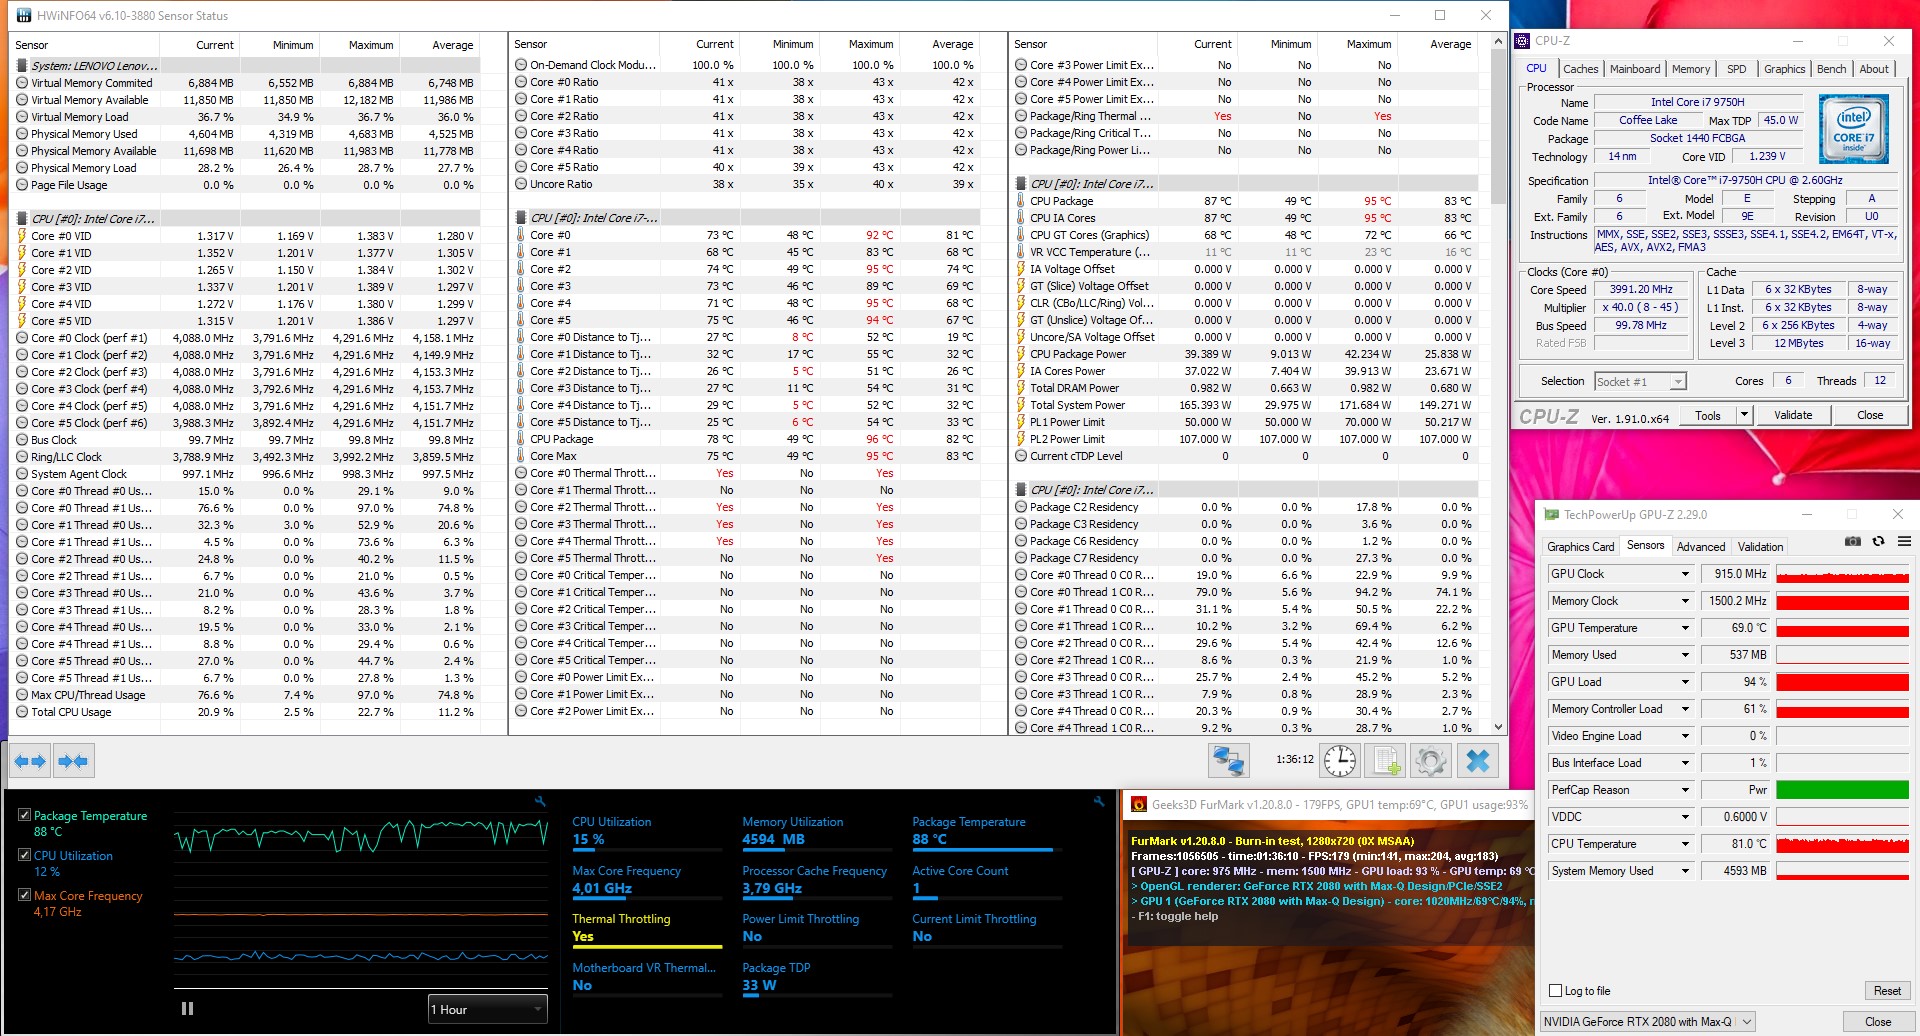
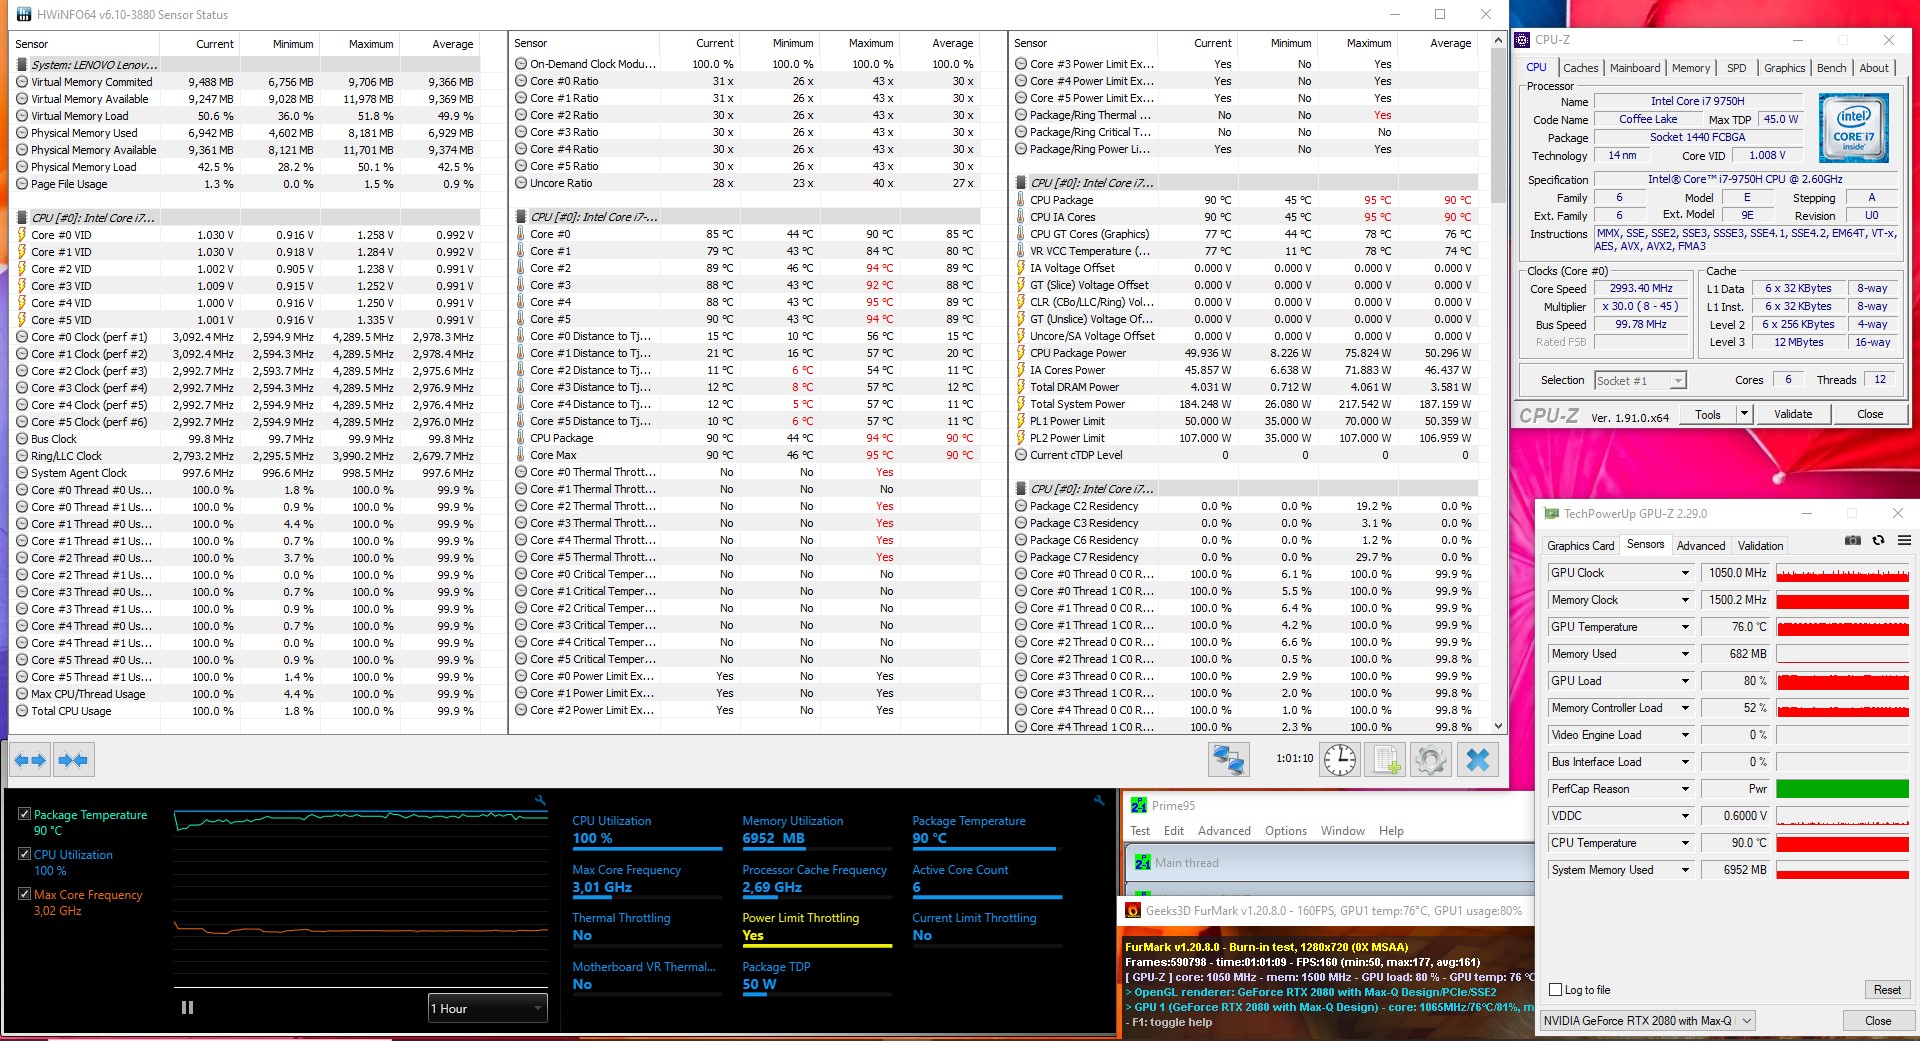
(±) La temperatura massima sul lato superiore è di 40.7 °C / 105 F, rispetto alla media di 40.4 °C / 105 F, che varia da 21.2 a 68.8 °C per questa classe Gaming.
(±) Il lato inferiore si riscalda fino ad un massimo di 42.2 °C / 108 F, rispetto alla media di 43.2 °C / 110 F
(+) In idle, la temperatura media del lato superiore è di 28.6 °C / 83 F, rispetto alla media deld ispositivo di 33.9 °C / 93 F.
(±) Riproducendo The Witcher 3, la temperatura media per il lato superiore e' di 33.1 °C / 92 F, rispetto alla media del dispositivo di 33.9 °C / 93 F.
(+) I poggiapolsi e il touchpad sono piu' freddi della temperatura della pelle con un massimo di 30 °C / 86 F e sono quindi freddi al tatto.
(±) La temperatura media della zona del palmo della mano di dispositivi simili e'stata di 28.8 °C / 83.8 F (-1.2 °C / -2.2 F).
Lenovo Legion Y740-17IRHg-81UJ001VGE analisi audio
(-) | altoparlanti non molto potenti (69.2 dB)
Bassi 100 - 315 Hz
(±) | bassi ridotti - in media 6.3% inferiori alla media
(±) | la linearità dei bassi è media (11% delta rispetto alla precedente frequenza)
Medi 400 - 2000 Hz
(+) | medi bilanciati - solo only 3.8% rispetto alla media
(±) | linearità dei medi adeguata (8.3% delta rispetto alla precedente frequenza)
Alti 2 - 16 kHz
(+) | Alti bilanciati - appena 2.5% dalla media
(±) | la linearità degli alti è media (7% delta rispetto alla precedente frequenza)
Nel complesso 100 - 16.000 Hz
(+) | suono nel complesso lineare (14.9% differenza dalla media)
Rispetto alla stessa classe
» 30% di tutti i dispositivi testati in questa classe è stato migliore, 7% simile, 63% peggiore
» Il migliore ha avuto un delta di 6%, medio di 18%, peggiore di 132%
Rispetto a tutti i dispositivi testati
» 20% di tutti i dispositivi testati in questa classe è stato migliore, 4% similare, 76% peggiore
» Il migliore ha avuto un delta di 4%, medio di 24%, peggiore di 134%
Asus ROG Zephyrus S GX701GXR analisi audio
(+) | gli altoparlanti sono relativamente potenti (83 dB)
Bassi 100 - 315 Hz
(±) | bassi ridotti - in media 10.3% inferiori alla media
(±) | la linearità dei bassi è media (11.1% delta rispetto alla precedente frequenza)
Medi 400 - 2000 Hz
(+) | medi bilanciati - solo only 2.6% rispetto alla media
(+) | medi lineari (4.3% delta rispetto alla precedente frequenza)
Alti 2 - 16 kHz
(+) | Alti bilanciati - appena 3.3% dalla media
(+) | alti lineari (4.1% delta rispetto alla precedente frequenza)
Nel complesso 100 - 16.000 Hz
(+) | suono nel complesso lineare (12.5% differenza dalla media)
Rispetto alla stessa classe
» 15% di tutti i dispositivi testati in questa classe è stato migliore, 3% simile, 81% peggiore
» Il migliore ha avuto un delta di 6%, medio di 18%, peggiore di 132%
Rispetto a tutti i dispositivi testati
» 11% di tutti i dispositivi testati in questa classe è stato migliore, 2% similare, 87% peggiore
» Il migliore ha avuto un delta di 4%, medio di 24%, peggiore di 134%
| Off / Standby | |
| Idle | |
| Sotto carico |
|
Leggenda:
min: | |

Pro
Contro
Giudizio Complessivo - Buon rapporto prezzo/prestazioni

Il Lenovo Legion Y740-17 è un notebook per il gaming ben equipaggiato e dal prezzo abbastanza ragionevole. Dispositivi paragonabili con specifiche simili spesso costano più di 3000 Euro (~$3300). Invece, il Legion Y740-17 può essere acquistato in vari negozi online per circa 2700 Euro (~$2965). Per il prezzo, gli acquirenti ricevono un notebook esteticamente accattivante con una luce RGB sottile e personalizzabile. Tuttavia, i componenti installati dovrebbero essere al centro dell'attenzione. L'Intel Core i7-9750H è una scelta sicura. Il SoC a sei cores offre prestazioni solide. Come scheda grafica è stata scelta una Nvidia GeForce RTX 2080 Max-Q e, combinata con il SoC, anche i titoli più recenti funzionano senza problemi. Per quanto riguarda lo schermo, ha una risoluzione nativa Full HD e una frequenza di aggiornamento di 144-Hz, così come G-Sync dimostra che Lenovo ha progettato questo dispositivo principalmente pensando ai giocatori. Allo stesso modo, è una buona scelta per il fotoritocco leggero.
Il Lenovo Legion Y740-17 è un portatile gaming solido che vale sicuramente la pena considerare.
Nel complesso, il Lenovo Legion Y740-17 è un buon dispositivo gaming con solo piccole debolezze. Ad esempio, la durata della batteria è leggermente inferiore alla media e il touchpad avrebbe potuto essere leggermente più grande. In termini di prestazioni grezze, la Lenovo Legion Y740-17 ha dimostrato la sua capacità di tenere il passo con la concorrenza nel nostro confronto.
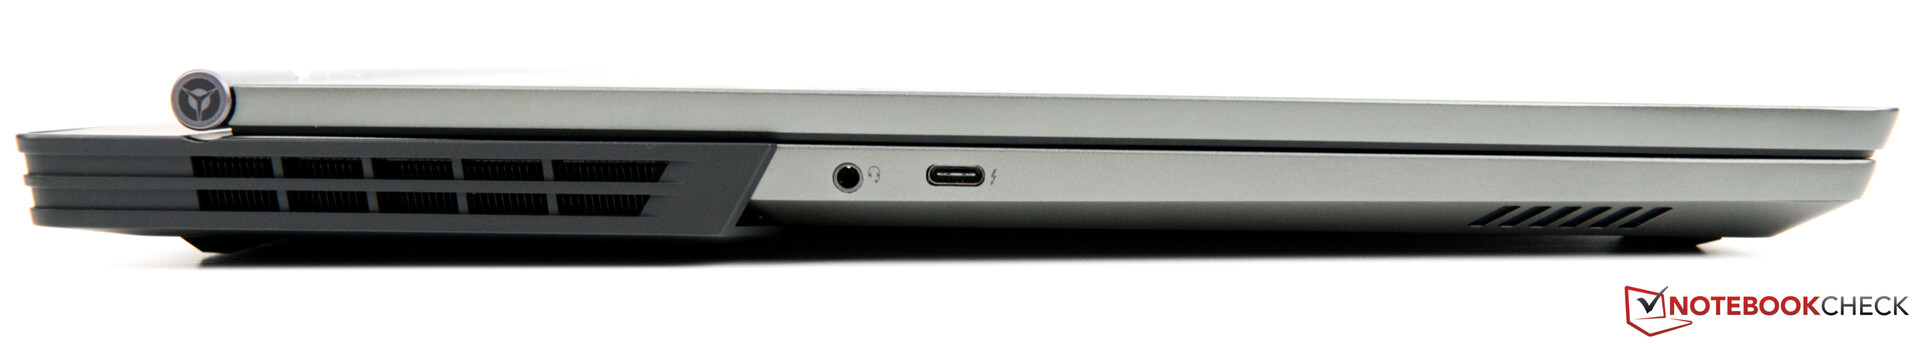
La selezione delle porte non è nulla di straordinario. Tuttavia, un DisplayPort a grandezza naturale sarebbe stato bello da vedere, poiché avrebbe reso superfluo l'uso di cavi o adattatori speciali.
Lenovo Legion Y740-17IRHg-81UJ001VGE
- 03/26/2020 v7 (old)
Sebastian Bade
Price comparison
