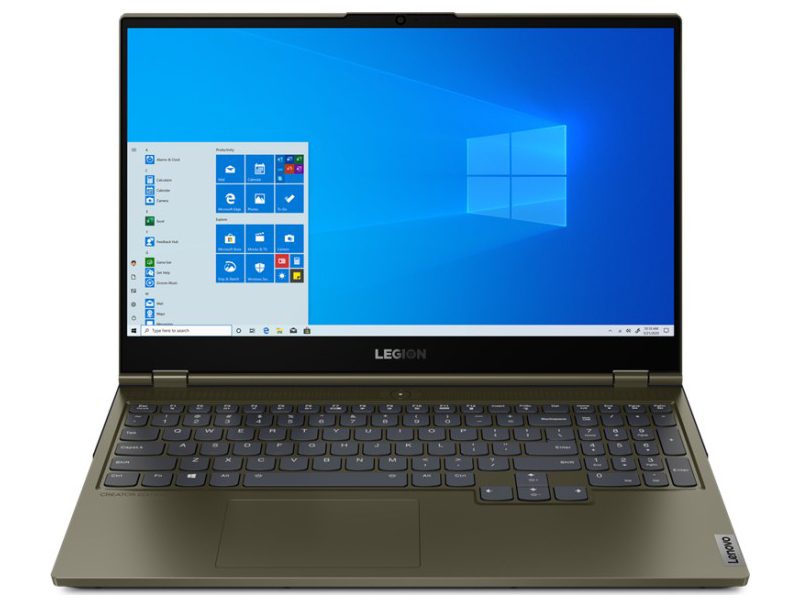
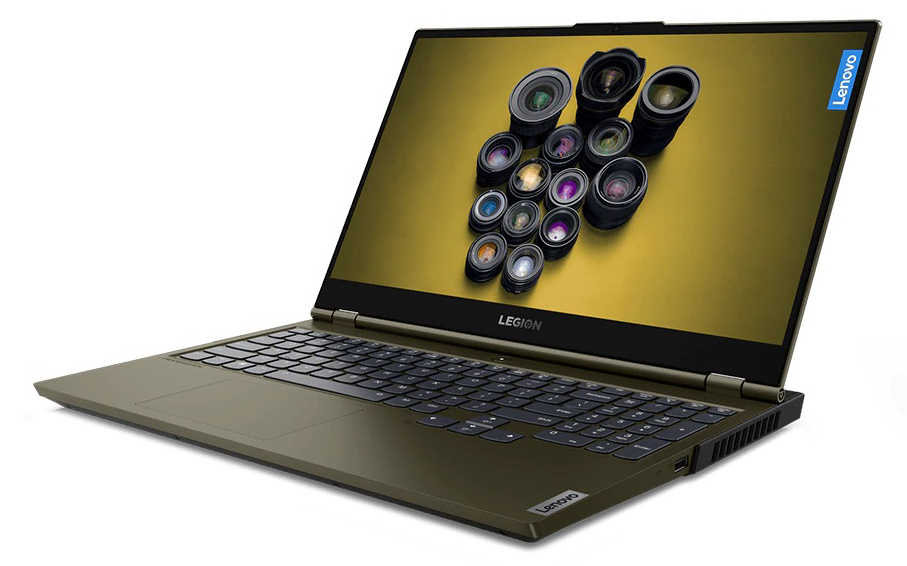
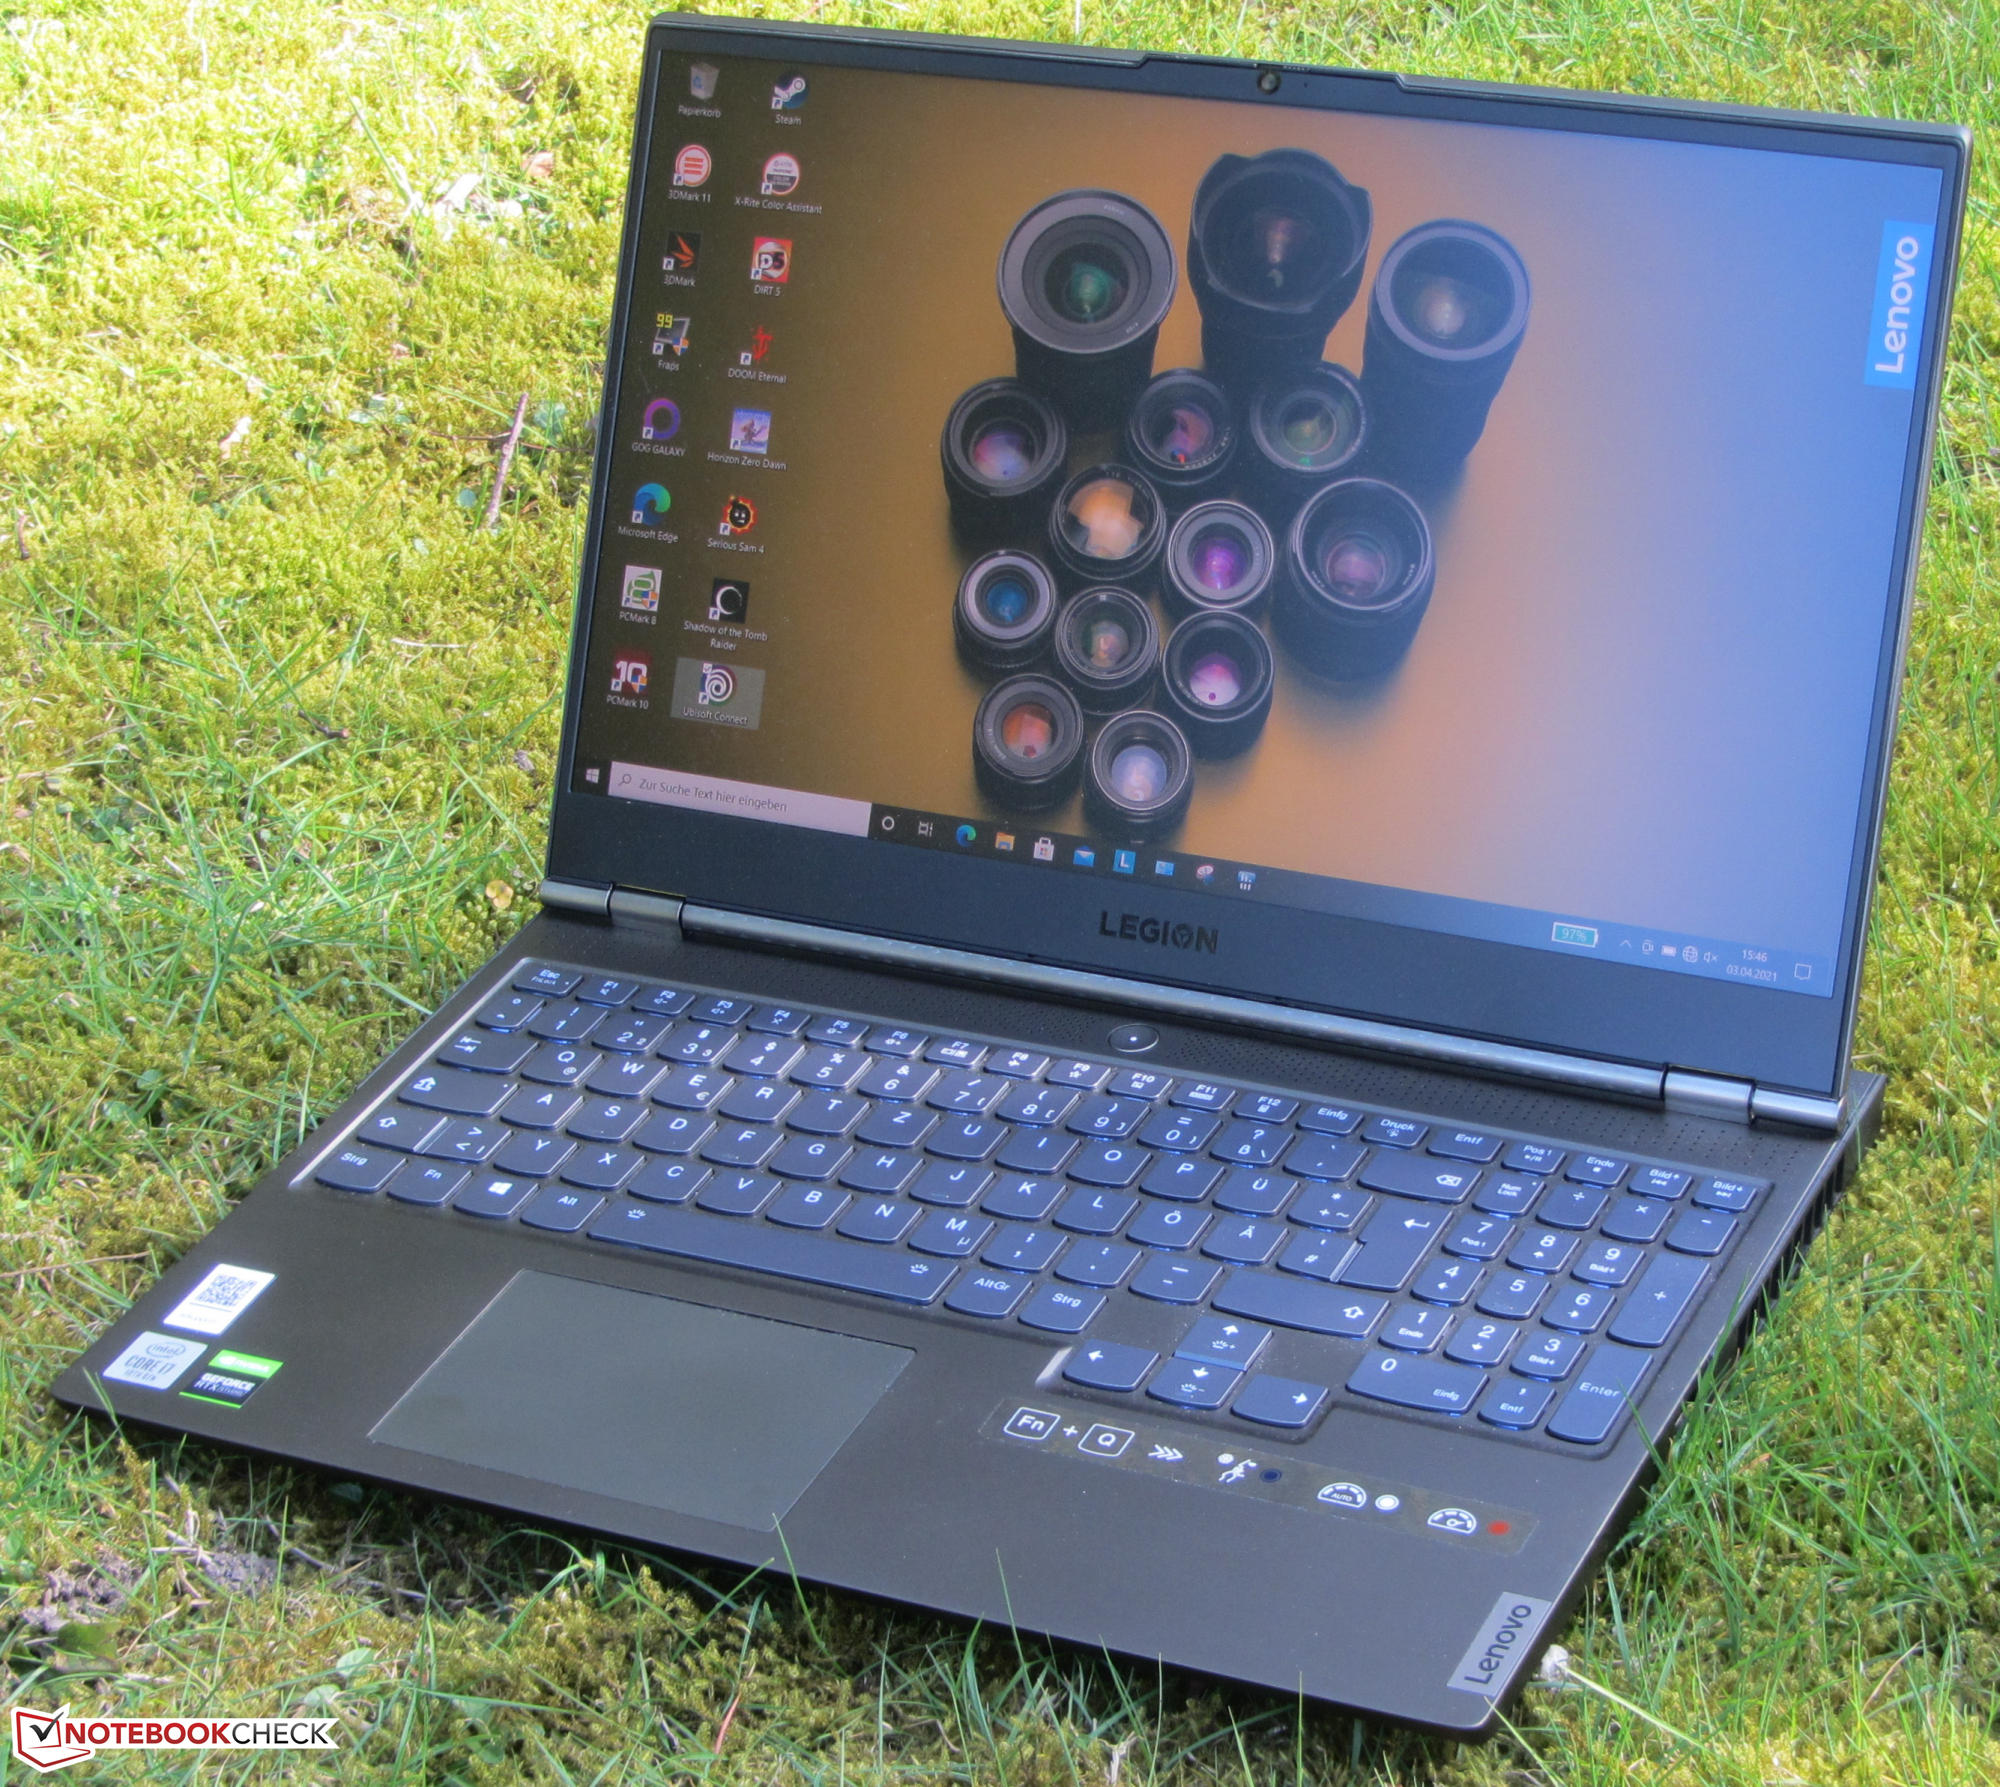
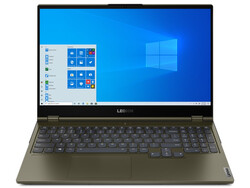
Recensione del Computer portatile Lenovo Legion C7 15IMH05: un tuttofare per gamers e creativi con tre anni di garanzia
Confronto con i potenziali concorrenti
Punteggio | Data | Modello | Peso | Altezza | Dimensione | Risoluzione | Prezzo |
|---|---|---|---|---|---|---|---|
| 85.5 % v7 (old) | 04/2021 | Lenovo Legion C7 15IMH05 82EH0030GE i7-10875H, GeForce RTX 2070 Max-Q | 2.3 kg | 19.9 mm | 15.60" | 1920x1080 | |
| 85.4 % v7 (old) | 04/2021 | Alienware m15 R4 i9-10980HK, GeForce RTX 3070 Laptop GPU | 2.3 kg | 20 mm | 15.60" | 1920x1080 | |
| 85 % v7 (old) | 02/2021 | Asus ROG Strix G15 G513QR R9 5900HX, GeForce RTX 3070 Laptop GPU | 2.3 kg | 27.2 mm | 15.60" | 1920x1080 | |
| 86 % v7 (old) | 03/2021 | Schenker XMG Pro 15 (Early 2021, RTX 3080) i7-10870H, GeForce RTX 3080 Laptop GPU | 2 kg | 19.8 mm | 15.60" | 1920x1080 |
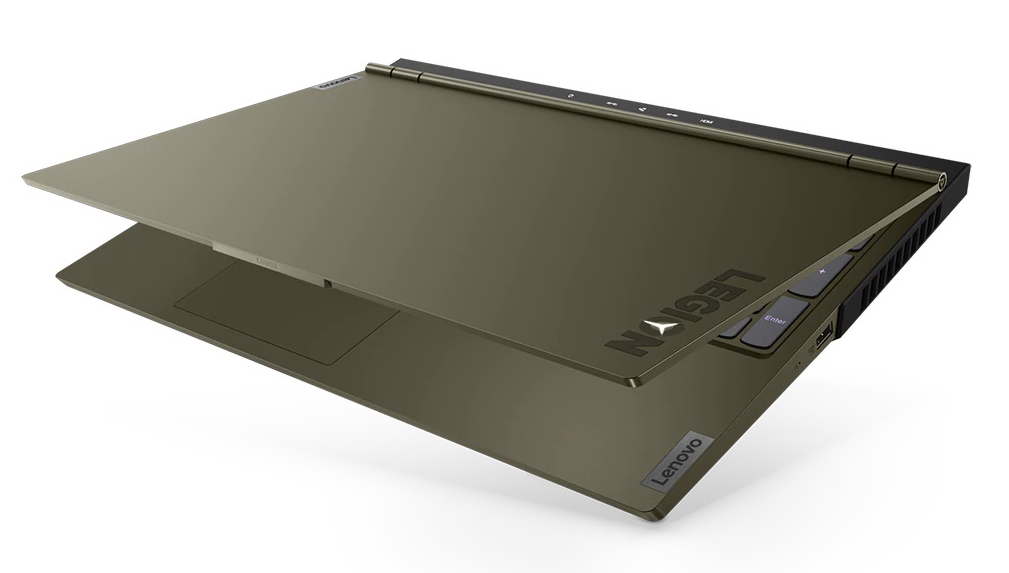
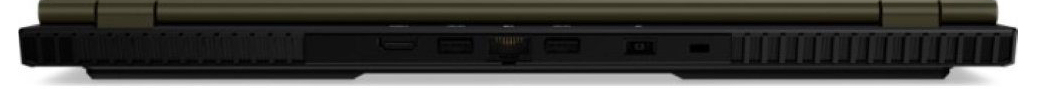
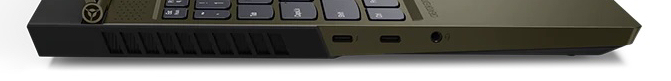
Connettività


")
")
 GeForce RTX 3080 Laptop GPU, i7-10870H, Samsung SSD 970 EVO Plus 1TB")
 GeForce RTX 3080 Laptop GPU, i7-10870H, Samsung SSD 970 EVO Plus 1TB")


| |||||||||||||||||||||||||
Distribuzione della luminosità: 87 %
Al centro con la batteria: 358 cd/m²
Contrasto: 1048:1 (Nero: 0.42 cd/m²)
ΔE ColorChecker Calman: 6.32 | ∀{0.5-29.43 Ø4.71}
calibrated: 4.13
ΔE Greyscale Calman: 7.56 | ∀{0.09-98 Ø4.96}
100% sRGB (Argyll 1.6.3 3D)
88% AdobeRGB 1998 (Argyll 1.6.3 3D)
99.5% AdobeRGB 1998 (Argyll 3D)
99.8% sRGB (Argyll 3D)
91.9% Display P3 (Argyll 3D)
Gamma: 2.64
CCT: 7681 K
| Lenovo Legion C7 15IMH05 82EH0030GE BOW CQ NV156FHM-NY5, IPS, 1920x1080, 15.6" | Alienware m15 R4 LG Philips LGD066E, IPS, 1920x1080, 15.6" | Asus ROG Strix G15 G513QR LQ156M1JW25, IPS, 1920x1080, 15.6" | Schenker XMG Pro 15 (Early 2021, RTX 3080) AU Optronics AUO7A8C (B156HAN12.0), IPS, 1920x1080, 15.6" | Lenovo Legion 7 15IMH05-81YT001VGE AUO048E, IPS, 1920x1080, 15.6" | |
|---|---|---|---|---|---|
| Display | -18% | -21% | -18% | -17% | |
| Display P3 Coverage (%) | 91.9 | 69.4 -24% | 67.7 -26% | 69.2 -25% | 70.3 -24% |
| sRGB Coverage (%) | 99.8 | 99 -1% | 94.3 -6% | 99.7 0% | 99.4 0% |
| AdobeRGB 1998 Coverage (%) | 99.5 | 70.5 -29% | 68.2 -31% | 70.8 -29% | 71.3 -28% |
| Response Times | -93% | -83% | -80% | -62% | |
| Response Time Grey 50% / Grey 80% * (ms) | 14 ? | 7.4 ? 47% | 8.2 ? 41% | 3.6 ? 74% | 8 ? 43% |
| Response Time Black / White * (ms) | 3 ? | 10 ? -233% | 9.2 ? -207% | 10 ? -233% | 8 ? -167% |
| PWM Frequency (Hz) | |||||
| Screen | 22% | 14% | 26% | 32% | |
| Brightness middle (cd/m²) | 440 | 333 -24% | 308 -30% | 327 -26% | 470 7% |
| Brightness (cd/m²) | 414 | 303 -27% | 288 -30% | 335 -19% | 468 13% |
| Brightness Distribution (%) | 87 | 86 -1% | 86 -1% | 89 2% | 85 -2% |
| Black Level * (cd/m²) | 0.42 | 0.29 31% | 0.23 45% | 0.22 48% | 0.21 50% |
| Contrast (:1) | 1048 | 1148 10% | 1339 28% | 1486 42% | 2238 114% |
| Colorchecker dE 2000 * | 6.32 | 1.8 72% | 3.28 48% | 2.18 66% | 3.28 48% |
| Colorchecker dE 2000 max. * | 9.96 | 4.49 55% | 8.51 15% | 4.24 57% | 7.31 27% |
| Colorchecker dE 2000 calibrated * | 4.13 | 1.13 73% | 0.83 80% | 1 76% | 0.8 81% |
| Greyscale dE 2000 * | 7.56 | 1.9 75% | 5 34% | 2.6 66% | 4.49 41% |
| Gamma | 2.64 83% | 2.265 97% | 2.057 107% | 2.123 104% | 2.4 92% |
| CCT | 7681 85% | 6840 95% | 7393 88% | 6815 95% | 7438 87% |
| Color Space (Percent of AdobeRGB 1998) (%) | 88 | 71 -19% | 68 -23% | 71 -19% | 65 -26% |
| Color Space (Percent of sRGB) (%) | 100 | 93 -7% | 90 -10% | 93 -7% | 99 -1% |
| Media totale (Programma / Settaggio) | -30% /
-0% | -30% /
-5% | -24% /
5% | -16% /
11% |
* ... Meglio usare valori piccoli
Tempi di risposta del Display
| ↔ Tempi di risposta dal Nero al Bianco | ||
|---|---|---|
| 3 ms ... aumenta ↗ e diminuisce ↘ combinato | ↗ 1 ms Incremento |  |
| ↘ 2 ms Calo | ||
| Lo schermo ha mostrato valori di risposta molto veloci nei nostri tests ed è molto adatto per i gaming veloce. In confronto, tutti i dispositivi di test variano da 0.1 (minimo) a 240 (massimo) ms. » 15 % di tutti i dispositivi è migliore. Questo significa che i tempi di risposta rilevati sono migliori rispettto alla media di tutti i dispositivi testati (19.8 ms). | ||
| ↔ Tempo di risposta dal 50% Grigio all'80% Grigio | ||
| 14 ms ... aumenta ↗ e diminuisce ↘ combinato | ↗ 7 ms Incremento |  |
| ↘ 7 ms Calo | ||
| Lo schermo mostra buoni tempi di risposta durante i nostri tests, ma potrebbe essere troppo lento per i gamers competitivi. In confronto, tutti i dispositivi di test variano da 0.165 (minimo) a 636 (massimo) ms. » 28 % di tutti i dispositivi è migliore. Questo significa che i tempi di risposta rilevati sono migliori rispettto alla media di tutti i dispositivi testati (31 ms). | ||
Sfarfallio dello schermo / PWM (Pulse-Width Modulation)
| flickering dello schermo / PWM non rilevato |  | ||
In confronto: 52 % di tutti i dispositivi testati non utilizza PWM per ridurre la luminosita' del display. Se è rilevato PWM, una media di 7747 (minimo: 5 - massimo: 343500) Hz è stata rilevata. | |||
| Cinebench R15 | |
| CPU Single 64Bit | |
| Media della classe Gaming (188.8 - 350, n=106, ultimi 2 anni) | |
| Asus ROG Strix G15 G513QR | |
| Lenovo Legion 7 15IMH05-81YT001VGE | |
| Lenovo Legion C7 15IMH05 82EH0030GE | |
| Media Intel Core i7-10875H (190 - 220, n=37) | |
| Schenker XMG Pro 15 (Early 2021, RTX 3080) | |
| Alienware m15 R4 | |
| Lenovo Legion C7 15IMH05 82EH0030GE (Hoechstleistung) | |
| Lenovo Legion C7 15IMH05 82EH0030GE (Fluestermodus) | |
| CPU Multi 64Bit | |
| Media della classe Gaming (1578 - 6330, n=105, ultimi 2 anni) | |
| Asus ROG Strix G15 G513QR | |
| Schenker XMG Pro 15 (Early 2021, RTX 3080) | |
| Lenovo Legion C7 15IMH05 82EH0030GE | |
| Lenovo Legion 7 15IMH05-81YT001VGE | |
| Lenovo Legion C7 15IMH05 82EH0030GE (Hoechstleistung) | |
| Alienware m15 R4 | |
| Media Intel Core i7-10875H (1003 - 1833, n=38) | |
| Lenovo Legion C7 15IMH05 82EH0030GE (Fluestermodus) | |
| Blender - v2.79 BMW27 CPU | |
| Lenovo Legion C7 15IMH05 82EH0030GE (Fluestermodus) | |
| Media Intel Core i7-10875H (259 - 535, n=30) | |
| Lenovo Legion C7 15IMH05 82EH0030GE | |
| Schenker XMG Pro 15 (Early 2021, RTX 3080) | |
| Lenovo Legion C7 15IMH05 82EH0030GE (Hoechstleistung) | |
| Alienware m15 R4 | |
| Lenovo Legion 7 15IMH05-81YT001VGE | |
| Asus ROG Strix G15 G513QR | |
| Media della classe Gaming (79 - 330, n=104, ultimi 2 anni) | |
| 7-Zip 18.03 | |
| 7z b 4 -mmt1 | |
| Media della classe Gaming (4199 - 7436, n=105, ultimi 2 anni) | |
| Asus ROG Strix G15 G513QR | |
| Lenovo Legion 7 15IMH05-81YT001VGE | |
| Alienware m15 R4 | |
| Lenovo Legion C7 15IMH05 82EH0030GE | |
| Media Intel Core i7-10875H (5071 - 5780, n=31) | |
| Lenovo Legion C7 15IMH05 82EH0030GE (Hoechstleistung) | |
| Schenker XMG Pro 15 (Early 2021, RTX 3080) | |
| Lenovo Legion C7 15IMH05 82EH0030GE (Fluestermodus) | |
| 7z b 4 | |
| Media della classe Gaming (33491 - 148086, n=105, ultimi 2 anni) | |
| Asus ROG Strix G15 G513QR | |
| Lenovo Legion C7 15IMH05 82EH0030GE (Hoechstleistung) | |
| Lenovo Legion 7 15IMH05-81YT001VGE | |
| Alienware m15 R4 | |
| Lenovo Legion C7 15IMH05 82EH0030GE | |
| Schenker XMG Pro 15 (Early 2021, RTX 3080) | |
| Media Intel Core i7-10875H (29844 - 49562, n=31) | |
| Lenovo Legion C7 15IMH05 82EH0030GE (Fluestermodus) | |
| Cinebench R20 | |
| CPU (Single Core) | |
| Media della classe Gaming (442 - 913, n=106, ultimi 2 anni) | |
| Asus ROG Strix G15 G513QR | |
| Lenovo Legion 7 15IMH05-81YT001VGE | |
| Lenovo Legion C7 15IMH05 82EH0030GE (Hoechstleistung) | |
| Media Intel Core i7-10875H (430 - 524, n=32) | |
| Lenovo Legion C7 15IMH05 82EH0030GE | |
| Alienware m15 R4 | |
| Schenker XMG Pro 15 (Early 2021, RTX 3080) | |
| Lenovo Legion C7 15IMH05 82EH0030GE (Fluestermodus) | |
| CPU (Multi Core) | |
| Media della classe Gaming (4029 - 16433, n=106, ultimi 2 anni) | |
| Asus ROG Strix G15 G513QR | |
| Lenovo Legion 7 15IMH05-81YT001VGE | |
| Alienware m15 R4 | |
| Lenovo Legion C7 15IMH05 82EH0030GE (Hoechstleistung) | |
| Media Intel Core i7-10875H (1986 - 4176, n=32) | |
| Schenker XMG Pro 15 (Early 2021, RTX 3080) | |
| Lenovo Legion C7 15IMH05 82EH0030GE | |
| Lenovo Legion C7 15IMH05 82EH0030GE (Fluestermodus) | |
| Geekbench 5.5 | |
| Single-Core | |
| Media della classe Gaming (986 - 2474, n=105, ultimi 2 anni) | |
| Asus ROG Strix G15 G513QR | |
| Lenovo Legion 7 15IMH05-81YT001VGE | |
| Alienware m15 R4 | |
| Lenovo Legion C7 15IMH05 82EH0030GE | |
| Lenovo Legion C7 15IMH05 82EH0030GE (Hoechstleistung) | |
| Media Intel Core i7-10875H (1233 - 1371, n=29) | |
| Schenker XMG Pro 15 (Early 2021, RTX 3080) | |
| Lenovo Legion C7 15IMH05 82EH0030GE (Fluestermodus) | |
| Multi-Core | |
| Media della classe Gaming (6460 - 28263, n=105, ultimi 2 anni) | |
| Lenovo Legion 7 15IMH05-81YT001VGE | |
| Lenovo Legion C7 15IMH05 82EH0030GE | |
| Lenovo Legion C7 15IMH05 82EH0030GE (Hoechstleistung) | |
| Alienware m15 R4 | |
| Schenker XMG Pro 15 (Early 2021, RTX 3080) | |
| Media Intel Core i7-10875H (5715 - 8620, n=29) | |
| Asus ROG Strix G15 G513QR | |
| Lenovo Legion C7 15IMH05 82EH0030GE (Fluestermodus) | |
| HWBOT x265 Benchmark v2.2 - 4k Preset | |
| Media della classe Gaming (11.5 - 44.4, n=105, ultimi 2 anni) | |
| Asus ROG Strix G15 G513QR | |
| Lenovo Legion 7 15IMH05-81YT001VGE | |
| Alienware m15 R4 | |
| Lenovo Legion C7 15IMH05 82EH0030GE (Hoechstleistung) | |
| Lenovo Legion C7 15IMH05 82EH0030GE | |
| Media Intel Core i7-10875H (7.27 - 14.1, n=27) | |
| Schenker XMG Pro 15 (Early 2021, RTX 3080) | |
| Lenovo Legion C7 15IMH05 82EH0030GE (Fluestermodus) | |
| LibreOffice - 20 Documents To PDF | |
| Schenker XMG Pro 15 (Early 2021, RTX 3080) | |
| Lenovo Legion C7 15IMH05 82EH0030GE (Fluestermodus) | |
| Lenovo Legion C7 15IMH05 82EH0030GE | |
| Lenovo Legion 7 15IMH05-81YT001VGE | |
| Asus ROG Strix G15 G513QR | |
| Media Intel Core i7-10875H (30.2 - 84.3, n=30) | |
| Media della classe Gaming (33.2 - 88.8, n=105, ultimi 2 anni) | |
| Alienware m15 R4 | |
| Lenovo Legion C7 15IMH05 82EH0030GE (Hoechstleistung) | |
| R Benchmark 2.5 - Overall mean | |
| Lenovo Legion C7 15IMH05 82EH0030GE (Fluestermodus) | |
| Schenker XMG Pro 15 (Early 2021, RTX 3080) | |
| Media Intel Core i7-10875H (0.546 - 0.662, n=29) | |
| Lenovo Legion C7 15IMH05 82EH0030GE | |
| Alienware m15 R4 | |
| Lenovo Legion C7 15IMH05 82EH0030GE (Hoechstleistung) | |
| Lenovo Legion 7 15IMH05-81YT001VGE | |
| Asus ROG Strix G15 G513QR | |
| Media della classe Gaming (0.3439 - 0.759, n=106, ultimi 2 anni) | |
* ... Meglio usare valori piccoli
| PCMark 8 Home Score Accelerated v2 | 4388 punti | |
| PCMark 8 Creative Score Accelerated v2 | 6297 punti | |
| PCMark 8 Work Score Accelerated v2 | 5551 punti | |
| PCMark 10 Score | 6263 punti | |
Aiuto | ||
| DPC Latencies / LatencyMon - interrupt to process latency (max), Web, Youtube, Prime95 | |
| Alienware m15 R4 | |
| Lenovo Legion C7 15IMH05 82EH0030GE | |
| Lenovo Legion 7 15IMH05-81YT001VGE | |
| Schenker XMG Pro 15 (Early 2021, RTX 3080) | |
| Asus ROG Strix G15 G513QR | |
* ... Meglio usare valori piccoli

| Lenovo Legion C7 15IMH05 82EH0030GE Samsung PM981a MZVLB1T0HBLR | Alienware m15 R4 Micron 2300 1TB MTFDHBA1T0TDV | Asus ROG Strix G15 G513QR SK Hynix HFM001TD3JX013N | Schenker XMG Pro 15 (Early 2021, RTX 3080) Samsung SSD 970 EVO Plus 1TB | Lenovo Legion 7 15IMH05-81YT001VGE 2x Samsung PM981a MZVLB1T0HBLR (RAID 0) | Media Samsung PM981a MZVLB1T0HBLR | Media della classe Gaming | |
|---|---|---|---|---|---|---|---|
| CrystalDiskMark 5.2 / 6 | 5% | 19% | 9% | 2% | 67% | ||
| Write 4K (MB/s) | 107.9 | 93.7 -13% | 160.9 49% | 110.4 2% | 139.7 ? 29% | 199.6 ? 85% | |
| Read 4K (MB/s) | 48.48 | 48.1 -1% | 54 11% | 55.1 14% | 49.9 ? 3% | 78.6 ? 62% | |
| Write Seq (MB/s) | 2910 | 2785 -4% | 2944 1% | 2036 ? -30% | 3758 ? 29% | ||
| Read Seq (MB/s) | 2015 | 2598 29% | 2781 38% | 2014 ? 0% | 3633 ? 80% | ||
| Write 4K Q32T1 (MB/s) | 413 | 481.9 17% | 495.2 20% | 466.6 13% | 461 ? 12% | 614 ? 49% | |
| Read 4K Q32T1 (MB/s) | 468.9 | 521 11% | 593 26% | 517 10% | 499 ? 6% | 710 ? 51% | |
| Write Seq Q32T1 (MB/s) | 3016 | 3362 11% | 3283 9% | 3424 14% | 2903 ? -4% | 5333 ? 77% | |
| Read Seq Q32T1 (MB/s) | 3533 | 3200 -9% | 3549 0% | 3519 0% | 3479 ? -2% | 7102 ? 101% | |
| Write 4K Q8T8 (MB/s) | 1496 | 1491 ? | 1308 ? | ||||
| Read 4K Q8T8 (MB/s) | 1597 | 1499 ? | 1647 ? | ||||
| AS SSD | -23% | 2% | 24% | 1% | 1% | 52% | |
| Seq Read (MB/s) | 2804 | 2658 -5% | 2881 3% | 2959 6% | 3088 10% | 2553 ? -9% | 5591 ? 99% |
| Seq Write (MB/s) | 2765 | 2769 0% | 1570 -43% | 2521 -9% | 2561 -7% | 2084 ? -25% | 3972 ? 44% |
| 4K Read (MB/s) | 44.96 | 46.07 2% | 52.4 17% | 50.9 13% | 43.01 -4% | 53.1 ? 18% | 71.1 ? 58% |
| 4K Write (MB/s) | 98.3 | 87.2 -11% | 124 26% | 141.1 44% | 102 4% | 131.2 ? 33% | 215 ? 119% |
| 4K-64 Read (MB/s) | 1503 | 1372 -9% | 1334 -11% | 2110 40% | 1549 3% | 1477 ? -2% | 1618 ? 8% |
| 4K-64 Write (MB/s) | 1845 | 1247 -32% | 2189 19% | 2329 26% | 1378 -25% | 1805 ? -2% | 2935 ? 59% |
| Access Time Read * (ms) | 0.058 | 0.052 10% | 0.055 5% | 0.034 41% | 0.051 12% | 0.04983 ? 14% | 0.06364 ? -10% |
| Access Time Write * (ms) | 0.038 | 0.098 -158% | 0.03 21% | 0.026 32% | 0.037 3% | 0.04222 ? -11% | 0.03794 ? -0% |
| Score Read (Points) | 1828 | 1684 -8% | 1675 -8% | 2457 34% | 1901 4% | 1786 ? -2% | 2248 ? 23% |
| Score Write (Points) | 2220 | 1611 -27% | 2470 11% | 2722 23% | 1737 -22% | 2144 ? -3% | 3547 ? 60% |
| Score Total (Points) | 4983 | 4166 -16% | 4943 -1% | 6412 29% | 4583 -8% | 4826 ? -3% | 6872 ? 38% |
| Copy ISO MB/s (MB/s) | 1904 | 1277 -33% | 2275 19% | 2684 41% | 2098 ? 10% | 3168 ? 66% | |
| Copy Program MB/s (MB/s) | 567 | 575 1% | 593 5% | 544 -4% | 500 ? -12% | 981 ? 73% | |
| Copy Game MB/s (MB/s) | 1112 | 1272 14% | 1408 27% | 1116 0% | 1132 ? 2% | 2112 ? 90% | |
| Media totale (Programma / Settaggio) | -9% /
-11% | 2% /
2% | 22% /
22% | 5% /
3% | 2% /
1% | 60% /
57% |
* ... Meglio usare valori piccoli
Continuous read speed: DiskSpd Read Loop, Queue Depth 8

| 3DMark 11 Performance | 22214 punti | |
| 3DMark Cloud Gate Standard Score | 45007 punti | |
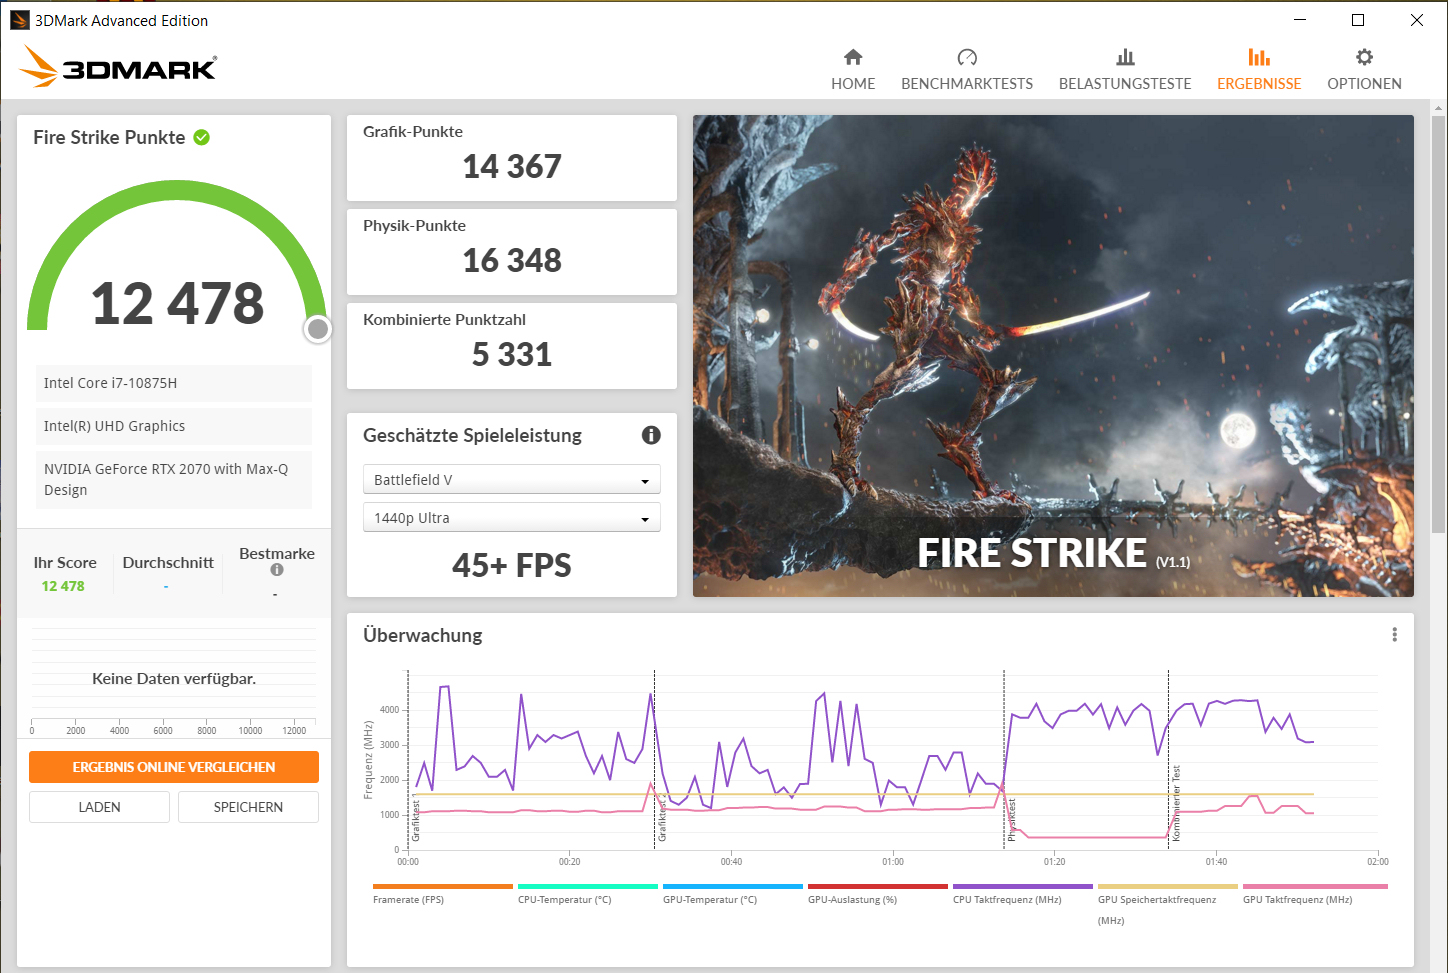
| 3DMark Fire Strike Score | 16977 punti | |
| 3DMark Time Spy Score | 7411 punti | |
Aiuto | ||
| 3DMark 11 - 1280x720 Performance GPU | |
| Media della classe Gaming (21841 - 80022, n=104, ultimi 2 anni) | |
| Alienware m15 R4 | |
| Schenker XMG Pro 15 (Early 2021, RTX 3080) | |
| Asus ROG Strix G15 G513QR | |
| Lenovo Legion 7 15IMH05-81YT001VGE | |
| Lenovo Legion C7 15IMH05 82EH0030GE (Hoechstleistung) | |
| Lenovo Legion C7 15IMH05 82EH0030GE | |
| Media NVIDIA GeForce RTX 2070 Max-Q (14723 - 27694, n=31) | |
| 3DMark | |
| 1920x1080 Fire Strike Graphics | |
| Media della classe Gaming (12242 - 62849, n=115, ultimi 2 anni) | |
| Alienware m15 R4 | |
| Schenker XMG Pro 15 (Early 2021, RTX 3080) | |
| Asus ROG Strix G15 G513QR | |
| Lenovo Legion 7 15IMH05-81YT001VGE | |
| Lenovo Legion C7 15IMH05 82EH0030GE (Hoechstleistung) | |
| Lenovo Legion C7 15IMH05 82EH0030GE | |
| Media NVIDIA GeForce RTX 2070 Max-Q (11563 - 21191, n=31) | |
| 1280x720 Cloud Gate Standard Graphics | |
| Alienware m15 R4 | |
| Media della classe Gaming (86886 - 223650, n=60, ultimi 2 anni) | |
| Schenker XMG Pro 15 (Early 2021, RTX 3080) | |
| Lenovo Legion C7 15IMH05 82EH0030GE | |
| Media NVIDIA GeForce RTX 2070 Max-Q (39014 - 134255, n=28) | |
| Asus ROG Strix G15 G513QR | |
| 2560x1440 Time Spy Graphics | |
| Media della classe Gaming (5012 - 26212, n=114, ultimi 2 anni) | |
| Alienware m15 R4 | |
| Asus ROG Strix G15 G513QR | |
| Schenker XMG Pro 15 (Early 2021, RTX 3080) | |
| Lenovo Legion 7 15IMH05-81YT001VGE | |
| Lenovo Legion C7 15IMH05 82EH0030GE (Hoechstleistung) | |
| Lenovo Legion C7 15IMH05 82EH0030GE | |
| Media NVIDIA GeForce RTX 2070 Max-Q (5948 - 8065, n=28) | |
| The Witcher 3 - 1920x1080 Ultra Graphics & Postprocessing (HBAO+) | |
| Media della classe Gaming (104.7 - 240, n=6, ultimi 2 anni) | |
| Alienware m15 R4 | |
| Schenker XMG Pro 15 (Early 2021, RTX 3080) | |
| Asus ROG Strix G15 G513QR | |
| Lenovo Legion 7 15IMH05-81YT001VGE | |
| Lenovo Legion C7 15IMH05 82EH0030GE (Hoechstleistung) | |
| Lenovo Legion C7 15IMH05 82EH0030GE | |
| Media NVIDIA GeForce RTX 2070 Max-Q (56 - 83.8, n=31) | |
| Dota 2 Reborn - 1920x1080 ultra (3/3) best looking | |
| Media della classe Gaming (84.8 - 248, n=107, ultimi 2 anni) | |
| Alienware m15 R4 | |
| Lenovo Legion 7 15IMH05-81YT001VGE | |
| Lenovo Legion C7 15IMH05 82EH0030GE | |
| Lenovo Legion C7 15IMH05 82EH0030GE (Hoechstleistung) | |
| Media NVIDIA GeForce RTX 2070 Max-Q (105.8 - 126, n=13) | |
| Schenker XMG Pro 15 (Early 2021, RTX 3080) | |
| Lenovo Legion C7 15IMH05 82EH0030GE (Fluestermodus) | |
| Asus ROG Strix G15 G513QR | |
| X-Plane 11.11 - 1920x1080 high (fps_test=3) | |
| Media della classe Gaming (55.5 - 143.5, n=109, ultimi 2 anni) | |
| Alienware m15 R4 | |
| Lenovo Legion 7 15IMH05-81YT001VGE | |
| Lenovo Legion C7 15IMH05 82EH0030GE (Hoechstleistung) | |
| Lenovo Legion C7 15IMH05 82EH0030GE | |
| Schenker XMG Pro 15 (Early 2021, RTX 3080) | |
| Media NVIDIA GeForce RTX 2070 Max-Q (61.6 - 85.3, n=11) | |
| Lenovo Legion C7 15IMH05 82EH0030GE (Fluestermodus) | |
| Asus ROG Strix G15 G513QR | |
| Far Cry 5 - 1920x1080 Ultra Preset AA:T | |
| Media della classe Gaming (70 - 151, n=6, ultimi 2 anni) | |
| Lenovo Legion 7 15IMH05-81YT001VGE | |
| Alienware m15 R4 | |
| Lenovo Legion C7 15IMH05 82EH0030GE (Hoechstleistung) | |
| Lenovo Legion C7 15IMH05 82EH0030GE | |
| Asus ROG Strix G15 G513QR | |
| Media NVIDIA GeForce RTX 2070 Max-Q (67 - 101, n=7) | |
| Shadow of the Tomb Raider - 1920x1080 Highest Preset AA:T | |
| Lenovo Legion 7 15IMH05-81YT001VGE | |
| Media della classe Gaming (96 - 116, n=2, ultimi 2 anni) | |
| Schenker XMG Pro 15 (Early 2021, RTX 3080) | |
| Lenovo Legion C7 15IMH05 82EH0030GE | |
| Media NVIDIA GeForce RTX 2070 Max-Q (57 - 89, n=12) | |
| Dirt 5 - 1920x1080 Ultra High Preset | |
| Lenovo Legion C7 15IMH05 82EH0030GE | |
| Media NVIDIA GeForce RTX 2070 Max-Q (n=1) | |
| Hitman 3 - 1920x1080 Maximum Settings AF:16x | |
| Lenovo Legion C7 15IMH05 82EH0030GE | |
| Media NVIDIA GeForce RTX 2070 Max-Q (n=1) | |
| basso | medio | alto | ultra | |
|---|---|---|---|---|
| The Witcher 3 (2015) | 301 | 221 | 130 | 72.4 |
| Dota 2 Reborn (2015) | 155 | 139 | 131 | 125 |
| X-Plane 11.11 (2018) | 115 | 101 | 84.4 | |
| Far Cry 5 (2018) | 160 | 113 | 105 | 99 |
| Shadow of the Tomb Raider (2018) | 144 | 107 | 96 | 86 |
| Serious Sam 4 (2020) | 120 | 82.6 | 73.2 | 59.8 |
| Watch Dogs Legion (2020) | 123 | 88.2 | 77.5 | 51.5 |
| Dirt 5 (2020) | 168 | 92.1 | 75.5 | 56.6 |
| Assassin´s Creed Valhalla (2020) | 102 | 71 | 59 | 53 |
| Immortals Fenyx Rising (2020) | 124 | 84 | 76 | 70 |
| Cyberpunk 2077 1.0 (2020) | 115 | 65 | 54.9 | 47.1 |
| Hitman 3 (2021) | 192.7 | 117.2 | 104.5 | 95.5 |
Rumorosità
| Idle |
| 24.9 / 24.9 / 24.9 dB(A) |
| Sotto carico |
| 34.6 / 47.7 dB(A) |
 | ||
30 dB silenzioso 40 dB(A) udibile 50 dB(A) rumoroso |
||
min: | ||
(±) La temperatura massima sul lato superiore è di 41.4 °C / 107 F, rispetto alla media di 40.4 °C / 105 F, che varia da 21.2 a 68.8 °C per questa classe Gaming.
(-) Il lato inferiore si riscalda fino ad un massimo di 45.1 °C / 113 F, rispetto alla media di 43.2 °C / 110 F
(+) In idle, la temperatura media del lato superiore è di 25.4 °C / 78 F, rispetto alla media deld ispositivo di 33.9 °C / 93 F.
(±) Riproducendo The Witcher 3, la temperatura media per il lato superiore e' di 33.1 °C / 92 F, rispetto alla media del dispositivo di 33.9 °C / 93 F.
(+) I poggiapolsi e il touchpad sono piu' freddi della temperatura della pelle con un massimo di 30.6 °C / 87.1 F e sono quindi freddi al tatto.
(±) La temperatura media della zona del palmo della mano di dispositivi simili e'stata di 28.8 °C / 83.8 F (-1.8 °C / -3.3 F).
Lenovo Legion C7 15IMH05 82EH0030GE analisi audio
(±) | potenza degli altiparlanti media ma buona (72 dB)
Bassi 100 - 315 Hz
(-) | quasi nessun basso - in media 20.7% inferiori alla media
(±) | la linearità dei bassi è media (10.6% delta rispetto alla precedente frequenza)
Medi 400 - 2000 Hz
(+) | medi bilanciati - solo only 3.7% rispetto alla media
(+) | medi lineari (5.9% delta rispetto alla precedente frequenza)
Alti 2 - 16 kHz
(+) | Alti bilanciati - appena 2.6% dalla media
(+) | alti lineari (4.4% delta rispetto alla precedente frequenza)
Nel complesso 100 - 16.000 Hz
(±) | la linearità complessiva del suono è media (15.3% di differenza rispetto alla media
Rispetto alla stessa classe
» 34% di tutti i dispositivi testati in questa classe è stato migliore, 6% simile, 60% peggiore
» Il migliore ha avuto un delta di 6%, medio di 18%, peggiore di 132%
Rispetto a tutti i dispositivi testati
» 22% di tutti i dispositivi testati in questa classe è stato migliore, 4% similare, 74% peggiore
» Il migliore ha avuto un delta di 4%, medio di 23%, peggiore di 134%
| Off / Standby | |
| Idle | |
| Sotto carico |
|
Leggenda:
min: | |
| Lenovo Legion C7 15IMH05 82EH0030GE i7-10875H, GeForce RTX 2070 Max-Q, 80 Wh | Alienware m15 R4 i9-10980HK, GeForce RTX 3070 Laptop GPU, 86 Wh | Asus ROG Strix G15 G513QR R9 5900HX, GeForce RTX 3070 Laptop GPU, 90 Wh | Schenker XMG Pro 15 (Early 2021, RTX 3080) i7-10870H, GeForce RTX 3080 Laptop GPU, 73 Wh | Lenovo Legion 7 15IMH05-81YT001VGE i9-10980HK, GeForce RTX 2080 Super Max-Q, 80 Wh | Media della classe Gaming | |
|---|---|---|---|---|---|---|
| Autonomia della batteria | -54% | 45% | -5% | -40% | 5% | |
| Reader / Idle (h) | 12.7 | 3.7 -71% | 8.4 -34% | 8.71 ? -31% | ||
| H.264 (h) | 7.1 | 13.5 90% | 5.5 -23% | 1.5 -79% | 8.64 ? 22% | |
| WiFi v1.3 (h) | 5.9 | 2.7 -54% | 7.4 25% | 7.2 22% | 3.4 -42% | 7.11 ? 21% |
| Load (h) | 1.4 | 0.9 -36% | 1.7 21% | 1.6 14% | 1.4 0% | 1.502 ? 7% |
Pro
Contro
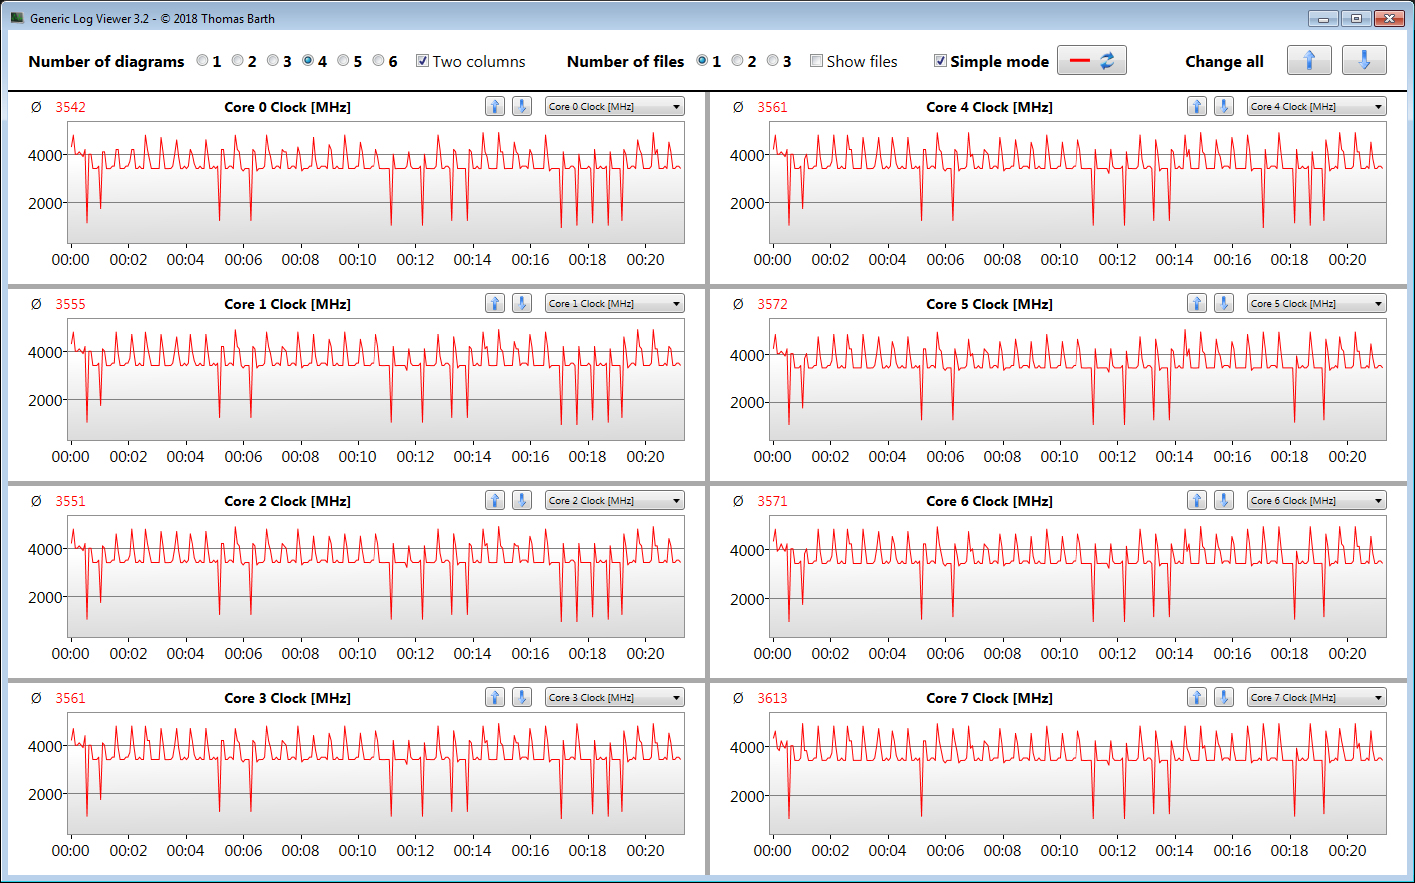
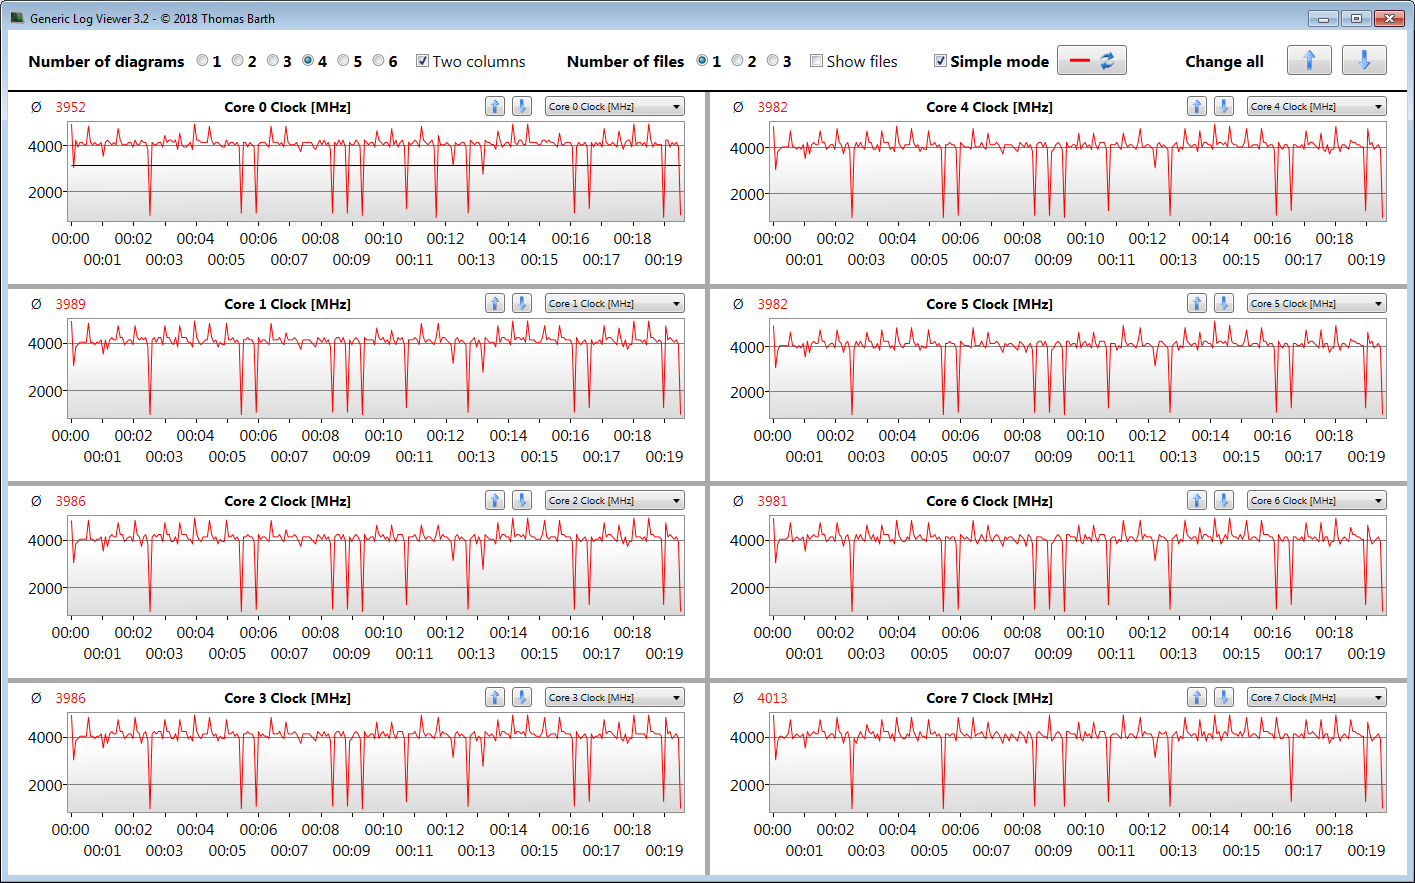
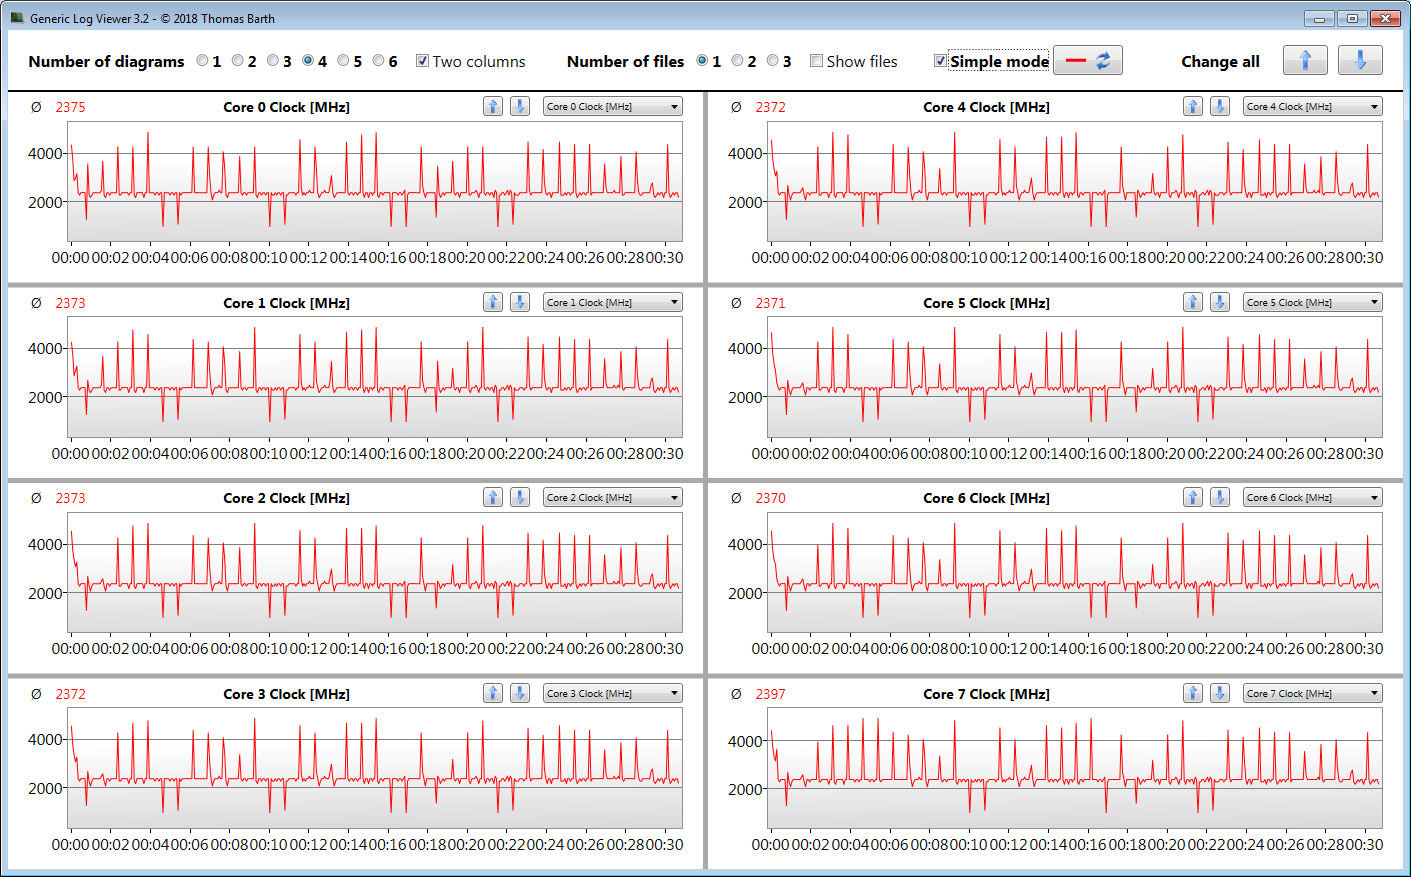
Il Legion C7 fa quello che dovrebbe fare: Può gestire tutti i giochi attuali a 1080p con le impostazioni elevate. Il fatto che non diventa mai troppo rumoroso o troppo caldo lo rende adatto anche ad altri scenari di utilizzo.
Il Lenovo Legion C7 15IMH05 è un notebook completo per gamers e creatori di contenuti.
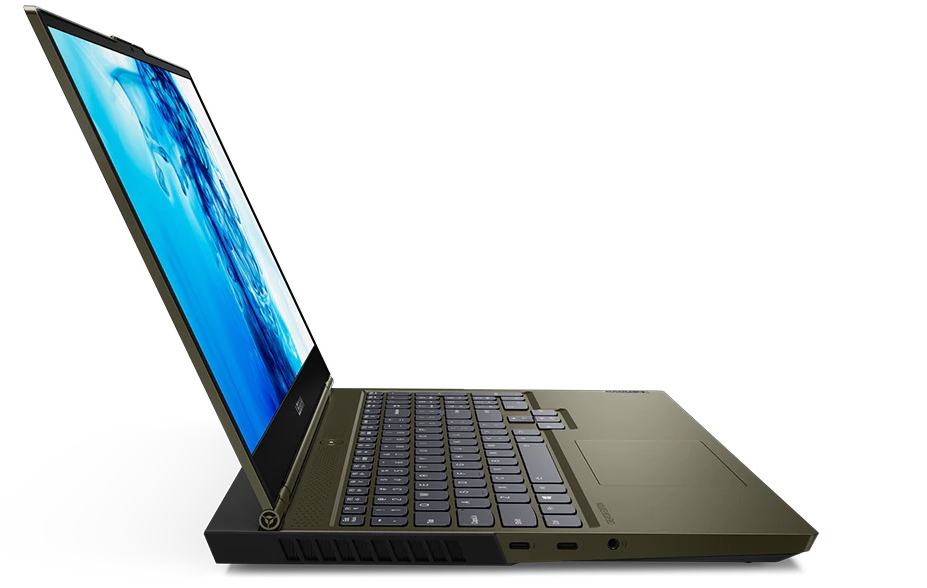
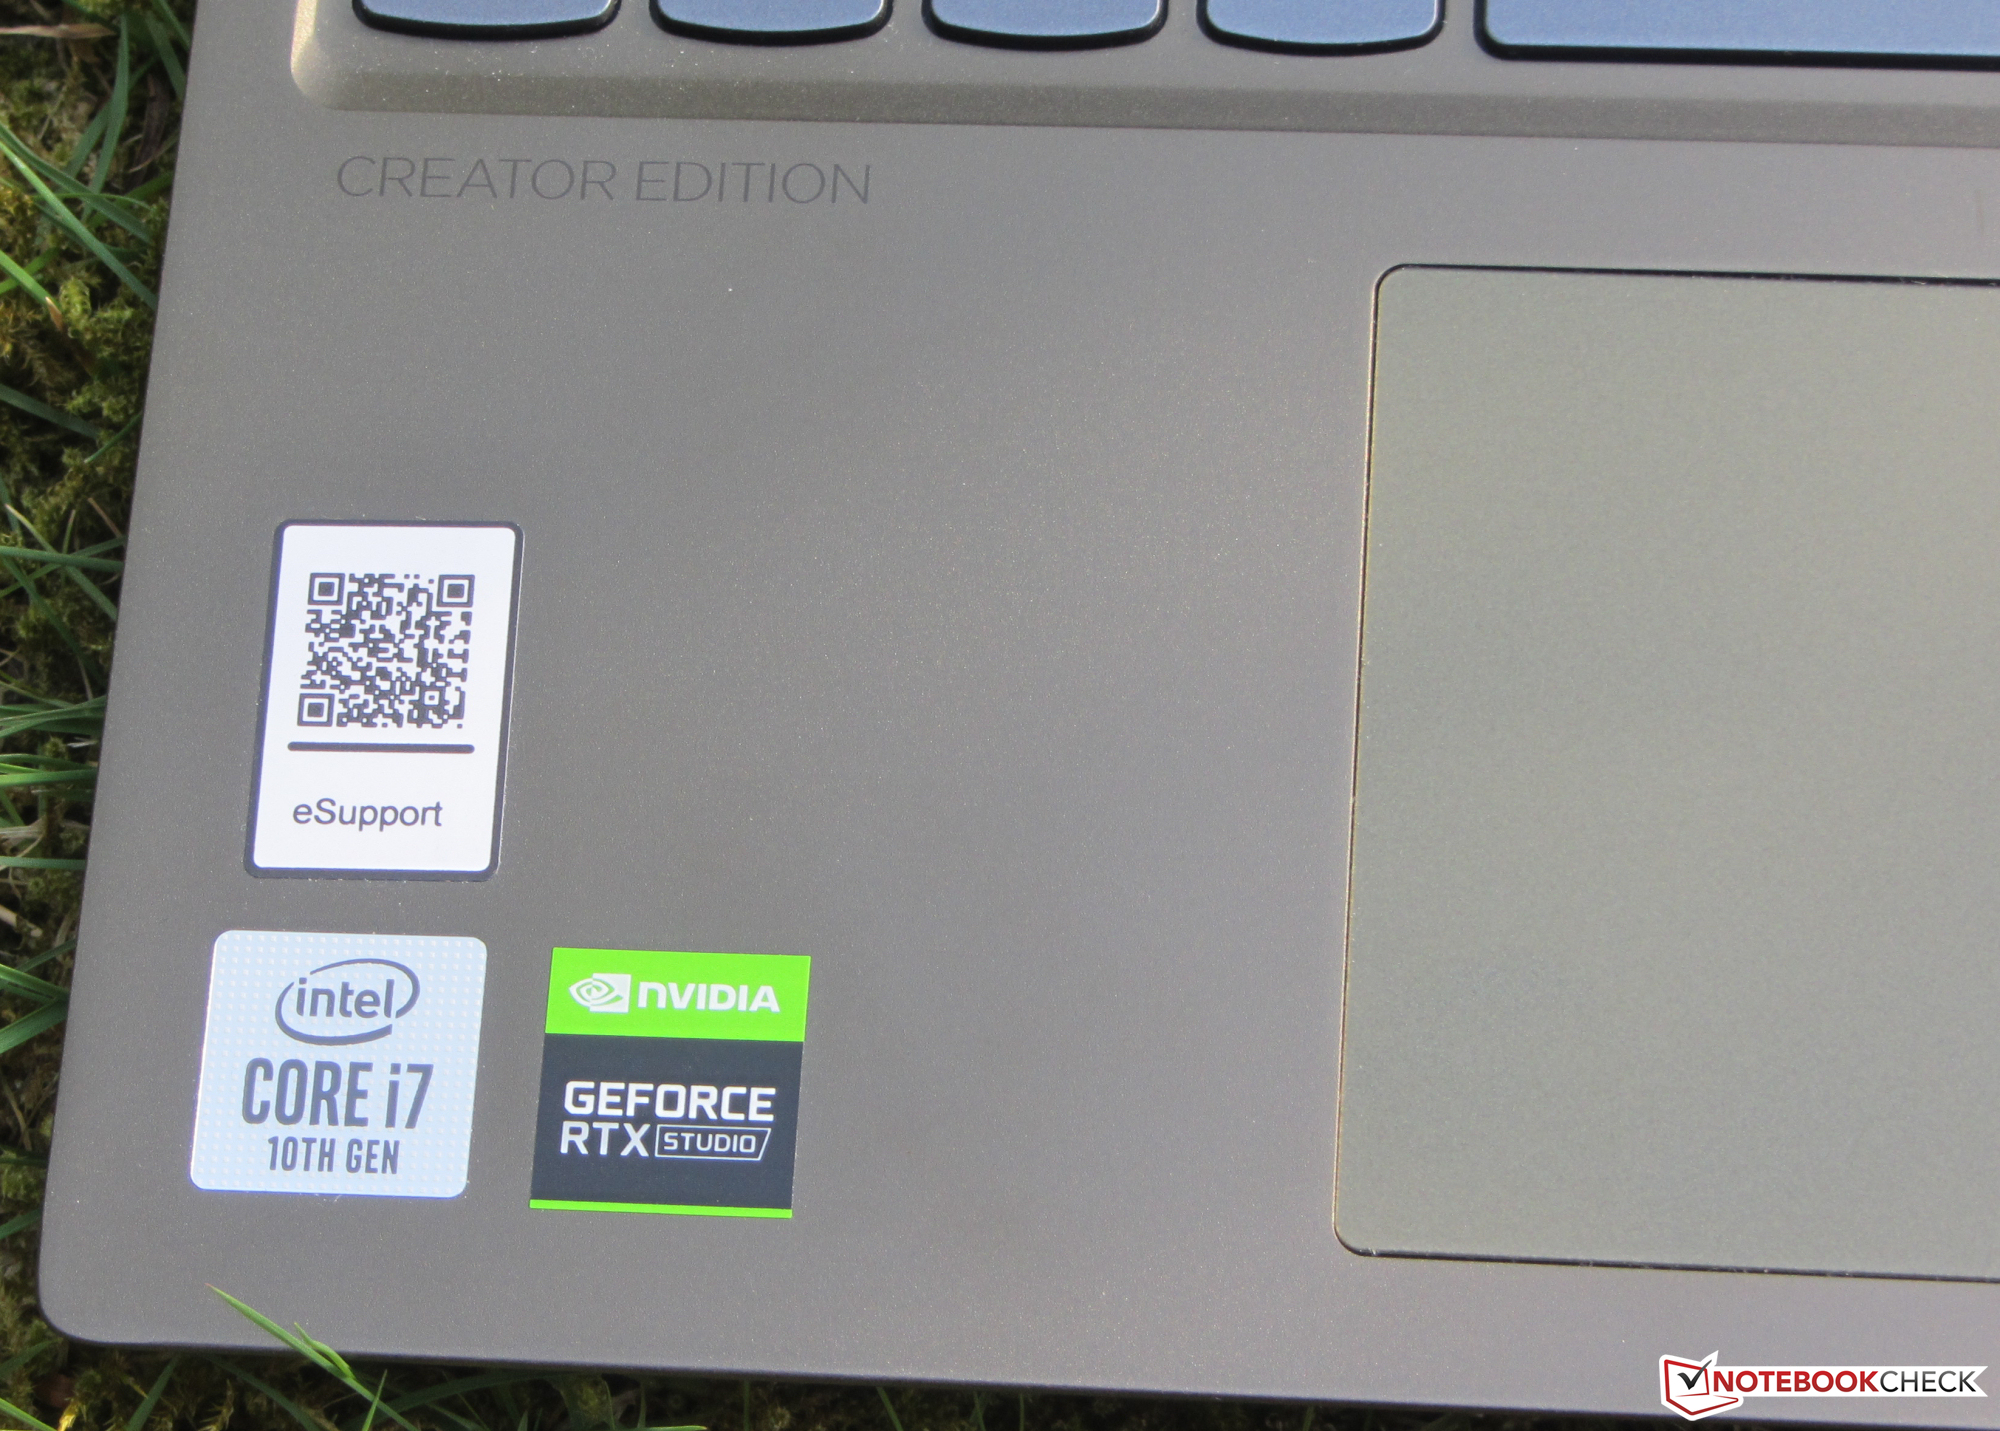
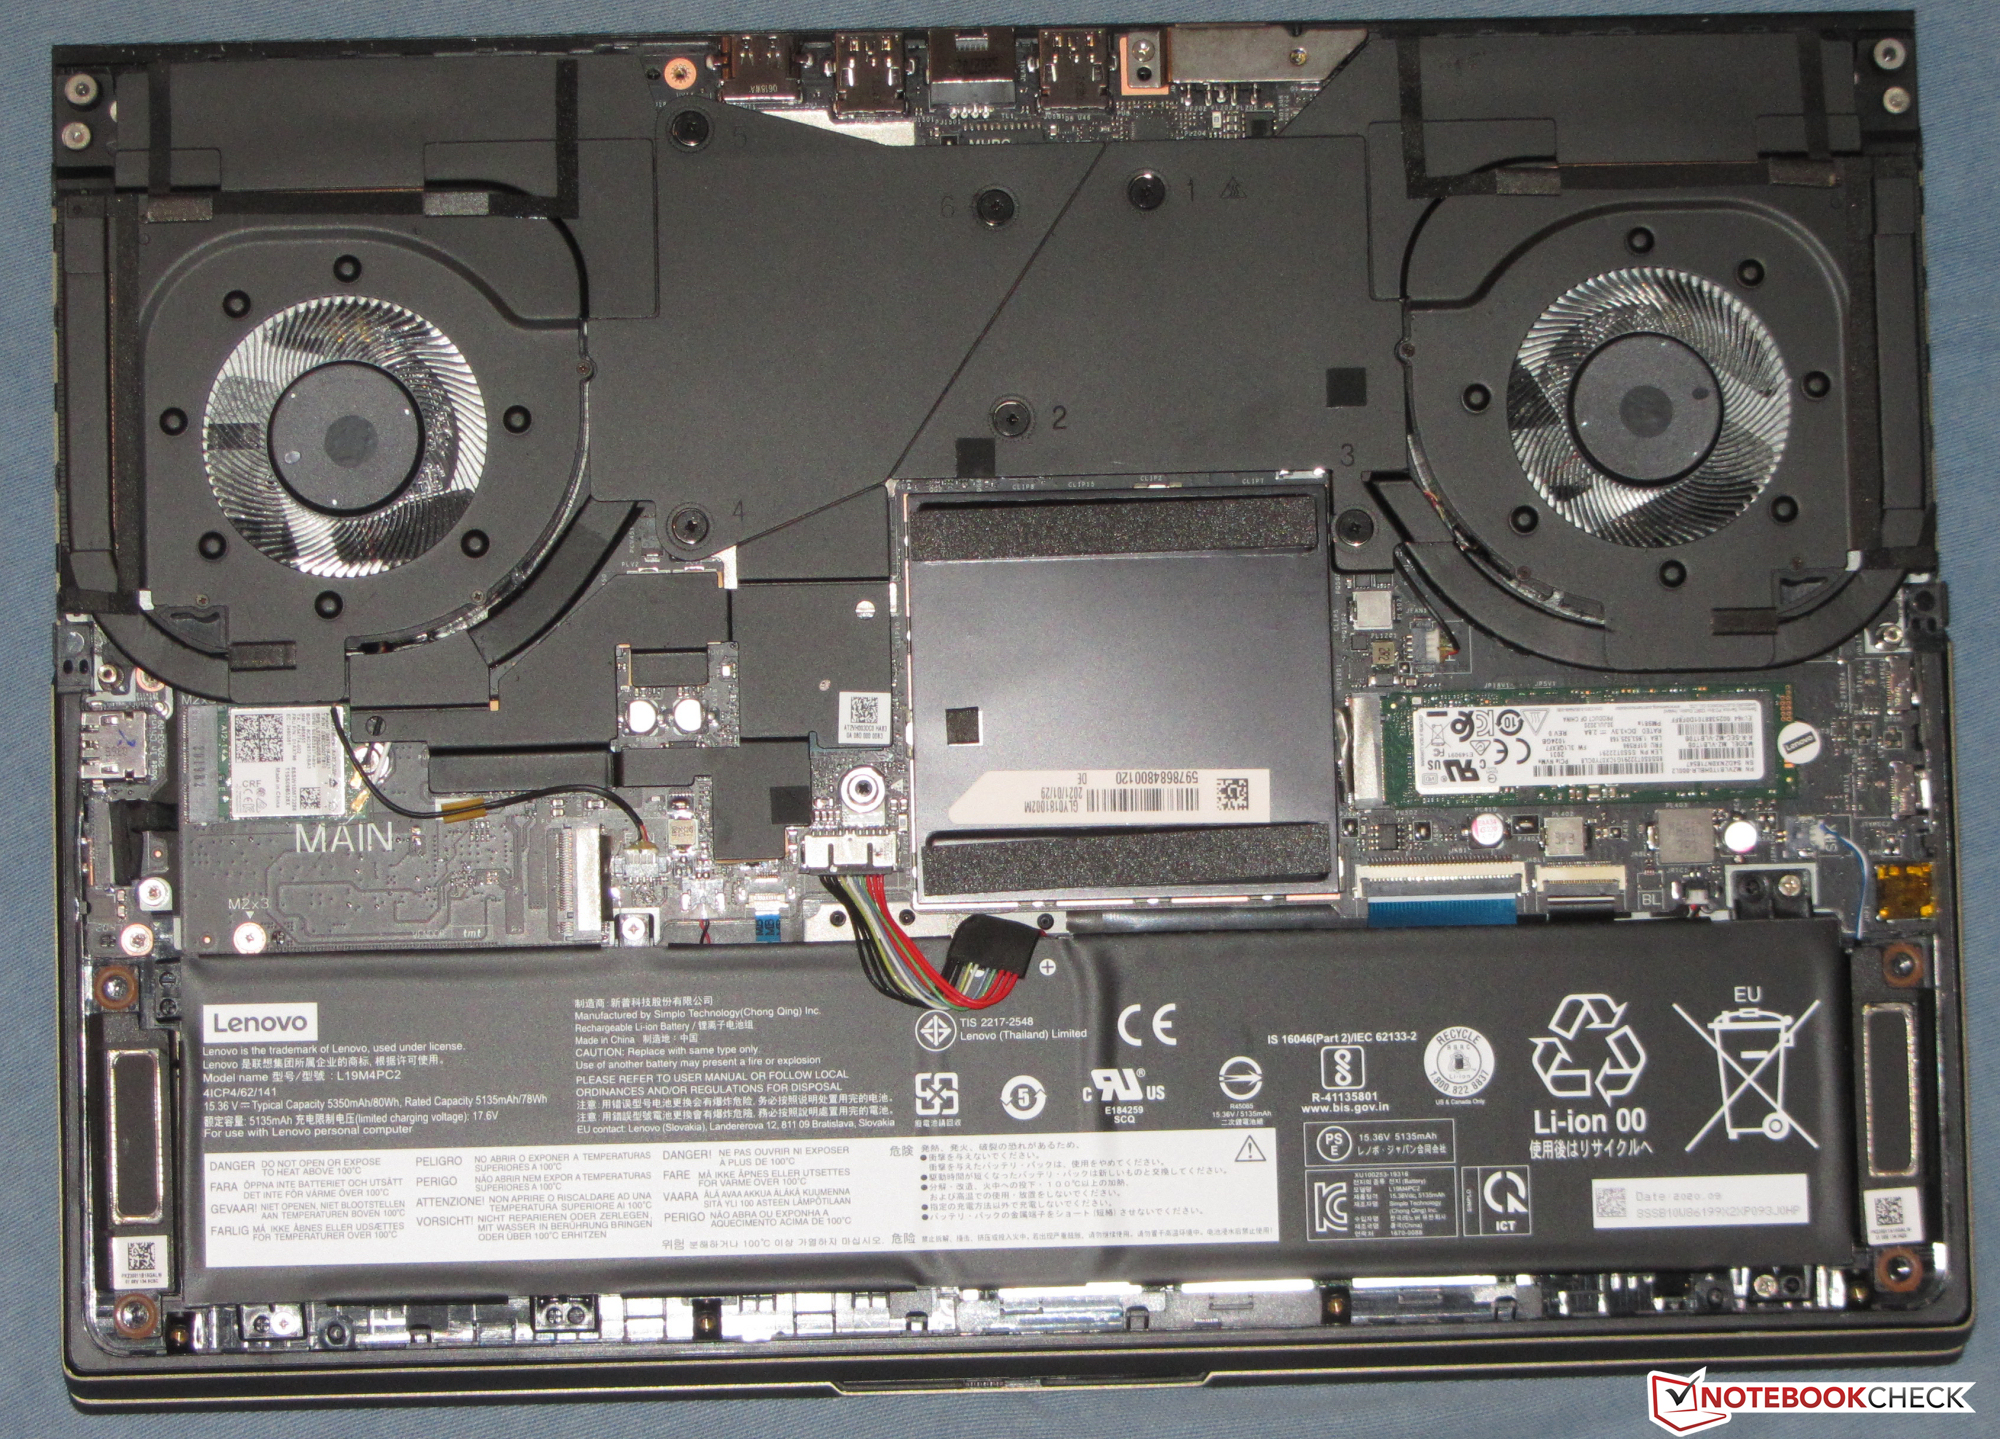
Grazie al Core i7-10875H, alla GeForce RTX 2070 Max-Q, ai 32 GB di RAM dual-channel (64 GB max) e all'SSD da 1 TB, questo portatile Lenovo può gestire tutte le applicazioni attuali. Se necessario, gli utenti possono montare un secondo SSD NVMe nel dispositivo. La porta Thunderbolt 3 permette agli utenti di collegare GPU esterne al notebook.
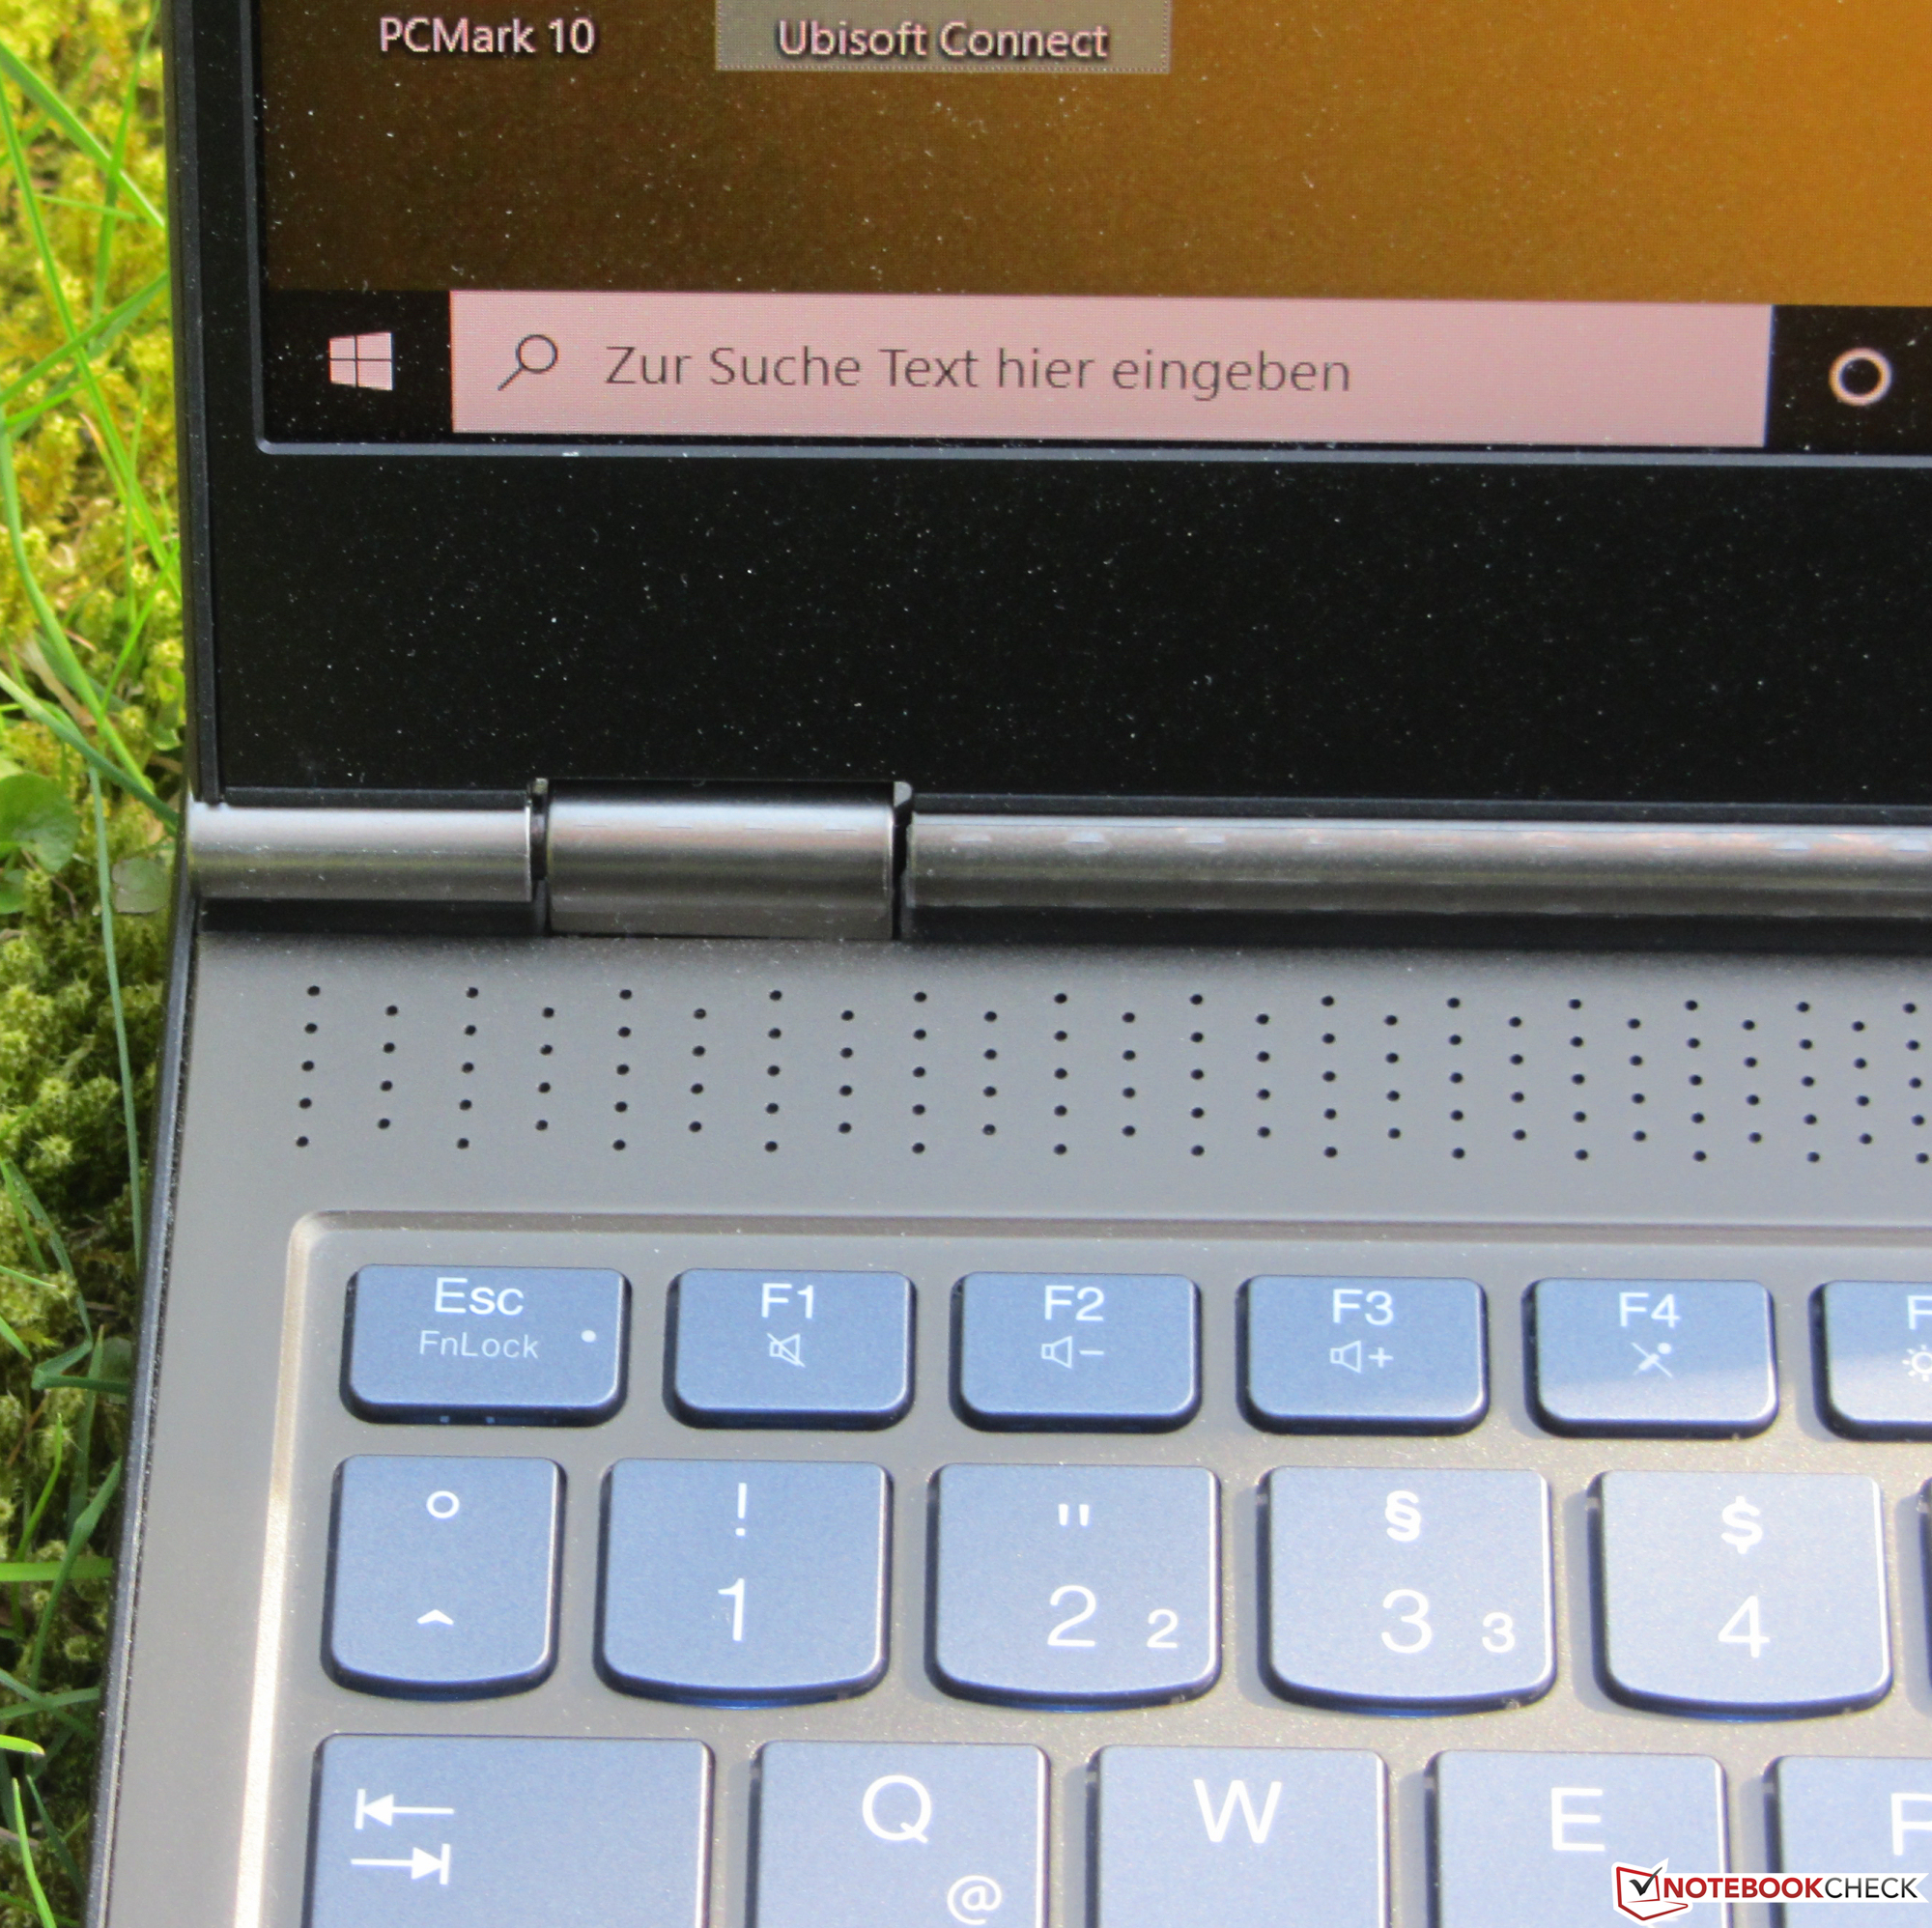
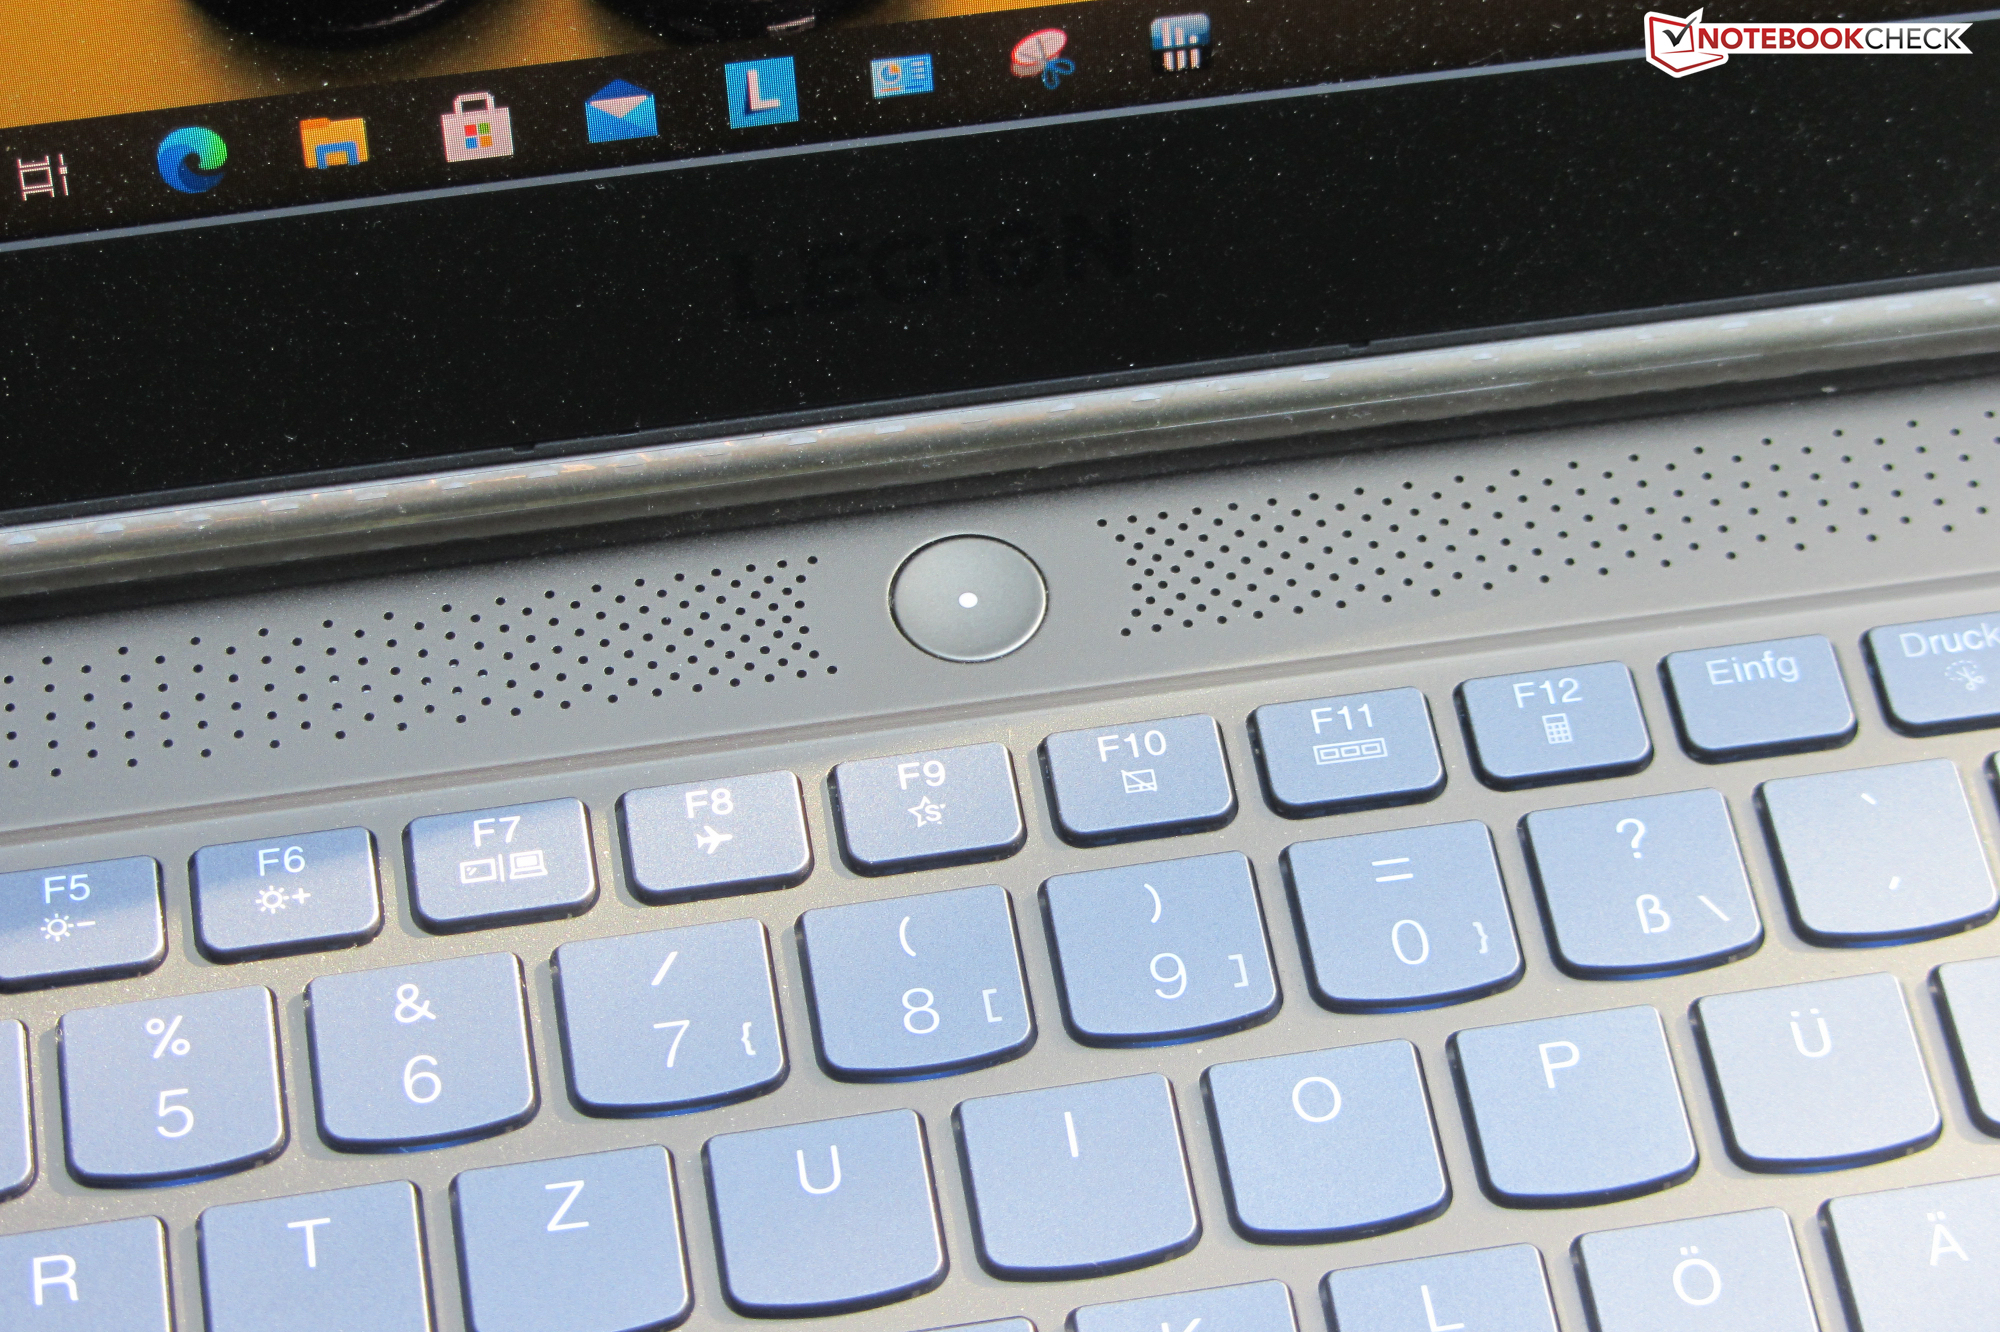
La durata della batteria per questo tipo di dispositivo è ad un buon livello. Il display Full HD a 144 Hz offre una superficie opaca, buoni angoli di visuale e tempi di risposta rapidi. Inoltre, supporta Dolby Vision (una variante dell'HDR) e copre il 100% dello spazio colore sRGB. Sia il rapporto di contrasto che la luminosità sono ad un buon livello. La tastiera retroilluminata è decente. Inoltre, Lenovo offre tre anni di garanzia per il C7.
Lenovo Legion C7 15IMH05 82EH0030GE
- 04/14/2021 v7 (old)
Sascha Mölck
