Notebookcheck Logo

NVIDIA GeForce RTX 3080 Laptop GPU

NVIDIA GeForce RTX 3080 Laptop GPU

La GPU Nvidia GeForce RTX 3080 Laptop o 3080 Mobile (per i computer portatili, GN20-E7) è la scheda grafica più veloce per i notebook all'inizio del 2021. Si basa sul chip GA104-775-A1 Ampere e offre 8 o 16 GB di memoria grafica GDDR6 con un bus di memoria a 256 bit. Supporta PCIe 4.0 e sarà disponibile in diverse varianti da 80 a 150 Watt (TGP) (80, 90, 115, 125, 135, 145 e 150+ Watt). Come pacchetto la scheda grafica del notebook utilizza GB5-256 e la dimensione del chip è di 40x40 mm. La GPU supporta eDP 1.4b per collegare il monitor interno.

Non esiste più la variante Max-Q (precedentemente utilizzata per le varianti a basso consumo), ma ogni OEM può scegliere di implementare le tecnologie Max-Q (Dynamic Boost, Whispermode).

Le prestazioni dipendono dall'impostazione TGP e dal raffreddamento del portatile. Allo stesso livello TGP, la RTX3080 dovrebbe essere più veloce del vecchio modello di punta, la RTX 2080 Super Mobile e simile alla rTX 3070 desktop. Ciò significa che la GPU dovrebbe essere adatta ai giochi 4k o QHD con frame rate elevati. Il nome simile RTX 3080 per desktop è significativamente più veloce.

Il chip GA104 offre 6.144 ALU FP32, di cui la metà può eseguire anche istruzioni INT32 (cioè 3.072 ALU INT32). Con Turing, tutti gli shader possono ancora eseguire istruzioni FP32 o INT32. Secondo Nvidia, sono stati migliorati anche i core di raytracing e tensoriali del chip. I chip Ampere includono anche un codificatore video di quinta generazione migliorato (NVENC per H.264 e H.265) e un decodificatore di settima generazione (per vari formati ora incluso AV1).

Il chip GA104 è prodotto da Samsung in 8nm (8N), che non è in grado di tenere il passo con il nodo 7nm di TSMC (ad esempio, utilizzato da AMD e anche per il chip professionale GA100 Ampere).

GeForce RTX 3000 Serie

NVIDIA GeForce RTX 3090 Ti 10752 @ 1.56 - 1.86 GHz384 Bit @ 21000 MHz
NVIDIA GeForce RTX 3090 10496 @ 1.4 - 1.7 GHz384 Bit @ 19500 MHz
NVIDIA GeForce RTX 3080 Ti 10240 @ 1.37 - 1.67 GHz384 Bit @ 19000 MHz
NVIDIA GeForce RTX 3080 12 GB 8960/ cores @ 1.26 - 1.71 GHz384 Bit @ 19000 MHz
NVIDIA GeForce RTX 3080 8704 @ 1.45 - 1.71 GHz320 Bit @ 19000 MHz
GeForce RTX 3070 Ti 6144 @ 1.58 - 1.77 GHz256 Bit @ 19000 MHz
GeForce RTX 3080 Ti Laptop GPU 7424 @ 0.98 - 1.59 GHz256 Bit @ 14000 MHz
NVIDIA GeForce RTX 3070 5888 @ 1.5 - 1.73 GHz256 Bit @ 14000 MHz
GeForce RTX 3080 Laptop GPU 6144 @ 0.78 - 1.25 GHz256 Bit @ 14000 MHz
NVIDIA GeForce RTX 3060 Ti 4864 @ 1.41 - 1.67 GHz256 Bit @ 14000 MHz
GeForce RTX 3070 Ti Laptop GPU 5888 @ 0.92 - 1.48 GHz256 Bit @ 14000 MHz
GeForce RTX 3070 Laptop GPU 5120 @ 0.78 - 1.29 GHz256 Bit @ 14000 MHz
NVIDIA GeForce RTX 3060 3584 @ 1.32 - 1.78 GHz192 Bit @ 15000 MHz
GeForce RTX 3080 Max-Q 6144 @ 0.78 - 1.25 GHz256 Bit @ 6000 MHz
GeForce RTX 3070 Max-Q 5120 @ 1.29 GHz256 Bit
GeForce RTX 3060 Laptop GPU 3840 @ 0.82 - 1.7 GHz192 Bit @ 14000 MHz
GeForce RTX 3060 Max-Q 3840 @ 1.28 GHz192 Bit
NVIDIA GeForce RTX 3050 2560 @ 1.55 - 1.78 GHz128 Bit Bit @ 1750 MHz
GeForce RTX 3050 Ti Laptop GPU 2560 @ 1.22 - 1.49 GHz128 Bit @ 12000 MHz
GeForce RTX 3050 6GB Laptop GPU 2560 @ 1.24 - 1.49 GHz96 Bit @ 12000 MHz
GeForce RTX 3050 4GB Laptop GPU 2048 @ 1.24 - 1.5 GHz128 Bit @ 12000 MHz
Nome in codiceGN20-E7 GA104
ArchitetturaAmpere
Pipelines6144 - unified
TMUs192
ROPs96
Raytracing Cores48
Velocità del core780 - 1100 - 1245 - 1710 (Boost) MHz
Velocità della memoria14000 effective = 1750 MHz
Larghezza del bus di memoria256 Bit
Tipo di memoriaGDDR6
Max. quantità di memoria16 GB
Memoria condivisano
Memory Bandwidth448 GB/s
APIDirectX 12_2, Shader 6.7, OpenGL 4.6
Consumo di corrente150 Watt (80 - 150 Watt TGP)
Transistor Count17.4 Billion
Die Size 392 mm²
tecnologia8 nm
PCIe4.0
DisplaysHDMI 2.1, DisplayPort 1.4a
CaratteristicheNVIDIA DLSS, NVIDIA Reflex, Resizable BAR, NVIDIA Broadcast, NVIDIA Ansel, NVIDIA ShadowPlay®, NVIDIA G-SYNC®, Advanced Optimus, Nvidia Max-Q, Dynamic Boost, VR-ready, Nvidia Omniverse
Dimensione del portatilegrande
Data dell'annuncio12.01.2021

Benchmark

Performance Rating - 3DMark 11 + Fire Strike + Time Spy
12.4 pt (37%)
3DMark - 3DMark Time Spy Score
min: 6499     media: 10435     media: 10365 (30%)     massimo: 13067 Points
3DMark - 3DMark Time Spy Graphics
min: 6407     media: 10681     media: 10752 (28%)     massimo: 13210 Points
3DMark - 3DMark Ice Storm Unlimited Graphics
min: 444648     media: 551636     media: 544242 (62%)     massimo: 650505 Points
3DMark - 3DMark Ice Storm Extreme Graphics
min: 78873     media: 160168     media: 105728 (14%)     massimo: 415335 Points
3DMark - 3DMark Cloud Gate Score
min: 30210     media: 47565     media: 49494 (53%)     massimo: 65479 Points
3DMark - 3DMark Cloud Gate Graphics
min: 38816     media: 116297     media: 107695 (28%)     massimo: 192950 Points
3DMark - 3DMark Fire Strike Standard Score
min: 13393     media: 22296     media: 22750 (40%)     massimo: 27685 Points
3DMark - 3DMark Fire Strike Standard Graphics
min: 16455     media: 27420     media: 27194 (31%)     massimo: 32366 Points
3DMark - 3DMark Ice Storm Graphics
min: 40654     media: 137205     media: 79586.5 (10%)     massimo: 462145 Points
3DMark - 3DMark Wild Life Unlimited
min: 58406     media: 69018     media: 66168 (33%)     massimo: 81508 Points
3DMark - 3DMark Wild Life Extreme Unlimited
min: 20061     media: 22847     media: 21712 (25%)     massimo: 26393 Points
3DMark - 3DMark Night Raid
min: 27201     media: 36576     media: 36125 (34%)     massimo: 52124 Points
3DMark - 3DMark Night Raid Graphics Score
min: 33157     media: 62060     media: 56082.5 (22%)     massimo: 114808 Points
3DMark 11 - 3DM11 Performance Score
min: 22428     media: 29044     media: 29220 (40%)     massimo: 32922 Points
3DMark 11 - 3DM11 Performance GPU
min: 31288     media: 38259     media: 37933 (33%)     massimo: 43744 Points
3DMark Vantage
3DM Vant. Perf. total +
3DMark Vantage - 3DM Vant. Perf. total
min: 61664     media: 75136     media: 78406 (23%)     massimo: 82066 Points
3DM Vant. Perf. GPU no PhysX +
3DMark 05 - 3DMark 05 - Standard
min: 50419     media: 54320     media: 54800 (60%)     massimo: 57262 Points
Intel Graphics Media Accelerator (GMA) 500
133.4 -100%
...
AMD Radeon 660M
43616 -20%
AMD Radeon 680M
43633 -20%
44045 -19%
46269 -15%
48758 -10%
50971 -6%
52117 -4%
53254 -2%
53586 -1%
NVIDIA GeForce RTX 3080 Laptop GPU
54320
55811 3%
61850 14%
68064 25%
max:
87172 60%
0%
100%
3DMark 06 3DMark 06 - Standard 1280x1024 +
3DMark 06
min: 40441     media: 45930     media: 45730.5 (60%)     massimo: 51819 Points
Unigine Valley 1.0 - Unigine Valley 1.0 DX
min: 124.6     media: 128.3     media: 129.4 (42%)     massimo: 129.8 fps
SPECviewperf 12
specvp12 sw-03 +
SPECviewperf 12 - specvp12 sw-03
min: 69.8     media: 75     media: 75.9 (19%)     massimo: 78.4 fps
specvp12 snx-02 +
SPECviewperf 12 - specvp12 snx-02
min: 12.5     media: 12.7     media: 12.8 (2%)     massimo: 12.9 fps
specvp12 showcase-01 +
specvp12 mediacal-01 +
specvp12 maya-04 +
specvp12 energy-01 +
specvp12 creo-01 +
SPECviewperf 12 - specvp12 creo-01
min: 61     media: 62.6     media: 62.7 (25%)     massimo: 64.1 fps
specvp12 catia-04 +
specvp12 3dsmax-05 +
SPECviewperf 13 specvp13 sw-04 +
specvp13 snx-03 +
SPECviewperf 13 - specvp13 snx-03
min: 23     media: 23.1     media: 23.1 (3%)     massimo: 23.2 fps
specvp13 showcase-02 +
SPECviewperf 13 - specvp13 showcase-02
min: 120     media: 123.3     media: 120 (26%)     massimo: 133 fps
specvp13 medical-02 +
SPECviewperf 13 - specvp13 medical-02
min: 58.9     media: 59     media: 59 (12%)     massimo: 59.2 fps
specvp13 maya-05 +
specvp13 energy-02 +
SPECviewperf 13 - specvp13 energy-02
min: 24.6     media: 24.7     media: 24.6 (8%)     massimo: 24.8 fps
specvp13 creo-02 +
specvp13 catia-05 +
SPECviewperf 13 - specvp13 catia-05
min: 158     media: 158.8     media: 159 (18%)     massimo: 159 fps
specvp13 3dsmax-06 +
SPECviewperf 13 - specvp13 3dsmax-06
min: 215     media: 215.8     media: 215.5 (37%)     massimo: 217 fps
SPECviewperf 2020 specvp2020 snx-04 1080p +
SPECviewperf 2020 - specvp2020 snx-04 1080p
23.1 fps (4%)
specvp2020 medical-03 1080p +
specvp2020 maya-06 1080p +
specvp2020 energy-03 1080p +
specvp2020 creo-03 1080p +
specvp2020 catia-06 1080p +
specvp2020 3dsmax-07 1080p +
specvp2020 solidworks-05 4k +
specvp2020 snx-04 4k +
specvp2020 medical-03 4k +
SPECviewperf 2020 - specvp2020 medical-03 4k
min: 9.84     media: 10.3     media: 10.5 (10%)     massimo: 10.5 fps
specvp2020 maya-06 4k +
specvp2020 energy-03 4k +
specvp2020 creo-03 4k +
specvp2020 catia-06 4k +
specvp2020 3dsmax-07 4k +
Cinebench R10 Cinebench R10 Shading (32bit) +
Cinebench R10 - Cinebench R10 Shading (32bit)
min: 6839     media: 6844     media: 6843.5 (5%)     massimo: 6850 punti
Cinebench R11.5 Cinebench R11.5 OpenGL 64 Bit +
Cinebench R15
Cinebench R15 OpenGL 64 Bit +
Cinebench R15 - Cinebench R15 OpenGL 64 Bit
min: 115     media: 182.3     media: 183.2 (11%)     massimo: 255.42 fps
Cinebench R15 OpenGL Ref. Match 64 Bit +
Cinebench R15 - Cinebench R15 OpenGL Ref. Match 64 Bit
99.6 % (100%)
Basemark GPU 1.2 - Basemark GPU 1.2 Vulkan Official Medium Offscreen 1080
min: 243     media: 244.5     media: 245 (2%)     massimo: 245 fps
Basemark GPU 1.2 - Basemark GPU 1.2 Vulkan Official High Offscreen 2160
min: 16.7     media: 17.9     media: 18.2 (4%)     massimo: 18.3 fps
Geekbench 6.2 - Geekbench 6.2 GPU OpenCL
min: 115109     media: 119516     media: 118365 (34%)     massimo: 129446 punti
Geekbench 6.2 - Geekbench 6.2 GPU Vulkan
min: 22054     media: 38442     media: 22271 (7%)     massimo: 103350 punti
LuxMark v2.0 64Bit - LuxMark v2.0 Room GPU
min: 4895     media: 4937     media: 4908 (22%)     massimo: 5062 Samples/s
ComputeMark v2.1 - ComputeMark v2.1 Result
min: 23023     media: 24296     media: 23303.5 (25%)     massimo: 28376 punti
Power Consumption - Furmark Stress Test Power Consumption - external Monitor *
min: 122     media: 174.9     media: 168.2 (24%)     massimo: 254 Watt
0153045607590105120135150165180195210225240255Tooltip
Power Consumption - The Witcher 3 Power Consumption - external Monitor *
min: 124     media: 184.3     media: 183 (26%)     massimo: 244 Watt
0153045607590105120135150165180195210225240Tooltip
Power Consumption - Witcher 3 Power Consumption *
min: 123     media: 186.6     media: 189 (42%)     massimo: 297 Watt
0153045607590105120135150165180195210225240255Tooltip
Power Consumption - Witcher 3 ultra Power Efficiency
min: 0.4141     media: 0.6     media: 0.6 (51%)     massimo: 0.74 fps per Watt
0102030405060708090100110120130140Tooltip
Power Consumption - Witcher 3 ultra Power Efficiency - external Monitor
min: 0.4696     media: 0.6     media: 0.6 (47%)     massimo: 0.736 fps per Watt
Power Consumption - Cyberpunk 2077 Power Consumption - external Monitor *
min: 194.7     media: 200.4     media: 200.4 (25%)     massimo: 206 Watt
0153045607590105120135150165180195210Tooltip
Emissions Witcher 3 Fan Noise +
Emissions - Witcher 3 Fan Noise
min: 36.8     media: 49     media: 49.5 (79%)     massimo: 61 dB(A)
Clock Speed - GPU Clock Witcher 3 ultra
min: 1260     media: 1530     media: 1492.5 (59%)     massimo: 1815 MHz
Clock Speed - GPU Clock Speed Furmark
1185 MHz (47%)
- Valori di benchmark per questa scheda grafica
- Valori medi di benchmark per questa scheda grafica
* Numeri più piccoli rappresentano prestazioni supeiori

Benchmarks per i giochi

I seguenti benchmarks deirivano dai benchmarks dei portatili recensiti. Le prestazioni dipendono dalla scheda grafica utilizzata, dal clock rate, dal processore, dai settaggi di sistema, dai drivers, e dai sistemi operativi. Quindi i risultati non sono rappresentativi per i portatili con questa GPU. Per informazioni dettagliate sui risultati del benchmark, cliccate sul numero di fps.

basso 1920x1080
147.6  fps    + Confronta + 📈 Graph
medio 1920x1080
93.3  fps    + Confronta + 📈 Graph
alto 1920x1080
76.1  fps    + Confronta + 📈 Graph
ultra 1920x1080
64.5  fps    + Confronta + 📈 Graph
QHD 2560x1440
43.3  fps    + Confronta + 📈 Graph
4K 3840x2160
23.9  fps    + Confronta + 📈 Graph
3840x2160
24.3  fps    + Confronta + 📈 Graph
» Giocabile con tutti i portatili testati con dettagli ultra.
Additional Benchmarks
Low Preset 1280x720
179.6
Ultra Preset + Ultra Ray Tracing + DLSS Quality 2560x1440
41.7
F1 24

F1 24

2024
basso 1920x1080
244  fps    + Confronta
medio 1920x1080
227  fps    + Confronta
alto 1920x1080
176.4  fps    + Confronta
ultra 1920x1080
59.3  fps    + Confronta
QHD 2560x1440
38.7  fps    + Confronta
4K 3840x2160
18.8  fps    + Confronta
3840x2160
33.5  fps    + Confronta
» Giocabile con tutti i portatili testati con dettagli ultra.
Additional Benchmarks
Ultra High Preset + Quality DLSS 16xAF 2560x1440
61.1
basso 1920x1080
57.6 59.3 ~ 58 fps    + Confronta + 📈 Graph
medio 1920x1080
48.2 49.9 ~ 49 fps    + Confronta + 📈 Graph
alto 1920x1080
35.6 37 ~ 36 fps    + Confronta + 📈 Graph
QHD 2560x1440
25.9 26.3 ~ 26 fps    + Confronta + 📈 Graph
4K 3840x2160
14.4 14.5 ~ 14 fps    + Confronta + 📈 Graph
3840x2160
23.7 24.5 24.8 ~ 24 fps    + Confronta + 📈 Graph
» Giocabile con tutti i portatili testati con dettagli alto.
Additional Benchmarks
High Preset + Quality DLSS 2560x1440
37.3
38.3
High Preset + Quality FSR 2560x1440
37.2
basso 1920x1080
93.6 97.4 ~ 96 fps    + Confronta + 📈 Graph
medio 1920x1080
79.1 83 ~ 81 fps    + Confronta + 📈 Graph
alto 1920x1080
70.9 76 ~ 73 fps    + Confronta + 📈 Graph
ultra 1920x1080
58.6 61.2 ~ 60 fps    + Confronta + 📈 Graph
QHD 2560x1440
46 48.3 ~ 47 fps    + Confronta + 📈 Graph
4K 3840x2160
28.7 29.5 ~ 29 fps    + Confronta + 📈 Graph
3840x2160
42.7 44.7 ~ 44 fps    + Confronta + 📈 Graph
» Giocabile con tutti i portatili testati con dettagli ultra.
Additional Benchmarks
Very High Preset + Quality DLSS 2560x1440
58.5
62.8
Very High Preset + Quality FSR 2560x1440
57.7
40.6
basso 1920x1080
61.5 68.9 ~ 65 fps    + Confronta + 📈 Graph
alto 1920x1080
56.9 60.8 ~ 59 fps    + Confronta + 📈 Graph
QHD 2560x1440
45.2 53.6 ~ 49 fps    + Confronta + 📈 Graph
4K 3840x2160
29.3 32.1 ~ 31 fps    + Confronta + 📈 Graph
3840x2160
31.7 40.7 ~ 36 fps    + Confronta + 📈 Graph
3840x2160
30.2 36.7 ~ 33 fps    + Confronta + 📈 Graph
» Giocabile con tutti i portatili testati con dettagli alto.
Additional Benchmarks
Low Preset 1280x720
64.4
71.9
basso 1920x1080
100.3 100.7 ~ 101 fps    + Confronta + 📈 Graph
medio 1920x1080
89.5 93 ~ 91 fps    + Confronta + 📈 Graph
alto 1920x1080
62.7 63.4 ~ 63 fps    + Confronta + 📈 Graph
ultra 1920x1080
62.4 62.6 74 ~ 66 fps    + Confronta + 📈 Graph
QHD 2560x1440
47.7 47.9 55.9 ~ 51 fps    + Confronta + 📈 Graph
4K 3840x2160
28.9 29.8 35.3 ~ 31 fps    + Confronta + 📈 Graph
3840x2160
40.8 41.5 48.9 ~ 44 fps    + Confronta + 📈 Graph
3840x2160
38.8 39.5 ~ 39 fps    + Confronta + 📈 Graph
» Giocabile con tutti i portatili testati con dettagli ultra.
Additional Benchmarks
Very Low Preset 1280x720
116.7
133.5
basso 1920x1080
165.1 189.5 ~ 177 fps    + Confronta + 📈 Graph
medio 1920x1080
157 180.5 ~ 169 fps    + Confronta + 📈 Graph
alto 1920x1080
155 163.1 ~ 159 fps    + Confronta + 📈 Graph
ultra 1920x1080
103.2 108.5 ~ 106 fps    + Confronta + 📈 Graph
QHD 2560x1440
50.7 64.9 ~ 58 fps    + Confronta + 📈 Graph
4K 3840x2160
18.4 20.2 ~ 19 fps    + Confronta + 📈 Graph
3840x2160
40.3 47.3 ~ 44 fps    + Confronta + 📈 Graph
3840x2160
55.9 58.7 ~ 57 fps    + Confronta + 📈 Graph
» Giocabile con tutti i portatili testati con dettagli ultra.
Additional Benchmarks
Low Preset 1280x720
174.9
194.8
basso 1920x1080
179.4 192.2 ~ 186 fps    + Confronta + 📈 Graph
medio 1920x1080
172.8 183.7 ~ 178 fps    + Confronta + 📈 Graph
alto 1920x1080
167.5 175.6 ~ 172 fps    + Confronta + 📈 Graph
ultra 1920x1080
127.9 128 ~ 128 fps    + Confronta + 📈 Graph
QHD 2560x1440
83 83.8 ~ 83 fps    + Confronta + 📈 Graph
4K 3840x2160
40.6 40.7 ~ 41 fps    + Confronta + 📈 Graph
» Giocabile con tutti i portatili testati con dettagli ultra.
Additional Benchmarks
Very Low Preset 1280x720
190.6
205
basso 1920x1080
97 100 ~ 99 fps    + Confronta
medio 1920x1080
90 91 110 ~ 97 fps    + Confronta
alto 1920x1080
73 75 93 ~ 80 fps    + Confronta
ultra 1920x1080
57 60 73 ~ 63 fps    + Confronta
QHD 2560x1440
45 47 62 ~ 51 fps    + Confronta
4K 3840x2160
30 31 39 ~ 33 fps    + Confronta
3840x2160
43 43 51 ~ 46 fps    + Confronta
3840x2160
39 40 ~ 40 fps    + Confronta
» Giocabile con tutti i portatili testati con dettagli ultra.
Additional Benchmarks
Low Preset TAA 1280x720
119
121
basso 1920x1080
125.9 126.5 ~ 126 fps    + Confronta + 📈 Graph
medio 1920x1080
95.2 106.7 ~ 101 fps    + Confronta + 📈 Graph
alto 1920x1080
85.6 94.9 ~ 90 fps    + Confronta + 📈 Graph
ultra 1920x1080
86.3 93.2 97.4 ~ 92 fps    + Confronta + 📈 Graph
QHD 2560x1440
64.7 66.6 71.4 ~ 68 fps    + Confronta + 📈 Graph
4K 3840x2160
37.6 37.6 40.9 ~ 39 fps    + Confronta + 📈 Graph
» Giocabile con tutti i portatili testati con dettagli ultra.
Additional Benchmarks
Low Preset 1280x720
130.8
128
basso 1920x1080
74 76.2 ~ 75 fps    + Confronta + 📈 Graph
medio 1920x1080
64.8 66.5 ~ 66 fps    + Confronta + 📈 Graph
alto 1920x1080
55.3 57.4 ~ 56 fps    + Confronta + 📈 Graph
ultra 1920x1080
48.1 49 53.4 ~ 50 fps    + Confronta + 📈 Graph
QHD 2560x1440
37.2 38 42.2 ~ 39 fps    + Confronta + 📈 Graph
4K 3840x2160
23 23.1 26.1 ~ 24 fps    + Confronta + 📈 Graph
3840x2160
34.3 34.4 39.9 ~ 36 fps    + Confronta + 📈 Graph
3840x2160
28.8 33.1 ~ 31 fps    + Confronta + 📈 Graph
» Giocabile con tutti i portatili testati con dettagli ultra.
Additional Benchmarks
Max. Performance 1280x720
116.3
118.5
Palworld

Palworld

2024
basso 1920x1080
118.6 119.9 ~ 119 fps    + Confronta + 📈 Graph
medio 1920x1080
113.7 116.4 ~ 115 fps    + Confronta + 📈 Graph
alto 1920x1080
96.8 102.5 ~ 100 fps    + Confronta + 📈 Graph
ultra 1920x1080
92.3 93.1 100.5 ~ 95 fps    + Confronta + 📈 Graph
QHD 2560x1440
65.5 68.2 76.4 ~ 70 fps    + Confronta + 📈 Graph
4K 3840x2160
35.2 35.3 45.1 ~ 39 fps    + Confronta + 📈 Graph
3840x2160
47 47.4 61.8 ~ 52 fps    + Confronta + 📈 Graph
» Giocabile con tutti i portatili testati con dettagli ultra.
Additional Benchmarks
Very Low Preset 1280x720
119.6
120
medio 1920x1080
333 338 ~ 336 fps    + Confronta + 📈 Graph
alto 1920x1080
307 316 ~ 312 fps    + Confronta + 📈 Graph
ultra 1920x1080
300 308 ~ 304 fps    + Confronta + 📈 Graph
QHD 2560x1440
256 260 ~ 258 fps    + Confronta + 📈 Graph
4K 3840x2160
176 177.7 222 ~ 192 fps    + Confronta + 📈 Graph
» Giocabile con tutti i portatili testati con dettagli ultra.
basso 1920x1080
147.8 206 ~ 177 fps    + Confronta + 📈 Graph
medio 1920x1080
138.2 177.9 ~ 158 fps    + Confronta + 📈 Graph
alto 1920x1080
120.5 154.4 ~ 137 fps    + Confronta + 📈 Graph
ultra 1920x1080
82.3 108.5 157.4 ~ 116 fps    + Confronta + 📈 Graph
QHD 2560x1440
82 82.6 94.7 ~ 86 fps    + Confronta + 📈 Graph
4K 3840x2160
37.7 38 43.1 ~ 40 fps    + Confronta + 📈 Graph
3840x2160
65 76.1 ~ 71 fps    + Confronta + 📈 Graph
» Giocabile con tutti i portatili testati con dettagli ultra.
basso 1920x1080
169  fps    + Confronta + 📈 Graph
medio 1920x1080
159.1  fps    + Confronta + 📈 Graph
alto 1920x1080
151.7  fps    + Confronta + 📈 Graph
ultra 1920x1080
131.5 141.3 ~ 136 fps    + Confronta + 📈 Graph
QHD 2560x1440
81.9 88.1 ~ 85 fps    + Confronta + 📈 Graph
4K 3840x2160
39.3 42.3 ~ 41 fps    + Confronta + 📈 Graph
» Giocabile con tutti i portatili testati con dettagli ultra.
Additional Benchmarks
Low Preset 1280x720
177.8
Epic Preset + Epic RTX Global Illumination 1920x1080
123.1
basso 1920x1080
75 76 ~ 76 fps    + Confronta
medio 1920x1080
70 70 ~ 70 fps    + Confronta
alto 1920x1080
60 61 ~ 61 fps    + Confronta
ultra 1920x1080
46 46 ~ 46 fps    + Confronta
QHD 2560x1440
30 30 ~ 30 fps    + Confronta
4K 3840x2160
15 15 ~ 15 fps    + Confronta
3840x2160
26 27 ~ 27 fps    + Confronta
» Giocabile con tutti i portatili testati con dettagli ultra.
Additional Benchmarks
Low Preset TAA 1280x720
113
112
basso 1920x1080
134 139 ~ 137 fps    + Confronta
medio 1920x1080
119 121 ~ 120 fps    + Confronta
alto 1920x1080
94 97 100 ~ 97 fps    + Confronta
ultra 1920x1080
90 93 96 ~ 93 fps    + Confronta
QHD 2560x1440
66 67 89 ~ 74 fps    + Confronta
4K 3840x2160
38 44 67 ~ 50 fps    + Confronta
3840x2160
46  fps    + Confronta
» Giocabile con tutti i portatili testati con dettagli ultra.
Additional Benchmarks
Minimum Preset 1280x720
185
189
basso 1920x1080
125.1 132.1 ~ 129 fps    + Confronta + 📈 Graph
medio 1920x1080
95 98.5 ~ 97 fps    + Confronta + 📈 Graph
alto 1920x1080
87.6 90.8 ~ 89 fps    + Confronta + 📈 Graph
ultra 1920x1080
79.6 81.1 84.3 ~ 82 fps    + Confronta + 📈 Graph
QHD 2560x1440
61.2 62 69 ~ 64 fps    + Confronta + 📈 Graph
4K 3840x2160
35 35.3 40.1 ~ 37 fps    + Confronta + 📈 Graph
3840x2160
50 51.2 ~ 51 fps    + Confronta + 📈 Graph
» Giocabile con tutti i portatili testati con dettagli ultra.
Additional Benchmarks
Ultra Low Preset LowAA 1280x720
189
219
basso 1920x1080
65.9 66.4 ~ 66 fps    + Confronta + 📈 Graph
medio 1920x1080
60.6 61.6 ~ 61 fps    + Confronta + 📈 Graph
alto 1920x1080
55.1 55.7 ~ 55 fps    + Confronta + 📈 Graph
QHD 2560x1440
37.5 39.1 ~ 38 fps    + Confronta + 📈 Graph
4K 3840x2160
20 20.5 ~ 20 fps    + Confronta + 📈 Graph
3840x2160
14.8  fps    + Confronta + 📈 Graph
» Giocabile con tutti i portatili testati con dettagli alto.
Additional Benchmarks
Low Preset 1280x720
87
98.7
High Preset + High Ray Tracing 1920x1080
26.6
24.6
High Preset + High Ray Tracing 3840x2160
7.8
basso 1920x1080
84.4  fps    + Confronta + 📈 Graph
medio 1920x1080
78.3  fps    + Confronta + 📈 Graph
alto 1920x1080
66.1  fps    + Confronta + 📈 Graph
ultra 1920x1080
53.9 92.3 ~ 73 fps    + Confronta + 📈 Graph
QHD 2560x1440
37.6  fps    + Confronta + 📈 Graph
4K 3840x2160
20.5  fps    + Confronta + 📈 Graph
3840x2160
36.5  fps    + Confronta + 📈 Graph
» Giocabile con tutti i portatili testati con dettagli ultra.
Additional Benchmarks
Low Preset 1280x720
120
basso 1920x1080
349.3 349.9 ~ 350 fps    + Confronta
medio 1920x1080
220.3 227.3 ~ 224 fps    + Confronta
alto 1920x1080
133.8 136.7 ~ 135 fps    + Confronta
ultra 1920x1080
103.5 106.5 ~ 105 fps    + Confronta
QHD 2560x1440
78.6 79.4 ~ 79 fps    + Confronta
4K 3840x2160
42.1 42.4 ~ 42 fps    + Confronta
» Giocabile con tutti i portatili testati con dettagli ultra.
Additional Benchmarks
Low Preset 1280x720
404
402.5
basso 1920x1080
102 103 ~ 103 fps    + Confronta
medio 1920x1080
96 96 ~ 96 fps    + Confronta
alto 1920x1080
89 90 ~ 90 fps    + Confronta
ultra 1920x1080
73 75 ~ 74 fps    + Confronta
QHD 2560x1440
59 62 ~ 61 fps    + Confronta
4K 3840x2160
40 40 ~ 40 fps    + Confronta
3840x2160
51 53 ~ 52 fps    + Confronta
» Giocabile con tutti i portatili testati con dettagli ultra.
Additional Benchmarks
Low Preset (Adaptive Quality Off) 1280x720
129
128
basso 1920x1080
194.2  fps    + Confronta + 📈 Graph
medio 1920x1080
174.2  fps    + Confronta + 📈 Graph
alto 1920x1080
148.6  fps    + Confronta + 📈 Graph
ultra 1920x1080
145.6 151.1 ~ 148 fps    + Confronta + 📈 Graph
QHD 2560x1440
124.1 135.6 ~ 130 fps    + Confronta + 📈 Graph
4K 3840x2160
77.1 82.8 ~ 80 fps    + Confronta + 📈 Graph
» Giocabile con tutti i portatili testati con dettagli ultra.
Additional Benchmarks
Low Preset 1280x720
199.1
basso 1920x1080
199.5 225 ~ 212 fps    + Confronta + 📈 Graph
medio 1920x1080
196.3 213 ~ 205 fps    + Confronta + 📈 Graph
alto 1920x1080
168.7 186.5 ~ 178 fps    + Confronta + 📈 Graph
ultra 1920x1080
127.6 141.4 ~ 135 fps    + Confronta + 📈 Graph
QHD 2560x1440
96.8 105.6 ~ 101 fps    + Confronta + 📈 Graph
4K 3840x2160
60.9 61.3 ~ 61 fps    + Confronta + 📈 Graph
» Giocabile con tutti i portatili testati con dettagli ultra.
Additional Benchmarks
Low Preset 1280x720
231
189.1
basso 1920x1080
117.9 127.1 ~ 123 fps    + Confronta
medio 1920x1080
99.3 99.8 ~ 100 fps    + Confronta
alto 1920x1080
86 86.3 ~ 86 fps    + Confronta
ultra 1920x1080
74.4 74.8 89.8 ~ 80 fps    + Confronta
QHD 2560x1440
45.8 46.6 53.5 ~ 49 fps    + Confronta
4K 3840x2160
20.7 20.8 23.6 ~ 22 fps    + Confronta
» Giocabile con tutti i portatili testati con dettagli ultra.
Additional Benchmarks
Low Preset (FSR off) 1280x720
123
143.6
Ray Tracing Ultra Preset (DLSS off) 1920x1080
39.5
33.3
34.4
Steam Deck 1280x720
147.1
119.4
Ultra Preset (FSR on) 1920x1080
102.6
88.8
Ray Tracing Ultra Preset (DLSS off, no Path Tracing) 3840x2160
10.2
30min Start Ultra Preset (FSR off) 1920x1080
71.1
71.1
Lies of P

Lies of P

2023
basso 1920x1080
172 173.4 ~ 173 fps    + Confronta + 📈 Graph
medio 1920x1080
150.6 151.1 ~ 151 fps    + Confronta + 📈 Graph
alto 1920x1080
130.6 130.9 ~ 131 fps    + Confronta + 📈 Graph
ultra 1920x1080
117.9 118.1 ~ 118 fps    + Confronta + 📈 Graph
QHD 2560x1440
78.3 78.9 ~ 79 fps    + Confronta + 📈 Graph
4K 3840x2160
40.6 41.3 ~ 41 fps    + Confronta + 📈 Graph
3840x2160
63.4 64.4 ~ 64 fps    + Confronta + 📈 Graph
» Giocabile con tutti i portatili testati con dettagli ultra.
Additional Benchmarks
Low Preset 1280x720
227
199.4
ultra 1920x1080
60  fps    + Confronta
QHD 2560x1440
58  fps    + Confronta
4K 3840x2160
36  fps    + Confronta
» Giocabile con tutti i portatili testati con dettagli ultra.
Starfield

Starfield

2023
basso 1920x1080
75.4 99.3 ~ 87 fps    + Confronta + 📈 Graph
medio 1920x1080
62.6 81.7 ~ 72 fps    + Confronta + 📈 Graph
alto 1920x1080
51.7 59 ~ 55 fps    + Confronta + 📈 Graph
ultra 1920x1080
46.9 48.7 51.4 ~ 49 fps    + Confronta + 📈 Graph
QHD 2560x1440
37.6 40.1 42.4 ~ 40 fps    + Confronta + 📈 Graph
4K 3840x2160
23.4 26.9 29.6 ~ 27 fps    + Confronta + 📈 Graph
» Giocabile con tutti i portatili testati con dettagli ultra.
Additional Benchmarks
Low Preset 1280x720
98.9
104.4
basso 1920x1080
105  fps    + Confronta + 📈 Graph
medio 1920x1080
101.6 101.8 ~ 102 fps    + Confronta + 📈 Graph
ultra 1920x1080
95.6 103.2 ~ 99 fps    + Confronta + 📈 Graph
QHD 2560x1440
74.5 88.8 ~ 82 fps    + Confronta + 📈 Graph
4K 3840x2160
43.7 54 ~ 49 fps    + Confronta + 📈 Graph
» Giocabile con tutti i portatili testati con dettagli ultra.
Additional Benchmarks
Low Preset 1280x720
101.5
basso 1920x1080
60.6 62.7 ~ 62 fps    + Confronta + 📈 Graph
alto 1920x1080
52.6 54.3 ~ 53 fps    + Confronta + 📈 Graph
ultra 1920x1080
47.5 48.3 ~ 48 fps    + Confronta + 📈 Graph
QHD 2560x1440
33.3 33.6 ~ 33 fps    + Confronta + 📈 Graph
4K 3840x2160
17.9 18.1 ~ 18 fps    + Confronta + 📈 Graph
» Giocabile con tutti i portatili testati con dettagli ultra.
Additional Benchmarks
Low 1280x720
90.5
87.4
basso 1920x1080
135.3 141.5 ~ 138 fps    + Confronta + 📈 Graph
medio 1920x1080
126.7 133.4 ~ 130 fps    + Confronta + 📈 Graph
alto 1920x1080
116.9 124.6 ~ 121 fps    + Confronta + 📈 Graph
ultra 1920x1080
97 106.2 ~ 102 fps    + Confronta + 📈 Graph
QHD 2560x1440
67.4 73.1 ~ 70 fps    + Confronta + 📈 Graph
4K 3840x2160
39.5 41.6 ~ 41 fps    + Confronta + 📈 Graph
» Giocabile con tutti i portatili testati con dettagli ultra.
Additional Benchmarks
Low Preset 1280x720
157.3
190.1
basso 1920x1080
121 130.6 ~ 126 fps    + Confronta + 📈 Graph
medio 1920x1080
102.9 103.9 ~ 103 fps    + Confronta + 📈 Graph
alto 1920x1080
90.2 91.6 ~ 91 fps    + Confronta + 📈 Graph
ultra 1920x1080
88.4 90.2 95.1 ~ 91 fps    + Confronta + 📈 Graph
QHD 2560x1440
59.7 63 66 ~ 63 fps    + Confronta + 📈 Graph
4K 3840x2160
32 33.8 35.8 ~ 34 fps    + Confronta + 📈 Graph
3840x2160
52.2 54.5 58.9 ~ 55 fps    + Confronta + 📈 Graph
» Giocabile con tutti i portatili testati con dettagli ultra.
Additional Benchmarks
Low Preset 1280x720
150.9
154.7
basso 1920x1080
113.8 122.1 ~ 118 fps    + Confronta + 📈 Graph
medio 1920x1080
99.9 100.6 ~ 100 fps    + Confronta + 📈 Graph
alto 1920x1080
81.5 81.6 ~ 82 fps    + Confronta + 📈 Graph
ultra 1920x1080
72.3 75.2 ~ 74 fps    + Confronta + 📈 Graph
QHD 2560x1440
65.9 70.2 ~ 68 fps    + Confronta + 📈 Graph
4K 3840x2160
61.9 62.3 ~ 62 fps    + Confronta + 📈 Graph
» Giocabile con tutti i portatili testati con dettagli ultra.
Additional Benchmarks
Very Low Preset 1280x720
131.2
141.4
Very High Preset + Very High Raytracing TAA 1920x1080
64.8
65.5
F1 23

F1 23

2023
basso 1920x1080
240 267 270 ~ 259 fps    + Confronta
medio 1920x1080
243 254 276 ~ 258 fps    + Confronta
alto 1920x1080
184.4 185.2 219 ~ 196 fps    + Confronta
ultra 1920x1080
59.3 59.9 72.3 ~ 64 fps    + Confronta
QHD 2560x1440
37.9 38.3 38.6 ~ 38 fps    + Confronta
4K 3840x2160
18.6 18.6 23.8 ~ 20 fps    + Confronta
3840x2160
33 33 ~ 33 fps    + Confronta
» Giocabile con tutti i portatili testati con dettagli ultra.
Additional Benchmarks
Ultra Low Preset TAA 1280x720
250
229
263
Diablo 4

Diablo 4

2023
basso 1920x1080
223 245 ~ 234 fps    + Confronta + 📈 Graph
medio 1920x1080
203 214 ~ 209 fps    + Confronta + 📈 Graph
alto 1920x1080
180.6 186.8 ~ 184 fps    + Confronta + 📈 Graph
ultra 1920x1080
151.7 158.1 184.6 ~ 165 fps    + Confronta + 📈 Graph
QHD 2560x1440
98.8 105.5 124 ~ 109 fps    + Confronta + 📈 Graph
4K 3840x2160
50.1 56.5 65.5 ~ 57 fps    + Confronta + 📈 Graph
» Giocabile con tutti i portatili testati con dettagli ultra.
Additional Benchmarks
Low Preset 1280x720
227
289
basso 1920x1080
82.8 83.5 ~ 83 fps    + Confronta + 📈 Graph
medio 1920x1080
73 73.2 ~ 73 fps    + Confronta + 📈 Graph
alto 1920x1080
68.1 69.1 ~ 69 fps    + Confronta + 📈 Graph
ultra 1920x1080
65.1 65.3 69.4 ~ 67 fps    + Confronta + 📈 Graph
QHD 2560x1440
41.3 45.1 ~ 43 fps    + Confronta + 📈 Graph
4K 3840x2160
20.6 23.2 ~ 22 fps    + Confronta + 📈 Graph
» Giocabile con tutti i portatili testati con dettagli ultra.
Additional Benchmarks
Low Preset 1280x720
112.2
115.6
Epic Preset + Ray Tracing 1920x1080
50.8
50.6
basso 1920x1080
187 208 ~ 198 fps    + Confronta + 📈 Graph
medio 1920x1080
178.4 204 ~ 191 fps    + Confronta + 📈 Graph
alto 1920x1080
158.2 163.1 ~ 161 fps    + Confronta + 📈 Graph
ultra 1920x1080
123.3 127.8 ~ 126 fps    + Confronta + 📈 Graph
QHD 2560x1440
85.7 87.5 ~ 87 fps    + Confronta + 📈 Graph
4K 3840x2160
43.8 44 ~ 44 fps    + Confronta + 📈 Graph
» Giocabile con tutti i portatili testati con dettagli ultra.
Additional Benchmarks
Low Preset Low TAA 1280x720
179.2
201
basso 1920x1080
99.4 103 ~ 101 fps    + Confronta + 📈 Graph
medio 1920x1080
82.8 87.3 ~ 85 fps    + Confronta + 📈 Graph
alto 1920x1080
75.6 79.2 ~ 77 fps    + Confronta + 📈 Graph
ultra 1920x1080
64.8 67.4 ~ 66 fps    + Confronta + 📈 Graph
QHD 2560x1440
43.4 43.7 ~ 44 fps    + Confronta + 📈 Graph
4K 3840x2160
20.9 21.5 ~ 21 fps    + Confronta + 📈 Graph
3840x2160
33.7 34.3 ~ 34 fps    + Confronta + 📈 Graph
» Giocabile con tutti i portatili testati con dettagli ultra.
Additional Benchmarks
Low Preset 1280x720
118.4
121.8
basso 1920x1080
139.6 140.2 ~ 140 fps    + Confronta + 📈 Graph
medio 1920x1080
99.6 103.7 ~ 102 fps    + Confronta + 📈 Graph
alto 1920x1080
92.8 94.4 ~ 94 fps    + Confronta + 📈 Graph
ultra 1920x1080
69.4 70.8 76.2 ~ 72 fps    + Confronta + 📈 Graph
QHD 2560x1440
52.3 52.6 57.3 ~ 54 fps    + Confronta + 📈 Graph
4K 3840x2160
30.1 30.9 33.5 ~ 32 fps    + Confronta + 📈 Graph
» Giocabile con tutti i portatili testati con dettagli ultra.
Additional Benchmarks
Prioritize Performance Preset 1280x720
170.2
183.2
basso 1920x1080
161.6 181.1 ~ 171 fps    + Confronta
medio 1920x1080
145 161.1 ~ 153 fps    + Confronta
alto 1920x1080
114.4 123.6 ~ 119 fps    + Confronta
ultra 1920x1080
113.6 122.5 141 ~ 126 fps    + Confronta
QHD 2560x1440
85.7 90.8 105 ~ 94 fps    + Confronta
4K 3840x2160
50.6 53.3 63.7 ~ 56 fps    + Confronta
» Giocabile con tutti i portatili testati con dettagli ultra.
Additional Benchmarks
Minimum Settings 1280x720
214
261.7
basso 1920x1080
81.9 91 ~ 86 fps    + Confronta + 📈 Graph
medio 1920x1080
80.5 83.6 ~ 82 fps    + Confronta + 📈 Graph
alto 1920x1080
76.7 80.2 ~ 78 fps    + Confronta + 📈 Graph
ultra 1920x1080
69.3 75.6 79.6 ~ 75 fps    + Confronta + 📈 Graph
QHD 2560x1440
63.2 63.3 63.6 ~ 63 fps    + Confronta + 📈 Graph
4K 3840x2160
38.7 39 51 ~ 43 fps    + Confronta + 📈 Graph
» Giocabile con tutti i portatili testati con dettagli ultra.
Additional Benchmarks
Ultra Low Preset 1280x720
85
95.5
basso 1920x1080
174.7 183.5 ~ 179 fps    + Confronta + 📈 Graph
medio 1920x1080
138.5 142 ~ 140 fps    + Confronta + 📈 Graph
alto 1920x1080
84.8 84.9 ~ 85 fps    + Confronta + 📈 Graph
ultra 1920x1080
66.5 67 73.8 ~ 69 fps    + Confronta + 📈 Graph
QHD 2560x1440
51 51.4 57.6 ~ 53 fps    + Confronta + 📈 Graph
4K 3840x2160
30.8 31.1 35.7 ~ 33 fps    + Confronta + 📈 Graph
» Giocabile con tutti i portatili testati con dettagli ultra.
Additional Benchmarks
Low Preset 1280x720
178.3
207
Returnal

Returnal

2023
basso 1920x1080
100 102 ~ 101 fps    + Confronta
medio 1920x1080
98 98 ~ 98 fps    + Confronta
alto 1920x1080
88 89 ~ 89 fps    + Confronta
ultra 1920x1080
76 77 84 ~ 79 fps    + Confronta
QHD 2560x1440
57 58 65 ~ 60 fps    + Confronta
4K 3840x2160
33 33 37 ~ 34 fps    + Confronta
» Giocabile con tutti i portatili testati con dettagli ultra.
Additional Benchmarks
Low Preset 1280x720
91
125
Epic Preset + Epic Ray-Tracing 1920x1080
62
60
Epic Preset + Epic Ray-Tracing 3840x2160
23
24
basso 1920x1080
113.3 124.7 ~ 119 fps    + Confronta + 📈 Graph
medio 1920x1080
101.2 106.5 ~ 104 fps    + Confronta + 📈 Graph
alto 1920x1080
76.5 80.2 ~ 78 fps    + Confronta + 📈 Graph
ultra 1920x1080
65.7 68.4 72.5 ~ 69 fps    + Confronta + 📈 Graph
QHD 2560x1440
48 48.2 48.9 ~ 48 fps    + Confronta + 📈 Graph
4K 3840x2160
26.3 26.6 30.9 ~ 28 fps    + Confronta + 📈 Graph
» Giocabile con tutti i portatili testati con dettagli ultra.
Additional Benchmarks
Low Preset Low TAA 1280x720
112.2
126.6
Ultra Preset + Full Ray Tracing High TAA 1920x1080
42.5
43.1
Ultra Preset + Full Ray Tracing High TAA 3840x2160
16.5
15.5
basso 1920x1080
85.2 88.6 ~ 87 fps    + Confronta + 📈 Graph
medio 1920x1080
82.8 85.6 ~ 84 fps    + Confronta + 📈 Graph
alto 1920x1080
73.4 74.7 ~ 74 fps    + Confronta + 📈 Graph
ultra 1920x1080
72.3 73.6 ~ 73 fps    + Confronta + 📈 Graph
QHD 2560x1440
49.6 51.1 ~ 50 fps    + Confronta + 📈 Graph
4K 3840x2160
26.4 26.7 ~ 27 fps    + Confronta + 📈 Graph
» Giocabile con tutti i portatili testati con dettagli ultra.
Additional Benchmarks
Low Preset TAA 1280x720
119.9
116.9
basso 1920x1080
168.1 189.3 198.1 ~ 185 fps    + Confronta + 📈 Graph
medio 1920x1080
147.3 164.4 164.9 ~ 159 fps    + Confronta + 📈 Graph
alto 1920x1080
131.7 137.1 142.2 ~ 137 fps    + Confronta + 📈 Graph
ultra 1920x1080
110 118 120.9 ~ 116 fps    + Confronta + 📈 Graph
QHD 2560x1440
82.1 84.1 85.8 ~ 84 fps    + Confronta + 📈 Graph
4K 3840x2160
46.4 49.4 ~ 48 fps    + Confronta + 📈 Graph
» Giocabile con tutti i portatili testati con dettagli ultra.
Additional Benchmarks
Low Preset / Off 1280x720
213
173.2
RT Ultra Preset / On FXAA 1920x1080
32.3
29.7
30.7
basso 1920x1080
204 243 ~ 224 fps    + Confronta + 📈 Graph
medio 1920x1080
177.2 192.7 ~ 185 fps    + Confronta + 📈 Graph
alto 1920x1080
133 136.1 ~ 135 fps    + Confronta + 📈 Graph
ultra 1920x1080
109.8 111.5 ~ 111 fps    + Confronta + 📈 Graph
QHD 2560x1440
67 67.9 ~ 67 fps    + Confronta + 📈 Graph
4K 3840x2160
28.8 29.9 ~ 29 fps    + Confronta + 📈 Graph
» Giocabile con tutti i portatili testati con dettagli ultra.
Additional Benchmarks
Low Preset 1280x720
209
252
basso 1920x1080
149.2 161.5 ~ 155 fps    + Confronta
medio 1920x1080
118 127.9 129.1 ~ 125 fps    + Confronta
alto 1920x1080
86.5 121.4 121.7 ~ 110 fps    + Confronta
ultra 1920x1080
82.1 83.6 85.8 ~ 84 fps    + Confronta
QHD 2560x1440
62.3 62.4 63 ~ 63 fps    + Confronta
4K 3840x2160
35.8 38.7 38.9 ~ 38 fps    + Confronta
» Giocabile con tutti i portatili testati con dettagli ultra.
Additional Benchmarks
Low Preset (without FSR Upscaling) 1280x720
158.2
178.5
Ultra Preset (without FSR Upscaling) + Full Ray-Tracing 1920x1080
49.6
62.7
66.3
basso 1920x1080
117.5 131.8 146.1 ~ 132 fps    + Confronta + 📈 Graph
medio 1920x1080
112.5 121.9 133.8 ~ 123 fps    + Confronta + 📈 Graph
alto 1920x1080
100.4 108.1 110.8 ~ 106 fps    + Confronta + 📈 Graph
ultra 1920x1080
93.1 107.9 109.6 ~ 104 fps    + Confronta + 📈 Graph
QHD 2560x1440
79.3 79.9 81.8 ~ 80 fps    + Confronta + 📈 Graph
4K 3840x2160
43.2 44.4 ~ 44 fps    + Confronta + 📈 Graph
» Giocabile con tutti i portatili testati con dettagli ultra.
Additional Benchmarks
Low Preset 1280x720
148
131.5
basso 1920x1080
123.7 134 ~ 129 fps    + Confronta + 📈 Graph
medio 1920x1080
110.8 118.2 122.6 ~ 117 fps    + Confronta + 📈 Graph
alto 1920x1080
103.6 109.8 114 ~ 109 fps    + Confronta + 📈 Graph
ultra 1920x1080
101 102 105.8 ~ 103 fps    + Confronta + 📈 Graph
QHD 2560x1440
76.1 77.3 79.6 ~ 78 fps    + Confronta + 📈 Graph
4K 3840x2160
43.4 44.3 63.9 ~ 51 fps    + Confronta + 📈 Graph
» Giocabile con tutti i portatili testati con dettagli ultra.
Additional Benchmarks
Very Low Preset 1280x720
129.1
148.4
Very High Preset + Ray-Tracing TAA 1920x0180
55.6
65.5
57.3
medio 1920x1080
142  fps    + Confronta
alto 1920x1080
106  fps    + Confronta
ultra 1920x1080
103  fps    + Confronta
QHD 2560x1440
72  fps    + Confronta
4K 3840x2160
42  fps    + Confronta
» Giocabile con tutti i portatili testati con dettagli ultra.
basso 1920x1080
82.7 83.3 ~ 83 fps    + Confronta + 📈 Graph
medio 1920x1080
80.4 81.5 86.2 ~ 83 fps    + Confronta + 📈 Graph
alto 1920x1080
75.9 77.2 80.6 ~ 78 fps    + Confronta + 📈 Graph
ultra 1920x1080
73 73 79.8 ~ 75 fps    + Confronta + 📈 Graph
QHD 2560x1440
57.2 57.5 59.7 ~ 58 fps    + Confronta + 📈 Graph
4K 3840x2160
32.1 32.9 36.1 ~ 34 fps    + Confronta + 📈 Graph
» Giocabile con tutti i portatili testati con dettagli ultra.
Additional Benchmarks
Low Preset 1280x720
87.9
95.7
basso 1920x1080
113 113.7 ~ 113 fps    + Confronta + 📈 Graph
medio 1920x1080
70.3 87.2 89.7 ~ 82 fps    + Confronta + 📈 Graph
alto 1920x1080
59.4 64.3 66.4 ~ 63 fps    + Confronta + 📈 Graph
ultra 1920x1080
49.1 50.3 51.8 51.9 ~ 51 fps    + Confronta + 📈 Graph
QHD 2560x1440
35.4 35.8 38.2 38.6 ~ 37 fps    + Confronta + 📈 Graph
4K 3840x2160
20.1 20.3 22.6 23.4 ~ 22 fps    + Confronta + 📈 Graph
» Giocabile con tutti i portatili testati con dettagli ultra.
Additional Benchmarks
Low Preset 1280x720
138.7
143.9
Ultra DLSS Quality 3840x2160
38.6
28.8
29
FIFA 23

FIFA 23

2022
medio 1920x1080
138.2  fps    + Confronta + 📈 Graph
alto 1920x1080
128.4  fps    + Confronta + 📈 Graph
ultra 1920x1080
127  fps    + Confronta + 📈 Graph
QHD 2560x1440
126  fps    + Confronta + 📈 Graph
4K 3840x2160
86.9  fps    + Confronta + 📈 Graph
» Giocabile con tutti i portatili testati con dettagli ultra.
basso 1920x1080
152.5 156.8 ~ 155 fps    + Confronta + 📈 Graph
medio 1920x1080
116.8 119.3 126 ~ 121 fps    + Confronta + 📈 Graph
alto 1920x1080
96.6 98.9 102.8 ~ 99 fps    + Confronta + 📈 Graph
ultra 1920x1080
77.9 78.8 81.8 ~ 80 fps    + Confronta + 📈 Graph
QHD 2560x1440
54.3 54.9 56.9 ~ 55 fps    + Confronta + 📈 Graph
4K 3840x2160
29.1 29.8 31.4 ~ 30 fps    + Confronta + 📈 Graph
» Giocabile con tutti i portatili testati con dettagli ultra.
Additional Benchmarks
Low Preset 1280x720
206
210
F1 22

F1 22

2022
basso 1920x1080
247 255 ~ 251 fps    + Confronta
medio 1920x1080
229 245 263 ~ 246 fps    + Confronta
alto 1920x1080
195.4 195.5 201 ~ 197 fps    + Confronta
ultra 1920x1080
64.1 65.2 70 ~ 66 fps    + Confronta
QHD 2560x1440
41.8 42 43 ~ 42 fps    + Confronta
4K 3840x2160
20 20.1 22 ~ 21 fps    + Confronta
» Giocabile con tutti i portatili testati con dettagli ultra.
Additional Benchmarks
Ultra Low Preset 16xAF TAA 1280x720
311
332
medio 1920x1080
253  fps    + Confronta + 📈 Graph
alto 1920x1080
238  fps    + Confronta + 📈 Graph
ultra 1920x1080
224  fps    + Confronta + 📈 Graph
QHD 2560x1440
150  fps    + Confronta + 📈 Graph
4K 3840x2160
78  fps    + Confronta + 📈 Graph
» Giocabile con tutti i portatili testati con dettagli ultra.
basso 1920x1080
155.4 161.9 ~ 159 fps    + Confronta + 📈 Graph
medio 1920x1080
149.3 154.6 171.5 ~ 158 fps    + Confronta + 📈 Graph
alto 1920x1080
148.9 152.9 166.8 ~ 156 fps    + Confronta + 📈 Graph
ultra 1920x1080
147.5 147.8 162.5 ~ 153 fps    + Confronta + 📈 Graph
QHD 2560x1440
94.8 95.5 105.1 ~ 98 fps    + Confronta + 📈 Graph
4K 3840x2160
46.4 47.1 52.1 ~ 49 fps    + Confronta + 📈 Graph
» Giocabile con tutti i portatili testati con dettagli ultra.
Additional Benchmarks
Lowest Settings 1280x720
170.7
160.8
Highest Settings + Maximum Ray Tracing 1920x1080
65.9
64.7
65.3
basso 1920x1080
205 207 208 ~ 207 fps    + Confronta
medio 1920x1080
165.1 167.9 191 ~ 175 fps    + Confronta
alto 1920x1080
113.2 114 131 ~ 119 fps    + Confronta
ultra 1920x1080
88.3 88.8 102 ~ 93 fps    + Confronta
QHD 2560x1440
62.5 62.9 70.6 ~ 65 fps    + Confronta
4K 3840x2160
33.8 34 38.5 ~ 35 fps    + Confronta
» Giocabile con tutti i portatili testati con dettagli ultra.
Additional Benchmarks
Lowest Preset (DX12) 1280x720
265
276
basso 1920x1080
115.7 120.8 133.9 ~ 123 fps    + Confronta
medio 1920x1080
95.3 96.2 116.5 ~ 103 fps    + Confronta
alto 1920x1080
83.4 83.5 99.1 ~ 89 fps    + Confronta
ultra 1920x1080
75 75.6 89.8 ~ 80 fps    + Confronta
QHD 2560x1440
47.9 48.1 ~ 48 fps    + Confronta
4K 3840x2160
22.4 23 ~ 23 fps    + Confronta
» Giocabile con tutti i portatili testati con dettagli ultra.
Additional Benchmarks
Low Preset 1280x720
119.9
142.5
Ray Tracing Ultra Preset (DLSS off) 1920x1080
37.8
34.6
34.8
Ray Tracing Ultra Preset (DLSS off) 3840x2160
10.7
10.2
10.3
Elex 2

Elex 2

2022
medio 1920x1080
97.9  fps    + Confronta + 📈 Graph
alto 1920x1080
88.1  fps    + Confronta + 📈 Graph
ultra 1920x1080
84.8  fps    + Confronta + 📈 Graph
QHD 2560x1440
65.9  fps    + Confronta + 📈 Graph
4K 3840x2160
38.7  fps    + Confronta + 📈 Graph
» Giocabile con tutti i portatili testati con dettagli ultra.
basso 1920x1080
154.5 162.5 ~ 159 fps    + Confronta
medio 1920x1080
139.9 146.7 210 ~ 166 fps    + Confronta
alto 1920x1080
131 134.6 171 ~ 146 fps    + Confronta
ultra 1920x1080
115.8 116.7 127 ~ 120 fps    + Confronta
QHD 2560x1440
97.7 99.6 103 ~ 100 fps    + Confronta
4K 3840x2160
64.6 65 67.8 ~ 66 fps    + Confronta
» Giocabile con tutti i portatili testati con dettagli ultra.
Additional Benchmarks
Low Preset 1280x720
155.7
166.2
medio 1920x1080
59.5  fps    + Confronta + 📈 Graph
alto 1920x1080
59.2  fps    + Confronta + 📈 Graph
ultra 1920x1080
59.1  fps    + Confronta + 📈 Graph
QHD 2560x1440
59  fps    + Confronta + 📈 Graph
4K 3840x2160
50.7  fps    + Confronta + 📈 Graph
» Giocabile con tutti i portatili testati con dettagli ultra.
medio 1920x1080
99.6  fps    + Confronta + 📈 Graph
alto 1920x1080
87.3  fps    + Confronta + 📈 Graph
QHD 2560x1440
61.8  fps    + Confronta + 📈 Graph
4K 3840x2160
34  fps    + Confronta + 📈 Graph
» Giocabile con tutti i portatili testati con dettagli alto.
Additional Benchmarks
High Quality Raytracing 1920x1080
36
medio 1920x1080
223  fps    + Confronta
alto 1920x1080
218  fps    + Confronta
ultra 1920x1080
170  fps    + Confronta
QHD 2560x1440
111  fps    + Confronta
4K 3840x2160
57  fps    + Confronta
» Giocabile con tutti i portatili testati con dettagli ultra.
basso 1920x1080
131.7 132.2 ~ 132 fps    + Confronta + 📈 Graph
medio 1920x1080
112.3 113.3 116 ~ 114 fps    + Confronta + 📈 Graph
alto 1920x1080
91 92 96.1 ~ 93 fps    + Confronta + 📈 Graph
ultra 1920x1080
65.3 67.5 67.6 ~ 67 fps    + Confronta + 📈 Graph
QHD 2560x1440
55.6 56 56.1 ~ 56 fps    + Confronta + 📈 Graph
4K 3840x2160
36.9 37.6 38.7 ~ 38 fps    + Confronta + 📈 Graph
» Giocabile con tutti i portatili testati con dettagli ultra.
Additional Benchmarks
Low Preset 1280x720
143.4
141.1
medio 1920x1080
118 133 ~ 126 fps    + Confronta + 📈 Graph
alto 1920x1080
101 113 ~ 107 fps    + Confronta + 📈 Graph
ultra 1920x1080
96.1 106 ~ 101 fps    + Confronta + 📈 Graph
QHD 2560x1440
70.4 79.5 ~ 75 fps    + Confronta + 📈 Graph
4K 3840x2160
40.2 46.2 ~ 43 fps    + Confronta + 📈 Graph
» Giocabile con tutti i portatili testati con dettagli ultra.
Additional Benchmarks
Low Preset 1920x1080
137
basso 1280x720
263  fps    + Confronta + 📈 Graph
medio 1920x1080
188 212 ~ 200 fps    + Confronta + 📈 Graph
alto 1920x1080
165 179.6 ~ 172 fps    + Confronta + 📈 Graph
ultra 1920x1080
142 163.9 ~ 153 fps    + Confronta + 📈 Graph
QHD 2560x1440
130 134 ~ 132 fps    + Confronta + 📈 Graph
4K 3840x2160
81.3 88.5 ~ 85 fps    + Confronta + 📈 Graph
» Giocabile con tutti i portatili testati con dettagli ultra.
Additional Benchmarks
Low Preset 1920x1080
279
basso 1280x720
133  fps    + Confronta + 📈 Graph
medio 1920x1080
110 128 ~ 119 fps    + Confronta + 📈 Graph
alto 1920x1080
99.8 119 ~ 109 fps    + Confronta + 📈 Graph
ultra 1920x1080
88.7 104 ~ 96 fps    + Confronta + 📈 Graph
QHD 2560x1440
69.9 79.9 ~ 75 fps    + Confronta + 📈 Graph
4K 3840x2160
43 50.2 ~ 47 fps    + Confronta + 📈 Graph
» Giocabile con tutti i portatili testati con dettagli ultra.
Additional Benchmarks
Low Preset 1920x1080
117
Ultra Preset + Ray Tracing 1920x1080
84.2
68
basso 1280x720
207 214 224 ~ 215 fps    + Confronta
medio 1920x1080
131 146 149 151 ~ 144 fps    + Confronta
alto 1920x1080
122 134 136 136 ~ 132 fps    + Confronta
ultra 1920x1080
81 83 84 84 ~ 83 fps    + Confronta
QHD 2560x1440
67 70 71 73 ~ 70 fps    + Confronta
4K 3840x2160
48 49 50 55 ~ 51 fps    + Confronta
» Giocabile con tutti i portatili testati con dettagli ultra.
Additional Benchmarks
Low Preset 1920x1080
167
149
171
174
medio 1920x1080
136  fps    + Confronta + 📈 Graph
alto 1920x1080
125  fps    + Confronta + 📈 Graph
ultra 1920x1080
114  fps    + Confronta + 📈 Graph
QHD 2560x1440
83.5  fps    + Confronta + 📈 Graph
4K 3840x2160
48.1  fps    + Confronta + 📈 Graph
» Giocabile con tutti i portatili testati con dettagli ultra.
Additional Benchmarks
Low Preset 1920x1080
144
basso 1280x720
155  fps    + Confronta
medio 1920x1080
137 156 ~ 147 fps    + Confronta
alto 1920x1080
113 127 ~ 120 fps    + Confronta
ultra 1920x1080
104 115 ~ 110 fps    + Confronta
QHD 2560x1440
74 84 ~ 79 fps    + Confronta
4K 3840x2160
41 47 ~ 44 fps    + Confronta
» Giocabile con tutti i portatili testati con dettagli ultra.
Additional Benchmarks
Low Preset 1920x1080
178
153
basso 1280x720
130 138 153 ~ 140 fps    + Confronta
medio 1920x1080
122 138 141 150 ~ 138 fps    + Confronta
alto 1920x1080
124 137 140 149 ~ 138 fps    + Confronta
ultra 1920x1080
122 135 137 145 ~ 135 fps    + Confronta
QHD 2560x1440
95 103 104 108 ~ 103 fps    + Confronta
4K 3840x2160
55 56 56 60 ~ 57 fps    + Confronta
» Giocabile con tutti i portatili testati con dettagli ultra.
Additional Benchmarks
Low Preset 1920x1080
124
131
149
Ultra Preset + Ultra Ray-Tracing 1920x1080
85
76
75
78
medio 1920x1080
281  fps    + Confronta + 📈 Graph
alto 1920x1080
235  fps    + Confronta + 📈 Graph
ultra 1920x1080
220  fps    + Confronta + 📈 Graph
QHD 2560x1440
146  fps    + Confronta + 📈 Graph
4K 3840x2160
76.6  fps    + Confronta + 📈 Graph
» Giocabile con tutti i portatili testati con dettagli ultra.
Additional Benchmarks
Low Preset (DX12) 1920x1080
378
Far Cry 6

Far Cry 6

2021
basso 1280x720
101 101 148.8 160.1 ~ 128 fps    + Confronta + 📈 Graph
medio 1920x1080
73 82 113 126.5 130.4 ~ 105 fps    + Confronta + 📈 Graph
alto 1920x1080
65 75 102 111.9 115.4 ~ 94 fps    + Confronta + 📈 Graph
ultra 1920x1080
55 70 79 104 104.4 ~ 82 fps    + Confronta + 📈 Graph
QHD 2560x1440
62 69 77.5 78.2 ~ 72 fps    + Confronta + 📈 Graph
4K 3840x2160
40 44.8 44.9 50 ~ 45 fps    + Confronta + 📈 Graph
» Giocabile con tutti i portatili testati con dettagli ultra.
Additional Benchmarks
Low Graphics Quality 1920x1080
128
91
140.8
148.9
Ultra Graphics Quality + HD Textures + DXR TAA 1920x1080
61
59
84
84.7
medio 1920x1080
99.5 121 ~ 110 fps    + Confronta + 📈 Graph
alto 1920x1080
95 111 ~ 103 fps    + Confronta + 📈 Graph
QHD 2560x1440
91 108 ~ 100 fps    + Confronta + 📈 Graph
4K 3840x2160
64.6 73.9 ~ 69 fps    + Confronta + 📈 Graph
» Giocabile con tutti i portatili testati con dettagli alto.
Additional Benchmarks
Low Preset 1920x1080
104
149
FIFA 22

FIFA 22

2021
medio 1920x1080
309  fps    + Confronta + 📈 Graph
alto 1920x1080
273  fps    + Confronta + 📈 Graph
ultra 1920x1080
271  fps    + Confronta + 📈 Graph
QHD 2560x1440
263  fps    + Confronta + 📈 Graph
4K 3840x2160
242  fps    + Confronta + 📈 Graph
» Giocabile con tutti i portatili testati con dettagli ultra.
Additional Benchmarks
Low Rendering Quality 1920x1080
322
New World

New World

2021
basso 1280x720
97.4 115.5 132.7 ~ 115 fps    + Confronta
medio 1920x1080
80.8 83.3 95.7 105.4 ~ 91 fps    + Confronta + 📈 Graph
alto 1920x1080
75.1 80.8 91.3 96.7 ~ 86 fps    + Confronta + 📈 Graph
ultra 1920x1080
71.5 74.9 84 90.4 ~ 80 fps    + Confronta + 📈 Graph
QHD 2560x1440
63.3 67.2 ~ 65 fps    + Confronta + 📈 Graph
4K 3840x2160
37.1 42.9 ~ 40 fps    + Confronta + 📈 Graph
» Giocabile con tutti i portatili testati con dettagli ultra.
Additional Benchmarks
Low Video Quality 1920x1080
90.2
116.4
134.2
94.8
Deathloop

Deathloop

2021
medio 1920x1080
120  fps    + Confronta + 📈 Graph
alto 1920x1080
113  fps    + Confronta + 📈 Graph
ultra 1920x1080
107  fps    + Confronta + 📈 Graph
QHD 2560x1440
80.3  fps    + Confronta + 📈 Graph
4K 3840x2160
44.9  fps    + Confronta + 📈 Graph
» Giocabile con tutti i portatili testati con dettagli ultra.
Additional Benchmarks
Low Preset 1920x1080
120
F1 2021

F1 2021

2021
basso 1280x720
246 314 344 364 ~ 317 fps    + Confronta
medio 1920x1080
192 219 280 285 ~ 244 fps    + Confronta
alto 1920x1080
156 165 172 190 235 235 ~ 192 fps    + Confronta
ultra 1920x1080
74.9 97.2 106 110 111 114 117 123.4 123.7 ~ 109 fps    + Confronta
QHD 2560x1440
84 87.4 90.3 90.4 ~ 88 fps    + Confronta
4K 3840x2160
32.5 42.1 47 47.5 49.6 50.9 51.5 ~ 46 fps    + Confronta
» Giocabile con tutti i portatili testati con dettagli ultra.
Additional Benchmarks
Ultra Low Preset 1920x1080
211
medio 1920x1080
144  fps    + Confronta + 📈 Graph
alto 1920x1080
144 144 ~ 144 fps    + Confronta + 📈 Graph
QHD 2560x1440
143 144 ~ 144 fps    + Confronta + 📈 Graph
4K 3840x2160
118 144 ~ 131 fps    + Confronta + 📈 Graph
» Giocabile con tutti i portatili testati con dettagli alto.
Additional Benchmarks
Low Preset 1920x1080
144
Days Gone

Days Gone

2021
basso 1280x720
175 186 ~ 181 fps    + Confronta + 📈 Graph
medio 1920x1080
139 157 ~ 148 fps    + Confronta + 📈 Graph
alto 1920x1080
126 130 140 ~ 132 fps    + Confronta + 📈 Graph
ultra 1920x1080
98.2 100 106 ~ 101 fps    + Confronta + 📈 Graph
QHD 2560x1440
79.5  fps    + Confronta + 📈 Graph
» Giocabile con tutti i portatili testati con dettagli ultra.
Additional Benchmarks
Low Preset 1920x1080
162
156
basso 1280x720
124 135 ~ 130 fps    + Confronta + 📈 Graph
ultra 1920x1080
109 115 115 ~ 113 fps    + Confronta + 📈 Graph
QHD 2560x1440
111  fps    + Confronta + 📈 Graph
» Giocabile con tutti i portatili testati con dettagli ultra.
basso 1280x720
195  fps    + Confronta + 📈 Graph
medio 1920x1080
191  fps    + Confronta + 📈 Graph
alto 1920x1080
155 163 184 ~ 167 fps    + Confronta + 📈 Graph
ultra 1920x1080
144 145 168 ~ 152 fps    + Confronta + 📈 Graph
QHD 2560x1440
99.4 116 ~ 108 fps    + Confronta + 📈 Graph
4K 3840x2160
51.7  fps    + Confronta + 📈 Graph
» Giocabile con tutti i portatili testati con dettagli ultra.
Additional Benchmarks
Prioritize Performance Preset 1920x1080
194
Ray Tracing Preset 1920x1080
104
Outriders

Outriders

2021
basso 1280x720
111 119 125 ~ 118 fps    + Confronta + 📈 Graph
medio 1920x1080
101 102 123 ~ 109 fps    + Confronta + 📈 Graph
alto 1920x1080
109 110 122 ~ 114 fps    + Confronta + 📈 Graph
ultra 1920x1080
98.9 106 124 ~ 110 fps    + Confronta + 📈 Graph
QHD 2560x1440
91.1  fps    + Confronta + 📈 Graph
» Giocabile con tutti i portatili testati con dettagli ultra.
Additional Benchmarks
Low Preset 1920x1080
119
127
107
Hitman 3

Hitman 3

2021
basso 1280x720
160.1 183.8 255.1 ~ 200 fps    + Confronta
medio 1920x1080
135.4 156.4 216.6 ~ 169 fps    + Confronta
alto 1920x1080
131.4 148.2 207.7 ~ 162 fps    + Confronta
ultra 1920x1080
129.1 145.1 200.5 ~ 158 fps    + Confronta
QHD 2560x1440
115.9  fps    + Confronta
» Giocabile con tutti i portatili testati con dettagli ultra.
Additional Benchmarks
Minimum Settings 1920x1080
250.5
154.2
182.8
basso 1280x720
105 105 111.6 113 139 147 ~ 120 fps    + Confronta + 📈 Graph
medio 1920x1080
86 94.4 99.2 99.9 104 116 ~ 100 fps    + Confronta + 📈 Graph
alto 1920x1080
67.6 70 72 74.8 81.6 84.4 90.6 92.4 96.1 ~ 81 fps    + Confronta + 📈 Graph
ultra 1920x1080
52.9 60.2 60.6 61 71 73.6 80.1 80.6 84.3 ~ 69 fps    + Confronta + 📈 Graph
QHD 2560x1440
39.8 40 42.3 42.8 49.7 ~ 43 fps    + Confronta + 📈 Graph
4K 3840x2160
19.7 21.4 27.9 ~ 23 fps    + Confronta + 📈 Graph
» Giocabile con tutti i portatili testati con dettagli ultra.
Additional Benchmarks
Low Preset 1920x1080
109
138
117
Ray Tracing Ultra Preset (DLSS off) 1920x1080
33.2
30.6
39.8
43.2
39.2
Ray Tracing Ultra Preset (DLSS off) 3840x2160
7.5
4.9
basso 1280x720
117 172 ~ 145 fps    + Confronta
medio 1920x1080
105 125 ~ 115 fps    + Confronta
alto 1920x1080
88 94 98 116 ~ 99 fps    + Confronta
ultra 1920x1080
82 89 92 108 ~ 93 fps    + Confronta
QHD 2560x1440
64 76 ~ 70 fps    + Confronta
4K 3840x2160
44 50 ~ 47 fps    + Confronta
» Giocabile con tutti i portatili testati con dettagli ultra.
basso 1280x720
141 144 ~ 143 fps    + Confronta + 📈 Graph
medio 1920x1080
121 139 ~ 130 fps    + Confronta + 📈 Graph
alto 1920x1080
112 117 138 ~ 122 fps    + Confronta + 📈 Graph
ultra 1920x1080
101 108 126 ~ 112 fps    + Confronta + 📈 Graph
QHD 2560x1440
67.1 85.2 ~ 76 fps    + Confronta + 📈 Graph
4K 3840x2160
35.8  fps    + Confronta + 📈 Graph
» Giocabile con tutti i portatili testati con dettagli ultra.
alto 1920x1080
89.4 100 ~ 95 fps    + Confronta + 📈 Graph
ultra 1920x1080
81.7 92 ~ 87 fps    + Confronta + 📈 Graph
QHD 2560x1440
62.8 68.9 ~ 66 fps    + Confronta + 📈 Graph
4K 3840x2160
36.9 39.8 ~ 38 fps    + Confronta + 📈 Graph
» Giocabile con tutti i portatili testati con dettagli ultra.
Additional Benchmarks
Highest Settings + Ultra Ray Tracing 1920x1080
57
53.9
basso 1280x720
121 127 134 159 162 ~ 141 fps    + Confronta
medio 1920x1080
93 93 98 115 116 ~ 103 fps    + Confronta
alto 1920x1080
72 74 79 79 85 96 98 ~ 83 fps    + Confronta
ultra 1920x1080
64 65 68 69 76 83 84 ~ 73 fps    + Confronta
QHD 2560x1440
52 54 65 66 ~ 59 fps    + Confronta
4K 3840x2160
33 36 39 39 ~ 37 fps    + Confronta
» Giocabile con tutti i portatili testati con dettagli ultra.
Dirt 5

Dirt 5

2020
basso 1280x720
103 110 155 178 190 193 205.8 ~ 162 fps    + Confronta
medio 1920x1080
81 97.1 114 120 123 141 152.4 ~ 118 fps    + Confronta
alto 1920x1080
62 85.6 93.3 97.3 99.3 104 117 123.4 ~ 98 fps    + Confronta
ultra 1920x1080
52 56.4 76.5 81 87.5 88.2 92.4 95.2 97.1 108 110 ~ 86 fps    + Confronta
QHD 2560x1440
42.7 51 77.5 80.2 92.4 96.5 ~ 73 fps    + Confronta
4K 3840x2160
39.6 49 49.6 ~ 46 fps    + Confronta
» Giocabile con tutti i portatili testati con dettagli ultra.
basso 1280x720
93 112 115 127 ~ 112 fps    + Confronta + 📈 Graph
medio 1920x1080
90.8 110 115 123 ~ 110 fps    + Confronta + 📈 Graph
alto 1920x1080
79.9 82 97 101 103 110 ~ 95 fps    + Confronta + 📈 Graph
ultra 1920x1080
65 67.2 73 75 75 91.1 ~ 74 fps    + Confronta + 📈 Graph
QHD 2560x1440
52 56 56 56 ~ 55 fps    + Confronta
4K 3840x2160
31 32 33 33 ~ 32 fps    + Confronta
» Giocabile con tutti i portatili testati con dettagli ultra.
Additional Benchmarks
Ultra Preset + Ultra Ray Tracing (DX12) 1920x1080
44
41
41.4
59.5
45
61
FIFA 21

FIFA 21

2020
alto 1920x1080
198 227 249 ~ 225 fps    + Confronta + 📈 Graph
ultra 1920x1080
190 223 248 ~ 220 fps    + Confronta + 📈 Graph
QHD 2560x1440
156 177 241 ~ 191 fps    + Confronta + 📈 Graph
4K 3840x2160
97.5 104 193 ~ 132 fps    + Confronta + 📈 Graph
» Giocabile con tutti i portatili testati con dettagli ultra.
alto 1920x1080
198 228 246 ~ 224 fps    + Confronta + 📈 Graph
ultra 1920x1080
189 220 237 ~ 215 fps    + Confronta + 📈 Graph
QHD 2560x1440
134 162 176 ~ 157 fps    + Confronta + 📈 Graph
4K 3840x2160
79.4 97.1 105 ~ 94 fps    + Confronta + 📈 Graph
» Giocabile con tutti i portatili testati con dettagli ultra.
alto 1920x1080
98.7 102 104 ~ 102 fps    + Confronta + 📈 Graph
QHD 2560x1440
69.3 70.7 ~ 70 fps    + Confronta + 📈 Graph
4K 3840x2160
37.2 37.4 ~ 37 fps    + Confronta + 📈 Graph
» Giocabile con tutti i portatili testati con dettagli alto.
basso 1280x720
112 137 152 162 ~ 141 fps    + Confronta + 📈 Graph
medio 1920x1080
91.1 96.2 107 118 ~ 103 fps    + Confronta + 📈 Graph
alto 1920x1080
74.8 90 93.3 93.6 111 ~ 93 fps    + Confronta + 📈 Graph
ultra 1920x1080
72.6 80.2 83.8 85 107 ~ 86 fps    + Confronta + 📈 Graph
QHD 2560x1440
67.2  fps    + Confronta
» Giocabile con tutti i portatili testati con dettagli ultra.
alto 1920x1080
78.8 79.2 88.9 ~ 82 fps    + Confronta + 📈 Graph
ultra 1920x1080
54.3 56.9 61.5 ~ 58 fps    + Confronta + 📈 Graph
QHD 2560x1440
44 45.2 49.3 ~ 46 fps    + Confronta + 📈 Graph
4K 3840x2160
28 29.3 29.4 ~ 29 fps    + Confronta + 📈 Graph
» Giocabile con tutti i portatili testati con dettagli ultra.
basso 1280x720
127 133 157 167 ~ 146 fps    + Confronta
medio 1920x1080
96 119 137 148 ~ 125 fps    + Confronta
alto 1920x1080
89 93 109 124 128 ~ 109 fps    + Confronta
ultra 1920x1080
84 85 100 109 110 ~ 98 fps    + Confronta
QHD 2560x1440
67 87 87 ~ 80 fps    + Confronta
4K 3840x2160
41 48 48 ~ 46 fps    + Confronta
3840x2160
66 67 ~ 67 fps    + Confronta
» Giocabile con tutti i portatili testati con dettagli ultra.
Additional Benchmarks
Ultimate Quality FidelityFX Quality 3840x2160
75
76
basso 1280x720
167.9 175.5 ~ 172 fps    + Confronta + 📈 Graph
medio 1920x1080
146.5 149.7 ~ 148 fps    + Confronta + 📈 Graph
alto 1920x1080
83.6 104 135 141.5 143.6 ~ 122 fps    + Confronta + 📈 Graph
ultra 1920x1080
82.3 102 134 138 141.5 ~ 120 fps    + Confronta + 📈 Graph
QHD 2560x1440
73.7 92.2 106.9 107.4 ~ 95 fps    + Confronta + 📈 Graph
4K 3840x2160
52.1 55.8 59.6 59.6 ~ 57 fps    + Confronta + 📈 Graph
» Giocabile con tutti i portatili testati con dettagli ultra.
F1 2020

F1 2020

2020
basso 1280x720
235 256 268 301 333 ~ 279 fps    + Confronta
medio 1920x1080
182 199 220 251 258 ~ 222 fps    + Confronta
alto 1920x1080
162 178 191 215 221 226 ~ 199 fps    + Confronta
ultra 1920x1080
131 148 150 160.4 160.7 180 ~ 155 fps    + Confronta
QHD 2560x1440
103 119 120.7 120.9 140 ~ 121 fps    + Confronta
4K 3840x2160
60 68.8 69.3 73 83.5 ~ 71 fps    + Confronta
» Giocabile con tutti i portatili testati con dettagli ultra.
basso 1280x720
127.6  fps    + Confronta
medio 1920x1080
187.8  fps    + Confronta
alto 1920x1080
136 138 142.8 ~ 139 fps    + Confronta
ultra 1920x1080
103 107 114.7 ~ 108 fps    + Confronta
QHD 2560x1440
72.4 73.2 85.9 ~ 77 fps    + Confronta
4K 3840x2160
39.4 39.8 47.2 ~ 42 fps    + Confronta
» Giocabile con tutti i portatili testati con dettagli ultra.
basso 1280x720
211 289 323.2 ~ 274 fps    + Confronta + 📈 Graph
medio 1920x1080
197 197.5 199 ~ 198 fps    + Confronta + 📈 Graph
alto 1920x1080
165 177 183.1 193 ~ 180 fps    + Confronta + 📈 Graph
ultra 1920x1080
163 174 183.7 190 ~ 178 fps    + Confronta + 📈 Graph
QHD 2560x1440
123 145.8 ~ 134 fps    + Confronta + 📈 Graph
4K 3840x2160
68 83.4 ~ 76 fps    + Confronta + 📈 Graph
» Giocabile con tutti i portatili testati con dettagli ultra.
alto 1920x1080
110 111 122 ~ 114 fps    + Confronta + 📈 Graph
QHD 2560x1440
71.4 77.9 ~ 75 fps    + Confronta + 📈 Graph
4K 3840x2160
36.8 37.8 ~ 37 fps    + Confronta + 📈 Graph
» Giocabile con tutti i portatili testati con dettagli alto.
alto 1920x1080
85.1 93.1 ~ 89 fps    + Confronta
ultra 1920x1080
57.5 61 ~ 59 fps    + Confronta
QHD 2560x1440
46.9 50.3 ~ 49 fps    + Confronta
4K 3840x2160
31.2 32.8 ~ 32 fps    + Confronta
» Giocabile con tutti i portatili testati con dettagli ultra.
alto 1920x1080
97.8 102 ~ 100 fps    + Confronta + 📈 Graph
ultra 1920x1080
91.5 98.4 ~ 95 fps    + Confronta + 📈 Graph
QHD 2560x1440
79 86.1 ~ 83 fps    + Confronta + 📈 Graph
4K 3840x2160
42.1 49.1 ~ 46 fps    + Confronta + 📈 Graph
» Giocabile con tutti i portatili testati con dettagli ultra.
alto 1920x1080
94.3 97.5 ~ 96 fps    + Confronta + 📈 Graph
ultra 1920x1080
89.4 93.4 ~ 91 fps    + Confronta + 📈 Graph
QHD 2560x1440
67.9 77.5 ~ 73 fps    + Confronta + 📈 Graph
4K 3840x2160
40.7 51 ~ 46 fps    + Confronta + 📈 Graph
» Giocabile con tutti i portatili testati con dettagli ultra.
GRID 2019

GRID 2019

2019
alto 1920x1080
113  fps    + Confronta + 📈 Graph
ultra 1920x1080
84.8  fps    + Confronta + 📈 Graph
QHD 2560x1440
69.8  fps    + Confronta + 📈 Graph
4K 3840x2160
48.7  fps    + Confronta + 📈 Graph
» Giocabile con tutti i portatili testati con dettagli ultra.
basso 1280x720
158.7 170.4 ~ 165 fps    + Confronta
medio 1920x1080
135.2 145.5 ~ 140 fps    + Confronta
alto 1920x1080
94.5 103 109.2 112.9 ~ 105 fps    + Confronta
ultra 1920x1080
76.5 85.5 90 91.3 ~ 86 fps    + Confronta
QHD 2560x1440
55.7 62.5 64.4 65.2 ~ 62 fps    + Confronta
4K 3840x2160
32.3 34.9 35.7 36 ~ 35 fps    + Confronta
» Giocabile con tutti i portatili testati con dettagli ultra.
Additional Benchmarks
Very Low Overall Quality (DX11) 1920x1080
153.8
164.3
Control

Control

2019
basso 1280x720
239 239 ~ 239 fps    + Confronta + 📈 Graph
medio 1920x1080
124.4 124.7 ~ 125 fps    + Confronta + 📈 Graph
alto 1920x1080
82.3 90.6 91.3 94.8 ~ 90 fps    + Confronta + 📈 Graph
QHD 2560x1440
55.7 58.2 58.8 62.3 ~ 59 fps    + Confronta + 📈 Graph
4K 3840x2160
29 29.1 29.1 30.9 ~ 30 fps    + Confronta + 📈 Graph
3840x2160
34.8  fps    + Confronta + 📈 Graph
» Giocabile con tutti i portatili testati con dettagli alto.
Additional Benchmarks
High Quality Preset & High Ray Tracing Preset (DX12) 1920x1080
60.1
53.5
58.5
High Quality Preset & High Ray Tracing Preset (DX12) 3840x2160
18.2
basso 1280x720
270.2 367.7 ~ 319 fps    + Confronta
medio 1920x1080
148.6 189.4 ~ 169 fps    + Confronta
alto 1920x1080
108.4 121.2 ~ 115 fps    + Confronta
ultra 1920x1080
83.8 85.3 ~ 85 fps    + Confronta
QHD 2560x1440
53.7 56.8 ~ 55 fps    + Confronta
4K 3840x2160
26 29 ~ 28 fps    + Confronta
» Giocabile con tutti i portatili testati con dettagli ultra.
Rage 2

Rage 2

2019
alto 1920x1080
116  fps    + Confronta + 📈 Graph
ultra 1920x1080
115  fps    + Confronta + 📈 Graph
QHD 2560x1440
75.5  fps    + Confronta + 📈 Graph
4K 3840x2160
37.8  fps    + Confronta + 📈 Graph
» Giocabile con tutti i portatili testati con dettagli ultra.
Anno 1800

Anno 1800

2019
basso 1280x720
134.9 134.9 ~ 135 fps    + Confronta + 📈 Graph
medio 1920x1080
121.9 126 ~ 124 fps    + Confronta + 📈 Graph
alto 1920x1080
77.6 83.3 105.1 105.2 ~ 93 fps    + Confronta + 📈 Graph
ultra 1920x1080
44.3 47 58.9 59 ~ 52 fps    + Confronta + 📈 Graph
QHD 2560x1440
37.9 45.6 56.5 57.9 ~ 49 fps    + Confronta + 📈 Graph
4K 3840x2160
25.2 30.5 50 50.8 ~ 39 fps    + Confronta + 📈 Graph
» Giocabile con tutti i portatili testati con dettagli ultra.
basso 1280x720
147  fps    + Confronta
medio 1920x1080
135  fps    + Confronta
alto 1920x1080
105 119 123 ~ 116 fps    + Confronta
ultra 1920x1080
82 95 96 ~ 91 fps    + Confronta
QHD 2560x1440
56 67 69 ~ 64 fps    + Confronta
4K 3840x2160
31 36 38 ~ 35 fps    + Confronta
» Giocabile con tutti i portatili testati con dettagli ultra.
basso 1280x720
80 106 142 143 ~ 118 fps    + Confronta + 📈 Graph
medio 1920x1080
70 92 123 126 ~ 103 fps    + Confronta + 📈 Graph
alto 1920x1080
68 90 101 113 118 120 ~ 102 fps    + Confronta + 📈 Graph
ultra 1920x1080
62 81 90 100 106 110 ~ 92 fps    + Confronta + 📈 Graph
QHD 2560x1440
78 80 90 96 97 ~ 88 fps    + Confronta + 📈 Graph
4K 3840x2160
50 58 58 59 65 ~ 58 fps    + Confronta + 📈 Graph
» Giocabile con tutti i portatili testati con dettagli ultra.
basso 1280x720
147 162 193 214 ~ 179 fps    + Confronta
medio 1920x1080
125 126.3 127.9 132 ~ 128 fps    + Confronta
alto 1920x1080
85 92.5 96.1 96.1 104 109 ~ 97 fps    + Confronta
ultra 1920x1080
68.7 74.2 75.7 75.8 85.9 87.9 ~ 78 fps    + Confronta
QHD 2560x1440
45.1 53.8 57.9 59.2 59.4 ~ 55 fps    + Confronta
4K 3840x2160
35.4 36.6 36.8 38.2 45.1 ~ 38 fps    + Confronta
» Giocabile con tutti i portatili testati con dettagli ultra.
Additional Benchmarks
Ultra Quality DXR 16xAF 1920x1080
73.3
74.5
74.5
59.1
63.7
63.5
alto 1920x1080
144 144 ~ 144 fps    + Confronta + 📈 Graph
ultra 1920x1080
144 144 ~ 144 fps    + Confronta + 📈 Graph
QHD 2560x1440
120 138 ~ 129 fps    + Confronta + 📈 Graph
4K 3840x2160
69.2 78 ~ 74 fps    + Confronta + 📈 Graph
» Giocabile con tutti i portatili testati con dettagli ultra.
alto 1920x1080
131 149 ~ 140 fps    + Confronta + 📈 Graph
ultra 1920x1080
125 142 ~ 134 fps    + Confronta + 📈 Graph
QHD 2560x1440
98.3 117 ~ 108 fps    + Confronta + 📈 Graph
4K 3840x2160
59.2 74.9 ~ 67 fps    + Confronta + 📈 Graph
» Giocabile con tutti i portatili testati con dettagli ultra.
Additional Benchmarks
Ultra Preset DXR 1920x1080
78.9
72.2
basso 1280x720
134 135 ~ 135 fps    + Confronta
medio 1920x1080
121 122 ~ 122 fps    + Confronta
alto 1920x1080
104 107 ~ 106 fps    + Confronta
ultra 1920x1080
71 78 ~ 75 fps    + Confronta
QHD 2560x1440
59 65 ~ 62 fps    + Confronta
4K 3840x2160
43 43 ~ 43 fps    + Confronta
» Giocabile con tutti i portatili testati con dettagli ultra.
basso 1280x720
219 225 ~ 222 fps    + Confronta
medio 1920x1080
193 195 ~ 194 fps    + Confronta
alto 1920x1080
187 188 ~ 188 fps    + Confronta
ultra 1920x1080
156 158 ~ 157 fps    + Confronta
QHD 2560x1440
129 130 ~ 130 fps    + Confronta
4K 3840x2160
87 87 ~ 87 fps    + Confronta
» Giocabile con tutti i portatili testati con dettagli ultra.
basso 1280x720
89.3 130 131 140 140 146 152 159 162.6 170 177.7 181 ~ 148 fps    + Confronta
medio 1920x1080
81.6 108 116 123 125 127 130 141 143.2 148.7 150 164 ~ 130 fps    + Confronta
alto 1920x1080
79.4 103 111 113 121 122 124 127 131 136.7 138 141.8 160 ~ 124 fps    + Confronta
ultra 1920x1080
76.6 100 106 106 115 116 118 119 128 129.1 129.2 132 151 ~ 117 fps    + Confronta
QHD 2560x1440
79 89.1 89.5 93 98 102 113 ~ 95 fps    + Confronta
4K 3840x2160
43 48.1 48.7 55 56.3 ~ 50 fps    + Confronta
» Giocabile con tutti i portatili testati con dettagli ultra.
Additional Benchmarks
Lowest Preset 1920x1080
117
134
177
148
154
169
162.2
178.7
Strange Brigade

Strange Brigade

2018
basso 1280x720
313 318 332 337 343 344 346 387 388 390 409 414 414 420 424 437 442 446 450 454 456 465 471 472 480 492 507 521 535 ~ 421 fps    + Confronta
medio 1920x1080
186 196 199 205 205 212 225 236 244 253 253 254 256 260 261 262 265 267 268 269 274 277 278 287 289 292 293 305 306 ~ 254 fps    + Confronta
alto 1920x1080
165 180 181 184 185 188 189 191 193 201 204 204 210 212 212 213 216 219 221 222 223 223 225 233 240 240 242 243 247 248 ~ 212 fps    + Confronta
ultra 1920x1080
117 151 157 159 163 165 168 168 169 172 174 174 175 176 179 182 184.6 186 186.1 188 190 195 196 197 197 197 199 204 209 212 213 217 218 219 ~ 184 fps    + Confronta
QHD 2560x1440
123 129 130 136 136.7 137 138 143 144 151 152 156 160 165 ~ 143 fps    + Confronta
4K 3840x2160
55.9 66.4 72.1 73.8 76 77 80.5 80.5 84.1 84.2 91.6 91.7 ~ 78 fps    + Confronta
» Giocabile con tutti i portatili testati con dettagli ultra.
Far Cry 5

Far Cry 5

2018
basso 1280x720
94 129 129 132 134 136 138 138 143 143 144 149 152 152 153 154 159 162 163 166 168 168 170 170 174 189 ~ 150 fps    + Confronta + 📈 Graph
medio 1920x1080
84 108 115 115 115 115 119 119 122 123 125 126 128 129 130 132 133 135 135 137 139 140 141 143 144 162 ~ 127 fps    + Confronta + 📈 Graph
alto 1920x1080
79 104 109 109 110 113 114 115 117 119 119 119 120 121 123 124 125 126 126 127 128 129 134 134 135 137 137 155 ~ 122 fps    + Confronta + 📈 Graph
ultra 1920x1080
75 93 100 100 103 104 107 108 109 110 110 111 111 112 113 114 114 114 115 116 117 118 120 120 120 121 121 124 125 126 127 129 146 ~ 114 fps    + Confronta + 📈 Graph
QHD 2560x1440
86 90 95 96 96 98 98 101 103 104 104 106 107 110 111 111 112 ~ 102 fps    + Confronta + 📈 Graph
4K 3840x2160
52 54 54 54 55 56 59 62 63 ~ 57 fps    + Confronta + 📈 Graph
» Giocabile con tutti i portatili testati con dettagli ultra.
Additional Benchmarks
Low Preset TAA 1920x1080
150
126
152
130
180
141
152
134
131
143
157
162
154
141
140
136
152
159
159
basso 1280x720
93.7 95.8 96 98.1 98.4 99.5 101 103 103 104 105 106 107 108 111 111 112 112 113.2 115 116 117 118 118 118 121 122 123 125 125 125 126 126 127 127 128 129 132 133 135.2 138 142 146.1 153 156 ~ 118 fps    + Confronta
medio 1920x1080
80.6 81.1 85.4 85.8 87.4 88 88.3 90.4 90.8 91.9 92.3 92.6 92.9 93 98.2 99 99.3 99.4 100 101 102 103 104 104 104 104 105 106 107 109 109 109 110 110 110 113 114 117.6 118 123 128.9 129.6 132 139 ~ 103 fps    + Confronta
alto 1920x1080
65.6 68.1 69 72 72.1 72.4 72.7 74 75.5 75.9 76 76.9 77 79.7 80 80.7 82.1 82.3 82.3 82.3 82.8 82.9 83.3 83.8 84.2 84.4 84.7 85.7 85.7 87.9 88 88.1 88.5 88.8 88.9 89.2 89.3 92.3 96.7 97.3 102 102.3 109.3 113 ~ 84 fps    + Confronta
4K 3840x2160
39.9 51.4 56.9 60.2 60.9 61.3 62.2 63.2 63.5 64 67.9 67.9 72.1 79 83.1 88 88.6 ~ 66 fps    + Confronta
» Giocabile con tutti i portatili testati con dettagli alto.
basso 1280x720
123 135.7 158 165 165 166 169 170 172 176 176 177 177 178.6 179 181 183 184 187 187 190 191 193 195.1 196 196 199 ~ 177 fps    + Confronta
medio 1920x1080
97 113 118.9 123 123 127 127 129 130 133 133 134 134 136 136 136 137.2 139 139 139 140 140 140.8 142.3 144 144 145 152 154 ~ 134 fps    + Confronta
alto 1920x1080
55.5 63.6 78.2 85.4 88 93.1 93.4 93.8 94.2 97 97.1 97.2 97.5 98.2 98.5 99 105 105 105 105 105.4 106 106 106 106 106.6 107.1 108 108 109 111 113 115 115 ~ 99 fps    + Confronta
QHD 2560x1440
61.6 71.2 73.1 74.6 75.9 77.4 78.2 79.2 79.7 80.6 81 81.3 81.8 83.5 84.3 87.4 88.3 90.3 ~ 79 fps    + Confronta
4K 3840x2160
28.4 29.2 37.5 42.2 42.9 43.6 44.1 44.7 45 45 45.2 45.4 49.3 49.5 50.8 53.2 ~ 44 fps    + Confronta
» Giocabile con tutti i portatili testati con dettagli alto.
basso 1280x720
149 154 ~ 152 fps    + Confronta
medio 1920x1080
126 126 ~ 126 fps    + Confronta
alto 1920x1080
118 119 ~ 119 fps    + Confronta
ultra 1920x1080
102 102 ~ 102 fps    + Confronta
QHD 2560x1440
82 82 ~ 82 fps    + Confronta
4K 3840x2160
52 53 ~ 53 fps    + Confronta
» Giocabile con tutti i portatili testati con dettagli ultra.
basso 1024x768
283.7  fps    + Confronta
medio 1366x768
210  fps    + Confronta
alto 1920x1080
157.2  fps    + Confronta
ultra 1920x1080
139.5  fps    + Confronta
» Giocabile con tutti i portatili testati con dettagli ultra.
basso 1280x720
132.7 133.3 133.5 138 141 144 144 144 144 147 147 148 148 150 150 152 153 153 157 157 158 159 160 162 164 164 164 164 164 166 167 168 168 171.3 171.4 172.8 173 174 175 176 178 179 180.8 182 183 ~ 159 fps    + Confronta
medio 1366x768
82.7 111 119 122.2 124.4 129 129 132 133 133 134 136 137 137 137 137 139 139 140 140 141 143 144 145 145 146 146 146 147 147 148 151 151 151 151 152.6 153.3 155 156.1 157 157 159 159.8 165 170 ~ 142 fps    + Confronta
alto 1920x1080
108.1 113 113.2 116.9 119.2 122 122 123 124 124 124 126 126 126 127 129 130 131 133 133 134 134 135 137 137.6 139 139 139 139 140 141 141.5 142 143 143 144 145.7 146 147.4 148 148 151 152.1 154 161 ~ 134 fps    + Confronta
ultra 1920x1080
98 103 105 108.9 110.7 112.3 114 116 117 118 119 119 119 119 120 122 123 123 125 126 127 128 128 128 128 128.2 130 131 132 132 133 134 134.7 135 135 135 136 138 138 138.4 138.7 141.2 142 146 156 ~ 126 fps    + Confronta
4K 3840x2160
55.2 87.2 92.4 99.9 101 101.3 106 110 111 111 112.6 113.2 116 117.1 119 120.4 128 ~ 106 fps    + Confronta
» Giocabile con tutti i portatili testati con dettagli ultra.
basso 1024x768
151 293 309 312 316 318.8 320.7 325 334 341.7 344.8 346 350.8 355 365 368 370.2 370.2 371 398.5 399 400 418 423 427 439.6 453 465.4 ~ 360 fps    + Confronta + 📈 Graph
medio 1366x768
236 259.2 261 262 262 262 267 270.1 276 276.5 285 288.6 293.2 294 295 300 301.3 302 311 313 317 317.3 321.2 329 374 ~ 291 fps    + Confronta + 📈 Graph
alto 1920x1080
149 151 155 165.2 170 174 175 175 176 177 183 184.9 187.2 189 189.5 190 192 196.4 196.5 197.1 197.3 198 200 205 206 208.1 210 211 212 212.9 231.2 242 ~ 191 fps    + Confronta + 📈 Graph
ultra 1920x1080
85.1 87.7 89.5 90.2 93.2 93.4 93.8 96.1 97.6 97.6 97.9 98.7 100 100.9 102.4 102.8 104.6 105.2 105.5 105.8 106 107 108 108.3 108.4 108.6 109 110.2 111 112 112 112 113 114 115 116 120 121 123 123 ~ 105 fps    + Confronta + 📈 Graph
QHD 2560x1440
79 79.3 ~ 79 fps    + Confronta + 📈 Graph
4K 3840x2160
60 62.2 66.7 67.5 69.4 69.6 70.3 80 80.2 80.4 82.2 ~ 72 fps    + Confronta + 📈 Graph
» Giocabile con tutti i portatili testati con dettagli ultra.
Additional Benchmarks
Ultra Graphics & Postprocessing (HBAO+) 3840x2160
51.6
51
47
47.1
48.4
Medium Graphics & Postprocessing 1920x1080
189
231.5
227
222.3
247
222
225.6
213
229
235
GTA V

GTA V

2015
basso 1024x768
164 173 177 177 178 179 179 180 180 181 181 181 181.7 182 182 182 183 183 183 184 184 184 184 185 185 186 186 186 186.3 ~ 181 fps    + Confronta
medio 1366x768
167 171 172 172 174 176 176 176 176 176 177 177 177 177 177 177 178 179 179.4 180 180 180 180 181 182 ~ 177 fps    + Confronta
alto 1920x1080
137 148 150 150 152 154 156 157 158 160 161 162 163 164 164 164 165 166 166 166 166 167 168 172 172.2 173 174.7 175 176 176 ~ 163 fps    + Confronta
ultra 1920x1080
68.6 77 84 87.2 88.2 89.9 90 90.7 91.9 93 93.9 94.5 95.1 95.7 95.8 97.4 98.1 98.2 98.5 99.5 99.5 101 102 103 103 103 105 109 109 110 111.1 112 112 114.6 ~ 98 fps    + Confronta
QHD 2560x1440
82.2 82.3 85.7 85.7 89.2 92.5 94.8 95.6 96.3 97.4 98.2 99.1 ~ 92 fps    + Confronta
4K 3840x2160
64.8 81.2 86.5 88 91.1 93 98 98.1 98.2 106 112 ~ 92 fps    + Confronta
» Giocabile con tutti i portatili testati con dettagli ultra.
Additional Benchmarks
Highest Settings possible 16xAF 4xMSAA + FXAA 3840x2160
57.5
48
53.8
57.8
48.6
46.9
32.4
52.7
52.3
Normal/Off 4xAF 1920x1080
160
168
168
171
175
173
173
177
176
180
177
169
174
171
171
177
172
180
170
170
167
182
180
173
174
176
176
177.7
179.2
Lowest Settings possible 1920x1080
174
177
173
182
180
182
181
182
185
182
177
181
179
179
183
180
186
176
177
175
186
184
180
180
180
182
181.5
184
basso 1280x720
374  fps    + Confronta
ultra 1920x1080
186.2  fps    + Confronta
» Giocabile con tutti i portatili testati con dettagli ultra.
bassomedioaltoultraQHD4K
The First Descendant147.693.376.164.543.323.9
F1 24244227176.459.338.718.8
Senua's Saga Hellblade 25849362614
Ghost of Tsushima968173604729
Dragon's Dogma 265594931
Horizon Forbidden West1019163665131
Alone in the Dark1771691591065819
Last Epoch1861781721288341
Skull & Bones999780635133
Helldivers 212610190926839
Enshrouded756656503924
Palworld119115100957039
Prince of Persia The Lost Crown336312304258192
Ready or Not1771581371168640
The Finals169159.1151.71368541
Avatar Frontiers of Pandora767061463015
Call of Duty Modern Warfare 3 202313712097937450
EA Sports WRC1299789826437
Alan Wake 26661553820
Lords of the Fallen84.478.366.17337.620.5
Total War Pharaoh3502241351057942
Assassin's Creed Mirage1039690746140
EA Sports FC 24194.2174.2148.614813080
Counter-Strike 221220517813510161
Cyberpunk 2077 2.1 Phantom Liberty12310086804922
Lies of P1731511311187941
The Crew Motorfest605836
Starfield877255494027
Armored Core 6105102998249
Immortals of Aveum6253483318
Atlas Fallen1381301211027041
Baldur's Gate 312610391916334
Ratchet & Clank Rift Apart11810082746862
F1 23259258196643820
Diablo 423420918416510957
Star Wars Jedi Survivor837369674322
Dead Island 21981911611268744
The Last of Us1018577664421
Resident Evil 4 Remake14010294725432
Company of Heroes 31711531191269456
Sons of the Forest868278756343
Atomic Heart17914085695333
Returnal1019889796034
Hogwarts Legacy11910478694828
Dead Space Remake878474735027
The Witcher 3 v4.001851591371168448
High On Life2241851351116729
The Callisto Protocol155125110846338
Need for Speed Unbound1321231061048044
Spider-Man Miles Morales1291171091037851
Call of Duty Modern Warfare 2 20221421061037242
Uncharted Legacy of Thieves Collection838378755834
A Plague Tale Requiem1138263513722
FIFA 23138.2128.412712686.9
The Quarry15512199805530
F1 22251246197664221
Vampire Bloodhunt25323822415078
Ghostwire Tokyo1591581561539849
Tiny Tina's Wonderlands207175119936535
Cyberpunk 2077 1.612310389804823
Elex 297.988.184.865.938.7
GRID Legends15916614612010066
Elden Ring59.559.259.15950.7
Dying Light 299.687.361.834
Rainbow Six Extraction22321817011157
God of War13211493675638
Halo Infinite1261071017543
Farming Simulator 2226320017215313285
Battlefield 2042133119109967547
Forza Horizon 5215144132837051
Call of Duty Vanguard13612511483.548.1
Riders Republic1551471201107944
Guardians of the Galaxy14013813813510357
Back 4 Blood28123522014676.6
Far Cry 612810594827245
Alan Wake Remastered11010310069
FIFA 22309273271263242
New World1159186806540
Deathloop12011310780.344.9
F1 20213172441921098846
Monster Hunter Stories 2144144144131
Days Gone18114813210179.5
Mass Effect Legendary Edition130113111
Resident Evil Village19519116715210851.7
Outriders11810911411091.1
Hitman 3200169162158115.9
Cyberpunk 2077 1.012010081694323
Immortals Fenyx Rising14511599937047
Yakuza Like a Dragon1431301221127635.8
Call of Duty Black Ops Cold War95876638
Assassin´s Creed Valhalla14110383735937
Dirt 516211898867346
Watch Dogs Legion11211095745532
FIFA 21225220191132
Star Wars Squadrons22421515794
Mafia Definitive Edition1027037
Serious Sam 4141103938667.2
Crysis Remastered82584629
Horizon Zero Dawn146125109988046
Death Stranding1721481221209557
F1 202027922219915512171
Gears Tactics127.6187.81391087742
Doom Eternal27419818017813476
Hunt Showdown1147537
Red Dead Redemption 289594932
Star Wars Jedi Fallen Order100958346
Need for Speed Heat96917346
GRID 201911384.869.848.7
Borderlands 3165140105866235
Control239125905930
Total War: Three Kingdoms319169115855528
Rage 211611575.537.8
Anno 180013512493524939
The Division 2147135116916435
Far Cry New Dawn118103102928858
Metro Exodus17912897785538
Apex Legends14414412974
Battlefield V14013410867
Assassin´s Creed Odyssey135122106756243
Forza Horizon 422219418815713087
Shadow of the Tomb Raider1481301241179550
Strange Brigade42125421218414378
Far Cry 515012712211410257
X-Plane 11.111181038466
Final Fantasy XV Benchmark177134997944
Assassin´s Creed Origins1521261191028253
Rise of the Tomb Raider283.7210157.2139.5
Dota 2 Reborn159142134126106
The Witcher 33602911911057972
GTA V181177163989292
BioShock Infinite374186.2
< 30 fps
< 60 fps
< 120 fps
≥ 120 fps

1
27
74

2
44
67

7
69
51

10
79
31
1
38
73
15
24
76
20
4

Per conoscere altri giochi che potrebbero essere utilizzabili e per una lista completa di tutti i giochi e delle schede grafiche visitate la nostra Gaming List

v1.28
log 25. 15:34:39

#0 no ids found in url (should be separated by "_") +0s ... 0s

#1 not redirecting to Ajax server +0s ... 0s

#2 did not recreate cache, as it is less than 5 days old! Created at Thu, 25 Jul 2024 05:29:35 +0200 +0.001s ... 0.001s

#3 no comparison url found in template nbc.compare_page_1 needed +0.042s ... 0.044s

#4 no comparison url found in template nbc.compare_page_1 needed +0s ... 0.044s

#5 no comparison url found in template nbc.compare_page_1 needed +0s ... 0.044s

#6 no comparison url found in template nbc.compare_page_1 needed +0s ... 0.044s

#7 no comparison url found in template nbc.compare_page_1 needed +0s ... 0.045s

#8 no comparison url found in template nbc.compare_page_1 needed +0s ... 0.045s

#9 no comparison url found in template nbc.compare_page_1 needed +0s ... 0.045s

#10 no comparison url found in template nbc.compare_page_1 needed +0s ... 0.046s

#11 no comparison url found in template nbc.compare_page_1 needed +0s ... 0.046s

#12 no comparison url found in template nbc.compare_page_1 needed +0s ... 0.046s

#13 no comparison url found in template nbc.compare_page_1 needed +0s ... 0.046s

#14 no comparison url found in template nbc.compare_page_1 needed +0s ... 0.046s

#15 no comparison url found in template nbc.compare_page_1 needed +0s ... 0.047s

#16 no comparison url found in template nbc.compare_page_1 needed +0s ... 0.047s

#17 no comparison url found in template nbc.compare_page_1 needed +0s ... 0.047s

#18 no comparison url found in template nbc.compare_page_1 needed +0s ... 0.048s

#19 no comparison url found in template nbc.compare_page_1 needed +0s ... 0.048s

#20 no comparison url found in template nbc.compare_page_1 needed +0s ... 0.048s

#21 no comparison url found in template nbc.compare_page_1 needed +0s ... 0.048s

#22 no comparison url found in template nbc.compare_page_1 needed +0s ... 0.048s

#23 composed specs +0s ... 0.048s

#24 did output specs +0s ... 0.048s

#25 start showIntegratedCPUs +0s ... 0.048s

#26 getting avg benchmarks for device 10474 +0.029s ... 0.077s

#27 got single benchmarks 10474 +0.152s ... 0.229s

#28 got avg benchmarks for devices +0s ... 0.229s

#29 min, max, avg, median took s +1.242s ... 1.471s

#30 before gaming benchmark output +0.001s ... 1.472s

#31 Got 2829 rows for game benchmarks. +0.868s ... 2.339s

#32 composed SQL query for gamebenchmarks +0s ... 2.339s

#33 got data and put it in $dataArray +0.101s ... 2.441s

#34 benchmarks composed for output. +7.7s ... 10.141s

#35 no comparison url found in template nbc.compare_page_1 needed +0.016s ... 10.156s

#36 return log +0s ... 10.156s

Recensioni Notebook con NVIDIA GeForce RTX 3080 Laptop GPU la scheda grafica

Recensione dell'Acemagic M2A Starship: Il PC per il gaming con look da astronave futuristica si affida a Intel Core i9-12900H e alla GPU per laptop Nvidia GeForce RTX 3080

Recensione dell'Acemagic M2A Starship: Il PC per il gaming con look da astronave futuristica si affida a Intel Core i9-12900H e alla GPU per laptop Nvidia GeForce RTX 3080

Con M2A Starship, Acemagic ha un PC da gioco molto accattivante nel suo portafoglio. Il design insolito del mini-PC, simile a un'astronave, attira l'attenzione,...
Intel Core i9-12900H | NVIDIA GeForce RTX 3080 Laptop GPU | | 2.1 kg
Serbatoio Acemagic03

Recensione del PC da gioco Acemagic Tank 03: Il piccolo mini PC con Intel Core i9-12900H e GPU Nvidia GeForce RTX 3080 padroneggia anche i giochi attuali

Con il Tank 03, Acemagic offre un mini PC molto speciale nel suo portafoglio, che si distingue per le enormi prestazioni racchiuse nel minimo spazio. Almeno, qu...
Intel Core i9-12900H | NVIDIA GeForce RTX 3080 Laptop GPU | | 2.2 kg
Serbatoio Acemagic03

Recensione del PC da gioco Acemagic Tank 03: Il piccolo mini PC con Intel Core i9-12900H e GPU Nvidia GeForce RTX 3080 padroneggia anche i giochi attuali

Con il Tank 03, Acemagic offre un mini PC molto speciale nel suo portafoglio, che si distingue per le enormi prestazioni racchiuse nel minimo spazio. Almeno, qu...
Intel Core i9-12900H | NVIDIA GeForce RTX 3080 Laptop GPU |
Recensione del Laptop Schenker XMG Pro 15 (Clevo PC50HS-D): Computer portatile per il gaming 4K sottile e leggero

Recensione del Laptop Schenker XMG Pro 15 (Clevo PC50HS-D): Computer portatile per il gaming 4K sottile e leggero

La CPU Core i7-11800H e la GPU mobile GeForce RTX 3080 completano bene lo schermo OLED 4K luminoso e ad alto contrasto e sono in grado di eseguire tutti i titol...
Intel Core i7-11800H | NVIDIA GeForce RTX 3080 Laptop GPU | 15.60" | 2 kg

SCHENKER XMG Pro 17 (Late 2021, RTX 3080): Intel Core i7-11800H, 17.30", 2.4 kg
  recensione » Recensione dello Schenker XMG Pro 17 con RTX 3080 (Clevo PC70HS): Un portatile gaming ultrasottile e una workstation insieme

Lenovo ThinkPad X1 Extreme G4-20Y50040GE: Intel Core i9-11950H, 16.00", 1.9 kg
  recensione » Recensione del Lenovo ThinkPad X1 Extreme G4: Il miglior portatile multimediale grazie a Core i9 e RTX 3080?

MSI GP66 Leopard 11UH-028: Intel Core i7-11800H, 15.60", 2.3 kg
  recensione » Recensione dell'economico MSI GP66 Leopard 11UH: Gamer con RTX 3080 per meno di 2.000 euro

Alienware m15 R6, i7-11800H RTX 3080: Intel Core i7-11800H, 15.60", 2.5 kg
  recensione » Recensione del portatile Alienware m15 R6: Più efficiente, ma la RTX 3080 è più lenta che nel predecessore

SCHENKER XMG NEO 17 GM7TG8S: Intel Core i7-11800H, 17.30", 2.6 kg
  recensione » Recensione del Schenker XMG NEO 17 con RTX 3080: Gli utenti possono scatenare la RTX 3080 da soli

Alienware x17 RTX 3080 P48E: Intel Core i7-11800H, 17.30", 3.2 kg
  recensione » Recensione del portatile Alienware x17 R1 RTX 3080: Un nuovo inizio

MSI GS76 Stealth 11UH: Intel Core i9-11900H, 17.30", 2.4 kg
  recensione » Recensione del portatile per il gaming MSI GS76 Stealth 11UH: La struttura sottile sacrifica le prestazioni della GPU

Maingear Vector Pro MG-VCP17: Intel Core i7-11800H, 17.30", 2.3 kg
  recensione » Recensione del computer portatile Maingear Vector Pro MG-VCP17: GeForce RTX 3080 da 165 W in dimensioni ultrasottili

MSI GE76 Raider 11UH-472US: Intel Core i9-11980HK, 17.30", 3 kg
  recensione » Recensione dell'MSI GE76 Raider 11UH: un portatile gamign di fascia alta offre un veloce display a 360 Hz

Acer Nitro 5 AN517-41-R9S5: AMD Ryzen 7 5800H, 17.30", 2.7 kg
  recensione » Recensione dell'Acer Nitro 5 AN517-41: l'RTX 3080 può essere sfruttata solo in misura limitata

Medion Erazer Beast X25: AMD Ryzen 9 5900HX, 17.30", 2.3 kg
  recensione » Recensione del computer portatile gaming Medion Erazer Beast X25 (Tongfang GM7ZG8P): Leggero e potente

Asus ROG Strix Scar 15 G533QS: AMD Ryzen 9 5900HX, 15.60", 2.3 kg
  recensione » Recensione del portatile Asus ROG Strix Scar 15 G533QS: AMD Zen 3 e 165 Hz 1440p Sweet Spot

Asus ROG Zephyrus S17 GX703HSD: Intel Core i9-11900H, 17.30", 2.8 kg
  recensione » Recensione del portatile Asus ROG Zephyrus S17: Il case di questo dispositivo gaming si apre per fornire più aria fresca. Interessante - ma è sicuro?

Razer Blade 15 Advanced (Mid 2021): Intel Core i7-11800H, 15.60", 2 kg
  recensione » Recensione del Razer Blade 15 modello avanzato Intel 11a generazione (2021): Piccoli cambiamenti, grandi guadagni per la CPU

Aorus 17G YD: Intel Core i7-11800H, 17.30", 2.8 kg
  recensione » Recensione dell'Aorus 17G YD: Computer portatile gaming rumoroso con una buona tastiera meccanica

SCHENKER XMG Neo 15 Tiger Lake: Intel Core i7-11800H, 15.60", 2.2 kg
  recensione » Recensione del computer portatile gaming Schenker XMG Neo 15 - la RTX 3080 con 165W TGP assicura punteggi elevati

Aorus 15P YD: Intel Core i7-11800H, 15.60", 2.2 kg
  recensione » Recensione dell'Aorus 15P YD in recensione: Computer portatile da gioco di fascia alta con display veloce a 360 Hz

Lenovo Legion 7 16ACHg6: AMD Ryzen 9 5900HX, 16.00", 2.5 kg
  recensione » Recensione del computer portatile Lenovo Legion 7 16ACH: Centrale gaming con un buon display 16:10

Alienware m15 R4 RTX 3080: Intel Core i9-10980HK, 15.60", 2.4 kg
  recensione » Recensione del computer portatile Alienware m15 R4: Ora anche con una tastiera meccanica

Gigabyte Aero 17 HDR YD: Intel Core i9-11980HK, 17.30", 2.8 kg
  recensione » Recensione del portatile Gigabyte Aero 17 HDR YD: 4K HDR incontra RTX 3080

Asus Strix Scar 17 G733QSA-XS99: AMD Ryzen 9 5900HX, 17.30", 2.8 kg
  recensione » Recensione del computer portatile Asus Strix Scar 17 G733QS: l'AMD Zen 3 da 7 nm Liquid Metal è stupefacente

Razer Blade 15 Advanced Model Early 2021: Intel Core i7-10875H, 15.60", 2 kg
  recensione » Recensione del computer portatile Razer Blade 15 Advanced (2021): Ora con uno schermo a 360 Hz

SCHENKER XMG Ultra 17 Rocket Lake: Intel Core i9-11900K, 17.30", 4.7 kg
  recensione » Recensione del computer portatile Schenker XMG Ultra 17 (Clevo X170KM-G): Massiccia centrale elettrica con un dotazioni lussureggianti

Alienware m17 R4: Intel Core i9-10980HK, 17.30", 3 kg
  recensione » Recensione del portatile Alienware m17 R4

MSI GE76 Raider 10UH: Intel Core i7-10870H, 17.30", 3 kg
  recensione » Recensione del portatile MSI GE76 Raider 10UH: Un GeForce RTX 3080 PC che puoi davvero comprare

SCHENKER XMG Pro 15 (Early 2021, RTX 3080): Intel Core i7-10870H, 15.60", 2 kg
  recensione » Recensione del Laptop Schenker XMG Pro 15 (Clevo PC50DS) con RTX 3080: un tuttofare ultrasottile e leggero di fascia alta

Asus ROG Flow X13 with XG Mobile (internal Display): AMD Ryzen 9 5980HS, 13.40"
  recensione » Recensione dell'Asus ROG XG Mobile - convertibile gaming con AMD Ryzen 5980HS e GeForce RTX 3080

  recensione » Recensione dell'Asus ROG XG Mobile - convertibile gaming con AMD Ryzen 5980HS e GeForce RTX 3080

Razer Blade Pro 17 2021 (QHD Touch): Intel Core i7-10875H, 17.30", 3 kg
  recensione » Recensione del Laptop Razer Blade Pro 17 Early 2021: La differenza GeForce RTX 30

Asus ROG Zephyrus Duo 15 SE GX551QS: AMD Ryzen 9 5900HX, 15.60", 2.5 kg
  recensione » L'AMD Ryzen 9 5900HX è una bestia mobile: Recensione del portatile Asus ROG Zephyrus Duo 15 SE GX551QS

Asus ROG Zephyrus G15 GA503Q: AMD Ryzen 9 5900HS, 15.60", 2 kg
  recensione » Recensione del portatile Asus ROG Zephyrus G15: Accattivante

Gigabyte Aero 17 HDR YC: Intel Core i9-10980HK, 17.30", 2.8 kg
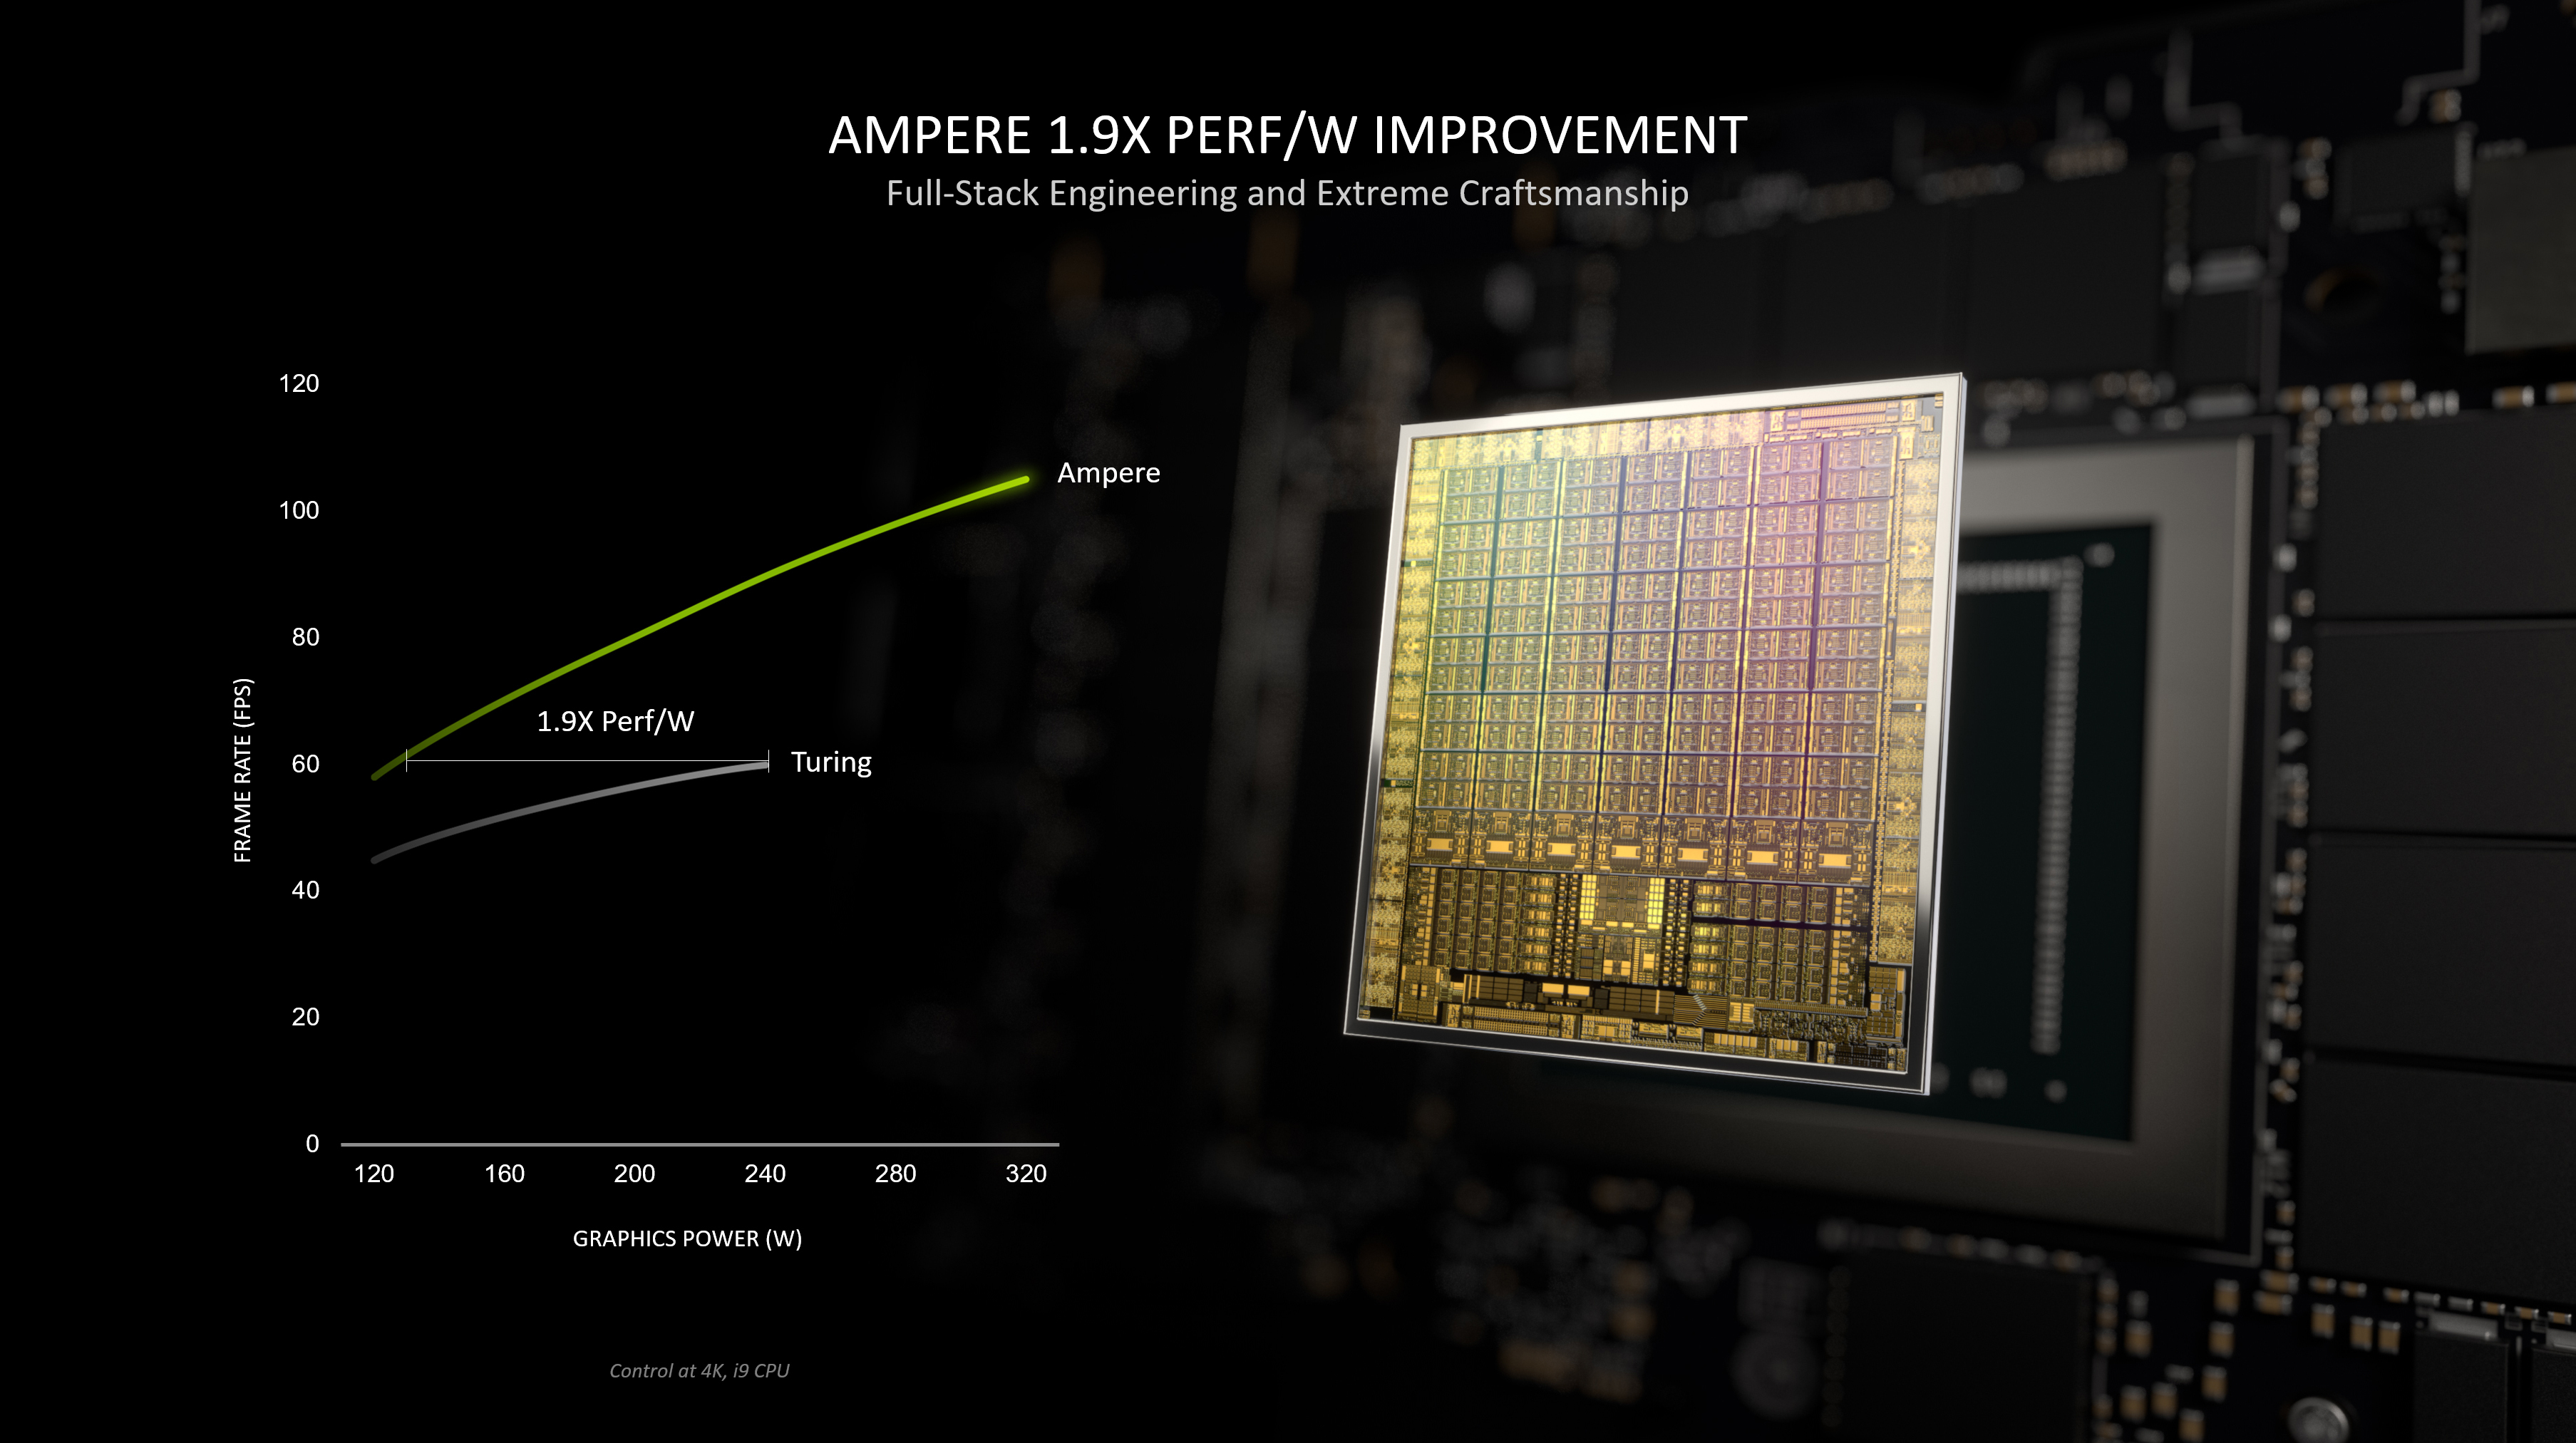
  recensione » Recensione del Laptop Gigabyte Aero 17 HDR YC: Debutto per Nvidia Ampere

Acer Predator Helios 300 PH315-55s-98TX: Intel Core i9-12900H, 15.60", 2.6 kg
  Recensioni esterne » Acer Predator Helios 300 PH315-55s-98TX

Acer Predator Helios 300 PH317-56-94RD: Intel Core i9-12900H, 17.30", 3 kg
  Recensioni esterne » Acer Predator Helios 300 PH317-56-94RD

Acer ConceptD 7 Ezel Pro CC715-72G-71H9: Intel Core i7-11800H, 16.00", 2.5 kg
  Recensioni esterne » Acer ConceptD 7 Ezel Pro CC715-72G-71H9

HP Omen 17-ck0196ng: Intel Core i9-11900H, 17.30", 2.8 kg
  Recensioni esterne » HP Omen 17-ck0196ng

Gigabyte Aero 15 OLED YD, i7-11800H: Intel Core i7-11800H, 15.60", 2 kg
  Recensioni esterne » Gigabyte Aero 15 OLED YD, i7-11800H

Acer Predator Triton 300 PT315-53-76B9: Intel Core i7-11800H, 15.60", 2.1 kg
  Recensioni esterne » Acer Predator Triton 300 PT315-53-76B9

Lenovo ThinkPad T15g G2-20YS002CUS: Intel Core i7-11850H, 15.60", 2.9 kg
  Recensioni esterne » Lenovo ThinkPad T15g G2-20YS002CUS

MSI Vector GP66 12UH-242: Intel Core i7-12700H, 15.60", 2.4 kg
  Recensioni esterne » MSI Vector GP66 12UH-242

Acer Predator Helios 500 PH517-52-78TY: Intel Core i7-11800H, 17.30", 4 kg
  Recensioni esterne » Acer Predator Helios 500 PH517-52-78TY

SCHENKER XMG Neo 15-E21dbb: AMD Ryzen 9 5900HX, 15.60", 2.1 kg
  Recensioni esterne » Schenker XMG Neo 15-E21dbb

Asus ROG Zephyrus S17 GX703HS-KF004R: Intel Core i9-11900H, 17.30", 2.6 kg
  Recensioni esterne » Asus ROG Zephyrus S17 GX703HS-KF004R

Razer Blade 17 RZ09-0406CG63-R3G1: Intel Core i9-11900H, 17.30", 2.8 kg
  Recensioni esterne » Razer Blade 17 RZ09-0406CG63-R3G1

Lenovo Legion 7 16ACHg6-82N600EKGE: AMD Ryzen 7 5800H, 16.00", 2.5 kg
  Recensioni esterne » Lenovo Legion 7 16ACHg6-82N600EKGE

Dream Machines 17 RX3080-17UA38: Intel Core i9-11900K, 17.30", 4.5 kg
  Recensioni esterne » Dream Machines 17 RX3080-17UA38

Acer Predator Triton 500 PT516-51s-72LN: Intel Core i7-11800H, 16.10", 2.5 kg
  Recensioni esterne » Acer Predator Triton 500 PT516-51s-72LN

Razer Blade 15 Advanced RZ09-0409CGC3-R3G1: Intel Core i7-11800H, 15.60", 2 kg
  Recensioni esterne » Razer Blade 15 Advanced RZ09-0409CGC3-R3G1

Acer Nitro 5 AN517-41-R3NX: AMD Ryzen 7 5800H, 15.60", 2.7 kg
  Recensioni esterne » Acer Nitro 5 AN517-41-R3NX

Alienware x15 R1-JYMD9: Intel Core i7-11800H, 15.60", 2.4 kg
  Recensioni esterne » Alienware x15 R1-JYMD9

MSI GS66 Stealth 11UH-045: Intel Core i9-11900H, 15.60", 2.1 kg
  Recensioni esterne » MSI GS66 Stealth 11UH-045

Alienware m15 R6-C0DK5: Intel Core i7-11800H, 15.60", 2.7 kg
  Recensioni esterne » Alienware m15 R6-C0DK5

Acer Nitro 5 AN515-45-R588: AMD Ryzen 7 5800H, 15.60", 2.3 kg
  Recensioni esterne » Acer Nitro 5 AN515-45-R588

Asus ROG Zephyrus Duo 15 SE GX551QS-HB202R: AMD Ryzen 9 5980HX, 15.60", 2.5 kg
  Recensioni esterne » Asus ROG Zephyrus Duo 15 SE GX551QS-HB202R

MSI Creator 17 B11UH-241: Intel Core i7-11800H, 17.30", 2.5 kg
  Recensioni esterne » MSI Creator 17 B11UH-241

Razer Blade 15 Advanced RZ09-0409CG53-R3G1: Intel Core i9-11900H, 15.60", 2 kg
  Recensioni esterne » Razer Blade 15 Advanced RZ09-0409CG53-R3G1

Razer Blade 17, i7-11800H RTX 3080: Intel Core i7-11800H, 17.30", 2.8 kg
  Recensioni esterne » Razer Blade 17, i7-11800H RTX 3080

Acer Predator Helios 500 PH517-52-NH.QCNEX.003: Intel Core i9-11980HK, 17.30", 3.9 kg
  Recensioni esterne » Acer Predator Helios 500 PH517-52-NH.QCNEX.003

Acer Predator Triton 500 PT516-51s-72JQ: Intel Core i7-11800H, 16.10", 2.5 kg
  Recensioni esterne » Acer Predator Triton 500 PT516-51s-72JQ

Aorus 17X YD: Intel Core i9-11980HK, 17.30", 3.8 kg
  Recensioni esterne » Aorus 17X YD

Razer Blade 15 Advanced (Mid 2021): Intel Core i7-11800H, 15.60", 2 kg
  Recensioni esterne » Razer Blade 15 Advanced Model Core i7-11800H

Acer Nitro 5 AN515-45-R9QH: AMD Ryzen 9 5900HX, 15.60", 2.3 kg
  Recensioni esterne » Acer Nitro 5 AN515-45-R9QH

Lenovo Legion 7 16ACHg6-82N6008FGE: AMD Ryzen 7 5800H, 16.00", 2.5 kg
  Recensioni esterne » Lenovo Legion 7 16ACHg6-82N6008FGE

MSI GS66 Stealth 11UH-471: Intel Core i7-11800H, 15.60", 2.1 kg
  Recensioni esterne » MSI GS66 Stealth 11UH-471

MSI GE76 Raider 11UH 4K i9 3080: Intel Core i9-11980HK, 17.30", 2.9 kg
  Recensioni esterne » MSI GE76 Raider 11UH 4K i9 3080

Lenovo Legion 7 16ITH6, 11980HK 3080: Intel Core i9-11980HK, 16.00", 2.5 kg
  Recensioni esterne » Lenovo Legion 7 16ITH6, 11980HK 3080

MSI GS76 Stealth 11UH: Intel Core i9-11900H, 17.30", 2.4 kg
  Recensioni esterne » MSI GS76 Stealth 11UH

MSI GE76 Raider 11UH-083: Intel Core i7-11800H, 17.30", 2.9 kg
  Recensioni esterne » MSI GE76 Raider 11UH-083

MSI GP66 Leopard 11UH-229RU: Intel Core i7-11800H, 15.60", 2.4 kg
  Recensioni esterne » MSI GP66 Leopard 11UH-229RU

Aorus 15G YC: Intel Core i7-10870H, 15.60", 2 kg
  Recensioni esterne » Aorus 15G YC

Alienware x17 RTX 3080 P48E: Intel Core i7-11800H, 17.30", 3.2 kg
  Recensioni esterne » Alienware x17 RTX 3080 P48E

Razer Blade 15 Advanced Model RZ09-0409CGC3-R3G1: Intel Core i7-11800H, 15.60", 2 kg
  Recensioni esterne » Razer Blade 15 Advanced Model RZ09-0409CGC3-R3G1

Acer Nitro 5 AN517-41-R7L9: AMD Ryzen 9 5900HX, 17.30", 2.7 kg
  Recensioni esterne » Acer Nitro 5 AN517-41-R7L9

MSI GE76 Raider 11UH-472US: Intel Core i9-11980HK, 17.30", 3 kg
  Recensioni esterne » MSI GE76 Raider 11UH

Acer Nitro 5 AN515-45-R2X0: AMD Ryzen 7 5800H, 15.60", 2.3 kg
  Recensioni esterne » Acer Nitro 5 AN515-45-R2X0

Acer Predator Triton 500 PT516-51s-9914: Intel Core i9-11900H, 16.10", 2.5 kg
  Recensioni esterne » Acer Predator Triton 500 PT516-51s-9914

Lenovo ThinkPad X1 Extreme G4-20Y50040GE: Intel Core i9-11950H, 16.00", 1.9 kg
  Recensioni esterne » Lenovo ThinkPad X1 Extreme G4-20Y50040GE

Acer Nitro 5 AN515-45-R715 : AMD Ryzen 9 5900HX, 15.60", 2.3 kg
  Recensioni esterne » Acer Nitro 5 AN515-45-R715

Gigabyte Aero 17 HDR YD: Intel Core i9-11980HK, 17.30", 2.8 kg
  Recensioni esterne » Gigabyte Aero 17 HDR YD

Asus ROG Strix Scar 17 G733QSA-KH222R: AMD Ryzen 9 5900HX, 17.30", 2.7 kg
  Recensioni esterne » Asus ROG Strix Scar 17 G733QSA-KH222R

Hyperbook GTR, i9-11900K RTX 3080: Intel Core i9-11900K, 17.30", 4.5 kg
  Recensioni esterne » Hyperbook GTR, i9-11900K RTX 3080

Razer Blade Pro 17 2021 (QHD Touch): Intel Core i7-10875H, 17.30", 3 kg
  Recensioni esterne » Razer Blade Pro 17 2021 Touch 4K, i7-10875H RTX 3080

Alienware m15 R4 RTX 3080: Intel Core i9-10980HK, 15.60", 2.4 kg
  Recensioni esterne » Alienware m15 R4 RTX 3080

Asus ROG Strix Scar 15 G533QS: AMD Ryzen 9 5900HX, 15.60", 2.3 kg
  Recensioni esterne » Asus ROG Strix Scar 15 G533QS

MSI GE76 Raider 11UH-082: Intel Core i9-11980HK, 17.30", 2.9 kg
  Recensioni esterne » MSI GE76 Raider 11UH-082

Asus Strix Scar 17 G733QSA-XS99: AMD Ryzen 9 5900HX, 17.30", 2.8 kg
  Recensioni esterne » Asus Strix Scar 17 G733QSA-XS99

Alienware x17 R1, i9-11900HK RTX 3080 FHD: Intel Core i9-11900K, 17.30", 3 kg
  Recensioni esterne » Alienware x17 R1, i9-11900HK RTX 3080 FHD

Aorus 15P YD: Intel Core i7-11800H, 15.60", 2.2 kg
  Recensioni esterne » Aorus 15P YD

Acer Predator Helios 500, i9-11980HK RTX 3080: Intel Core i9-11980HK, 17.30", 3.9 kg
  Recensioni esterne » Acer Predator Helios 500, i9-11980HK RTX 3080

Asus ROG Zephyrus S17 GX703HSD: Intel Core i9-11900H, 17.30", 2.8 kg
  Recensioni esterne » Asus ROG Zephyrus S17 GX703HSD

Razer Blade 14 Ryzen 9 RTX 3080: AMD Ryzen 9 5900HX, 14.00", 1.8 kg
  Recensioni esterne » Razer Blade 14 Ryzen 9 RTX 3080

Lenovo Legion 7 16ACHg6: AMD Ryzen 9 5900HX, 16.00", 2.5 kg
  Recensioni esterne » Lenovo Legion 7 16ACHg6

Razer Blade 15 Advanced Edition 2021 QHD, i7-10875H RTX 3080: Intel Core i7-10875H, 15.60", 2.2 kg
  Recensioni esterne » Razer Blade 15 Advanced Edition 2021 QHD, i7-10875H RTX 3080

Origin PC EON17-X 2021: Intel Core i9-11900K, 17.30", 3.8 kg
  Recensioni esterne » Origin PC EON17-X 2021

Aorus 17G YD: Intel Core i7-11800H, 17.30", 2.8 kg
  Recensioni esterne » Aorus 17G YD

Asus ROG Strix Scar 17 G733QS-K4016T: AMD Ryzen 9 5900HX, 17.30", 2.7 kg
  Recensioni esterne » Asus ROG Strix Scar 17 G733QS-K4016T

Asus ROG Strix Scar 17 G733QS-HG015T: AMD Ryzen 9 5900HX, 17.30", 2.7 kg
  Recensioni esterne » Asus ROG Strix Scar 17 G733QS-HG015T

Razer Blade 15 Advanced Edition 2021 FHD, i7-10875H RTX 3080: Intel Core i7-10875H, 15.60", 2.2 kg
  Recensioni esterne » Razer Blade 15 Advanced Edition 2021 FHD, i7-10875H RTX 3080

Asus Strix Scar 15 G533QS-DS76: AMD Ryzen 7 5800H, 15.60", 2.3 kg
  Recensioni esterne » Asus Strix Scar 15 G533QS-DS76

Asus Strix Scar 17 G733QS-HG026T: AMD Ryzen 9 5900HX, 17.30", 3 kg
  Recensioni esterne » Asus Strix Scar 17 G733QS-HG026T

MSI Creator 15 A10UH-427RU: Intel Core i7-10870H, 15.60", 2.1 kg
  Recensioni esterne » MSI Creator 15 A10UH-427RU

MSI GE76 Raider 10UH-061ES: Intel Core i7-10870H, 17.30", 2.9 kg
  Recensioni esterne » MSI GE76 Raider 10UH-061ES

Asus Strix Scar 17 G733QS-HG168T: AMD Ryzen 9 5900HX, 17.30", 2.7 kg
  Recensioni esterne » Asus Strix Scar 17 G733QS-HG168T

MSI GE76 Raider 10UH-200NL: Intel Core i9-10980HK, 17.30", 2.9 kg
  Recensioni esterne » MSI GE76 Raider 10UH-200NL

Alienware m17 R4: Intel Core i9-10980HK, 17.30", 3 kg
  Recensioni esterne » Alienware m17 R4

MSI GE66 Raider 10UH-062: Intel Core i7-10870H, 15.60", 2.4 kg
  Recensioni esterne » MSI GE66 Raider 10UH-062

MSI GE66 Raider 10UH: Intel Core i9-10980HK, 15.60", 2.4 kg
  Recensioni esterne » MSI GE66 Raider 10UH

Acer Nitro 5 AN515-45-R36S: AMD Ryzen 7 5800H, 15.60", 2.3 kg
  Recensioni esterne » Acer Nitro 5 AN515-45-R36S

MSI GS66 Stealth 10UH-010UK: Intel Core i7-10870H, 15.60", 2.1 kg
  Recensioni esterne » MSI GS66 Stealth 10UH-010UK

MSI GE76 Dragon Tiamat 10UH: Intel Core i9-10980HK, 17.30", 2.9 kg
  Recensioni esterne » MSI GE76 Dragon Tiamat 10UH

Lenovo Legion Slim 7 16ACHg6, 5900HX RTX 3080: AMD Ryzen 9 5900HX, 16.00", 2.5 kg
  Recensioni esterne » Lenovo Legion Slim 7 16ACHg6, 5900HX RTX 3080

MSI GE76 Raider 10UH-240IT: Intel Core i7-10870H, 17.30", 2.9 kg
  Recensioni esterne » MSI GE76 Raider 10UH-240IT

Gigabyte Aero 15 OLED YC: Intel Core i9-10980HK, 15.60", 2 kg
  Recensioni esterne » Gigabyte Aero 15 OLED YC

Aorus 17G YC: Intel Core i7-10870H, 17.30", 2.7 kg
  Recensioni esterne » Aorus 17G YC

Asus ROG Strix Scar 15 G533QS-HF192T: AMD Ryzen 9 5900HX, 15.60", 2.3 kg
  Recensioni esterne » Asus Strix Scar 15 G533QS

Asus Strix Scar 17 G733QS: AMD Ryzen 9 5900HX, 17.30", 2.7 kg
  Recensioni esterne » Asus Strix Scar 17 G733QS

Gigabyte Aero 17 HDR YC: Intel Core i9-10980HK, 17.30", 2.8 kg
  Recensioni esterne » Gigabyte Aero 17 HDR YC

Asus ROG Zephyrus Duo 15 SE GX551QS: AMD Ryzen 9 5900HX, 15.60", 2.5 kg
  Recensioni esterne » Asus ROG Zephyrus Duo 15 SE GX551QS

Asus ROG Zephyrus G15 GA503Q: AMD Ryzen 9 5900HS, 15.60", 2 kg
  Recensioni esterne » Asus ROG Zephyrus G15 GA503Q

MSI GE76 Raider 10UH: Intel Core i7-10870H, 17.30", 3 kg
  Recensioni esterne » MSI GE76 Raider 10UH

MSI GS66 Stealth 10UH: Intel Core i9-10980HK, 15.60", 2.1 kg
  Recensioni esterne » MSI GS66 Stealth 10UH

Asus ROG Zephyrus G15 GA503QS: AMD Ryzen 9 5900HS, 15.60", 1.9 kg
  Recensioni esterne » Asus Zephyrus G15 GA503QS

Alienware x17 RTX 3080 P48E: Intel Core i7-11800H, 17.30", 3.2 kg
   » L'aggiornamento Essential BIOS 1.3.0 per i proprietari di Alienware x15 e x17 è ora disponibile per aumentare le prestazioni e abilitare la commutazione grafica ibrida

Maingear Vector Pro MG-VCP17: Intel Core i7-11800H, 17.30", 2.3 kg
   » Maingear Vector Pro è ben 1,5 libbre più leggero del Razer Blade Pro e con prestazioni quasi identiche

Asus ROG Strix Scar 15 G533QS: AMD Ryzen 9 5900HX, 15.60", 2.3 kg
   » Asus ROG Strix Scar 15 G533 viene spedito con un piccolo adattatore AC da 240 W rispetto a quello da 280 W della serie G532

MSI GE76 Raider 10UH: Intel Core i7-10870H, 17.30", 3 kg
   » Amiamo assolutamente questo piccolo dettaglio dell'MSI GE76 che è stato silenziosamente migliorato rispetto al GE75

   » Ecco tutti i portatili GeForce RTX 3080 più lenti e più veloci che potete comprare in questo momento

Razer Blade Pro 17 2021 (QHD Touch): Intel Core i7-10875H, 17.30", 3 kg
   » Ecco perché Nvidia TGP è importante: alcuni portatili GeForce RTX 3070 stanno già superando la RTX 3080

Asus ROG Zephyrus G15 GA503Q: AMD Ryzen 9 5900HS, 15.60", 2 kg
   » Bestia sexy: Asus ROG Zephyrus G15

Gigabyte Aero 17 HDR YC: Intel Core i9-10980HK, 17.30", 2.8 kg
   » Gigabyte Aero 17 HDR YC: Grande display per menti creative

Alienware m15 R4 RTX 3080: Intel Core i9-10980HK, 15.60", 2.4 kg
   » Un portatile da gioco ha bisogno di una buona durata della batteria? Dell non la pensa così, a giudicare dall'Alienware m15 R4

Asus Strix Scar 17 G733QSA-XS99: AMD Ryzen 9 5900HX, 17.30", 2.8 kg
   » Nessun altro produttore sta abbracciando AMD Ryzen mobile così velocemente o duramente come Asus

Please share our article, every link counts!

Classe 1

GeForce RTX 2080 Super Mobile

Classe 2

M1 Max 32-Core GPU *
GeForce RTX 2070 Super Mobile
M1 Max 24-Core GPU *
Radeon RX 5700M *
M1 Pro 16-Core GPU *
Radeon PRO W6600M *
GeForce RTX 2070 Super Max-Q
M1 Pro 14-Core GPU *
Quadro P4200
Quadro P5000 Max-Q *
GeForce RTX 3050 4GB Laptop GPU
Quadro P4000 Max-Q
Radeon RX 580X (Laptop) *
Radeon RX 580 (Laptop)
Arc 130V *
Radeon Pro 5300M
Radeon RX 5300M
Quadro P3000 Max-Q *
Radeon Pro WX 7100 *
Radeon RX 570X (Laptop) *
Radeon RX 570 (Laptop) *
Radeon RX 470 (Laptop) *

Classe 3

GeForce GTX 1050 Ti Mobile
Radeon 680M
Quadro P2000 Max-Q
Radeon R9 M395X
GeForce GTX 1050 Ti Max-Q *
WX Vega M GL
Radeon R9 M485X
GeForce GTX 1050 Max-Q *
Radeon 660M
Radeon RX 560X (Laptop)
Radeon RX 560 (Laptop)
Radeon Pro 560X
Radeon Pro 560
Radeon Pro 460
Radeon Pro WX 4130 *
Quadro P620 *
Radeon RX 550X (Laptop)
Radeon Pro 555X
Radeon Pro 555
Radeon Pro 455
Quadro P600
Radeon RX 540X *
Radeon Pro WX 2100 *
Radeon Pro WX 3100 *
Radeon Pro 450
Radeon 630
Radeon 540X *
Quadro P520
Quadro P500 *
Iris Plus Graphics G7 (Ice Lake 64 EU) *
Vega 10 *
Iris Pro Graphics 580
Vega 9
FirePro W5130M
UHD Graphics Xe G4 48EUs *
UHD Graphics 32EUs
UHD Graphics Xe 32EUs (Tiger Lake-H) *
UHD Graphics 750
UHD Graphics 730
Vega 7
Radeon R7 M465
Vega 8
Iris Plus Graphics G4 (Ice Lake 48 EU)
Quadro M600M
FirePro W4190M
Radeon R7 M445
UHD Graphics 24EUs (Alder Lake-N) *
Radeon R7 M340
Radeon 610M *
UHD Graphics G1 (Ice Lake 32 EU)
UHD Graphics Xe 16EUs (Tiger Lake-H) *
Radeon R5 (Bristol Ridge)
Adreno 690 *
Adreno 685 *
Adreno 680 *

Classe 4

Radeon R5 M315 *
Radeon R5 M420 *
UHD Graphics 617
UHD Graphics 615
Radeon R4 (Stoney Ridge)
Radeon R2 (Stoney Ridge)
HD Graphics (Broadwell)

Classe 5

Posizione approssimativa dell'adattatore grafico

> Recensioni e prove di notebook, tablets e smartphones > Info Techniche / Tips > Confronto delle schede video > NVIDIA > NVIDIA GeForce RTX 3080 Laptop GPU
Klaus Hinum, 2023-12-11 (Update: 2023-12-11)