Recensione del computer portatile Schenker XMG Ultra 17 (Clevo X170KM-G): Massiccia centrale elettrica con un dotazioni lussureggianti

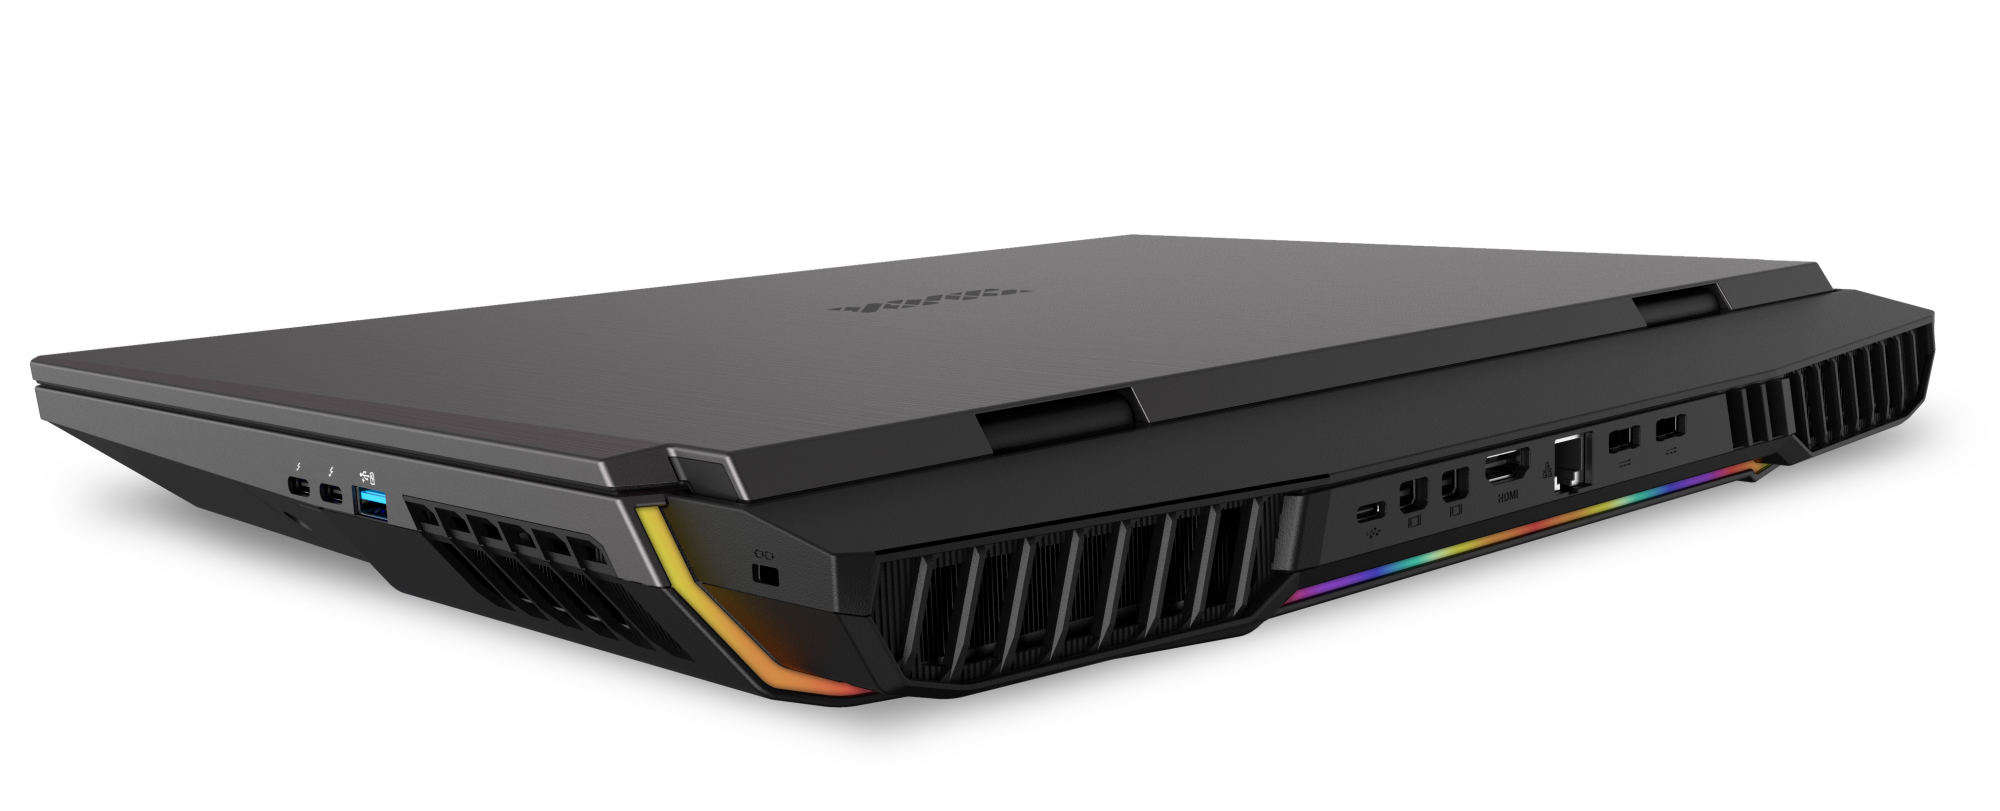
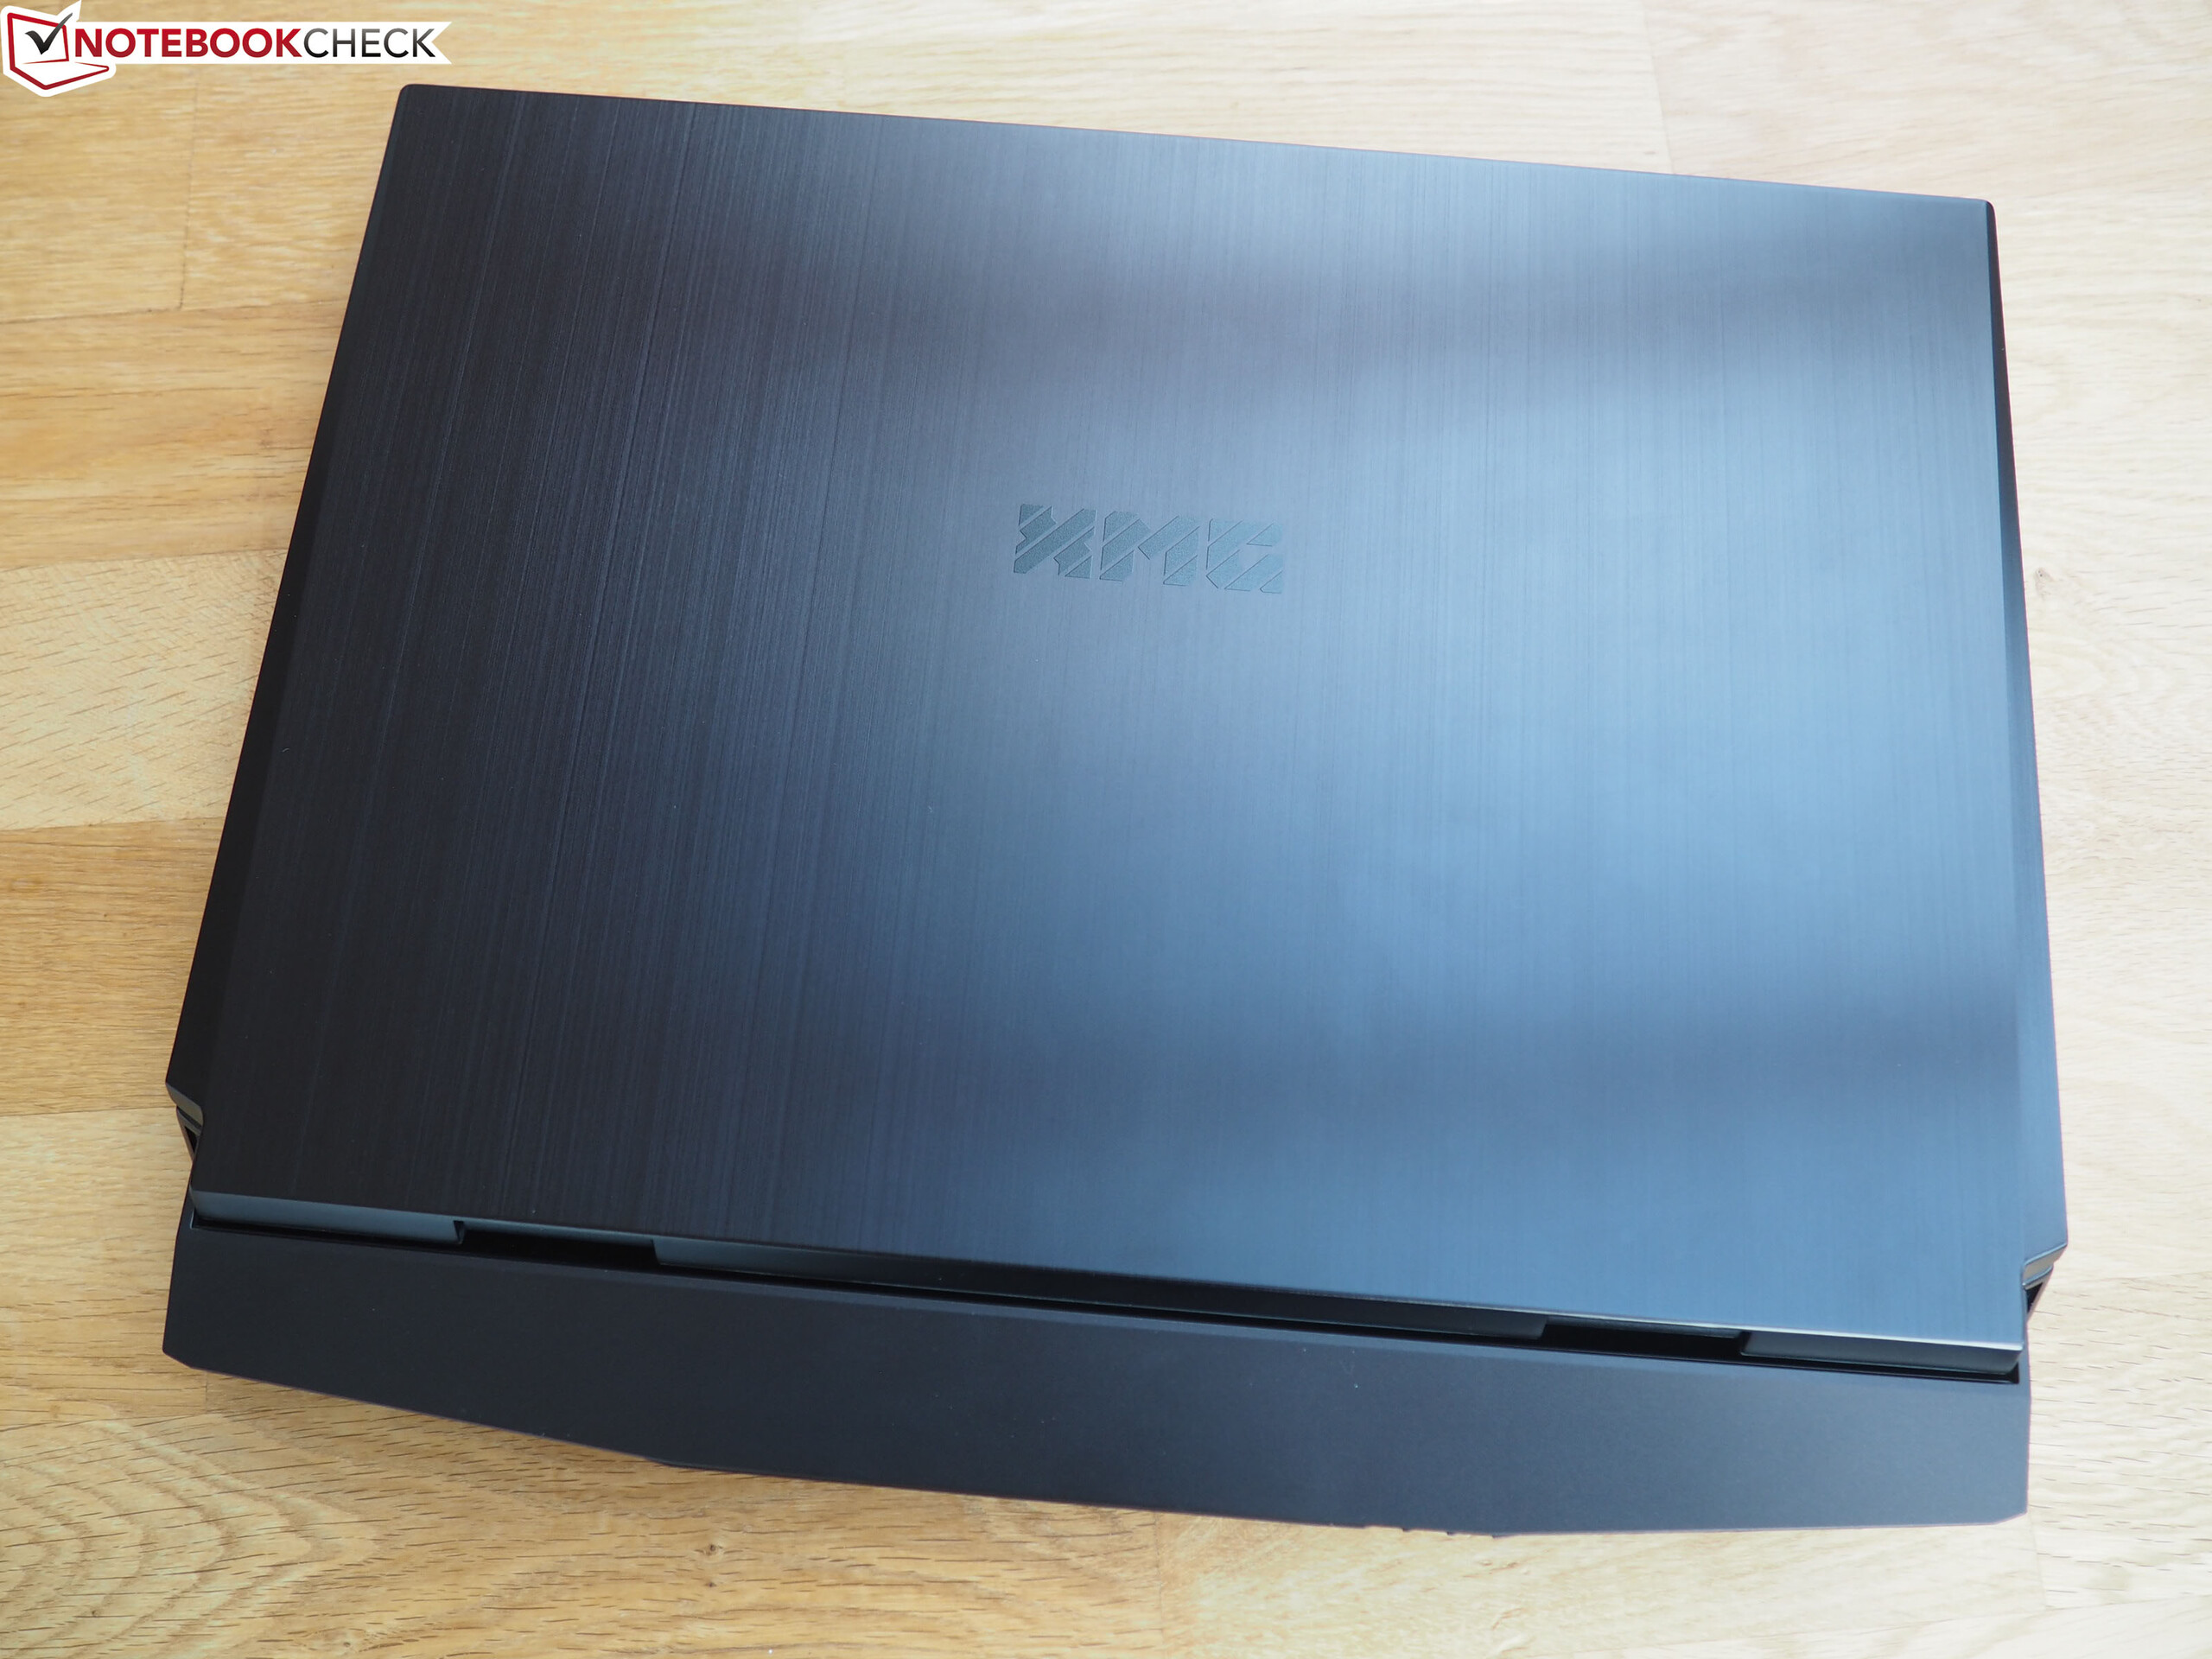
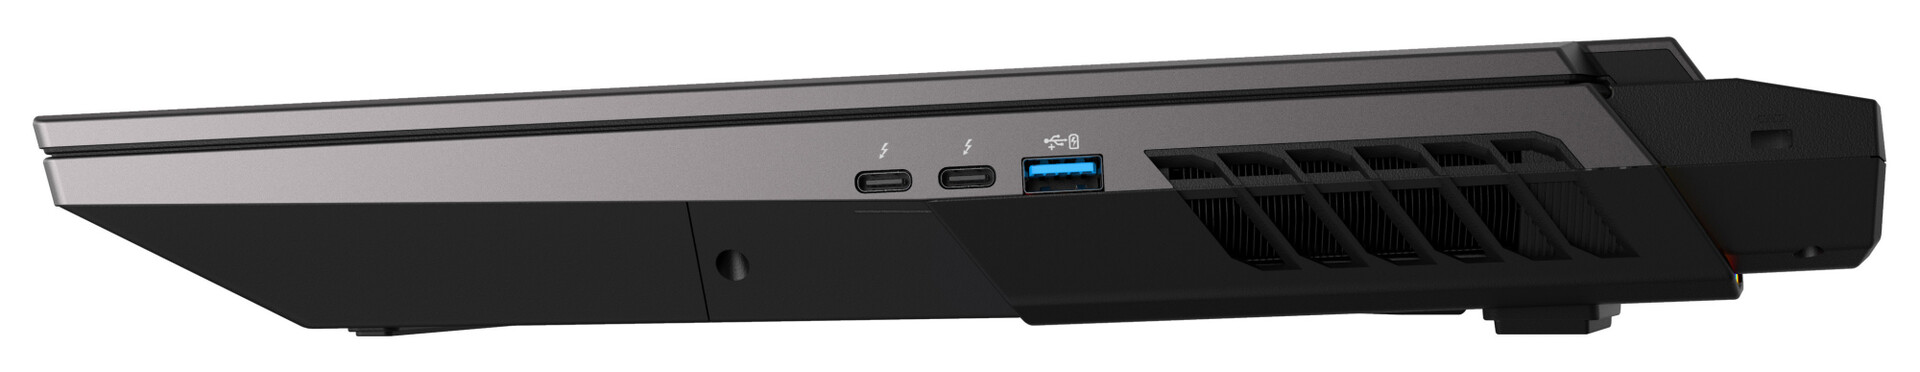
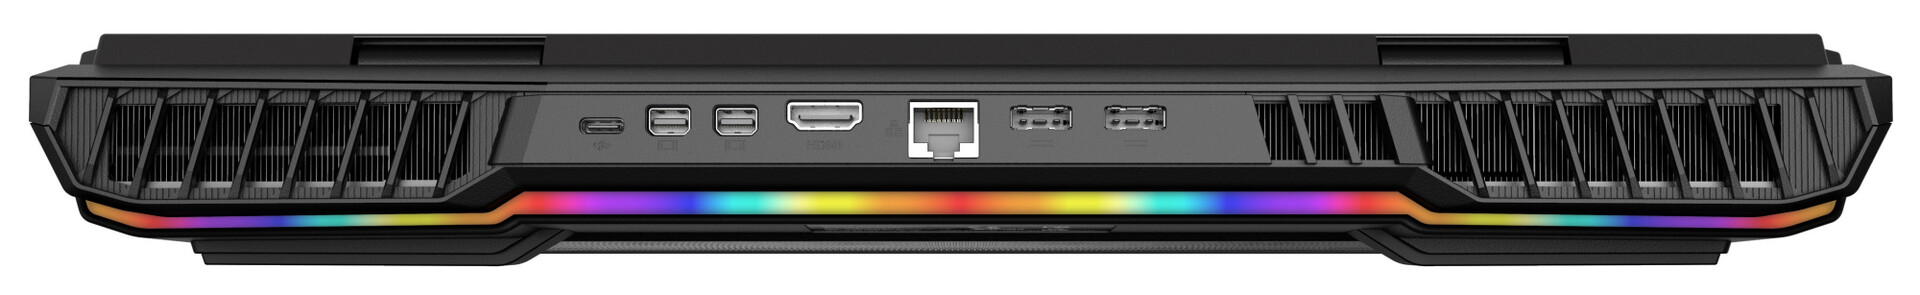
Esteticamente, il modello 2021 dell'XMG Ultra 17 non è cambiato rispetto al suo Predecessore. Le innovazioni riguardano sul lato tecnico. I processori Rocket Lake (le CPU Comet Lake sono ancora disponibili) e le GPU Ampere sono ora utilizzate. Invece di uno slot Thunderbolt 3, vengono utilizzati due slot Thunderbolt 4/USB 4. I concorrenti includono dispositivi come l'MSI GT76 Titanium DT 10SGS, l'Alienware m17 R4 e l'Asus Strix Scar 17 G732LXS.
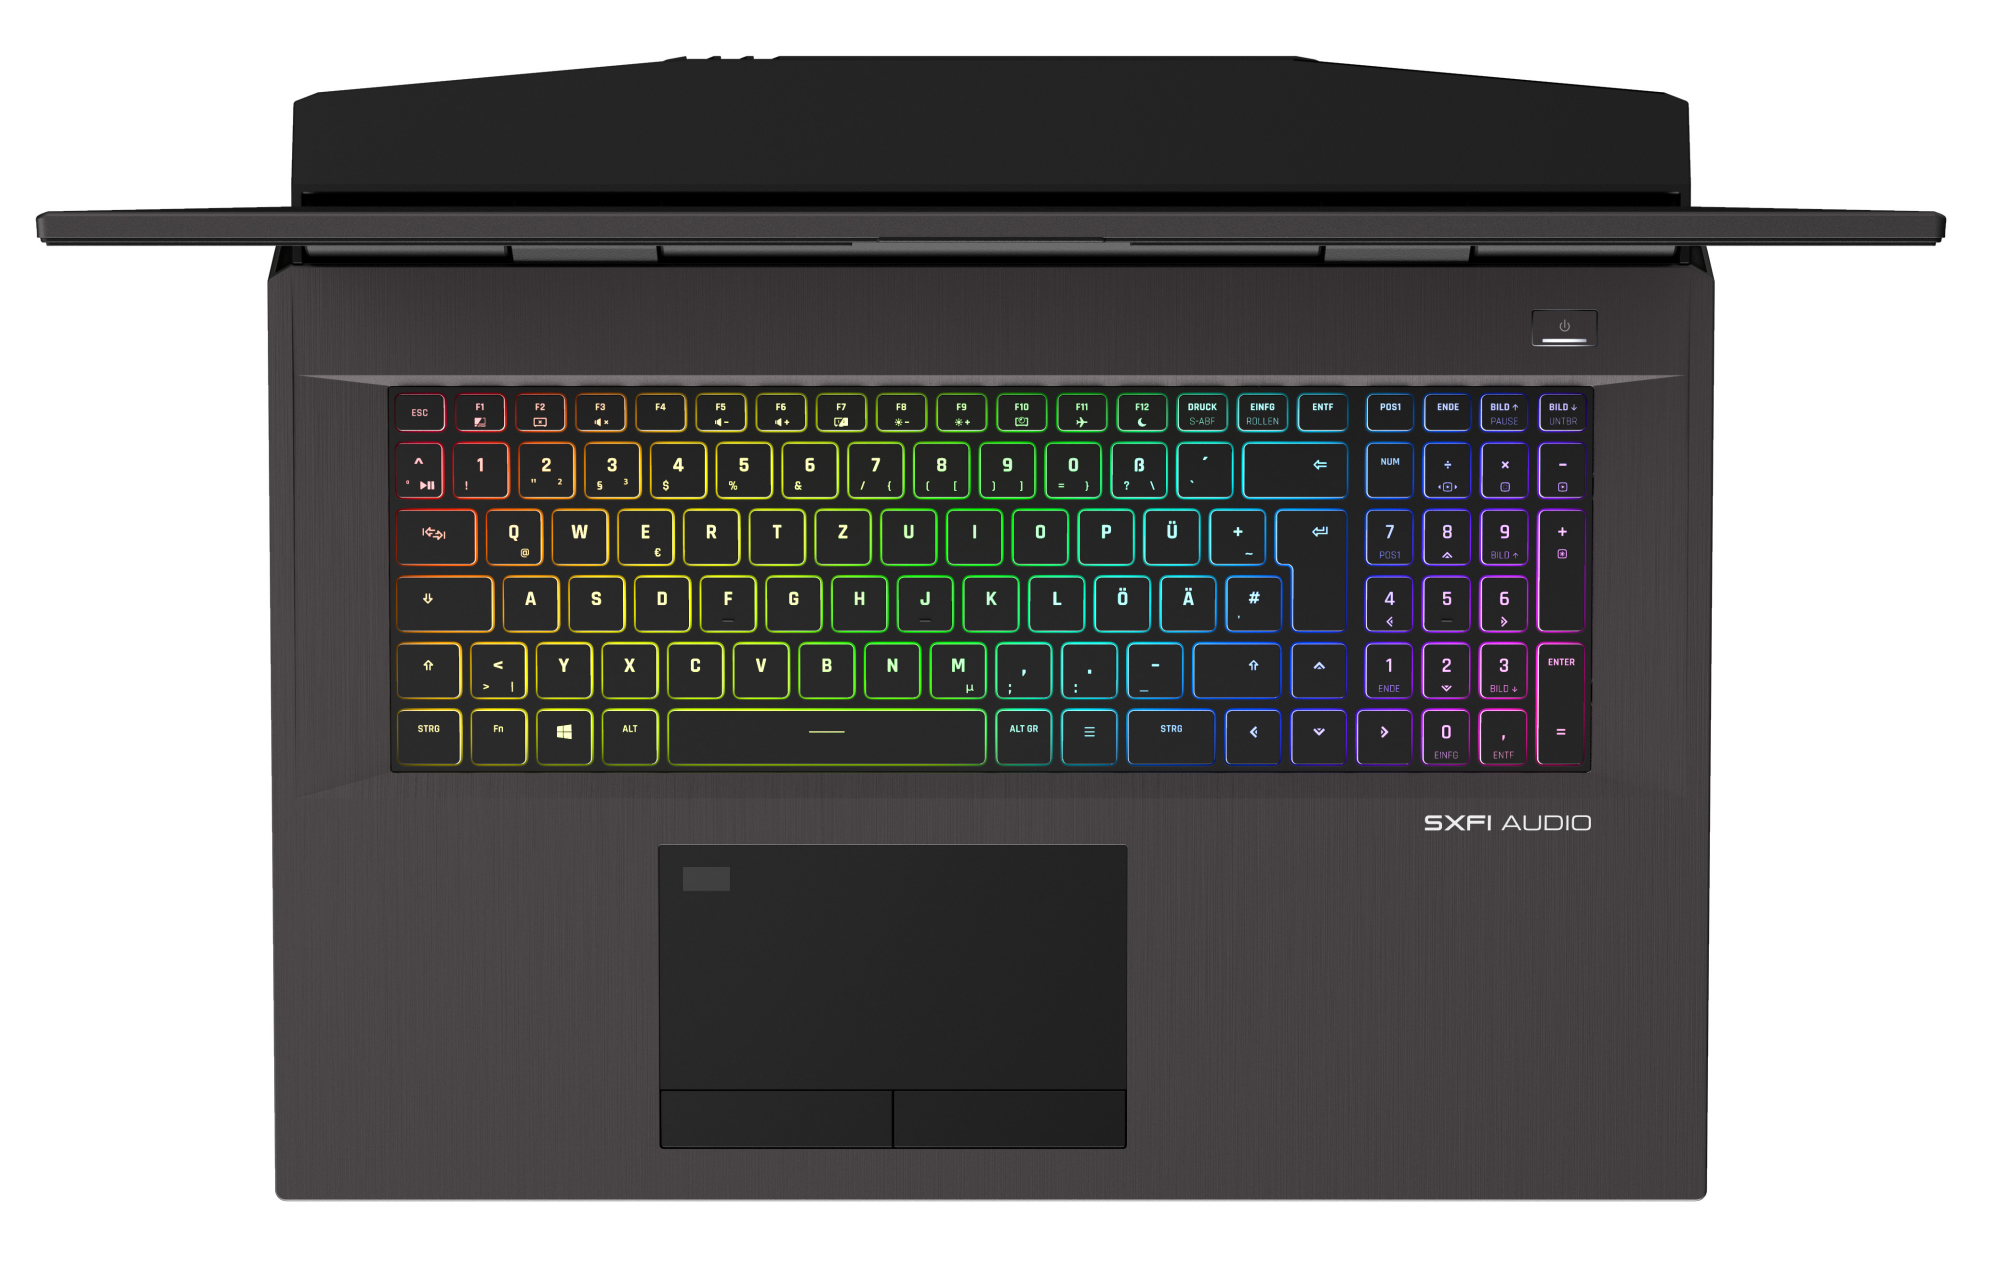
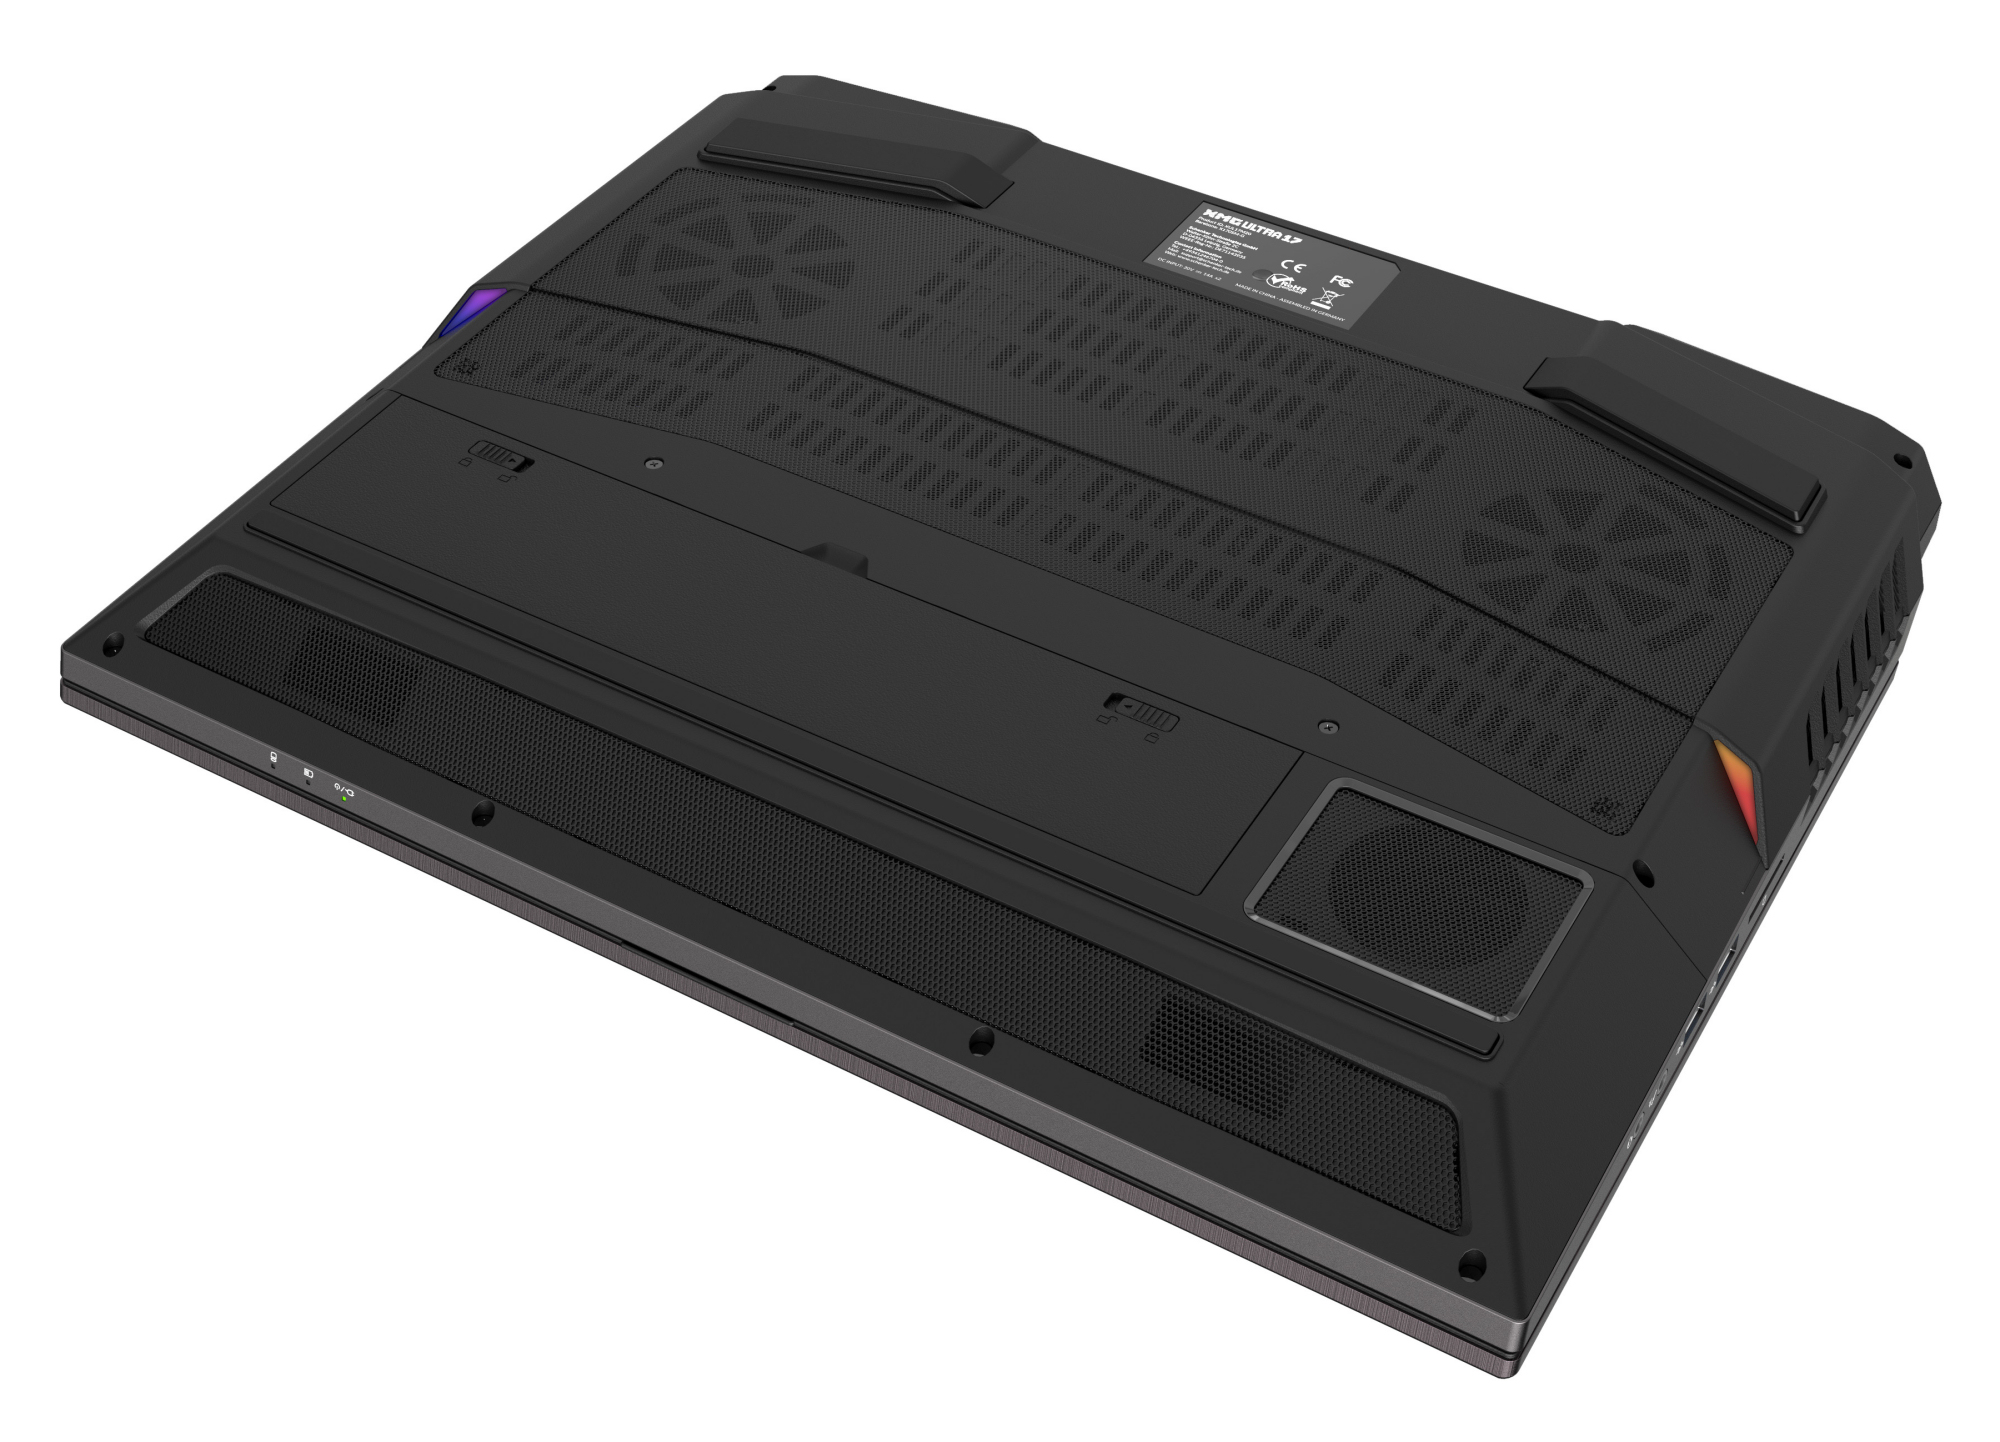
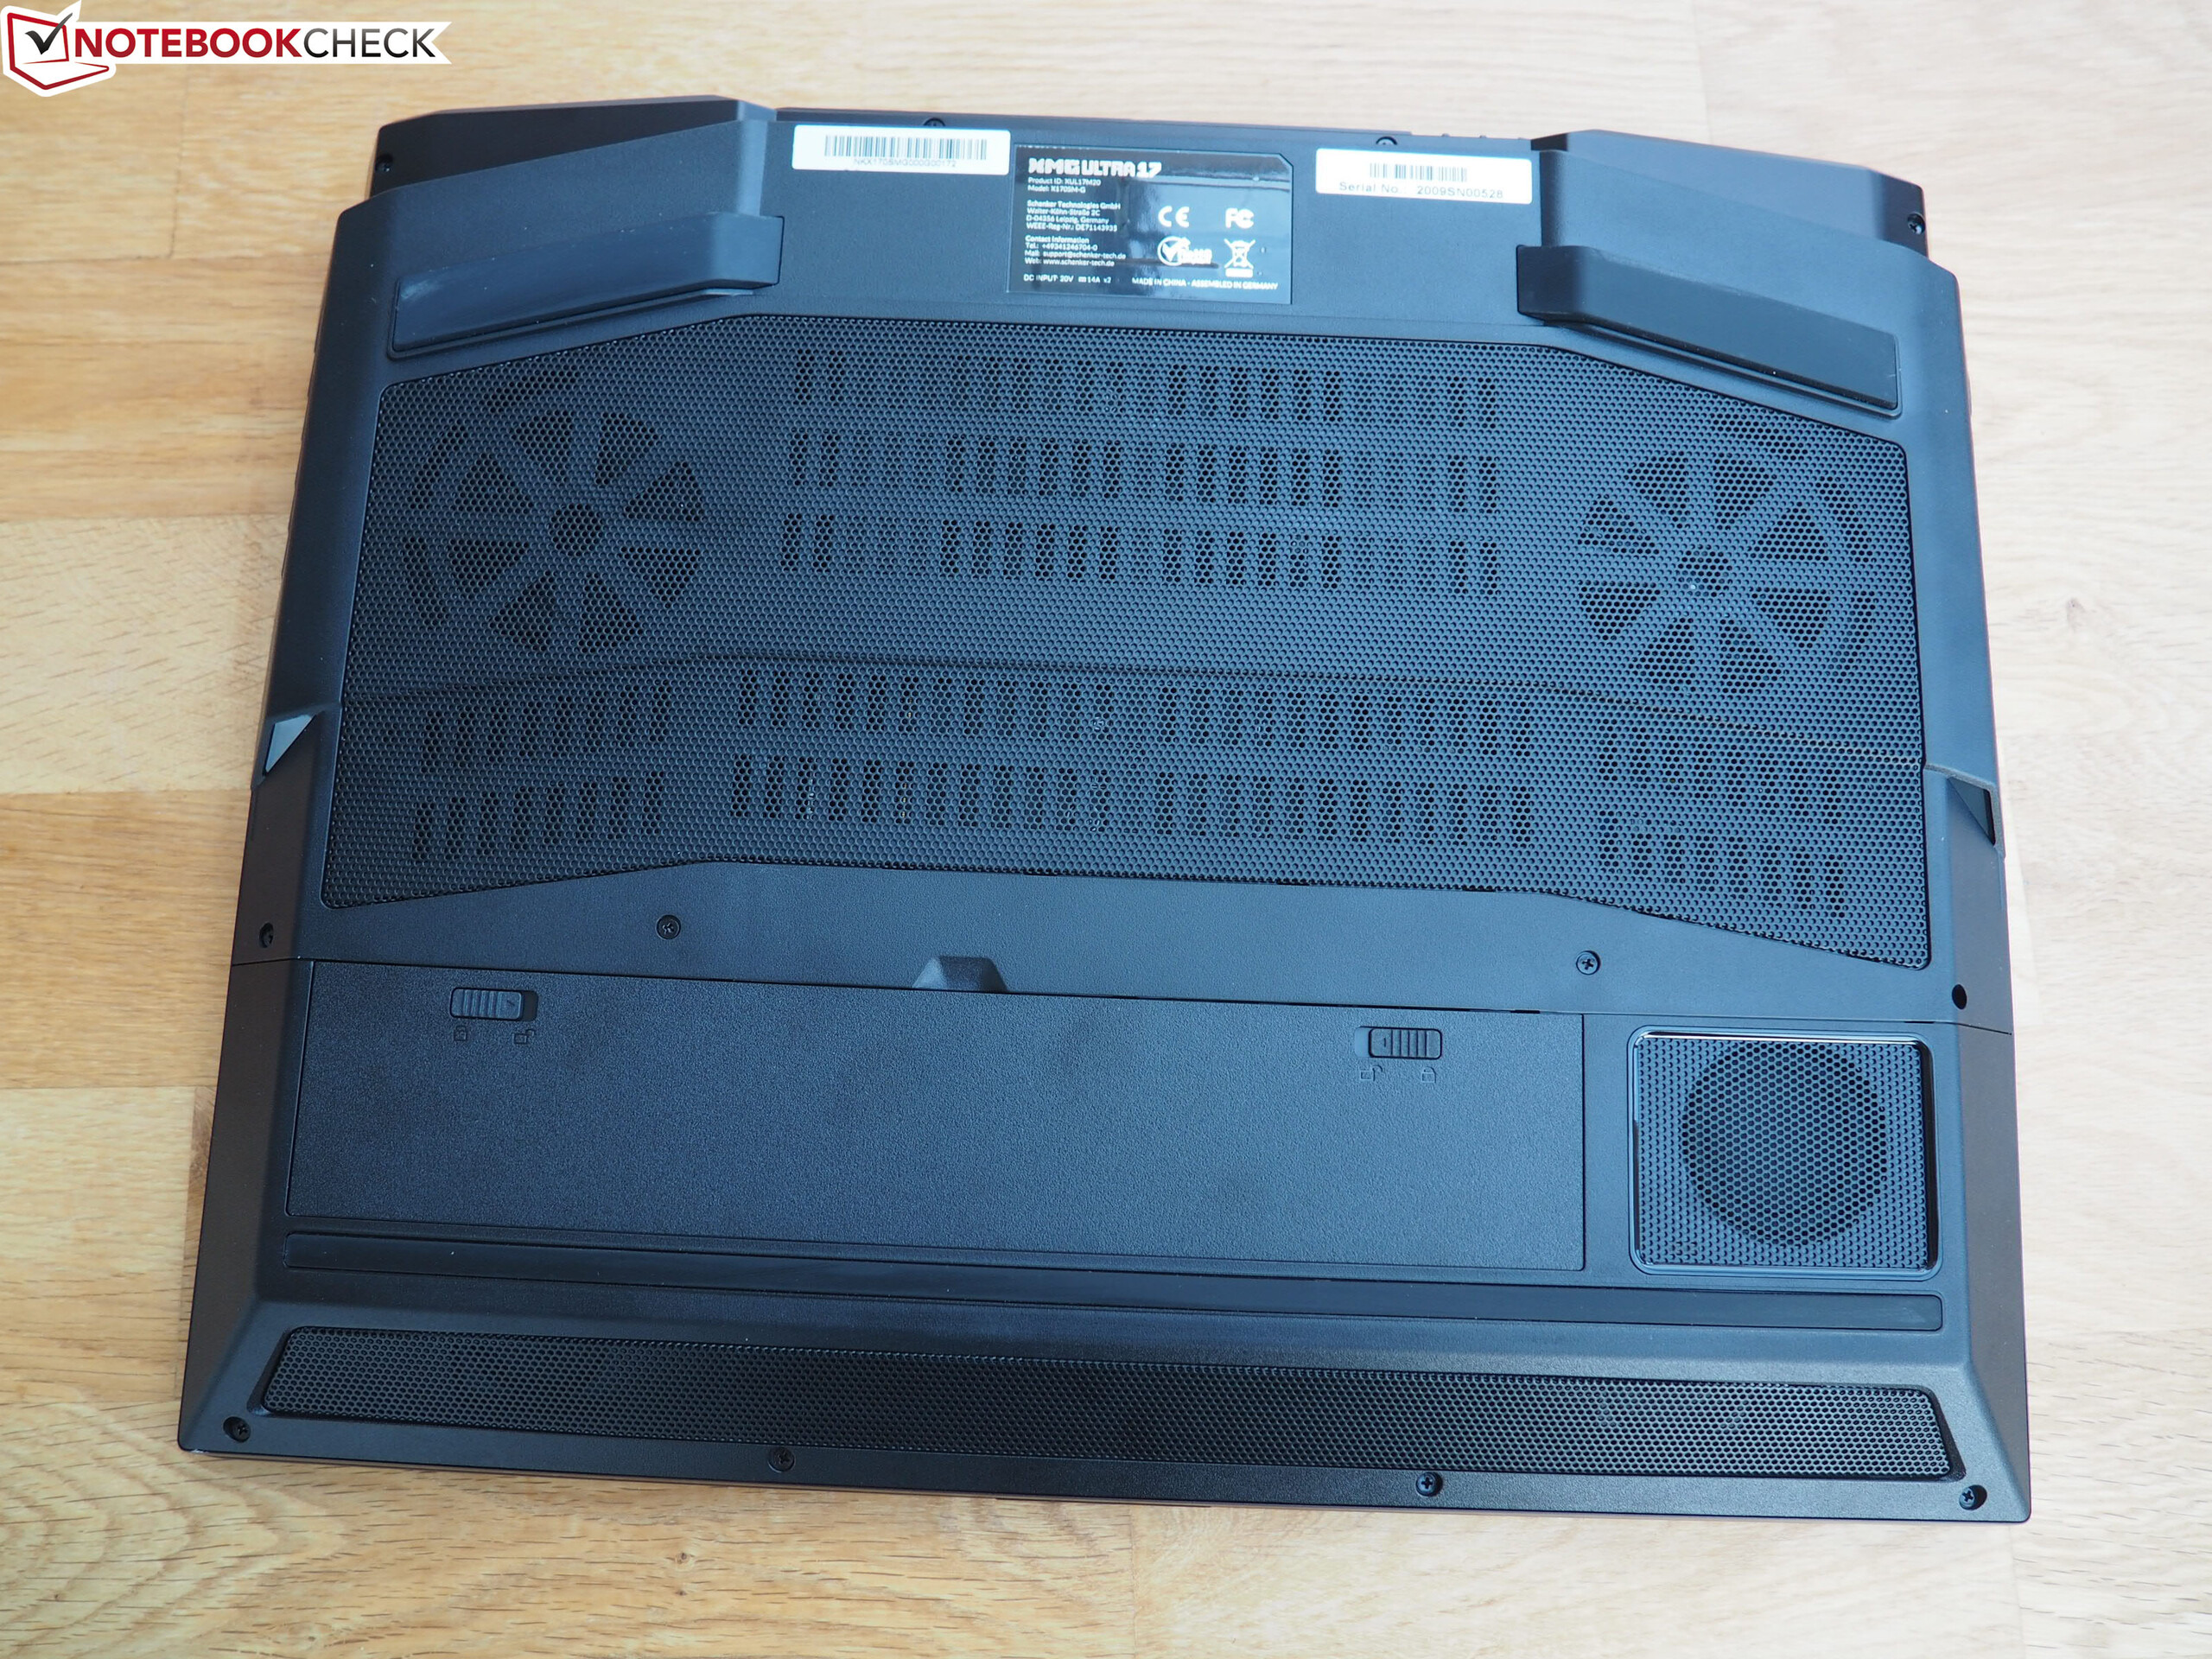
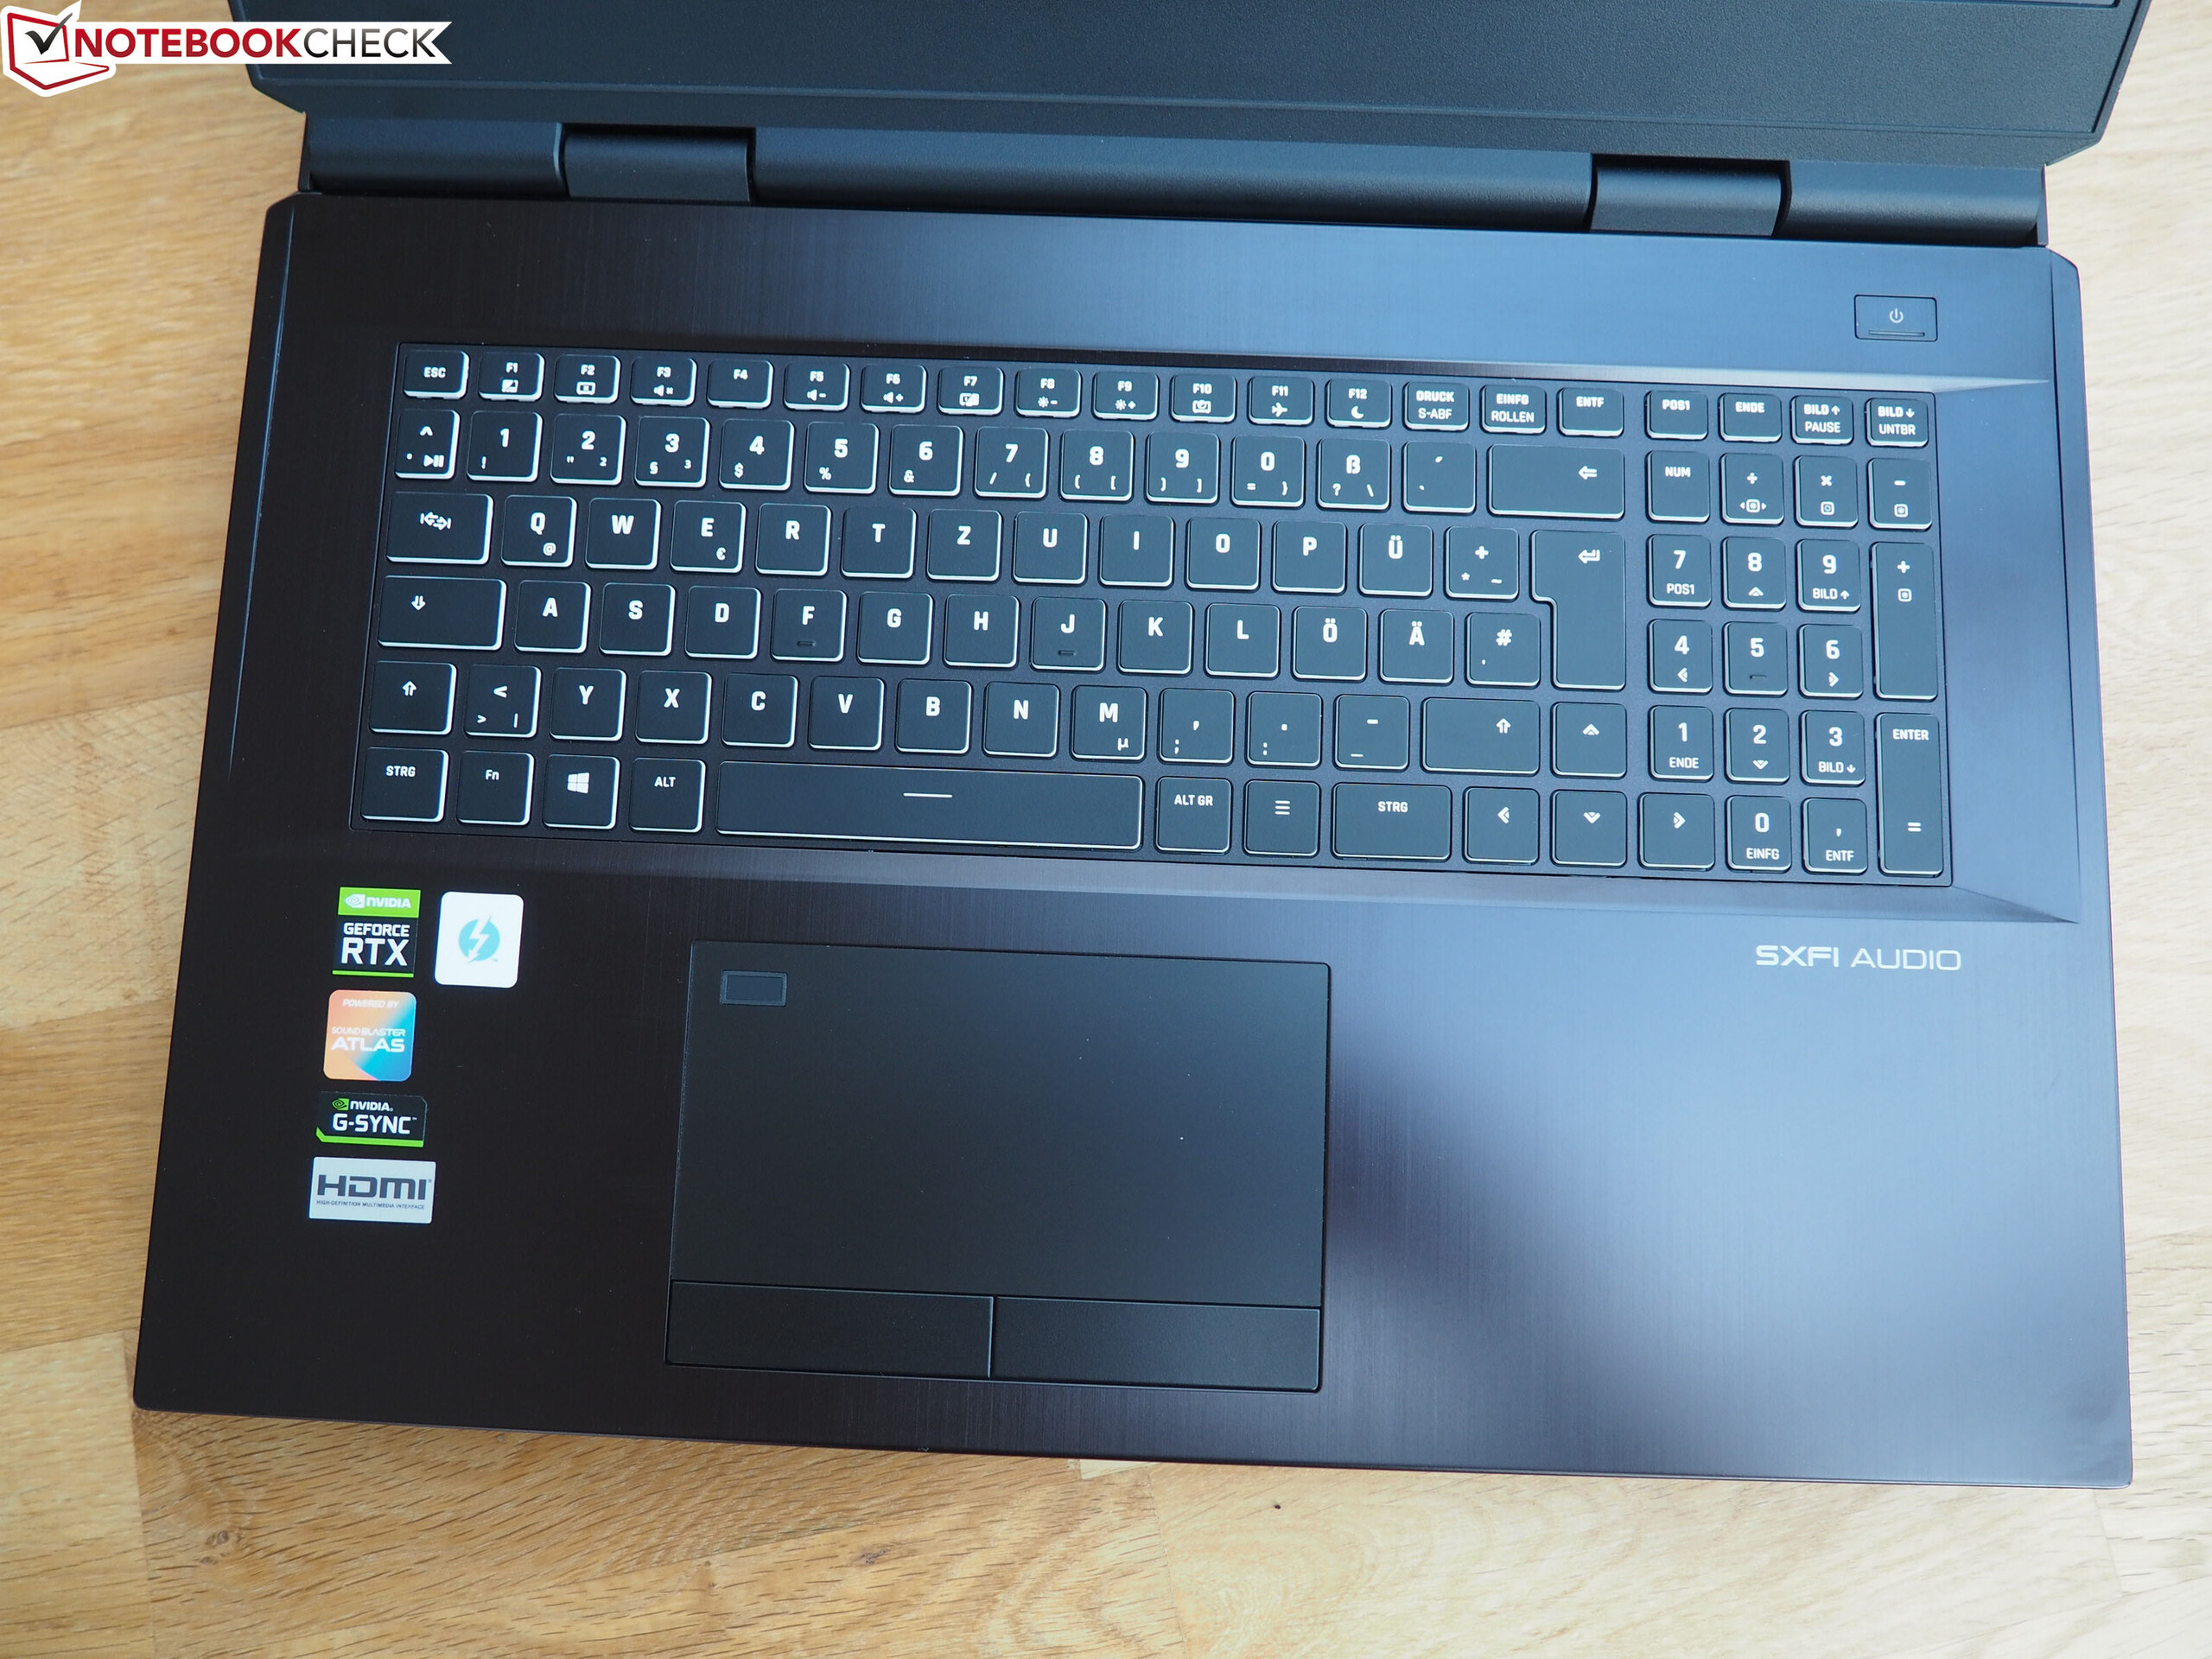
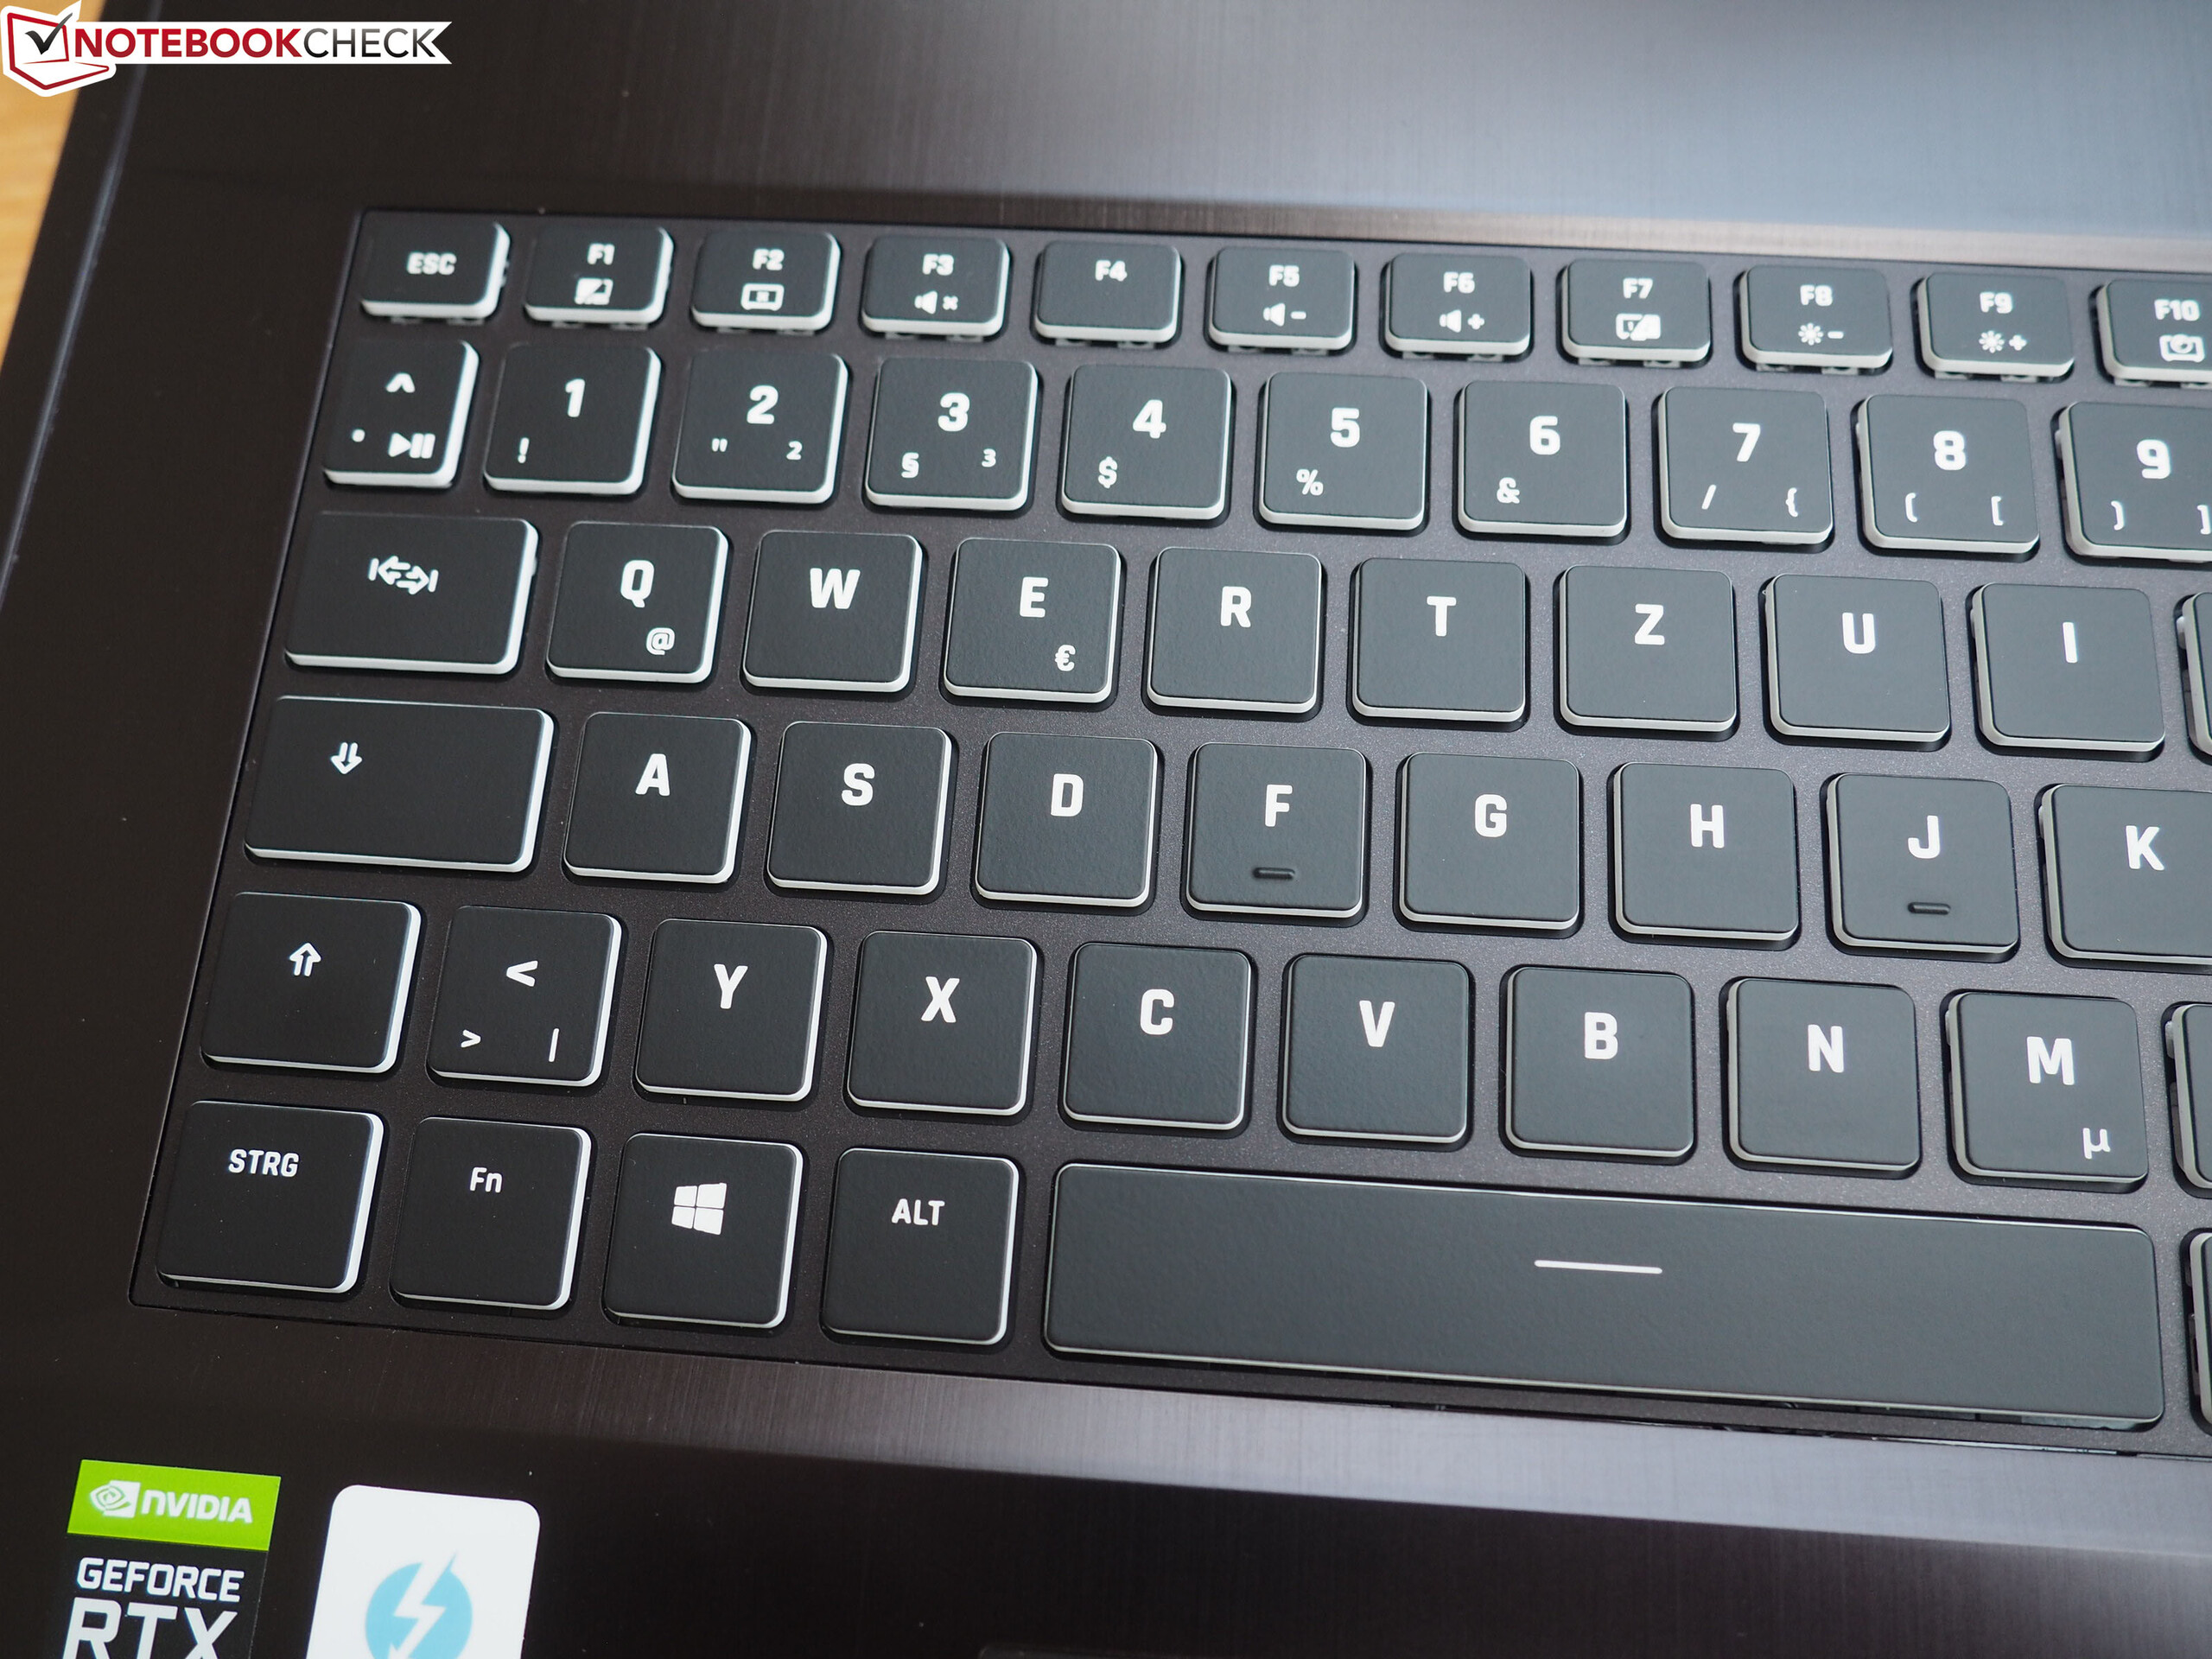
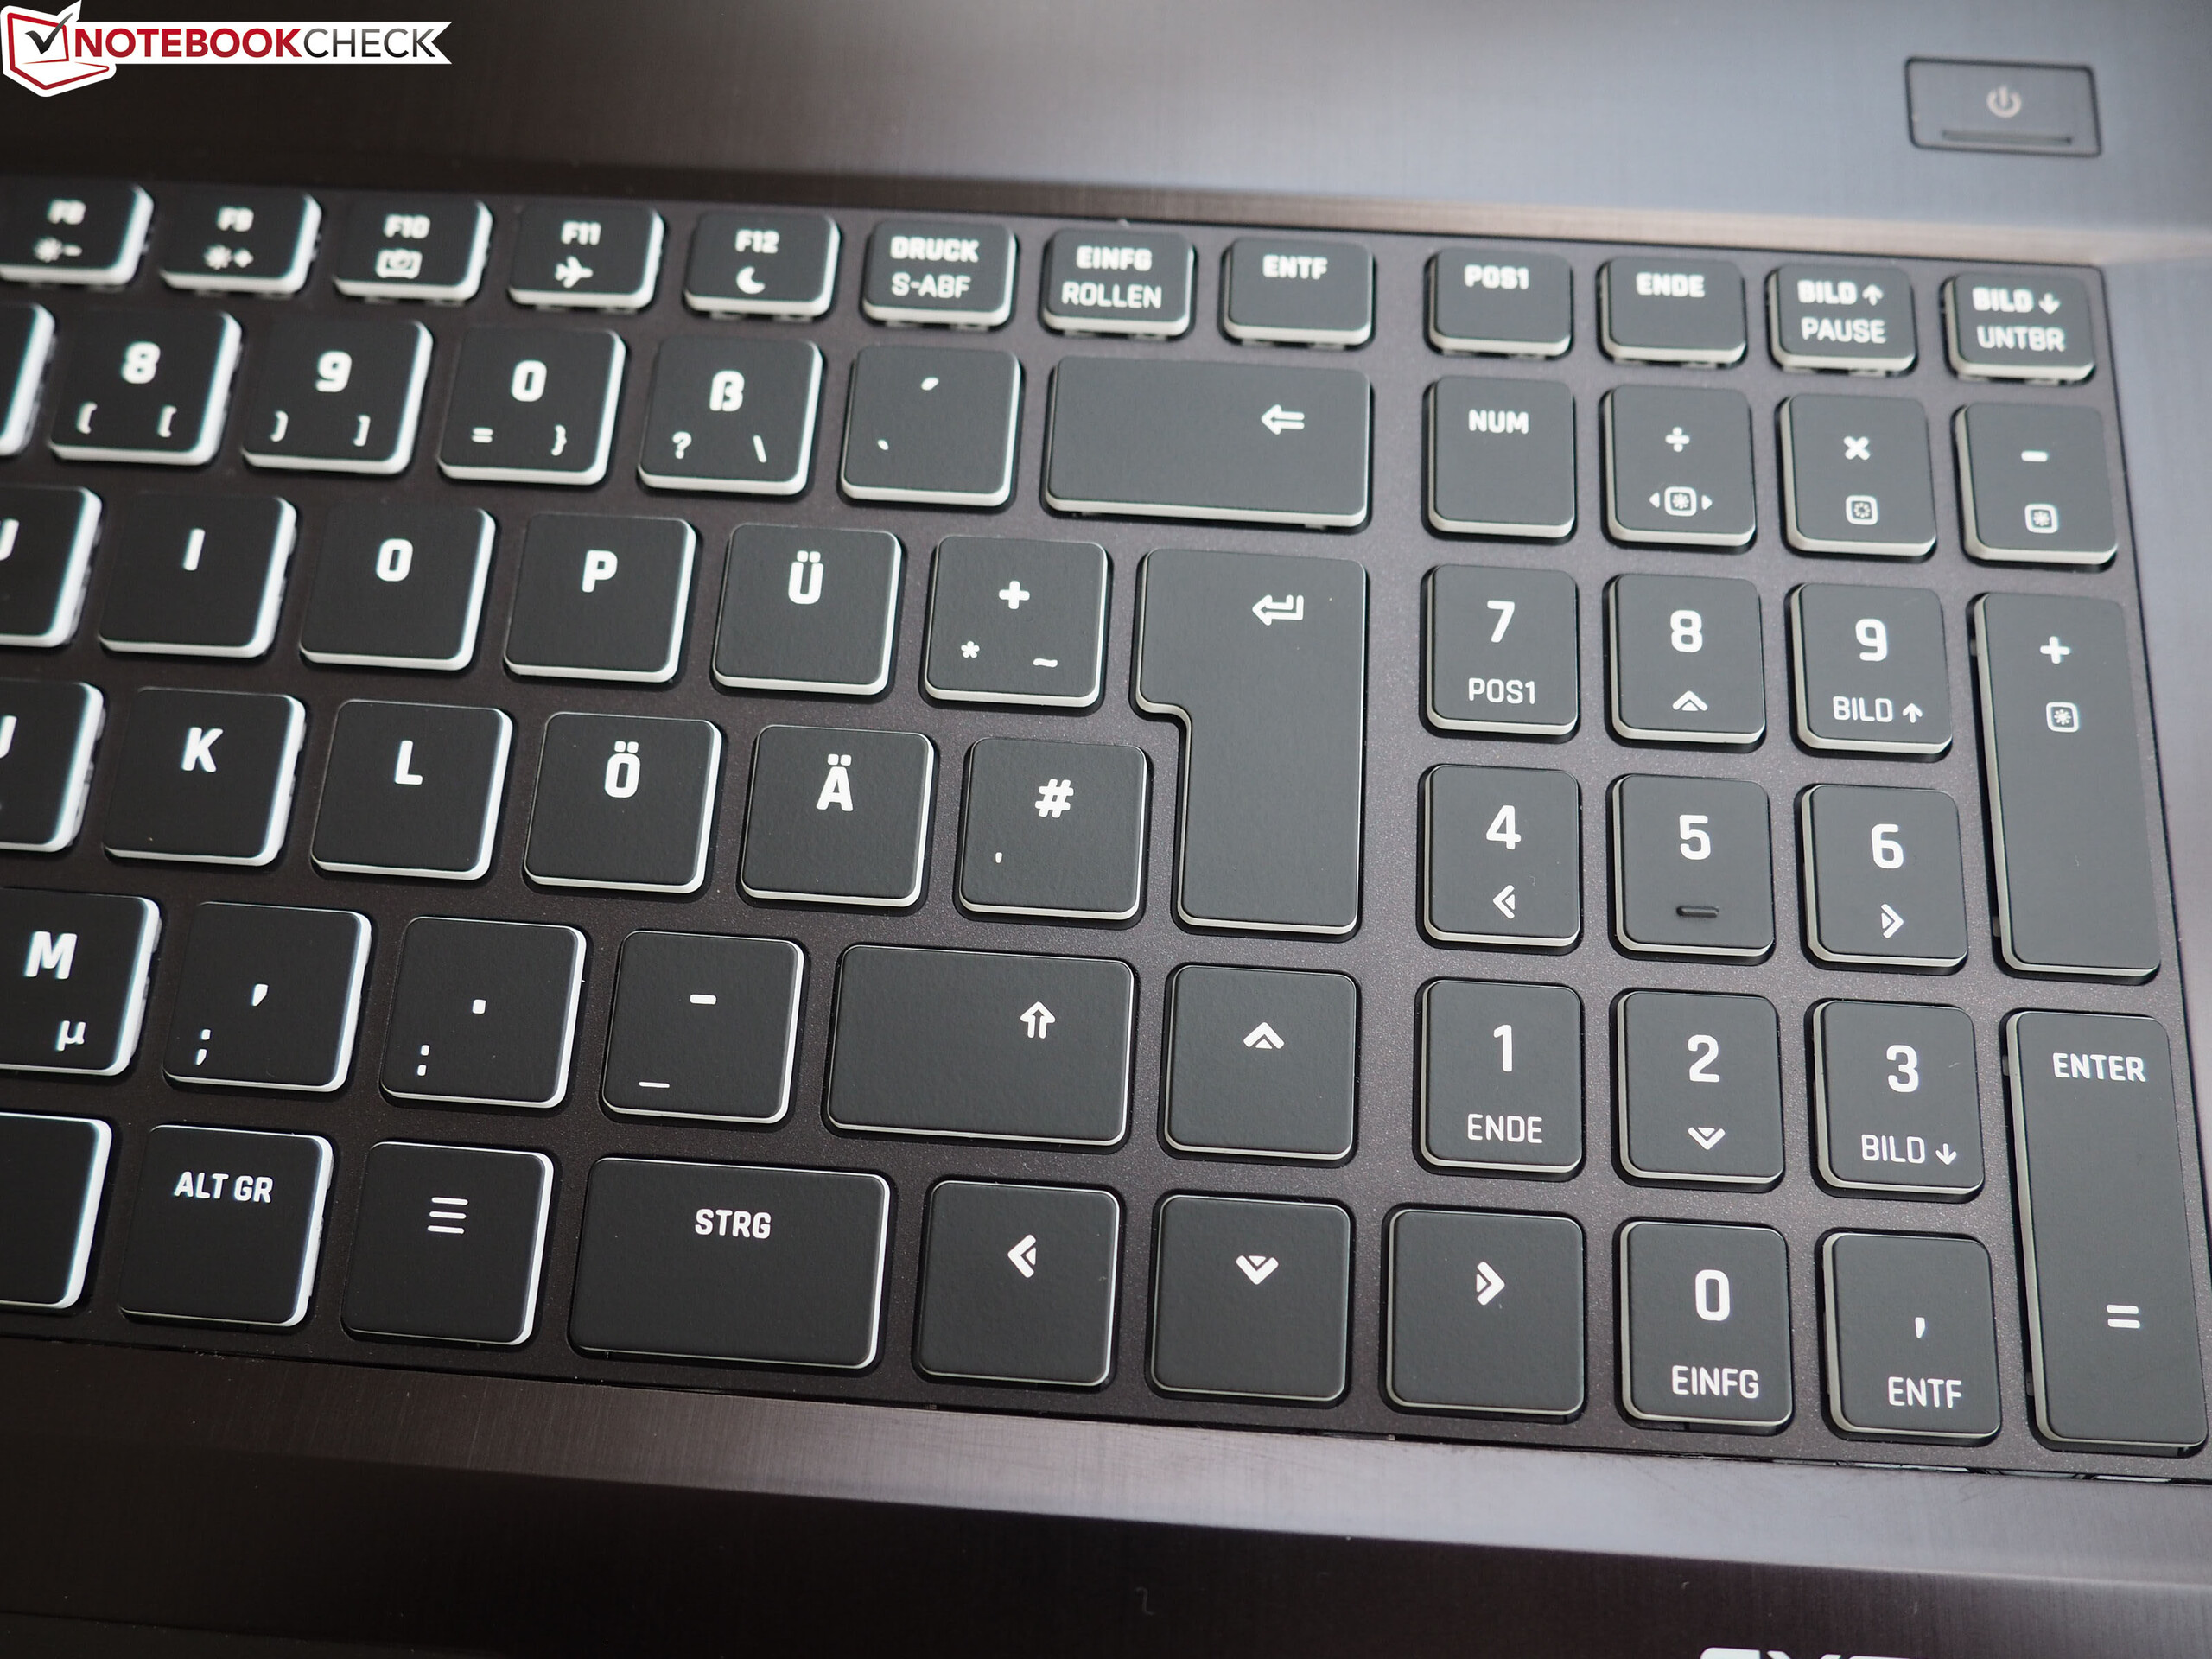
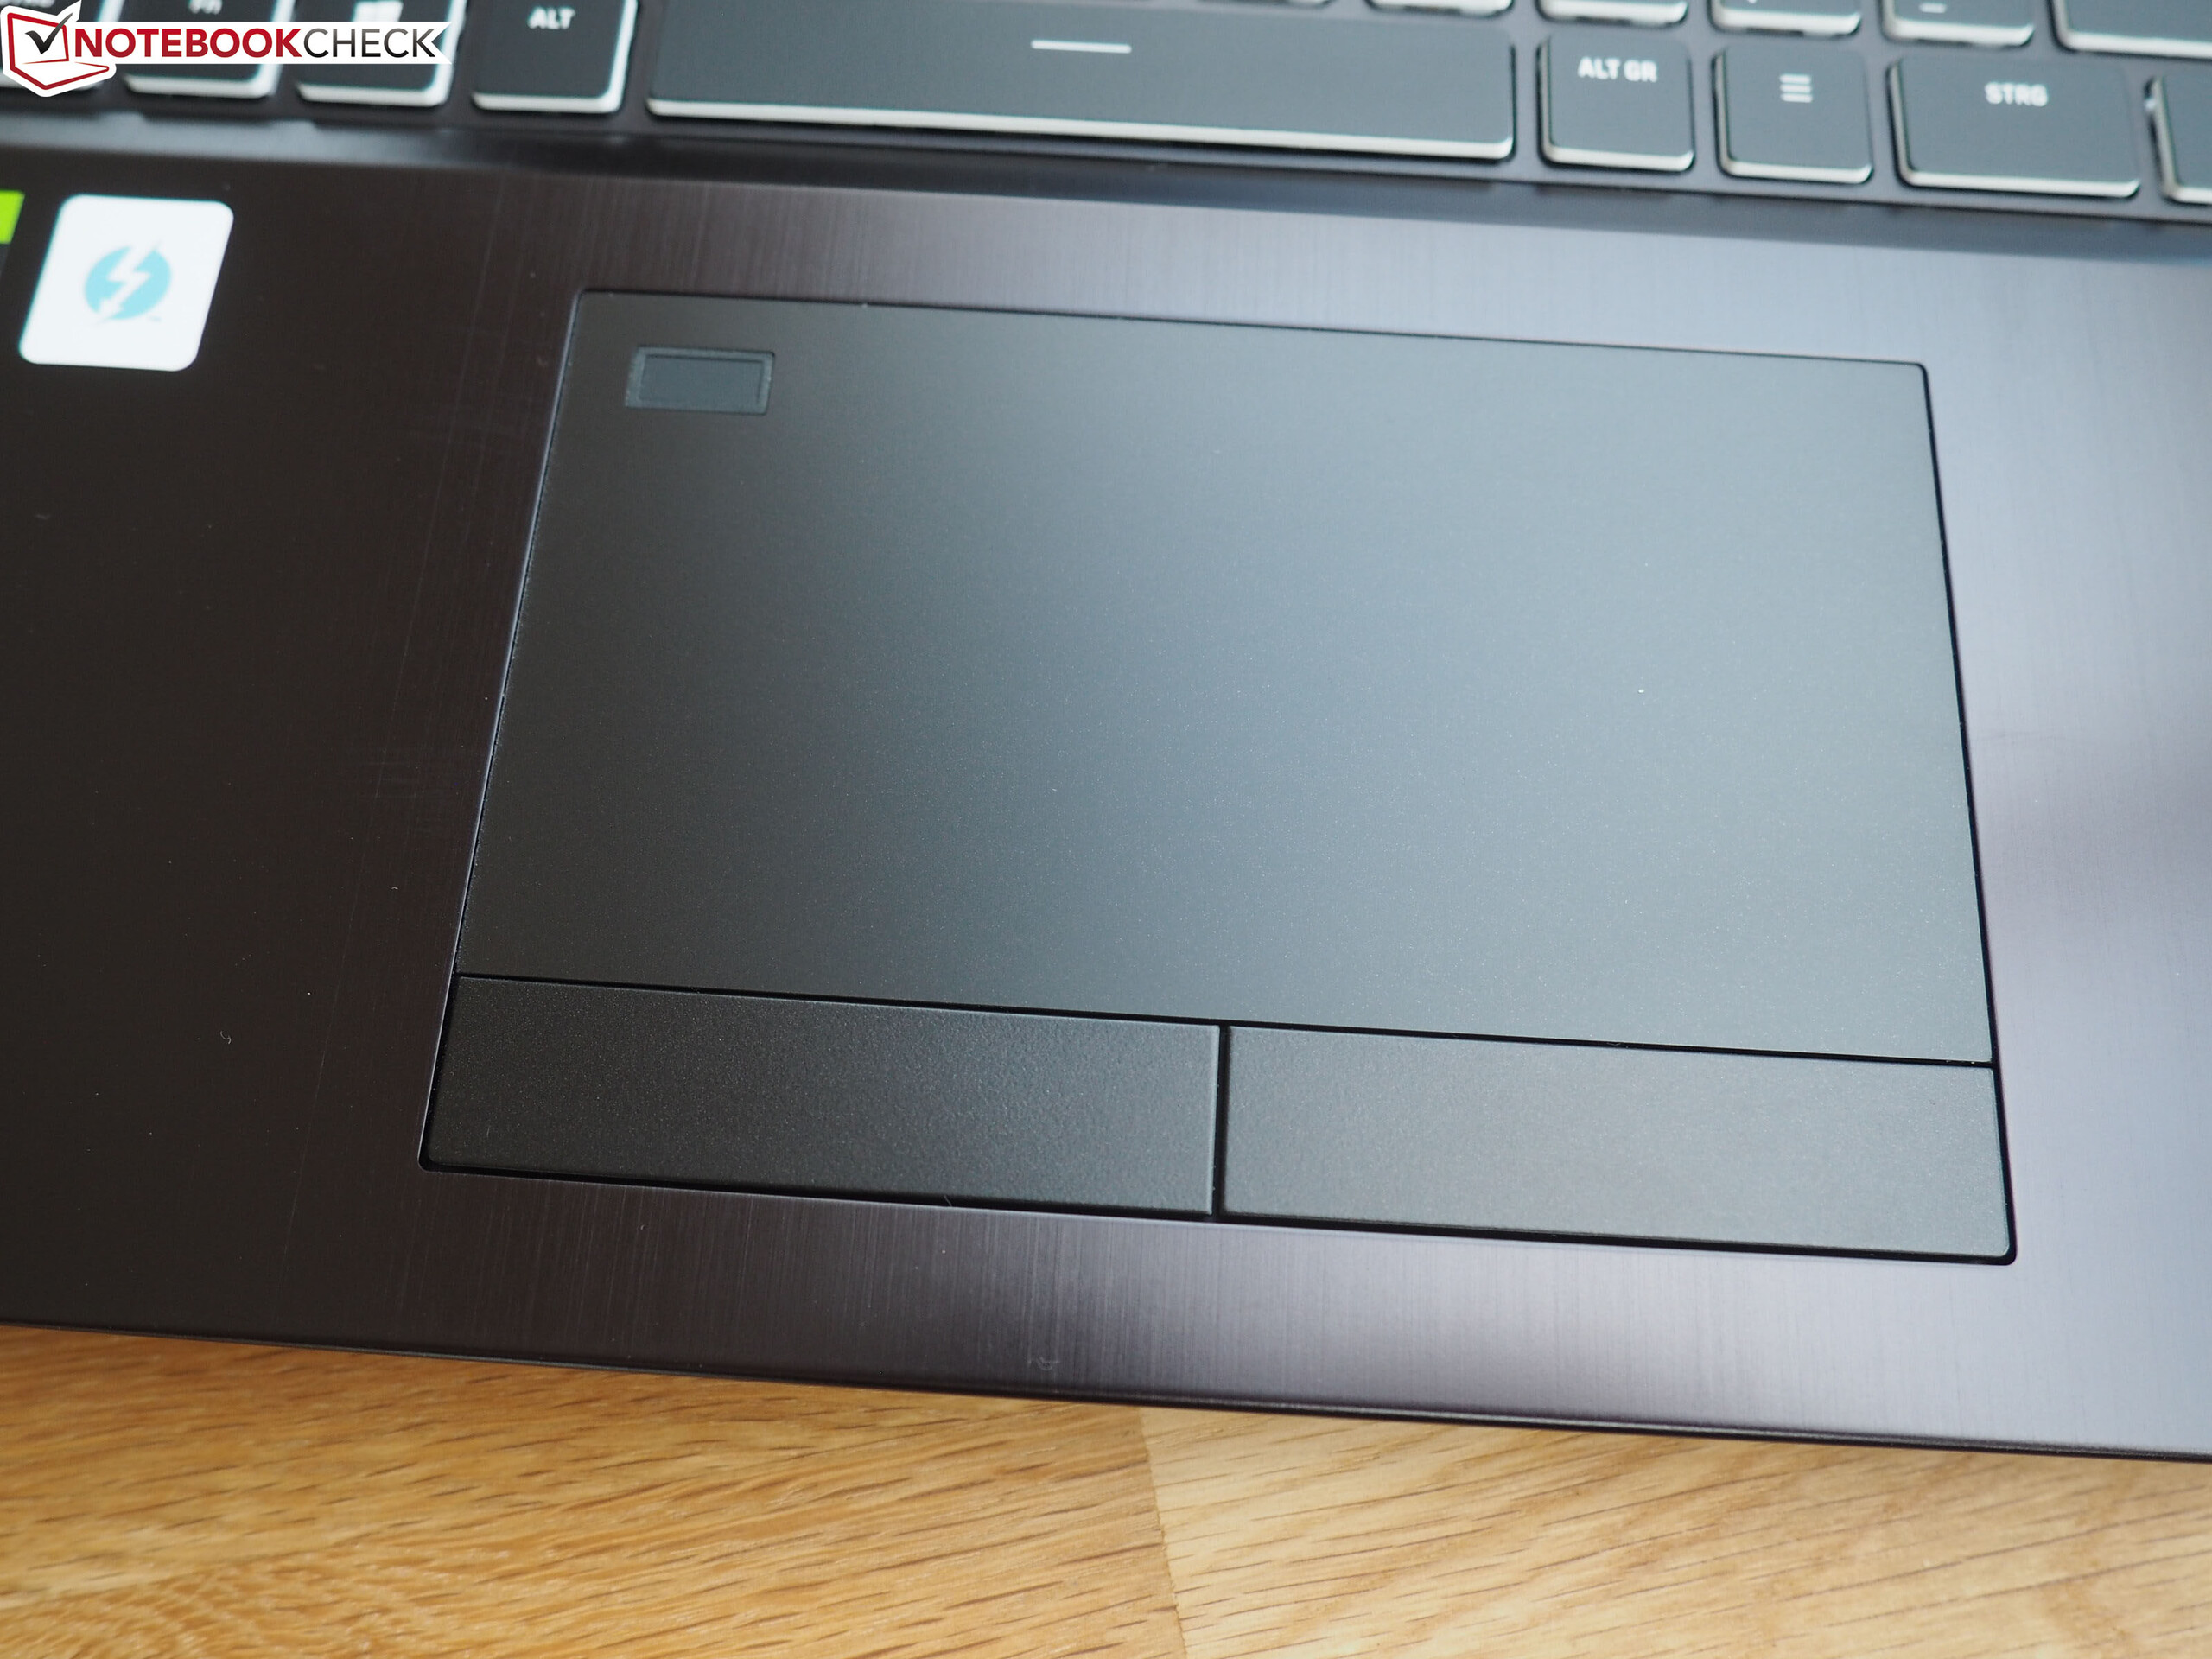
Dato che l'XMG Ultra 17 è identico nella costruzione al modello 2020, non approfondiremo gli aspetti del case, l'equipaggiamento, i dispositivi di input e gli altoparlanti. Le relative informazioni possono essere trovate nella Recensione dello Schenker XMG Ultra 17 (2020).
Confronto con i potenziali concorrenti
Punteggio | Data | Modello | Peso | Altezza | Dimensione | Risoluzione |
|---|---|---|---|---|---|---|
| 84.9 % v7 (old) | 04/2021 | Schenker XMG Ultra 17 Rocket Lake i9-11900K, GeForce RTX 3080 Laptop GPU | 4.7 kg | 43.5 mm | 17.30" | 1920x1080 |
| 87.4 % v7 (old) | 10/2020 | MSI GT76 Titan DT 10SGS i9-10900K, GeForce RTX 2080 Super Mobile | 4.2 kg | 42 mm | 17.30" | 3840x2160 |
| 82.7 % v7 (old) | 07/2020 | Asus Strix Scar 17 G732LXS i9-10980HK, GeForce RTX 2080 Super Mobile | 2.9 kg | 26.5 mm | 17.30" | 1920x1080 |
| 85.3 % v7 (old) | 04/2021 | Alienware m17 R4 i9-10980HK, GeForce RTX 3080 Laptop GPU | 3 kg | 22 mm | 17.30" | 1920x1080 |
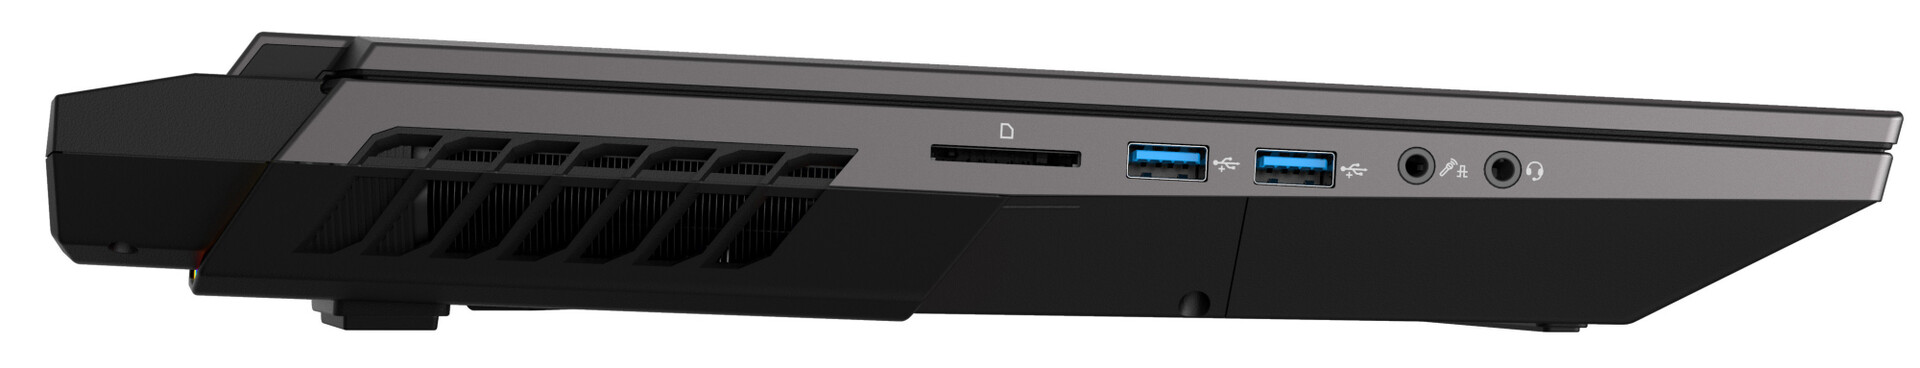
| SD Card Reader | |
| average JPG Copy Test (av. of 3 runs) | |
| Schenker XMG Ultra 17 Rocket Lake | |
| Schenker XMG Ultra 17 Comet Lake (Toshiba Exceria Pro SDXC 64 GB UHS-II) | |
| Alienware m17 R4 (AV PRO microSD 128 GB V60) | |
| MSI GT76 Titan DT 10SGS (Toshiba Exceria Pro M501 UHS-II) | |
| Media della classe Gaming (20.9 - 210, n=54, ultimi 2 anni) | |
| maximum AS SSD Seq Read Test (1GB) | |
| Alienware m17 R4 (AV PRO microSD 128 GB V60) | |
| Schenker XMG Ultra 17 Comet Lake (Toshiba Exceria Pro SDXC 64 GB UHS-II) | |
| Schenker XMG Ultra 17 Rocket Lake (AV PRO microSD 128 GB V60) | |
| MSI GT76 Titan DT 10SGS (Toshiba Exceria Pro M501 UHS-II) | |
| Media della classe Gaming (25.5 - 261, n=51, ultimi 2 anni) | |


")
")


")
")


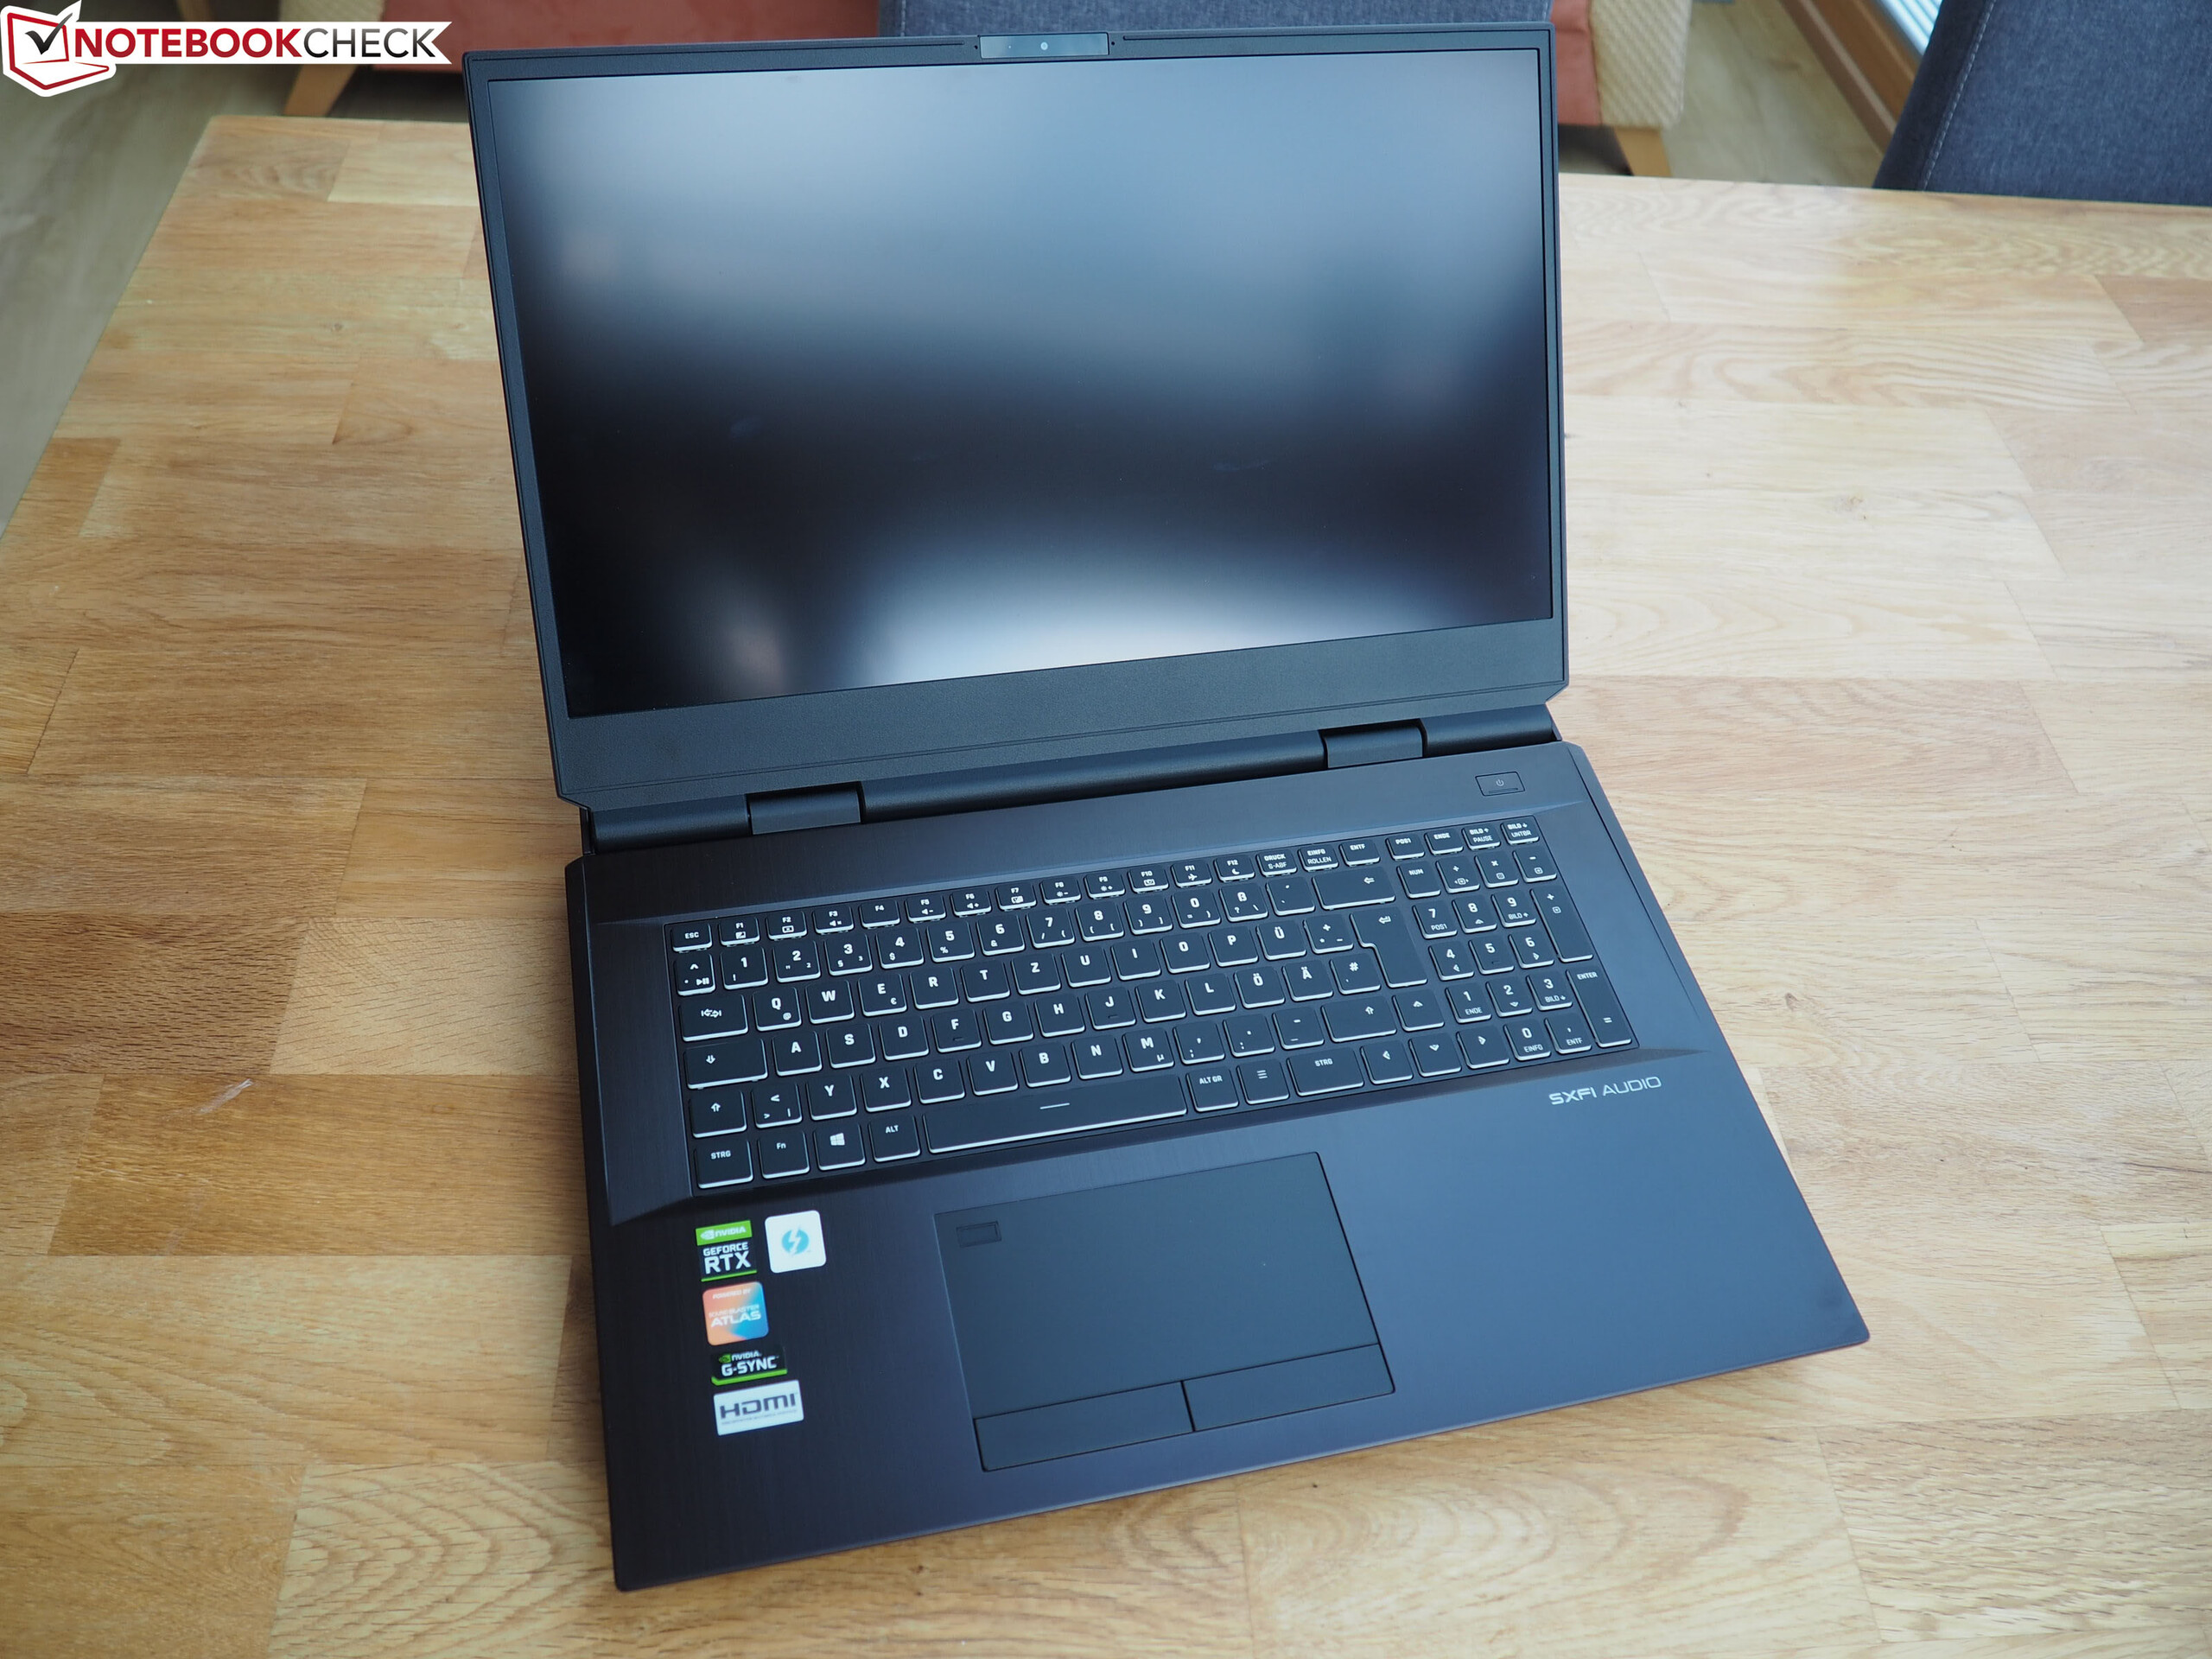
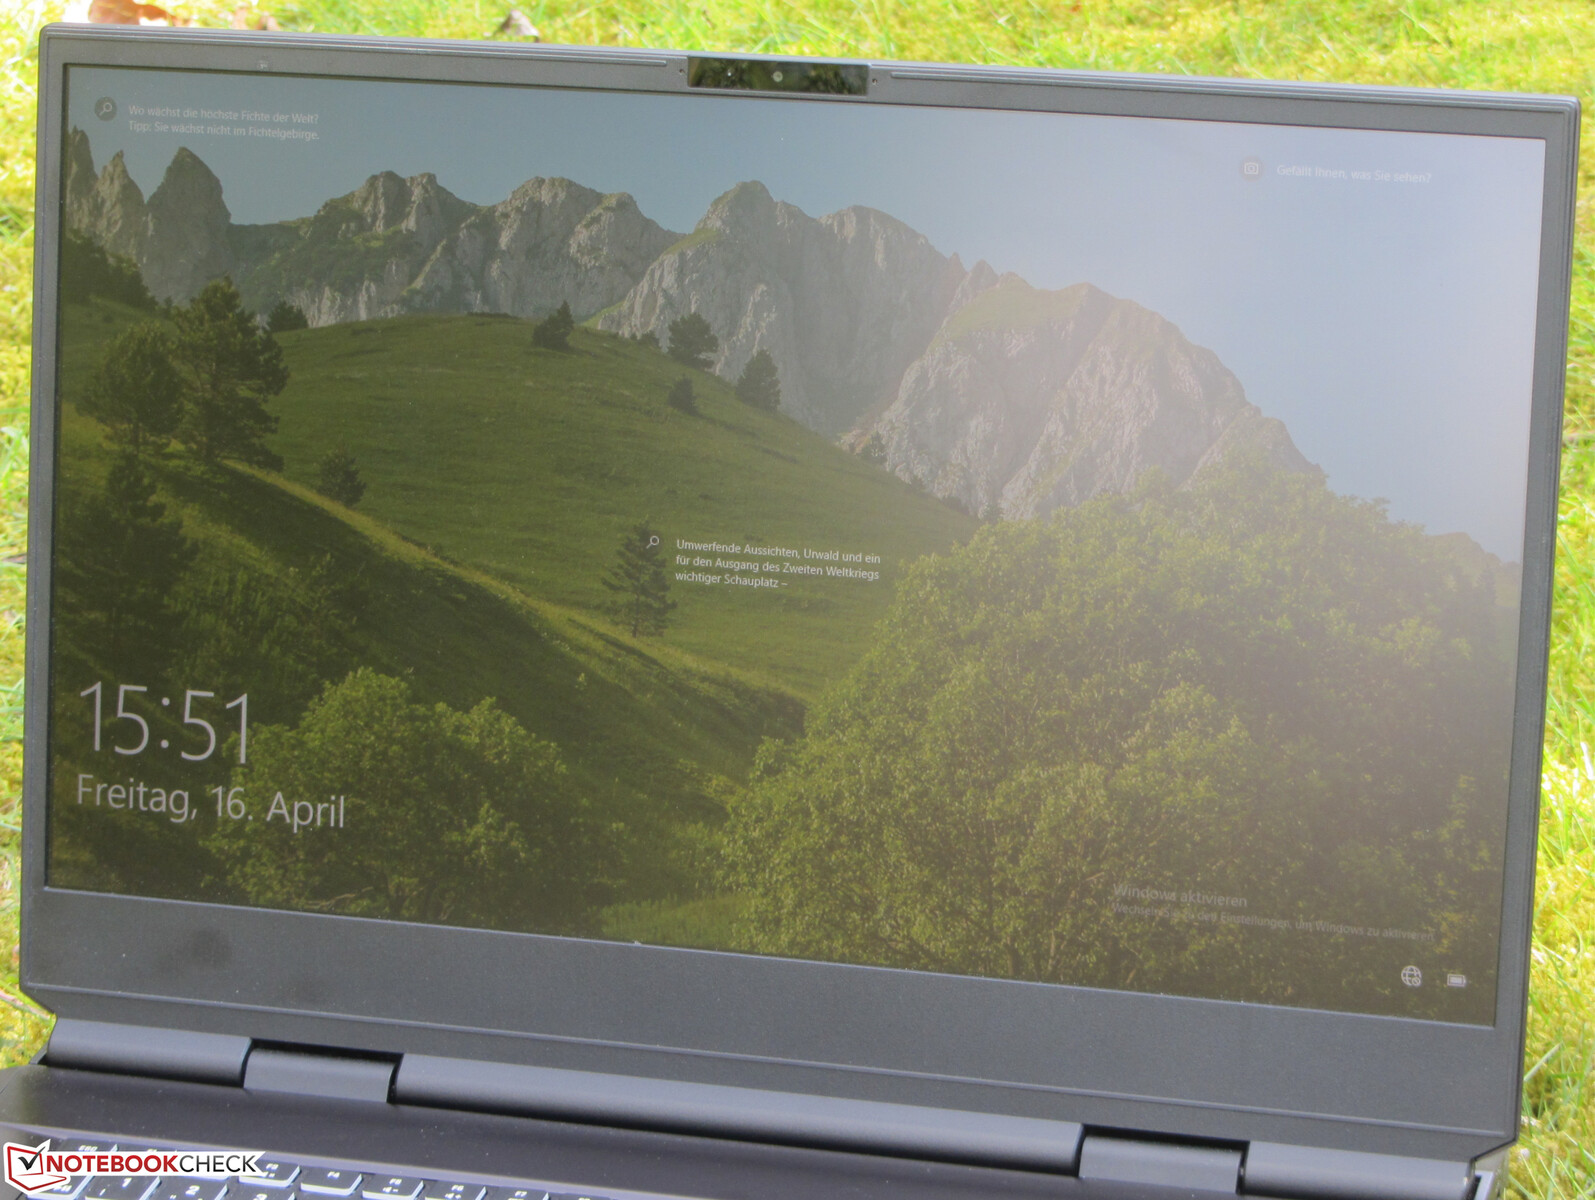
Display - 300 Hz IPS
Mentre lo schermo opaco da 17,3" (1.920 x 1.080 pixel) offre un buon contrasto (1.391:1), la luminosità (299,3 cd/m²) raggiunge appena l'obiettivo (> 300 cd/m²). Ilpannello a 300 Hz offre tempi di risposta brevi e non mostra PWM flickering.
Il display supporta la tecnologia G-Sync di Nvidia. Questa regola dinamicamente le frequenze di aggiornamento del display e della GPU l'una con l'altra. Questo dovrebbe creare l'immagine più fluida possibile - specialmente nei giochi per computer.
| |||||||||||||||||||||||||
Distribuzione della luminosità: 93 %
Al centro con la batteria: 306 cd/m²
Contrasto: 1391:1 (Nero: 0.22 cd/m²)
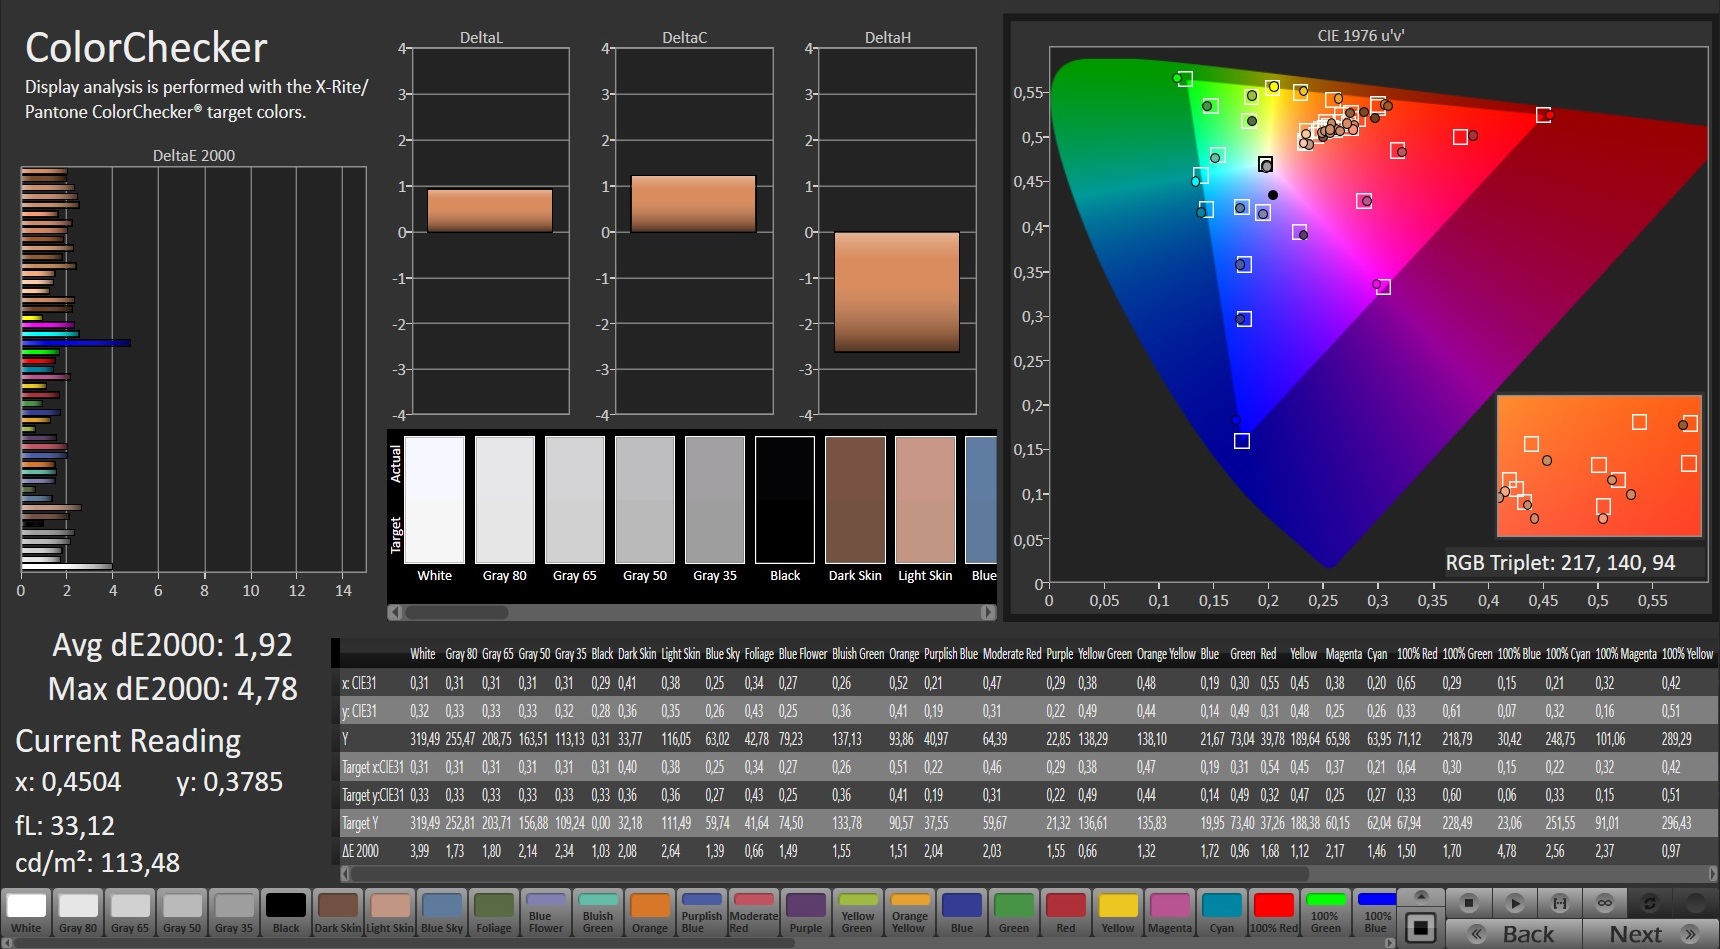
ΔE ColorChecker Calman: 1.92 | ∀{0.5-29.43 Ø4.71}
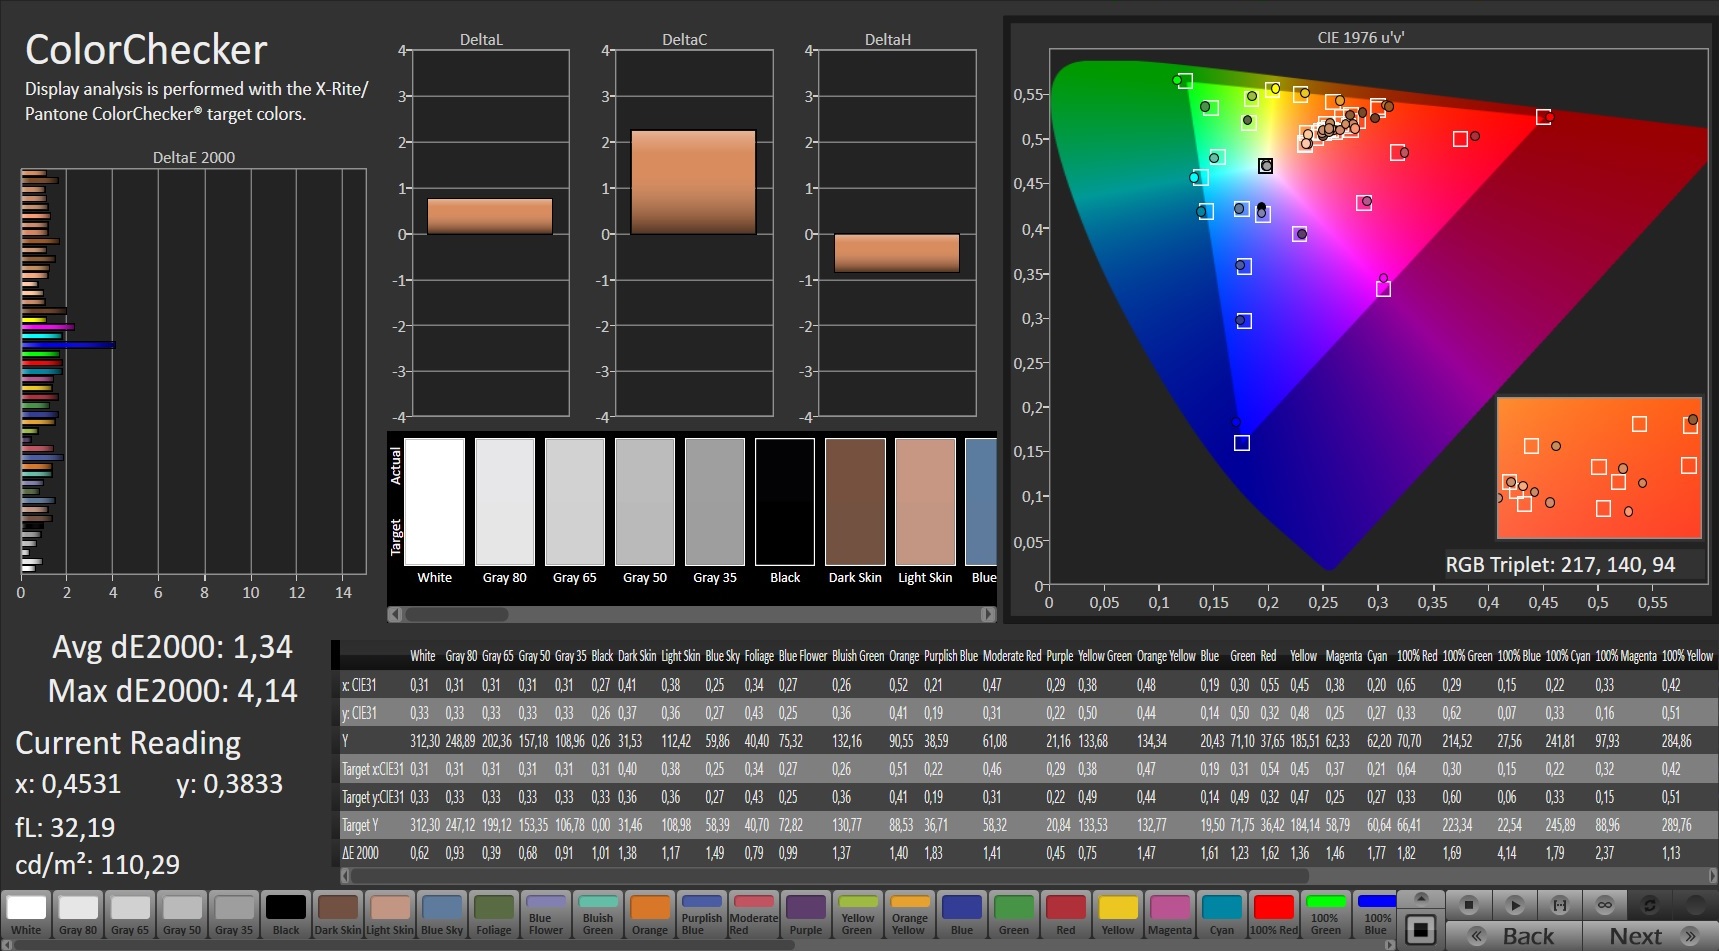
calibrated: 1.34
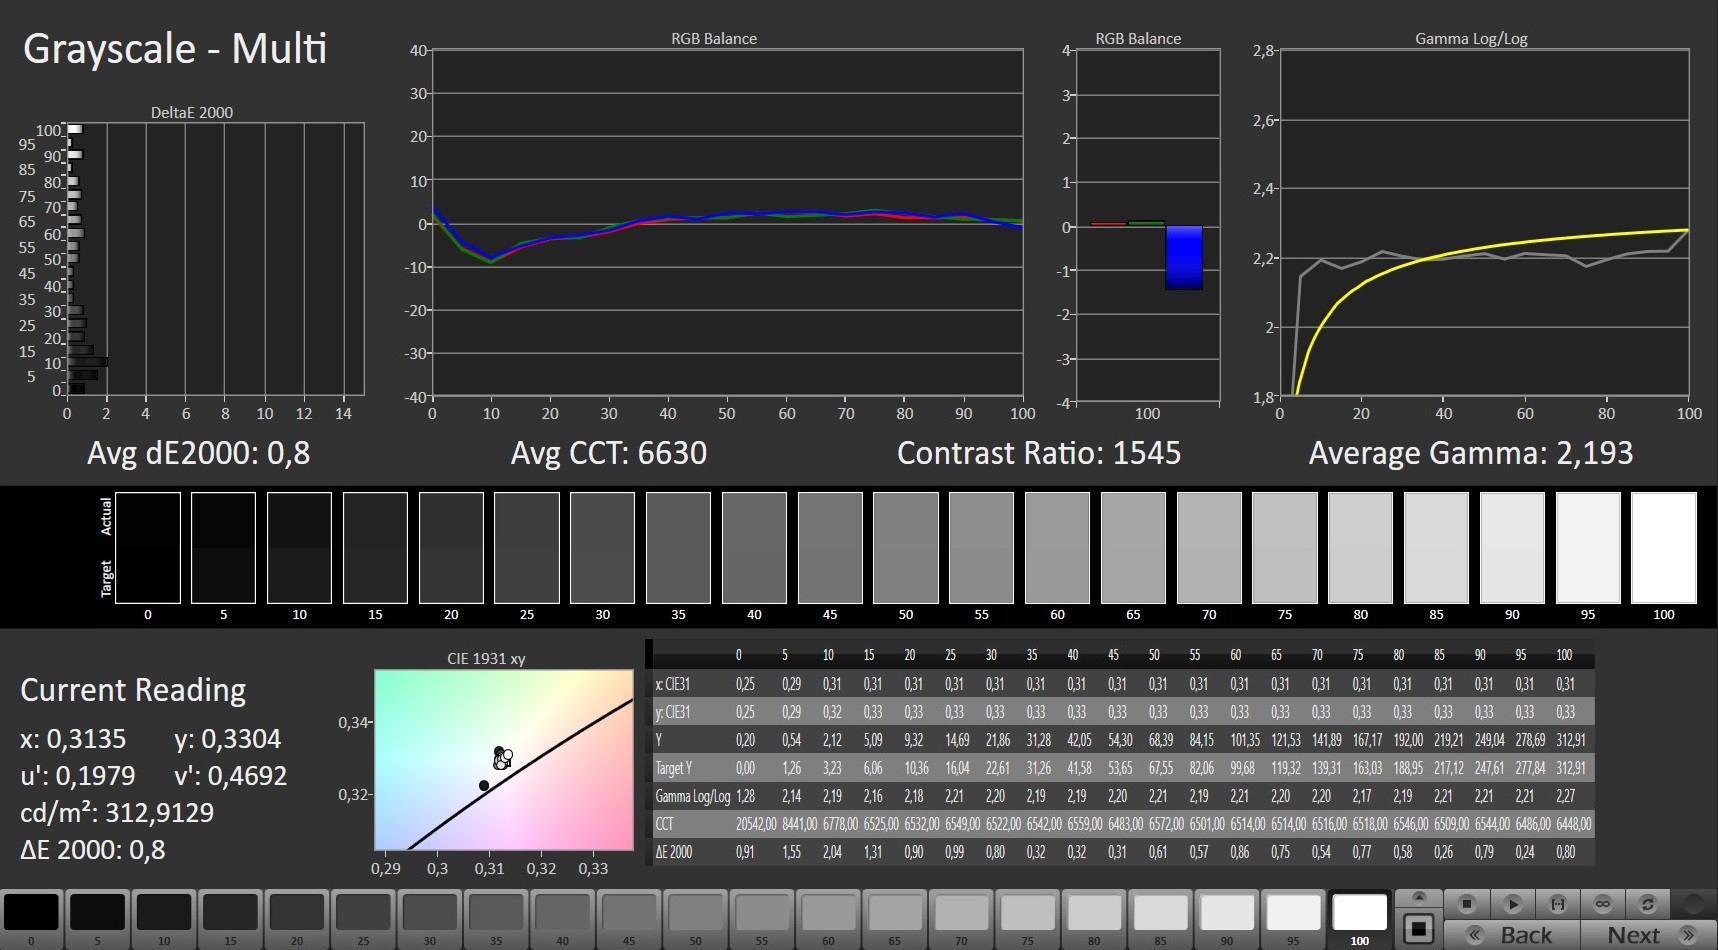
ΔE Greyscale Calman: 2 | ∀{0.09-98 Ø4.96}
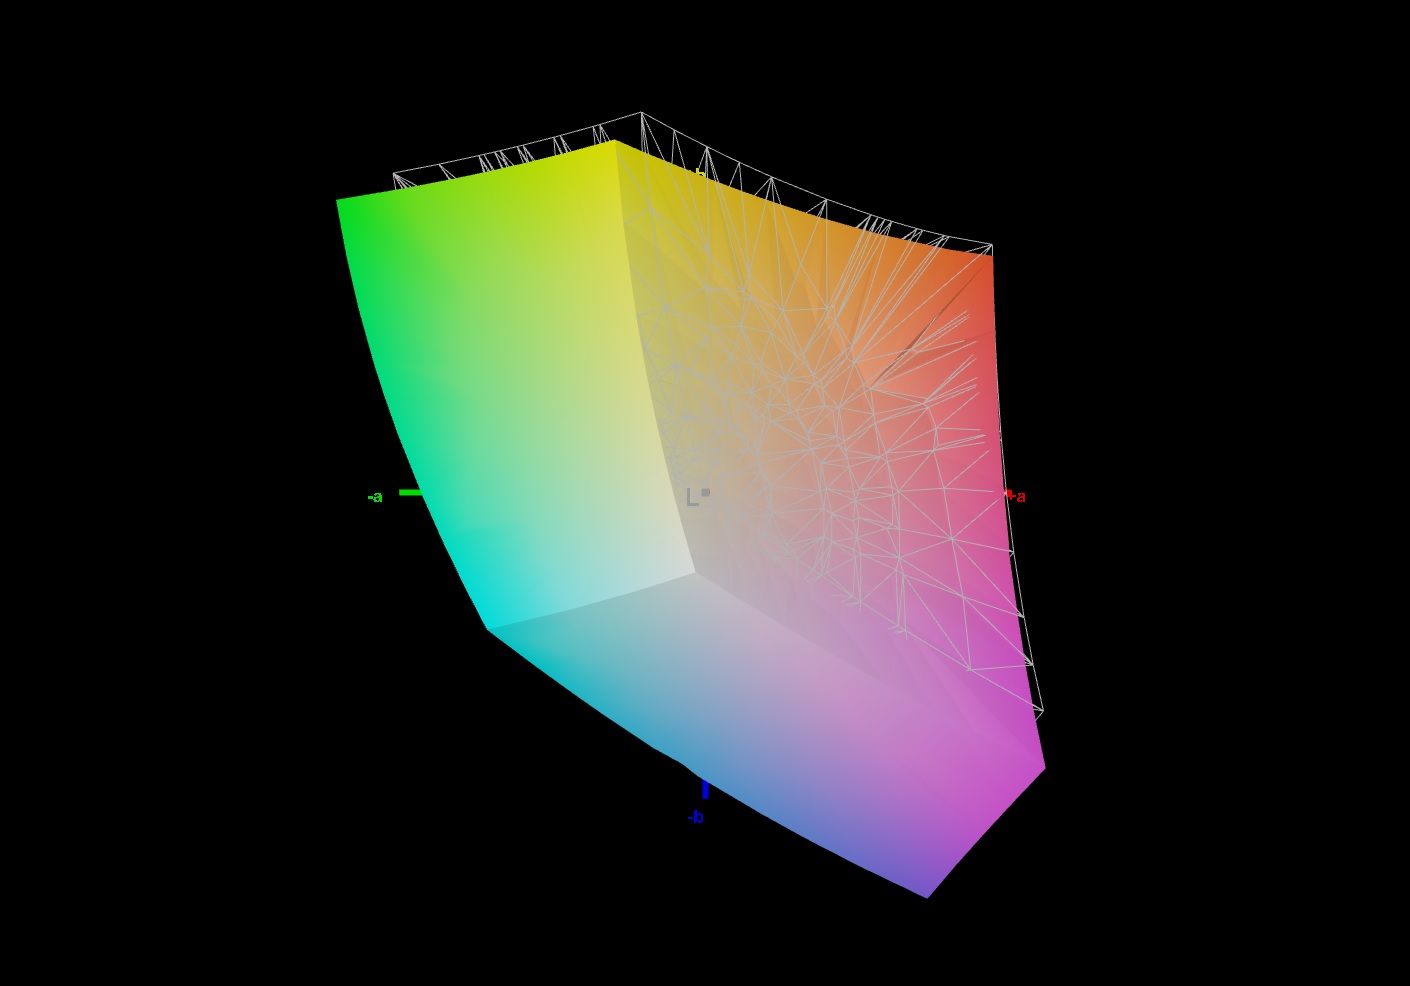
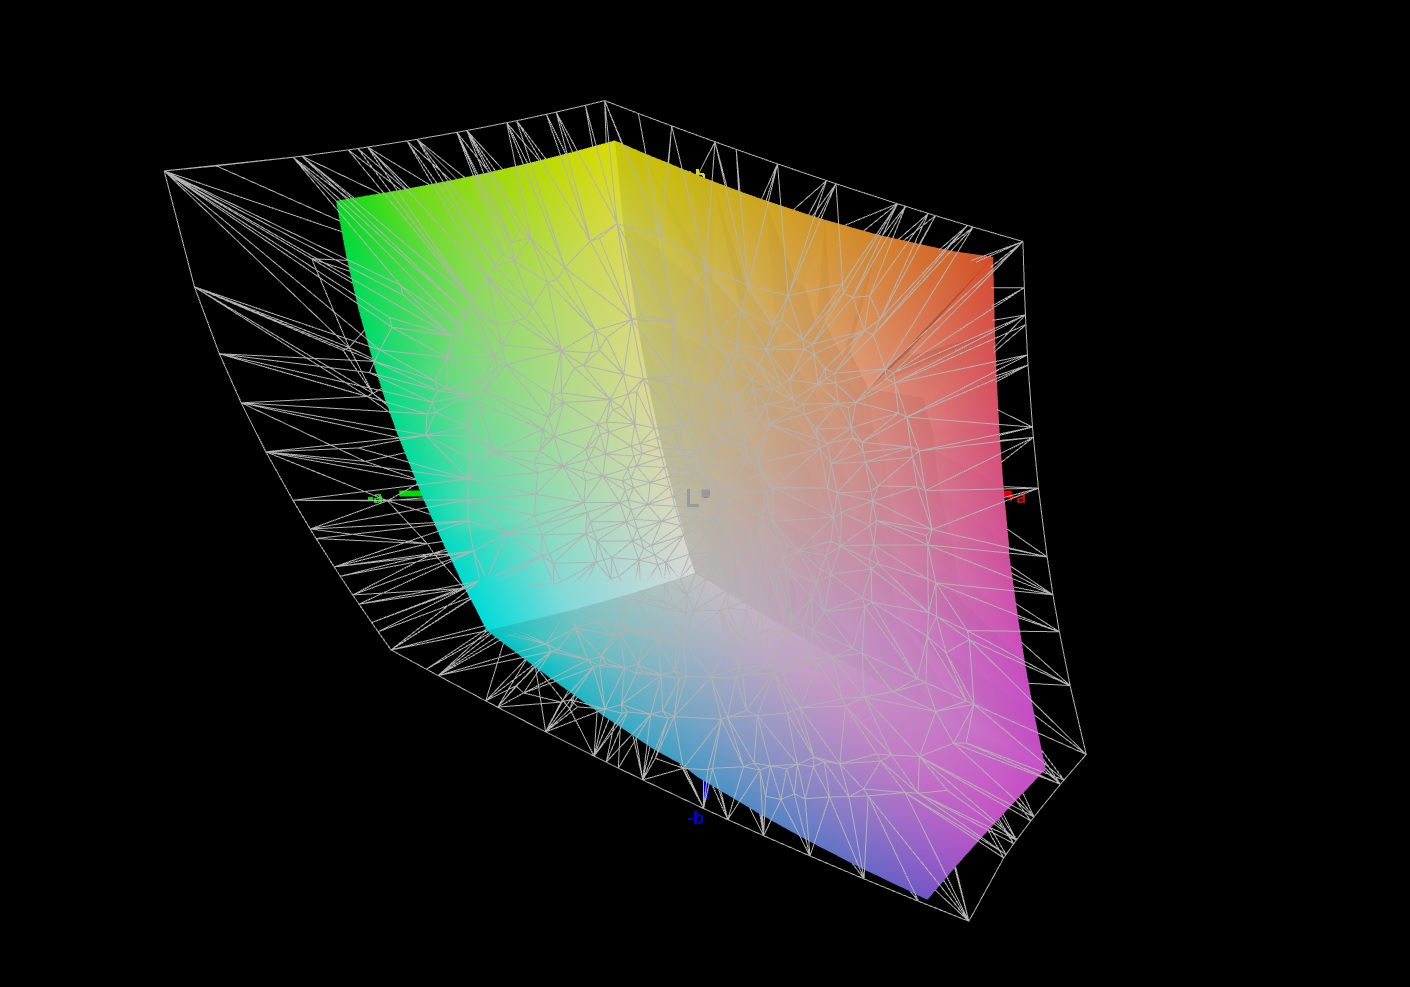
93% sRGB (Argyll 1.6.3 3D)
72% AdobeRGB 1998 (Argyll 1.6.3 3D)
72% AdobeRGB 1998 (Argyll 3D)
97.2% sRGB (Argyll 3D)
69.8% Display P3 (Argyll 3D)
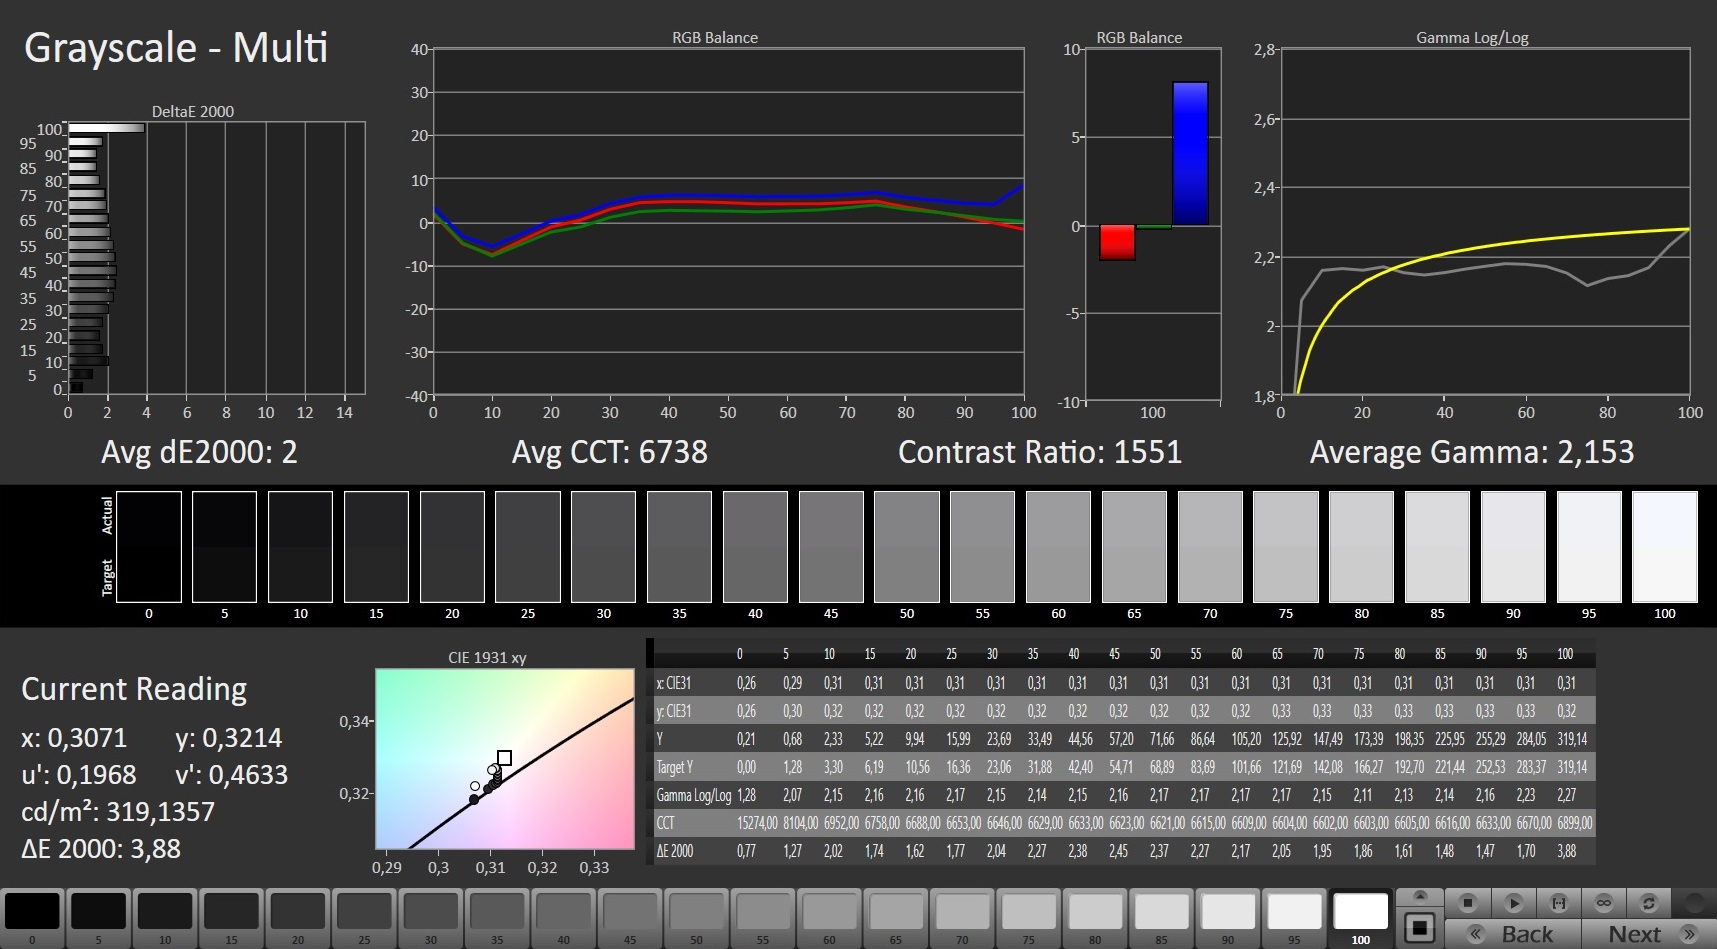
Gamma: 2.153
CCT: 6738 K
| Schenker XMG Ultra 17 Rocket Lake AU Optronics B173HAN05.1, IPS, 1920x1080, 17.3" | MSI GT76 Titan DT 10SGS AU Optronics B173ZAN03.3, IPS, 3840x2160, 17.3" | Asus Strix Scar 17 G732LXS LQ173M1JW03 (SHP14DC), IPS, 1920x1080, 17.3" | Schenker XMG Ultra 17 Comet Lake AUO B173ZAN03.0 (AUO309B), IPS, 3840x2160, 17.3" | Alienware m17 R4 AU Optronics AUOEC91, IPS, 1920x1080, 17.3" | |
|---|---|---|---|---|---|
| Display | 18% | 1% | 19% | 1% | |
| Display P3 Coverage (%) | 69.8 | 82.5 18% | 71 2% | 83 19% | 69.8 0% |
| sRGB Coverage (%) | 97.2 | 98 1% | 99 2% | 99.1 2% | 99.7 3% |
| AdobeRGB 1998 Coverage (%) | 72 | 96.6 34% | 71.6 -1% | 97.9 36% | 71.6 -1% |
| Response Times | -170% | 3% | -468% | -68% | |
| Response Time Grey 50% / Grey 80% * (ms) | 5.6 ? | 23.2 ? -314% | 5.8 ? -4% | 50.4 ? -800% | 13.2 ? -136% |
| Response Time Black / White * (ms) | 9.2 ? | 11.6 ? -26% | 8.4 ? 9% | 21.6 ? -135% | 9.2 ? -0% |
| PWM Frequency (Hz) | |||||
| Screen | -26% | -31% | -38% | 12% | |
| Brightness middle (cd/m²) | 306 | 419.5 37% | 310 1% | 442 44% | 305 0% |
| Brightness (cd/m²) | 299 | 413 38% | 311 4% | 423 41% | 301 1% |
| Brightness Distribution (%) | 93 | 93 0% | 82 -12% | 92 -1% | 93 0% |
| Black Level * (cd/m²) | 0.22 | 0.4 -82% | 0.41 -86% | 0.36 -64% | 0.19 14% |
| Contrast (:1) | 1391 | 1049 -25% | 756 -46% | 1228 -12% | 1605 15% |
| Colorchecker dE 2000 * | 1.92 | 3.4 -77% | 2.41 -26% | 4.38 -128% | 1.31 32% |
| Colorchecker dE 2000 max. * | 4.78 | 7.4 -55% | 8.59 -80% | 10.85 -127% | 2.32 51% |
| Colorchecker dE 2000 calibrated * | 1.34 | 3.28 -145% | 1.13 16% | 0.66 51% | 0.91 32% |
| Greyscale dE 2000 * | 2 | 2 -0% | 4.3 -115% | 7.3 -265% | 2.3 -15% |
| Gamma | 2.153 102% | 2.14 103% | 2.149 102% | 2.17 101% | 2.281 96% |
| CCT | 6738 96% | 6858 95% | 7059 92% | 6906 94% | 6449 101% |
| Color Space (Percent of AdobeRGB 1998) (%) | 72 | 84.6 17% | 72 0% | 98 36% | 72 0% |
| Color Space (Percent of sRGB) (%) | 93 | 97.9 5% | 94 1% | 98 5% | 94 1% |
| Media totale (Programma / Settaggio) | -59% /
-36% | -9% /
-21% | -162% /
-81% | -18% /
-0% |
* ... Meglio usare valori piccoli
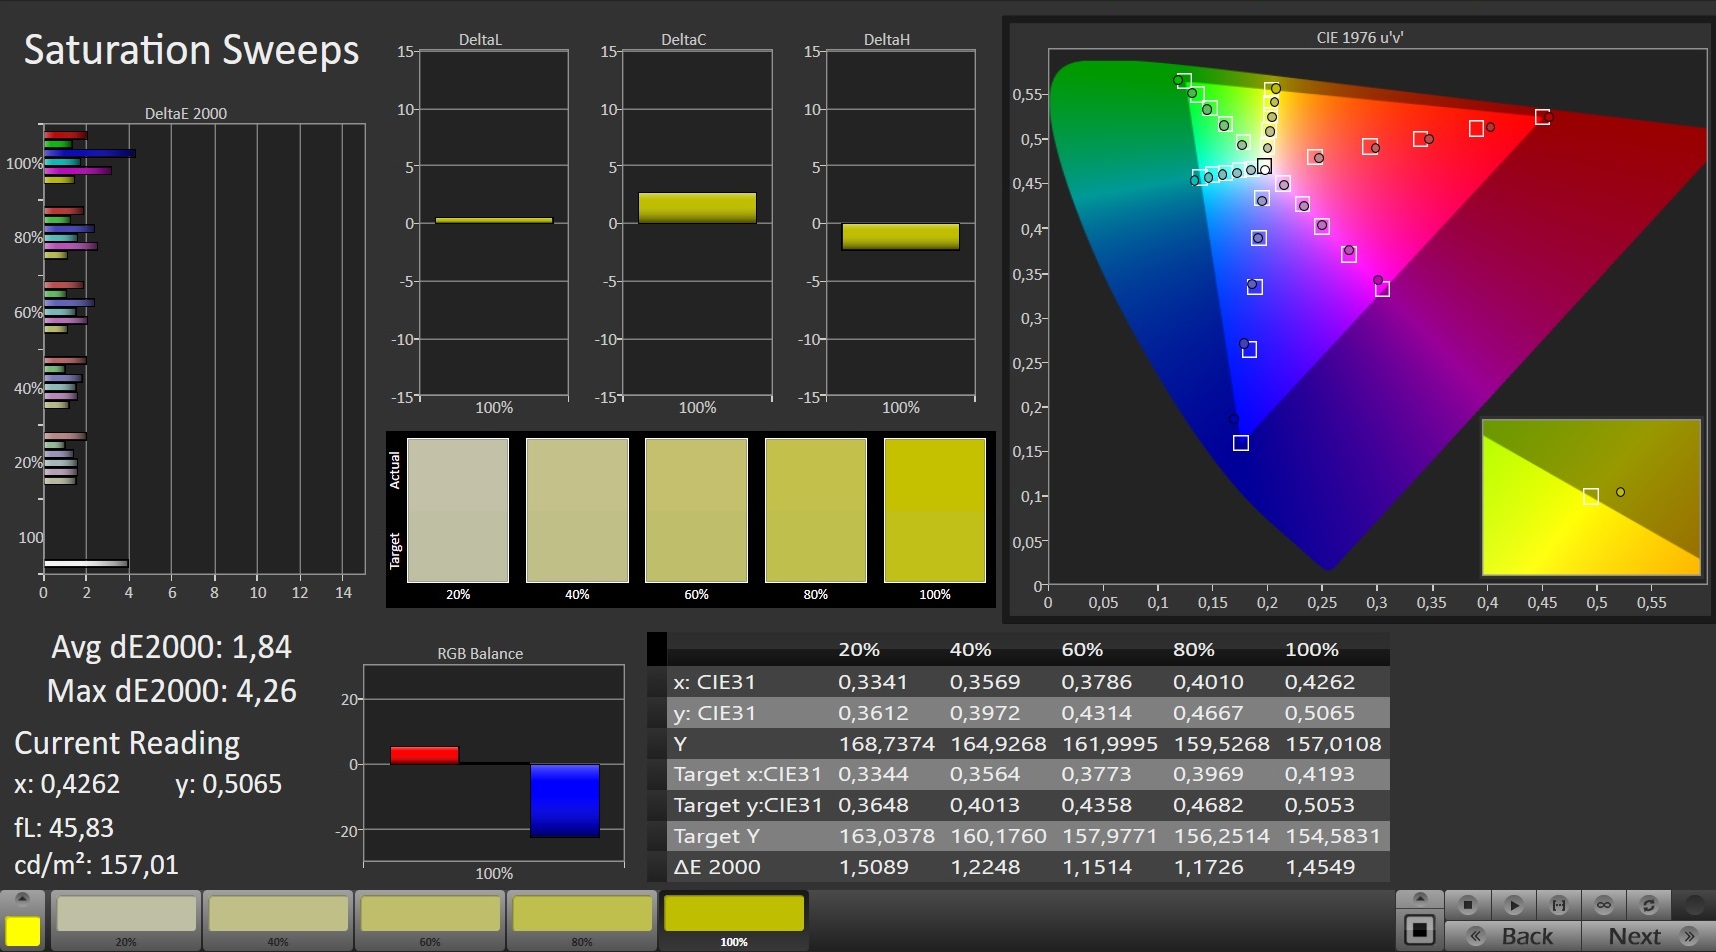
Lo schermo mostra già una buona riproduzione dei colori nel suo stato di consegna e soddisfa l'obiettivo con una deviazione di poco meno di 2 (Delta E meno di 3). Non soffre di una sfumatura blu. Una calibrazione fornisce dei miglioramenti: La deviazione del colore scende a 1,34 e i livelli di scala di grigi sono visualizzati più equilibrati. Il display non può riprodurre completamente gli spazi colore AdobeRGB (72%) e sRGB (93%).

Tempi di risposta del Display
| ↔ Tempi di risposta dal Nero al Bianco | ||
|---|---|---|
| 9.2 ms ... aumenta ↗ e diminuisce ↘ combinato | ↗ 4.8 ms Incremento | 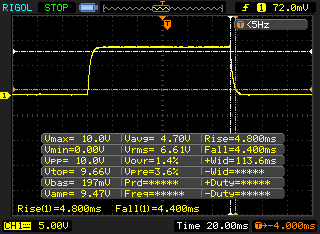 |
| ↘ 4.4 ms Calo | ||
| Lo schermo mostra veloci tempi di risposta durante i nostri tests e dovrebbe esere adatto al gaming In confronto, tutti i dispositivi di test variano da 0.1 (minimo) a 240 (massimo) ms. » 26 % di tutti i dispositivi è migliore. Questo significa che i tempi di risposta rilevati sono migliori rispettto alla media di tutti i dispositivi testati (19.8 ms). | ||
| ↔ Tempo di risposta dal 50% Grigio all'80% Grigio | ||
| 5.6 ms ... aumenta ↗ e diminuisce ↘ combinato | ↗ 2.8 ms Incremento | 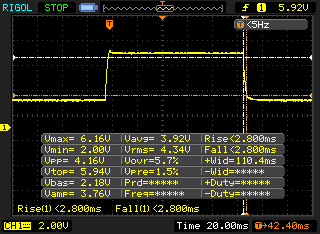 |
| ↘ 2.8 ms Calo | ||
| Lo schermo ha mostrato valori di risposta molto veloci nei nostri tests ed è molto adatto per i gaming veloce. In confronto, tutti i dispositivi di test variano da 0.165 (minimo) a 636 (massimo) ms. » 18 % di tutti i dispositivi è migliore. Questo significa che i tempi di risposta rilevati sono migliori rispettto alla media di tutti i dispositivi testati (31 ms). | ||
Sfarfallio dello schermo / PWM (Pulse-Width Modulation)
| flickering dello schermo / PWM non rilevato | 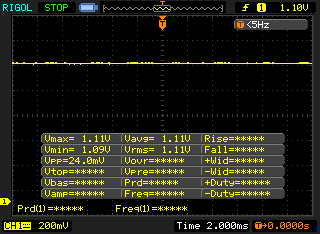 | ||
In confronto: 52 % di tutti i dispositivi testati non utilizza PWM per ridurre la luminosita' del display. Se è rilevato PWM, una media di 7757 (minimo: 5 - massimo: 343500) Hz è stata rilevata. | |||
Il pannello IPS stabile nell'angolo di visione può essere letto da qualsiasi posizione. È abbastanza possibile leggere il display all'aperto se il sole non è troppo luminoso.

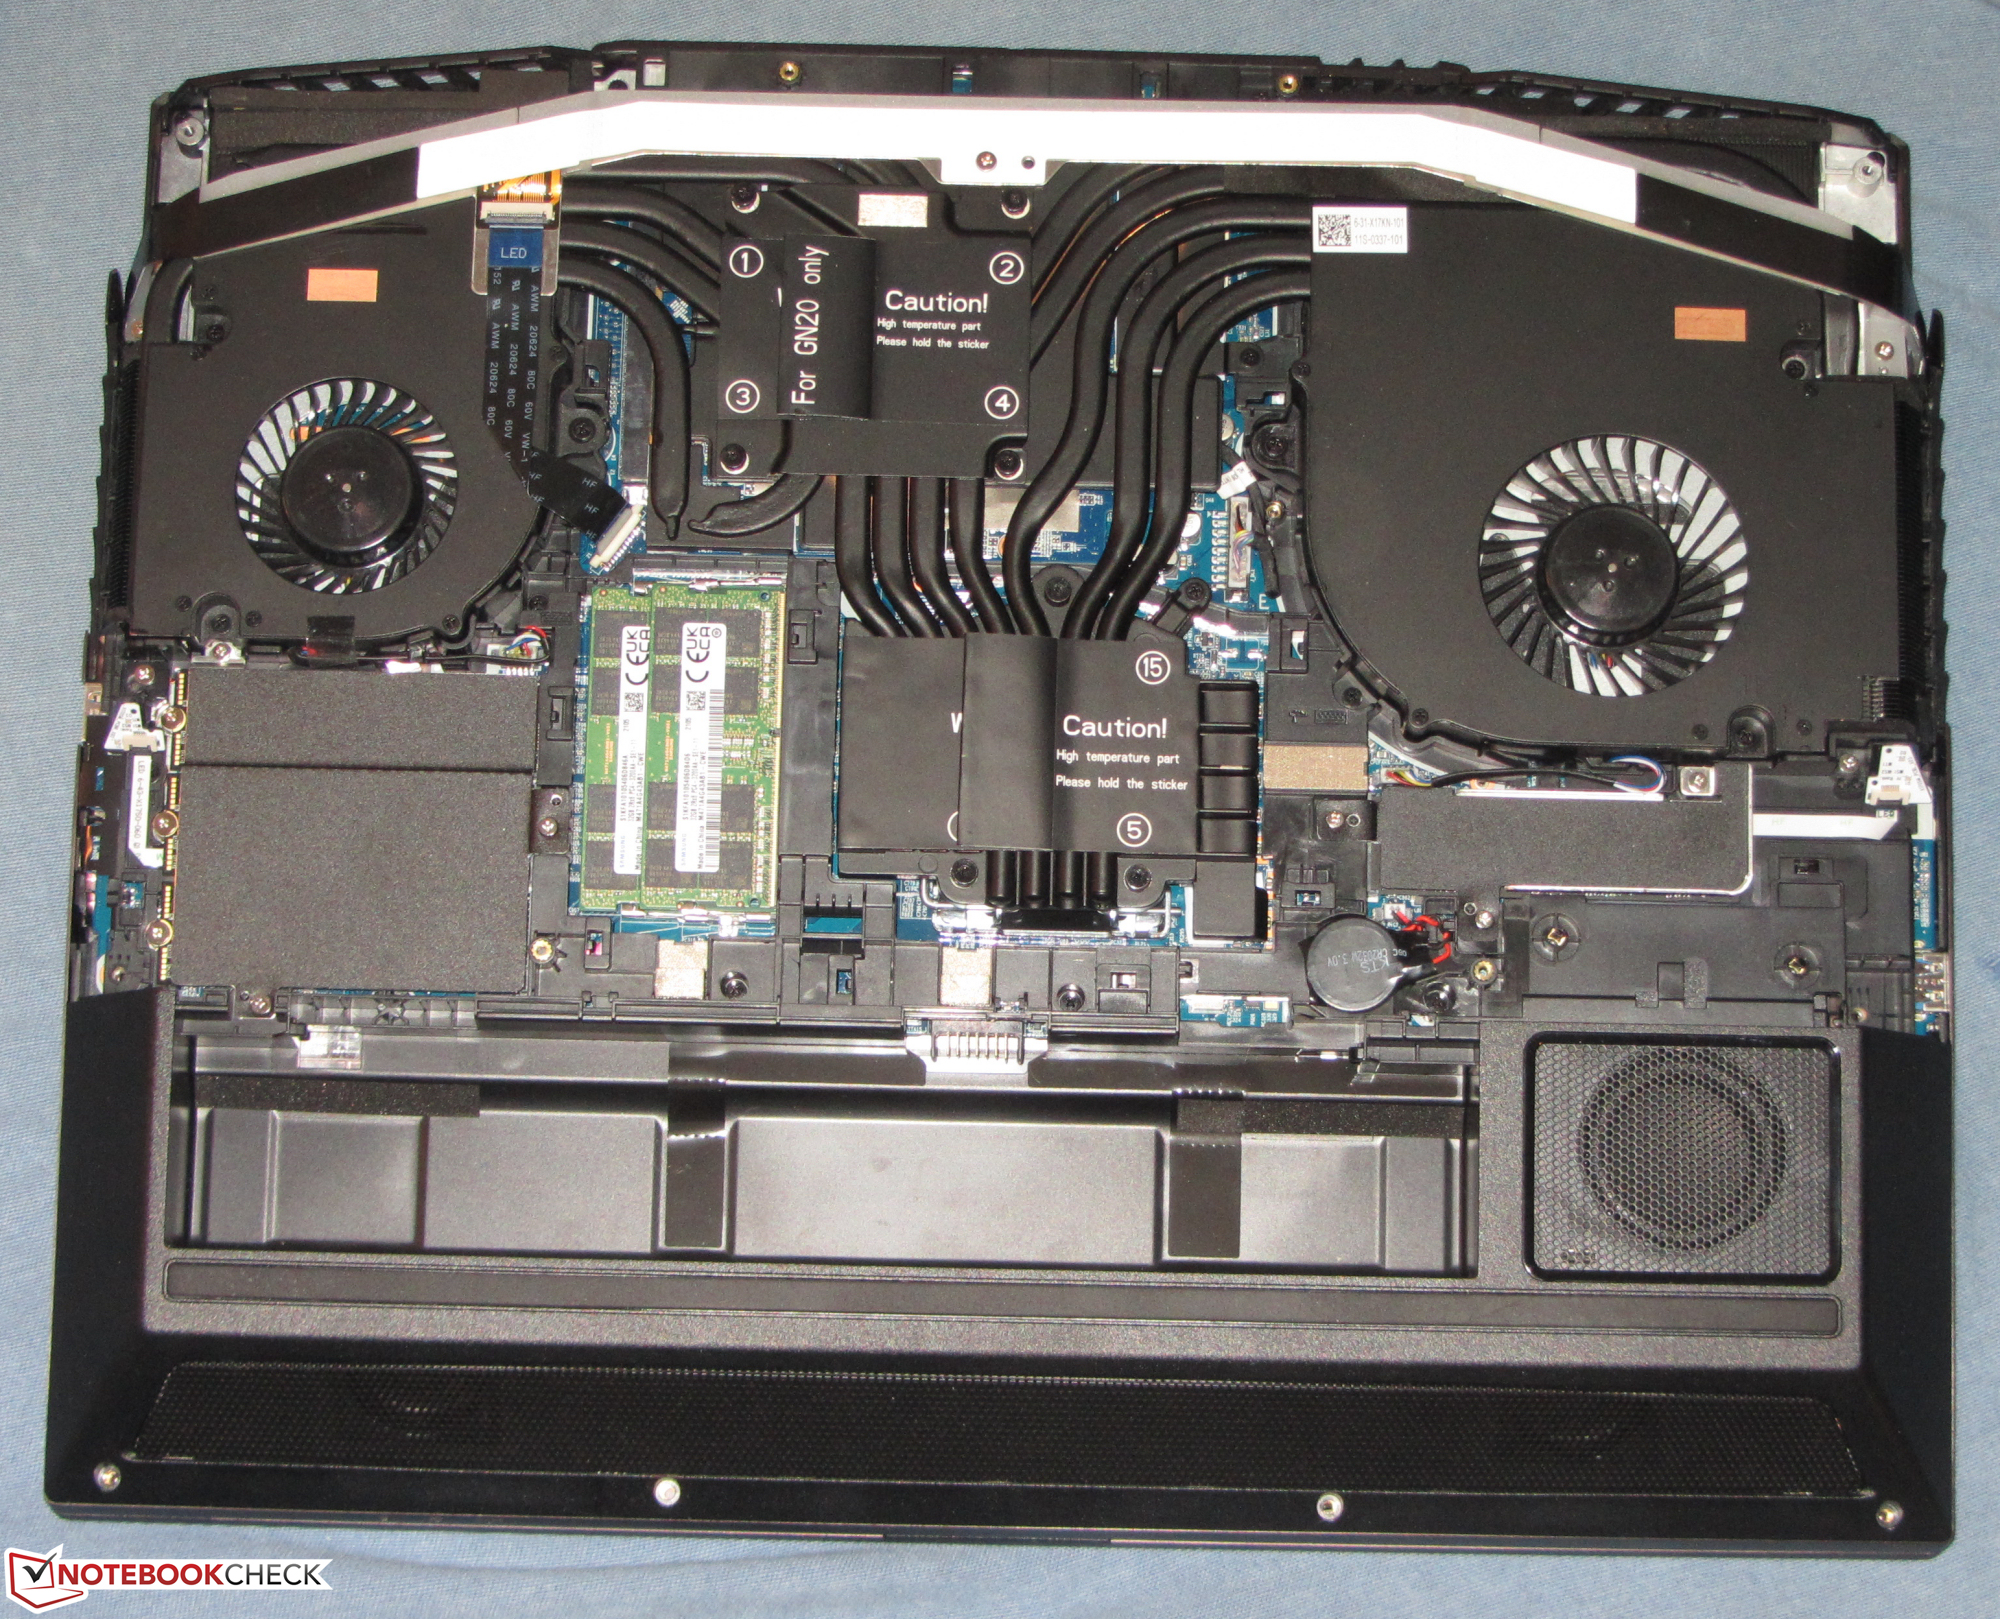
Prestazioni - l'XMG Ultra 17 permette lo swap di CPU e GPU
Questo desktop replacement di Schenker offre molta potenza di calcolo e si comporta di conseguenza in tutte le aree di applicazione comuni. Il dispositivo può essere configurato individualmente.
Condizioni di test
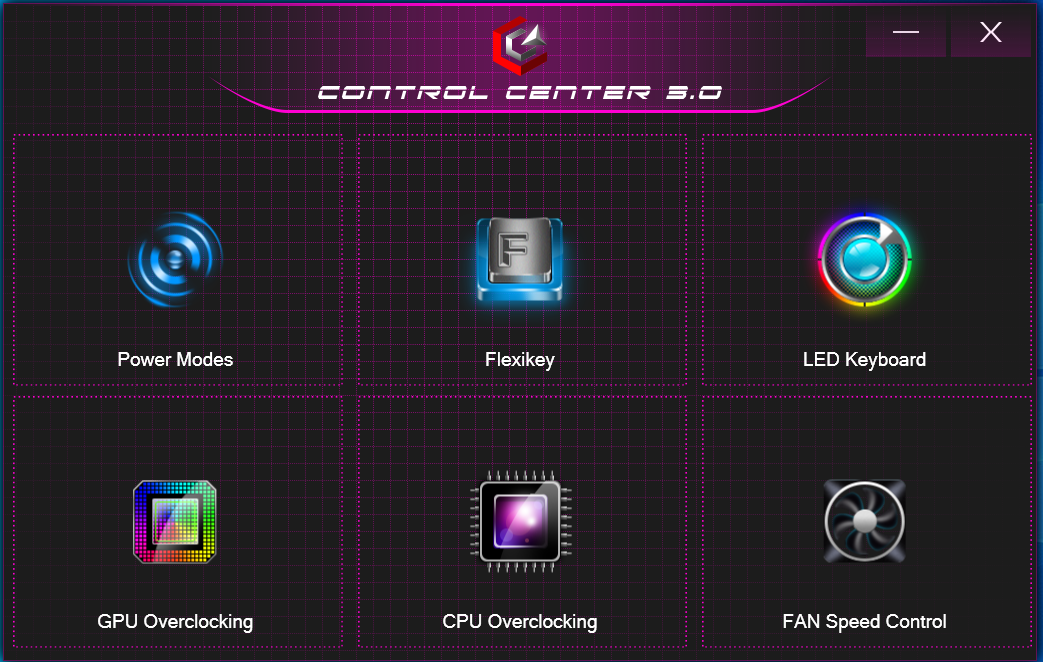
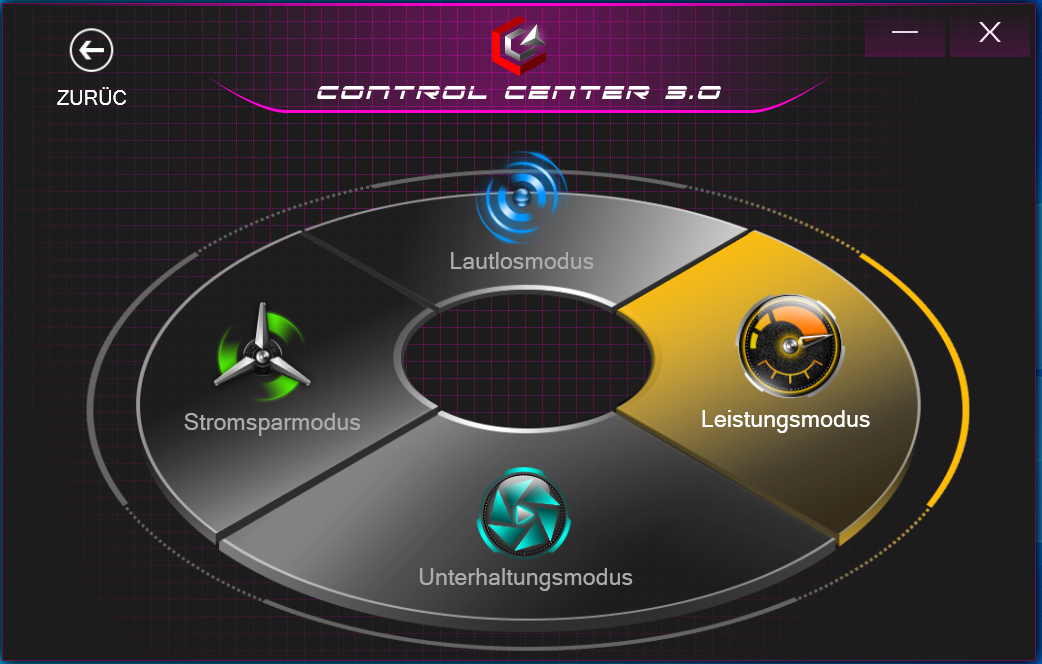
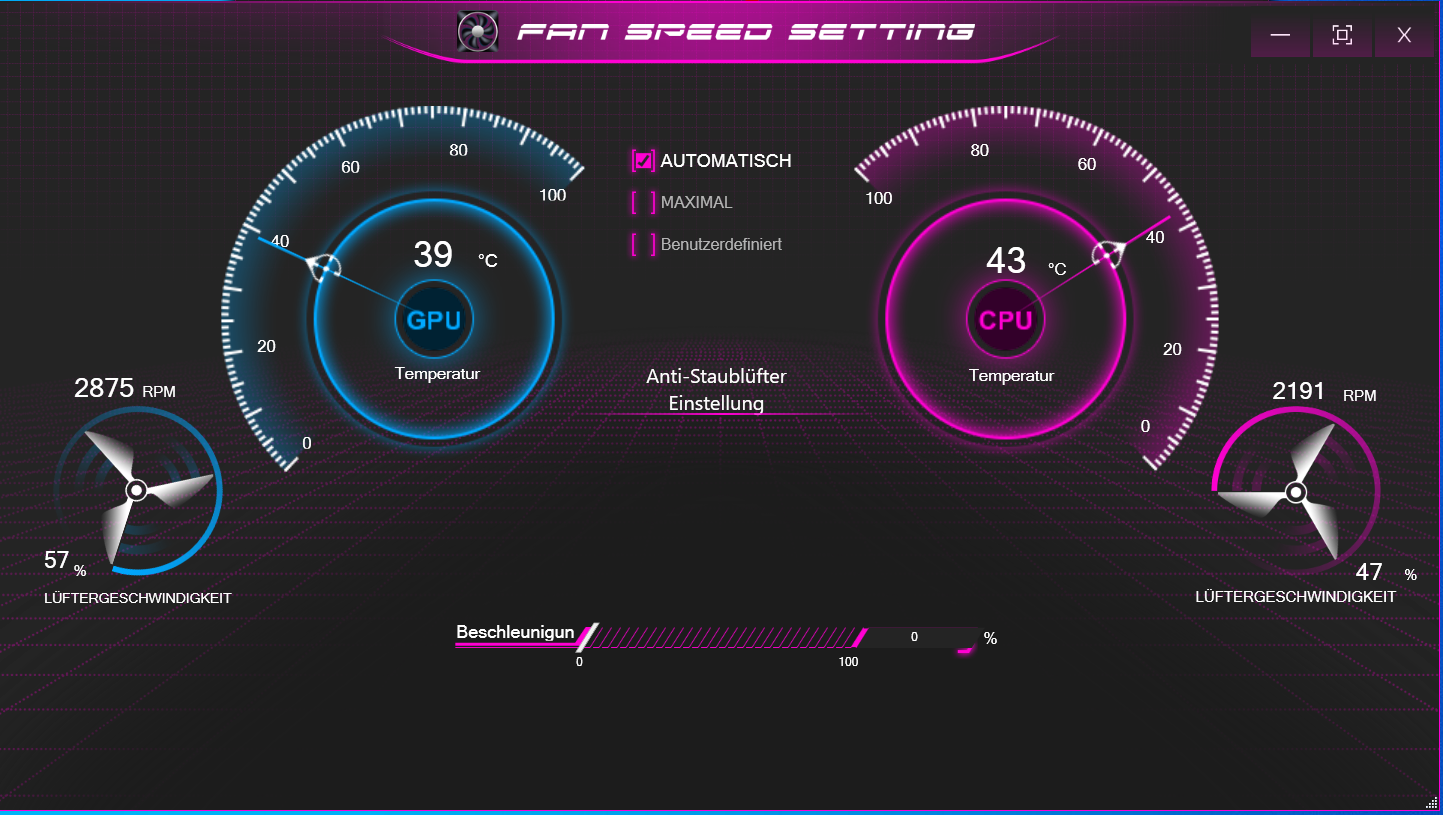
Il Control Center preinstallato permette di selezionare un profilo di prestazioni, tra le altre cose. Abbiamo eseguito i nostri test 3D con un profilo "Performance Mode" attivo e controllo automatico della ventola. Abbiamo usato il profilo "Entertainment Mode" per i test in idle e della batteria.
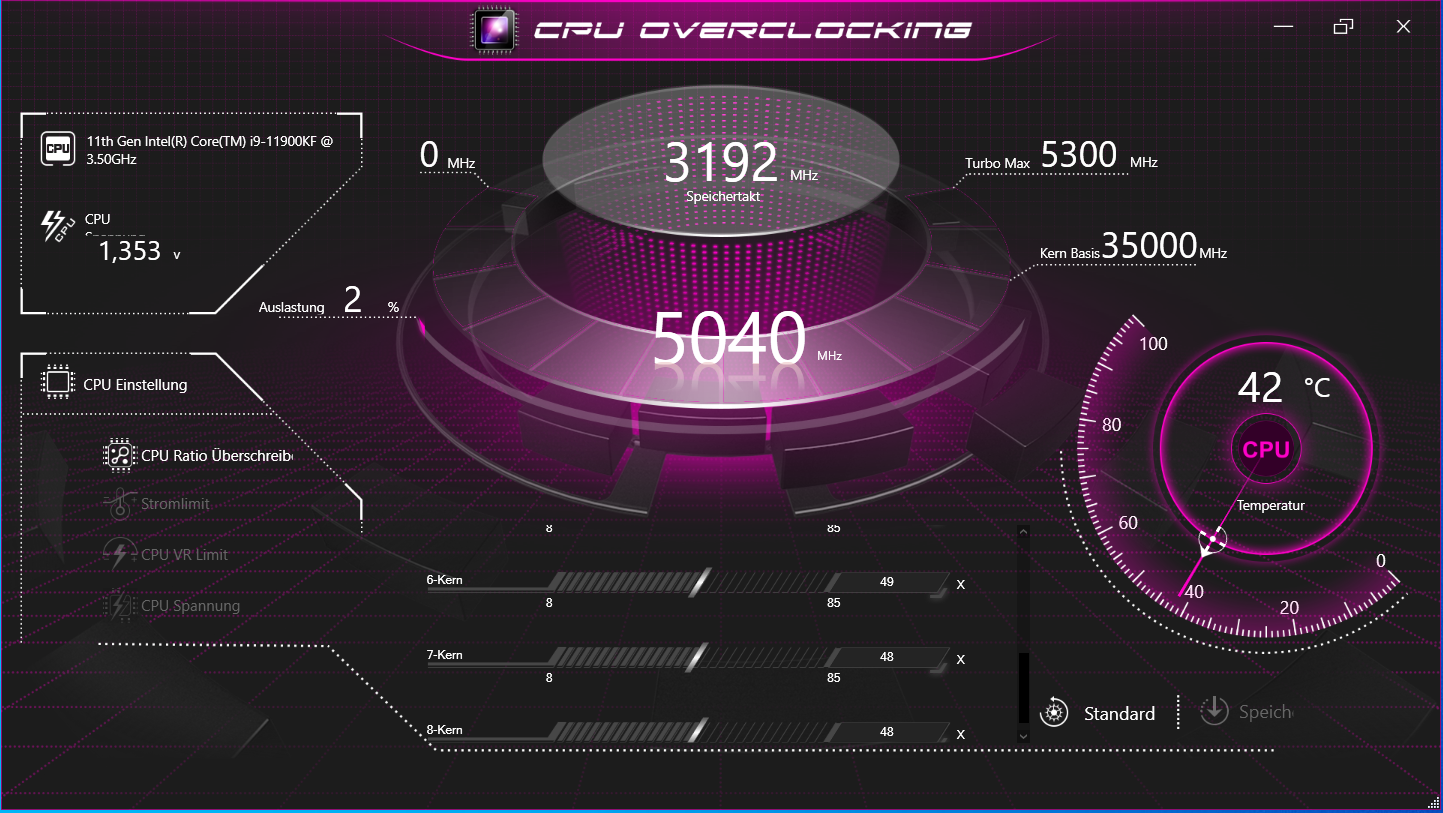
Processore
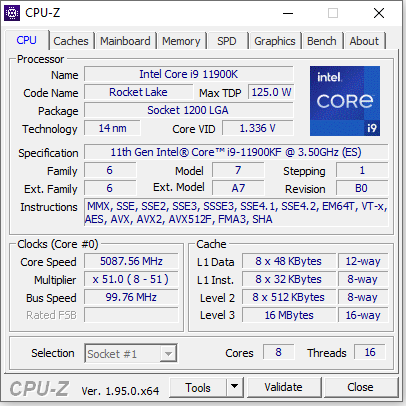
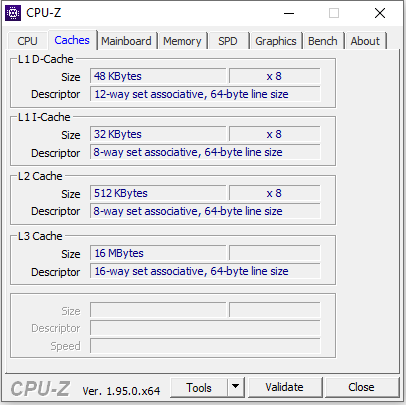
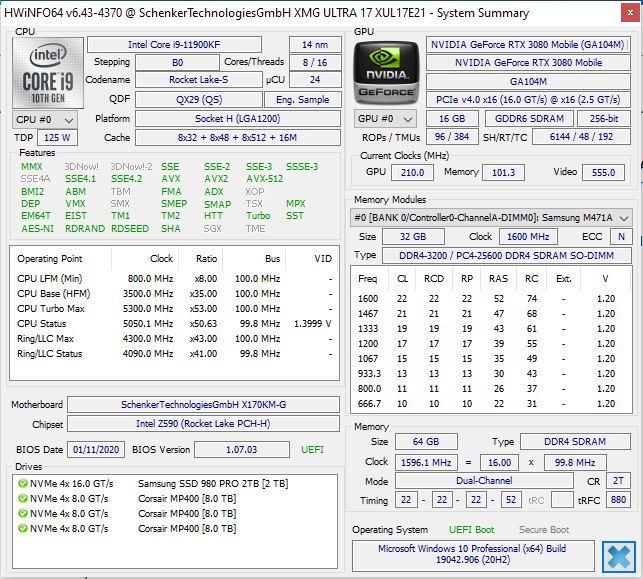
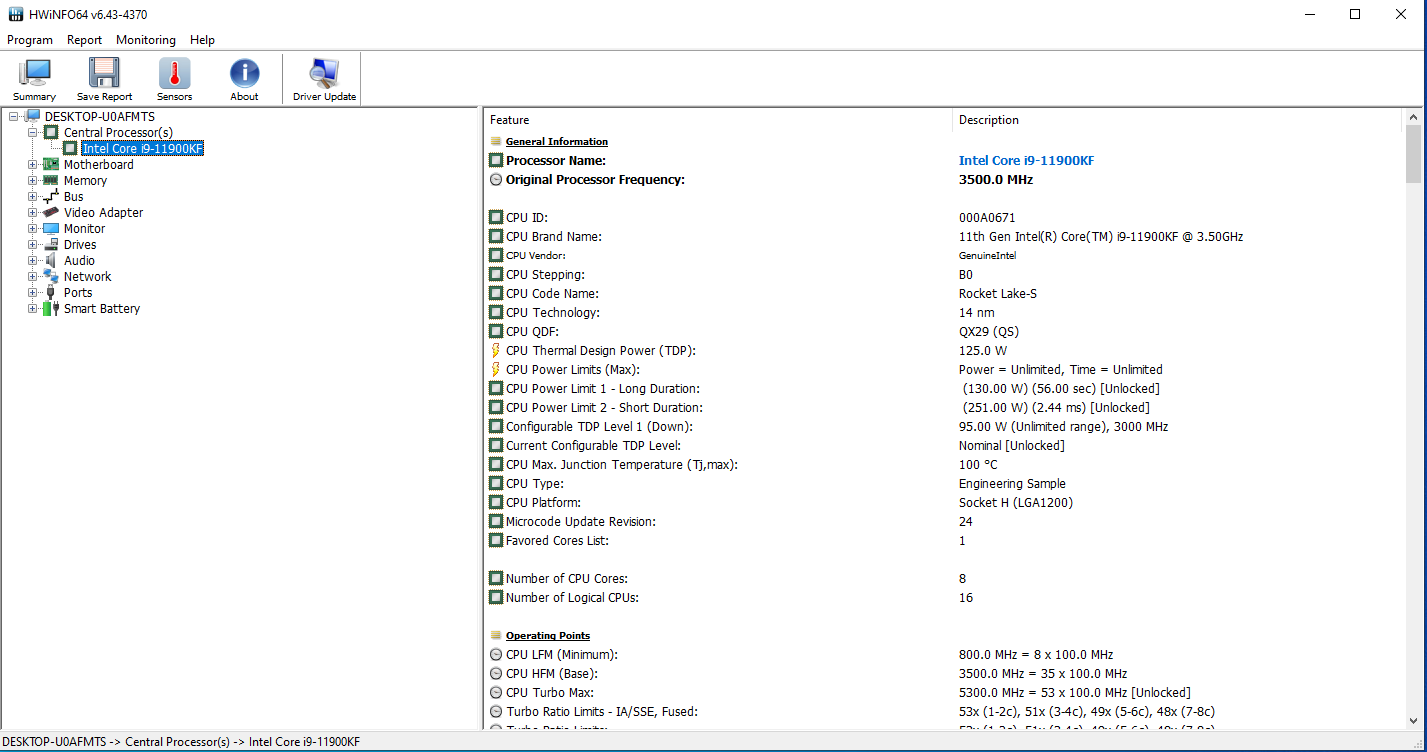
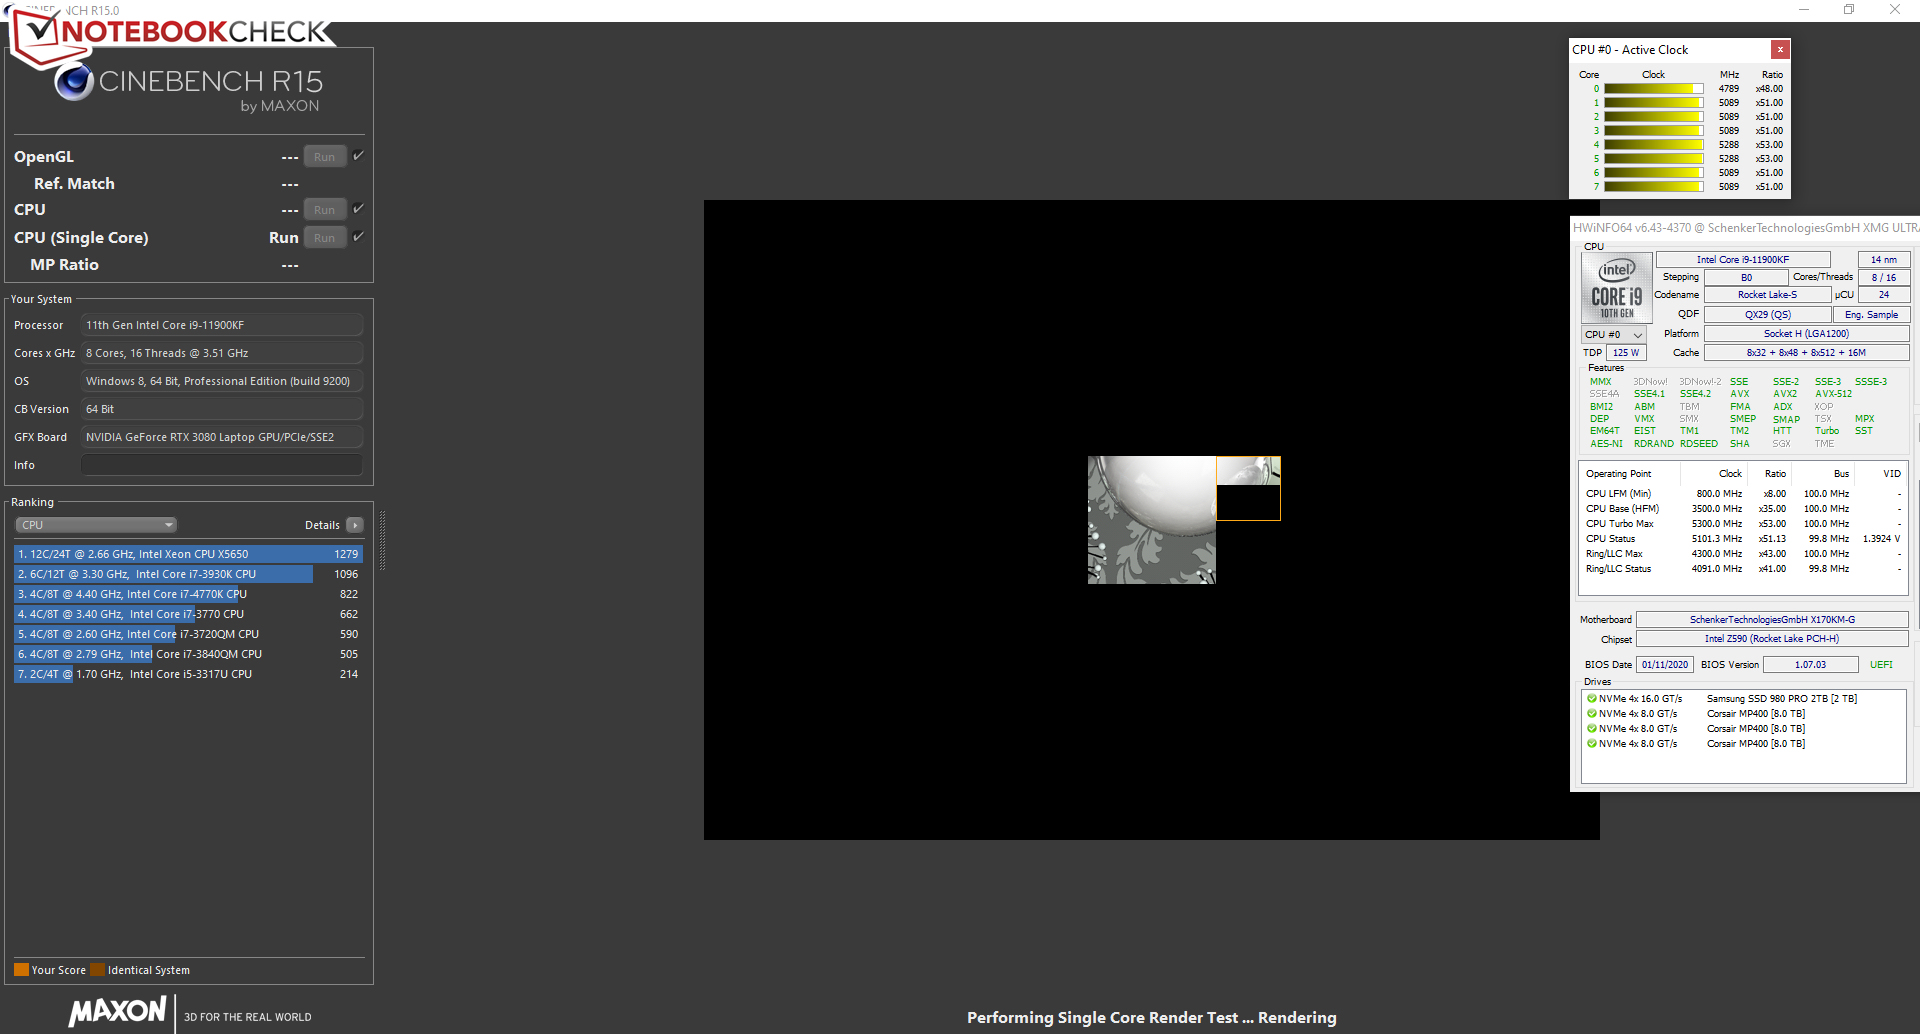
Il Core-i9-11900Ka otto cores (Rocket Lake) lavora con un clock di base di 3,5 GHz. Il clock può essere aumentato a 4,8 GHz (otto cores) fino a 5,3 GHz (single core) tramite Turbo. L'hyperthreading (due threads per core) è supportato. Grazie al moltiplicatore sbloccato, il processore potrebbe essere overcloccato abbastanza facilmente. La CPU è in un socket e potrebbe quindi essere sostituita.
I test della CPU del benchmark Cinebench R15 sono eseguiti con 4.6 a 4.8 GHz (multi-thread) e 4.8 a 5.3 GHz (single-thread). Usando la batteria, la CPU funziona da 800 MHz a 4.8 GHz (multi-thread) o da 3.6 a 5.1 GHz (single-thread).
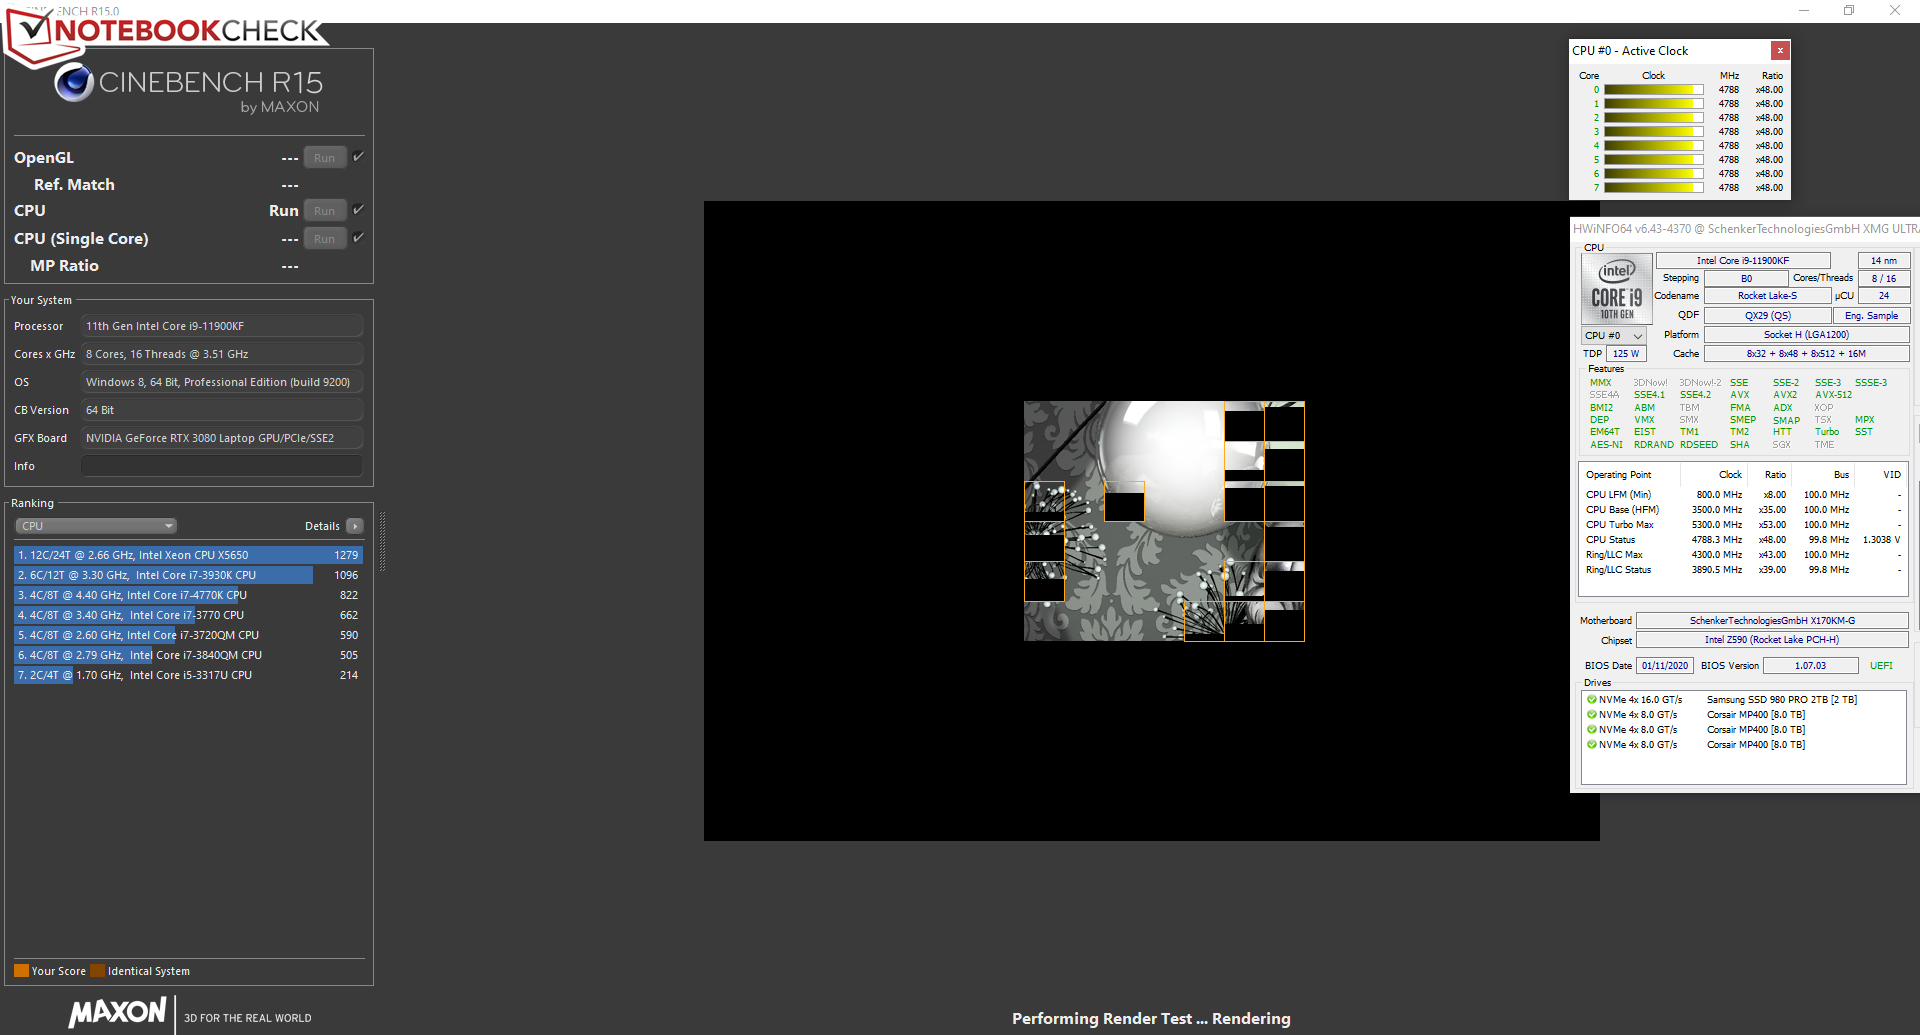
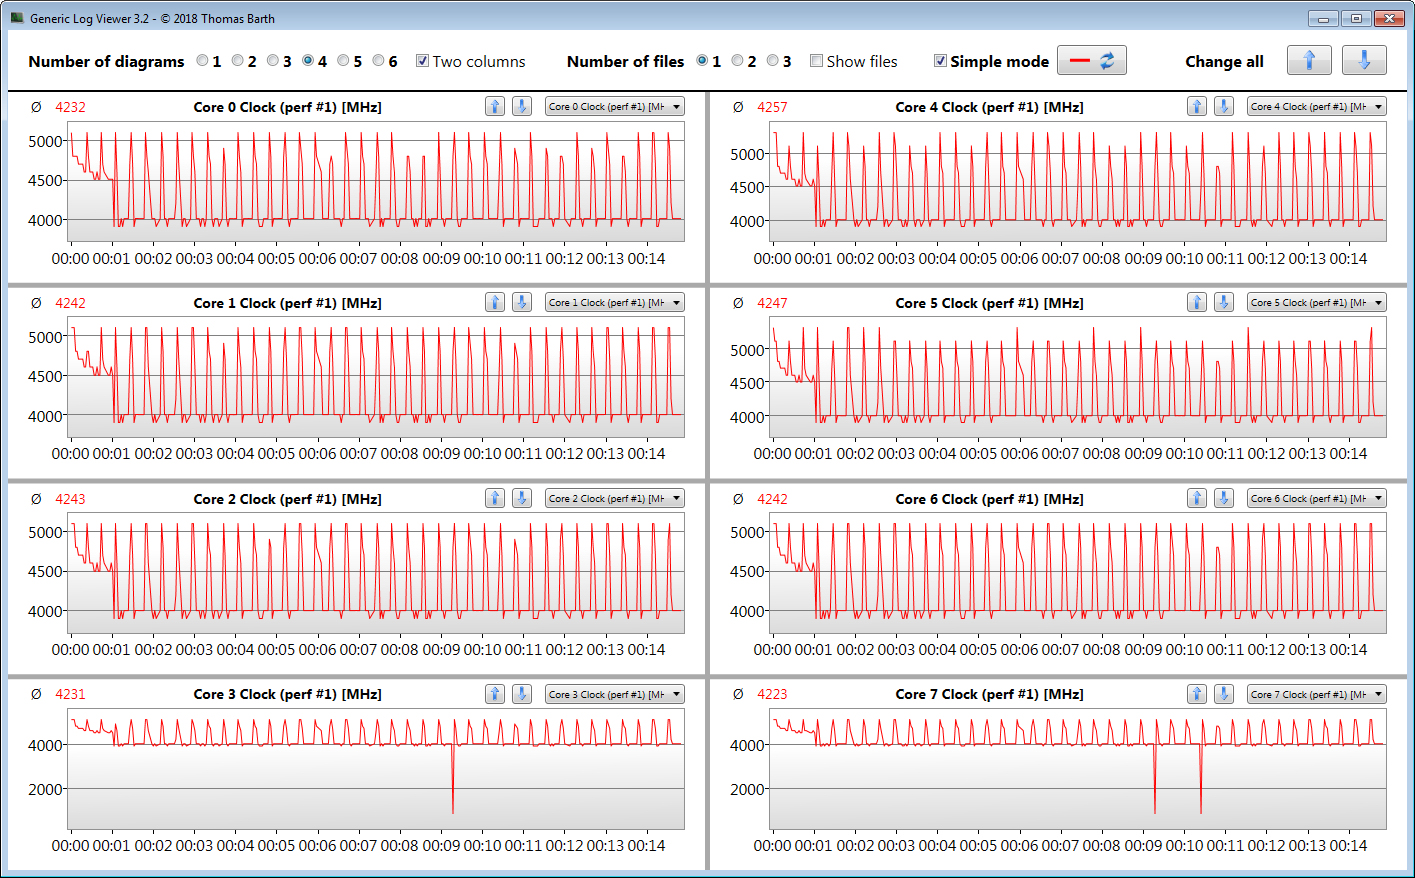
Controlliamo se la CPU Turbo è usata permanentemente anche con l'alimentazione da rete elettrica eseguendo il test multi-thread del benchmark Cinebench R15 in un ciclo. Si raggiungono velocità elevate entro il primo minuto del test. Poi, il clock scende a valori intorno ai 4 GHz.
Rocket Lake fa una buona impressione. Intel è stata in grado di aumentare le prestazioni per-MHz in modo significativo. Come risultato, la mancanza di due core della CPU rispetto al predecessore Comet Lake (Core i9-10900K) può essere compensatain una certa misura nelle applicazioni multi-thread. L'11900Kpuò mettersi in mostra in termini di prestazioni single-thread.Qui è invantaggio rispetto al suo predecessore.
* ... Meglio usare valori piccoli
Prestazioni del sistema
Il fatto che non manchi la potenza di calcolo non dovrebbe essere sorprendente in considerazione dell'equipaggiamento hardware. Il portatile è impressionante in tutte le aree di applicazione comuni. I risultati PCMark molto buoni lo confermano.
| PCMark 8 Home Score Accelerated v2 | 5529 punti | |
| PCMark 8 Creative Score Accelerated v2 | 7020 punti | |
| PCMark 8 Work Score Accelerated v2 | 6151 punti | |
| PCMark 10 Score | 7884 punti | |
Aiuto | ||
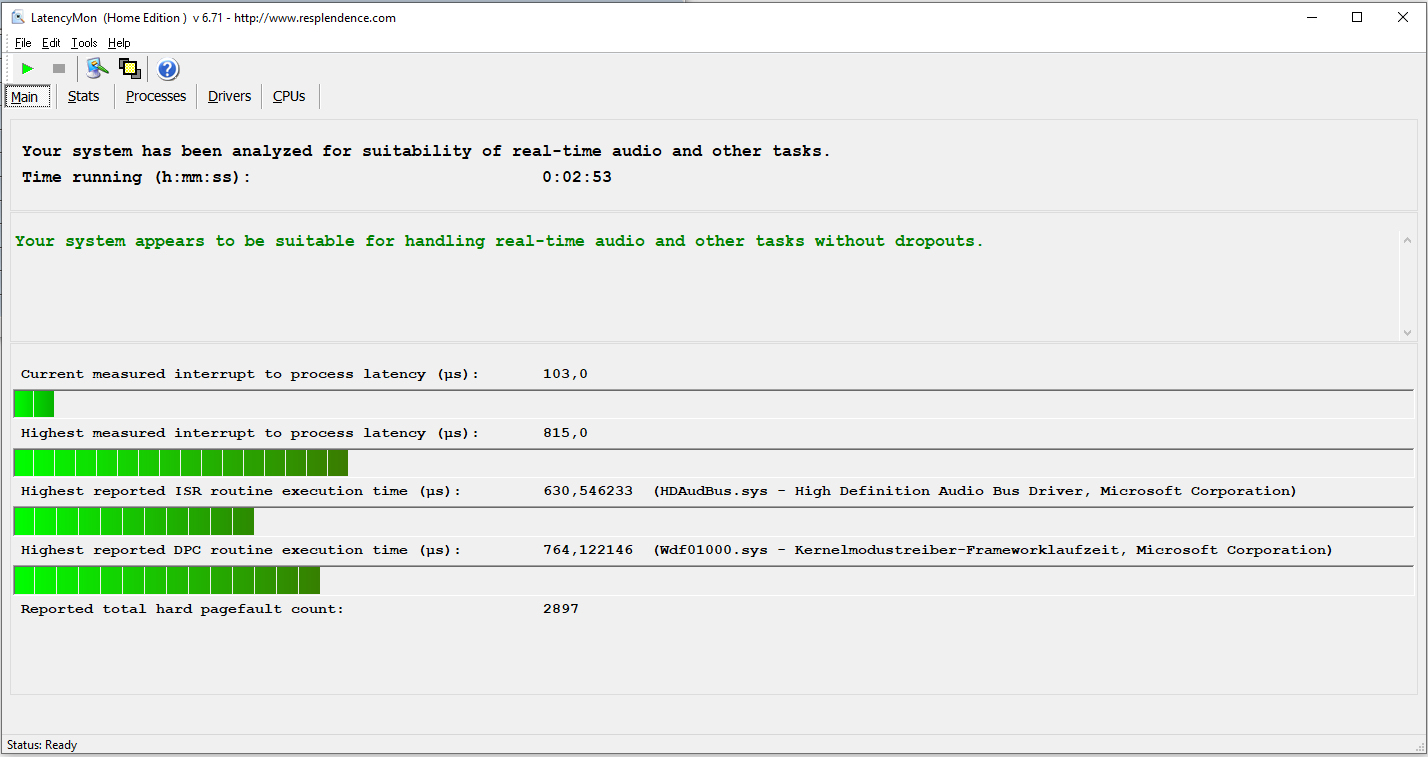
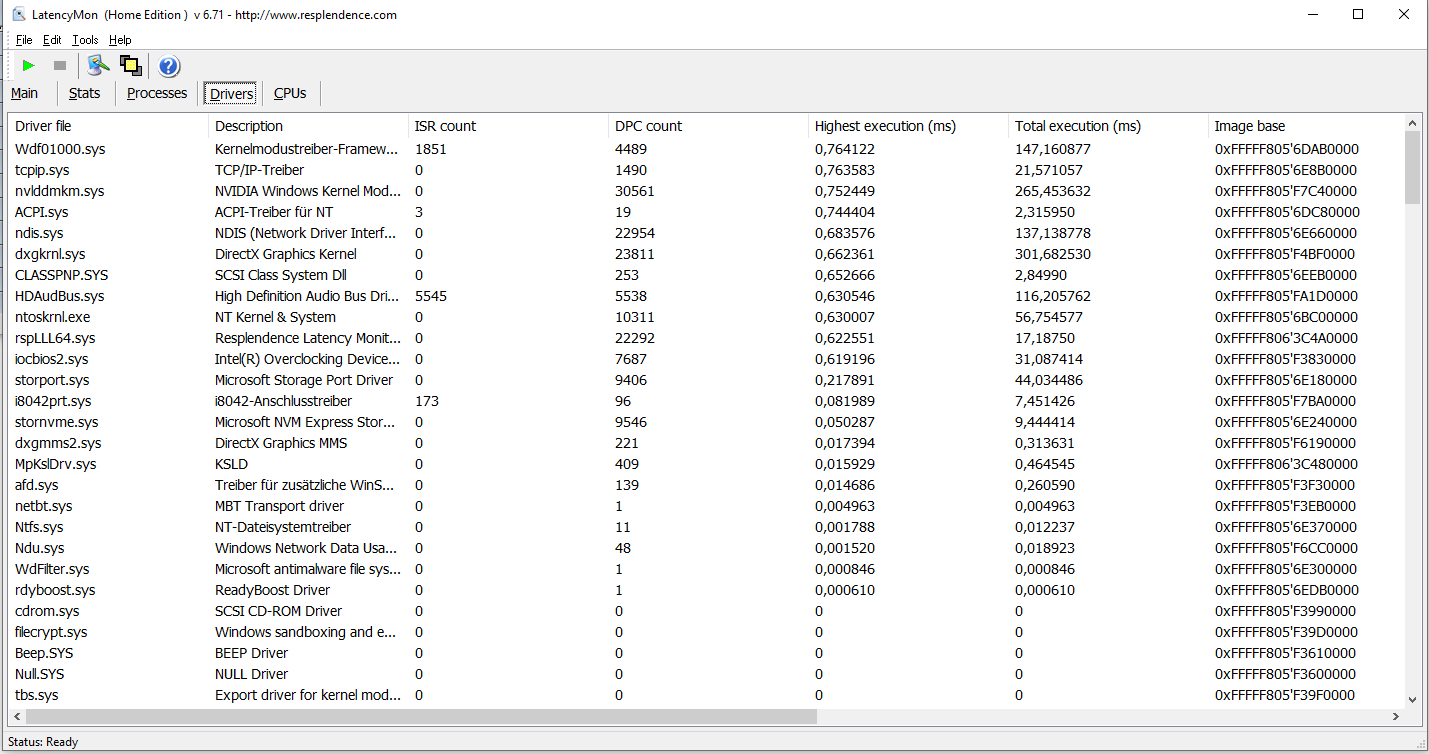
Latenze DPC
Nel nostro test standardizzato di monitoraggio della latenza (navigazione web, riproduzione video 4K, Prime95 high-load), non abbiamo osservato alcuna anomalia nelle latenze DPC. Il sistema sembra essere adatto per l'editing video e audio in tempo reale.
| DPC Latencies / LatencyMon - interrupt to process latency (max), Web, Youtube, Prime95 | |
| MSI GT76 Titan DT 10SGS | |
| Asus Strix Scar 17 G732LXS | |
| Schenker XMG Ultra 17 Rocket Lake | |
| Alienware m17 R4 | |
| Schenker XMG Ultra 17 Comet Lake | |
* ... Meglio usare valori piccoli
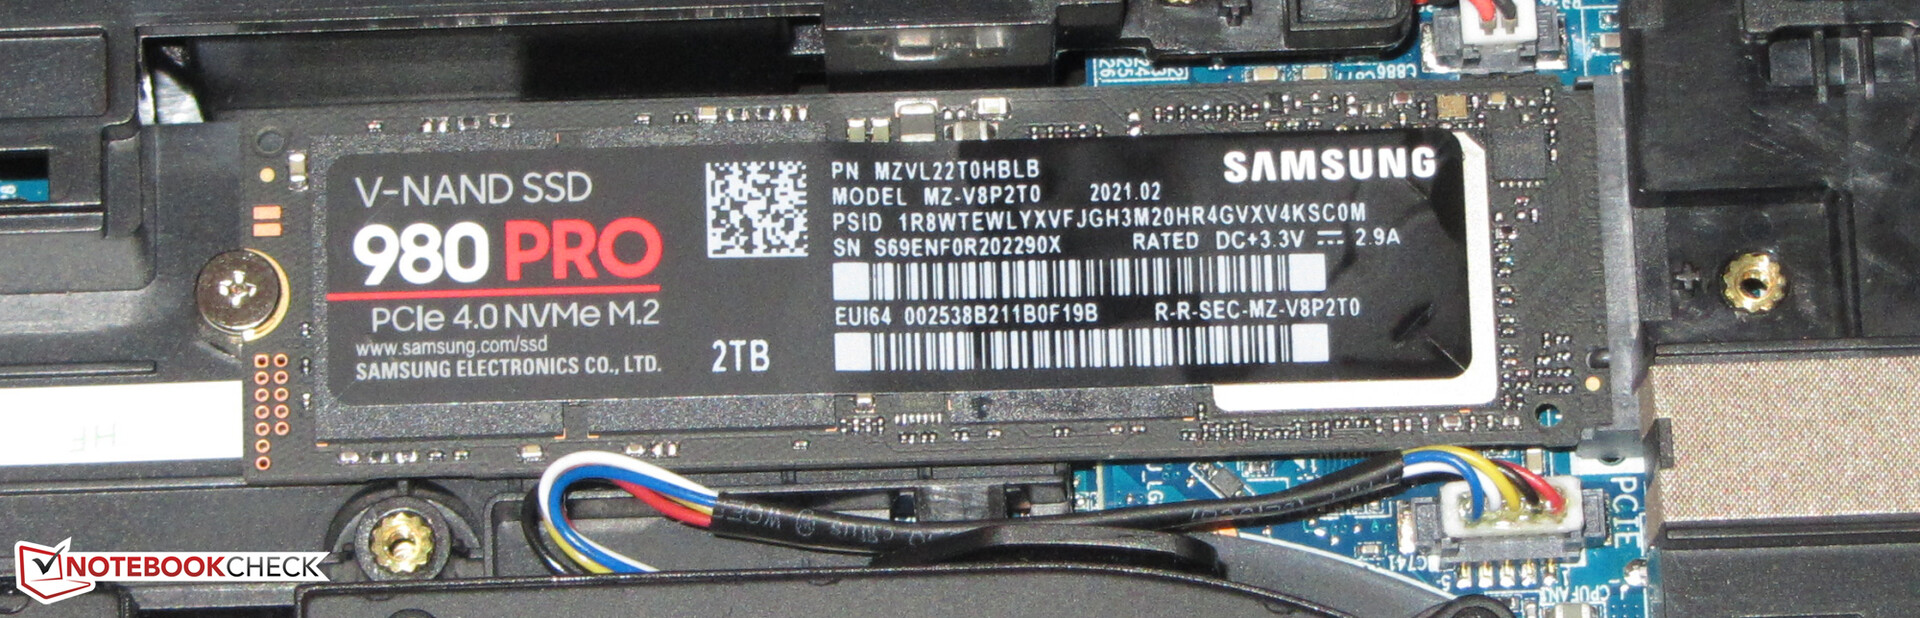
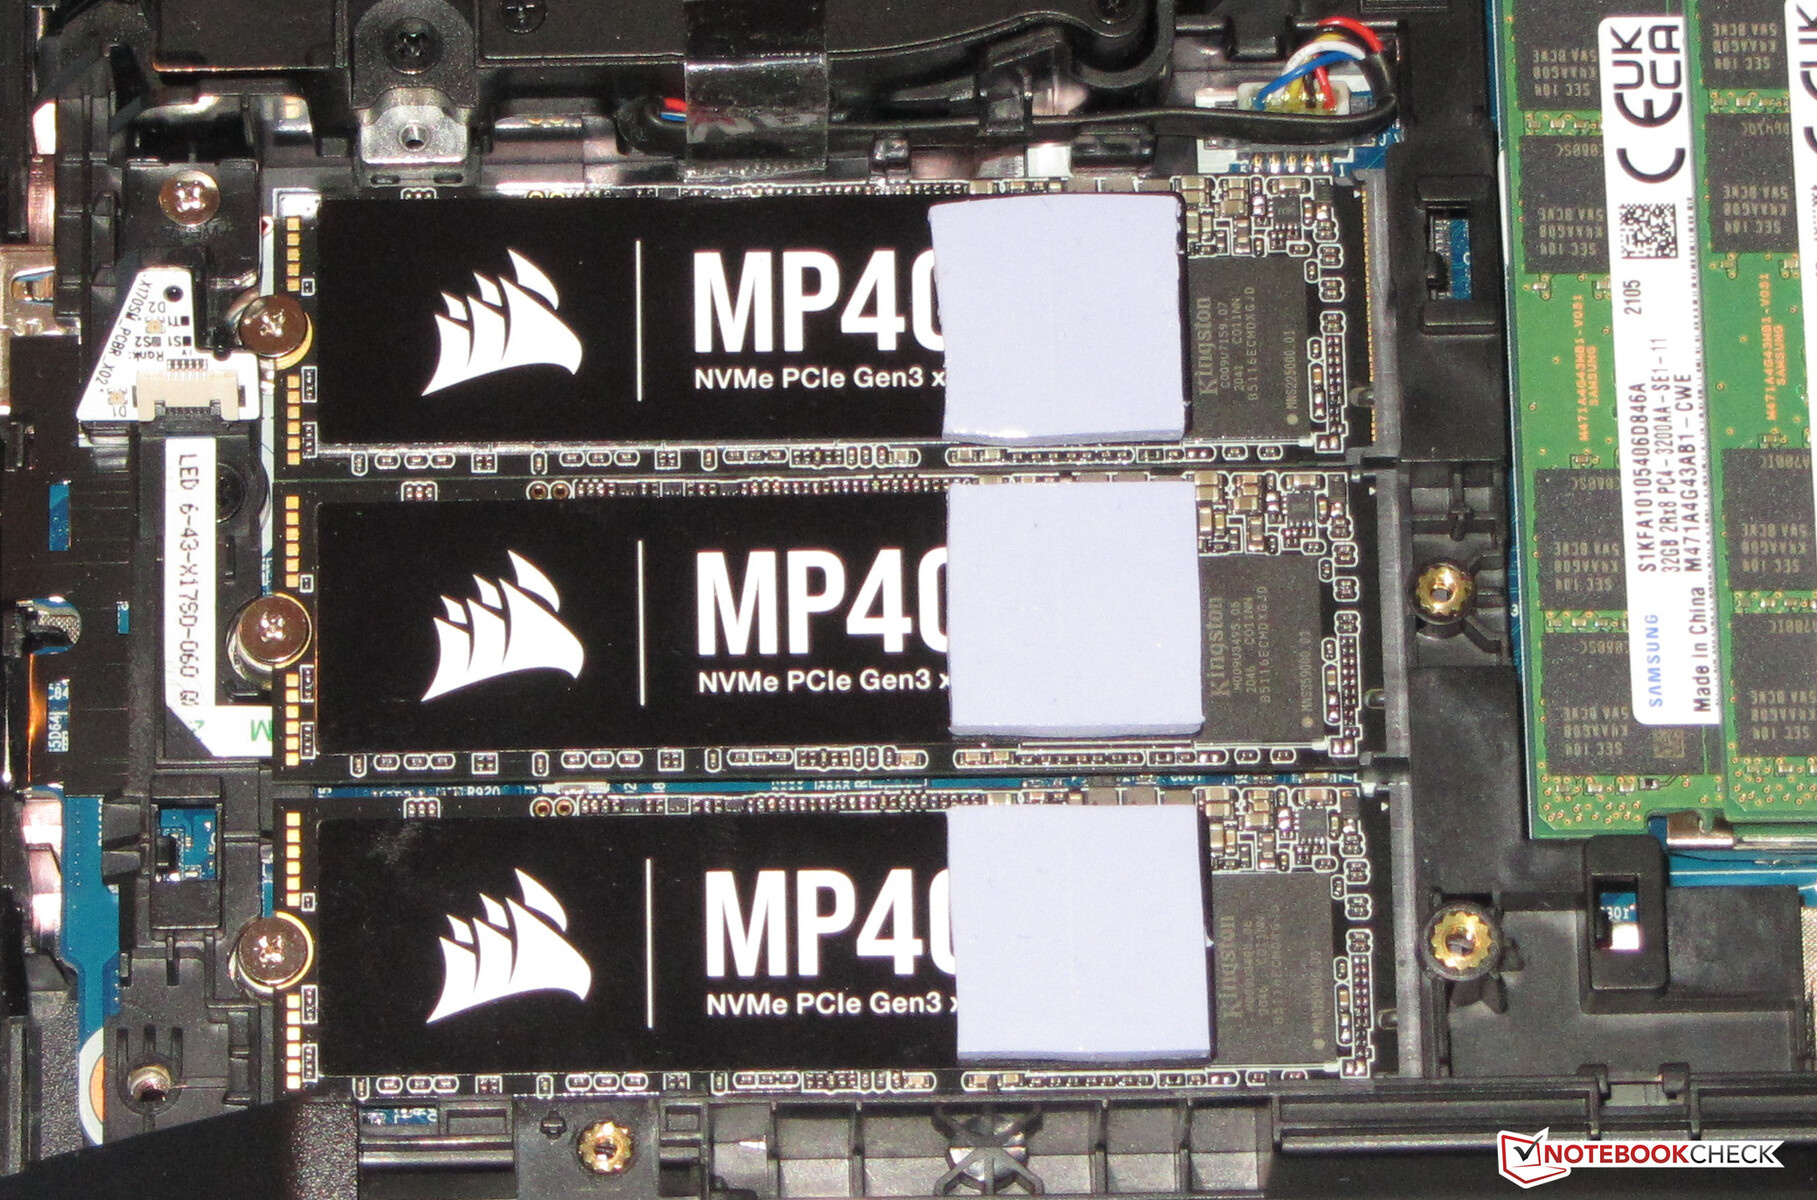
Archiviazione di massa
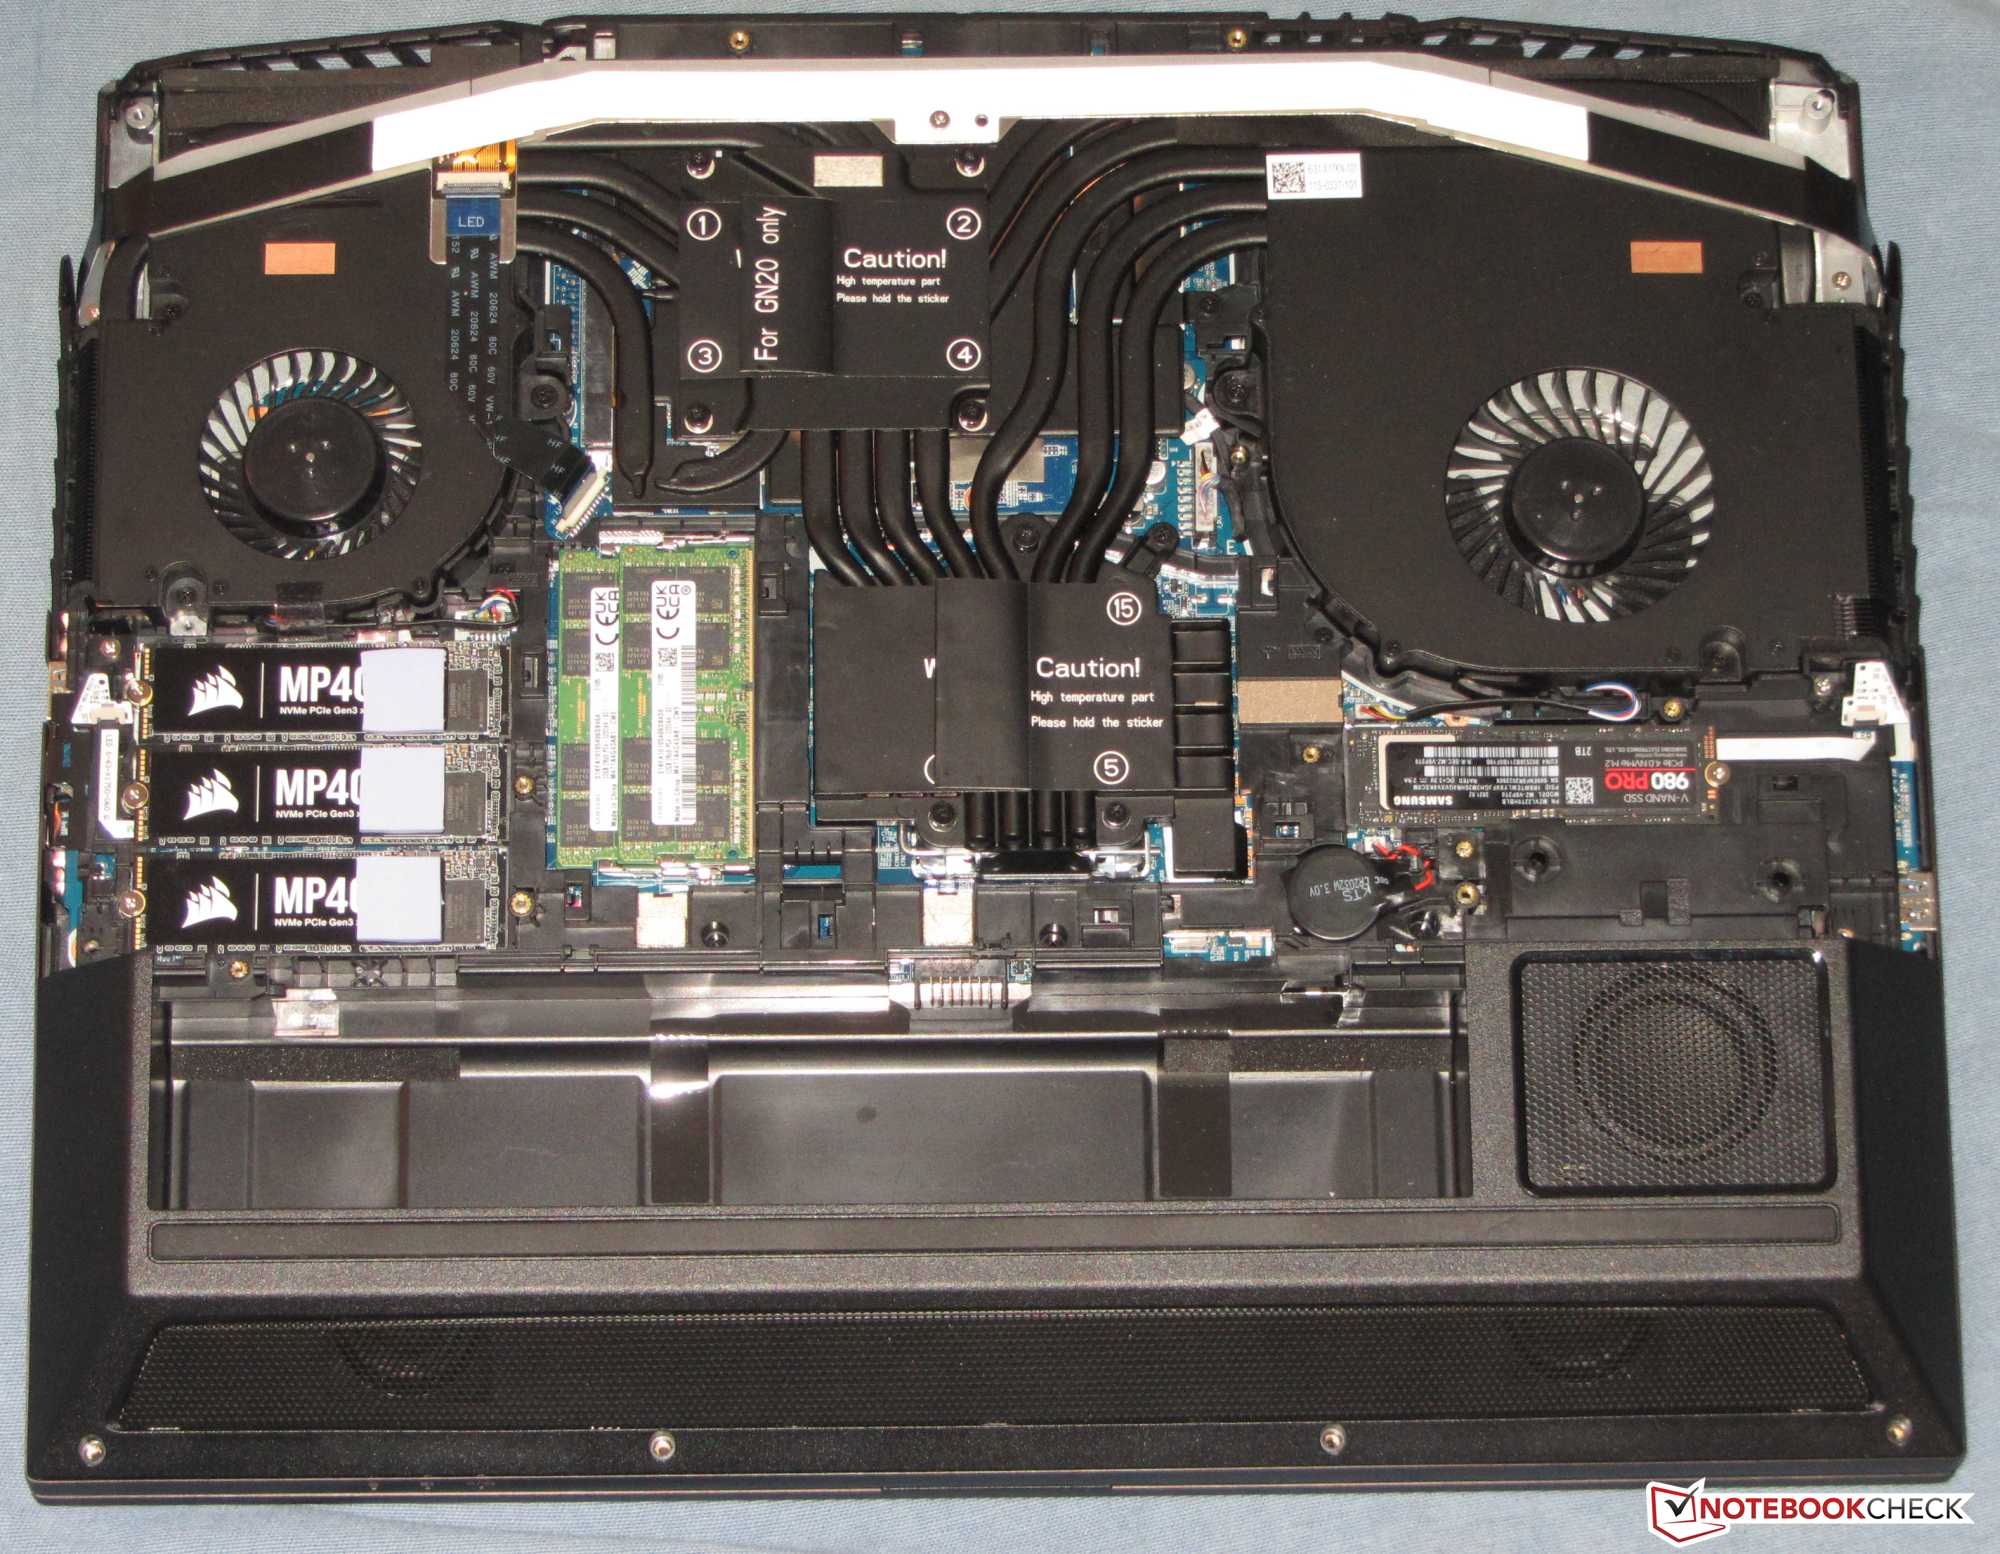
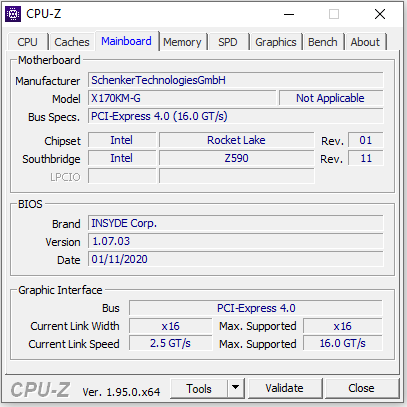
Un SSD NVMe (M.2-2280) di Samsung serve come unità di sistema. Fornisce 2 TB di spazio di archiviazione e offre eccellenti velocità di trasferimento grazie alla connessione PCI Express 4. Il notebook ha tre slots M.2-2280 aggiuntivi che possono essere equipaggiati con SSD NVMe (connessione via PCI Express 3.0). Due dei tre slots possono in alternativa ospitare SSD SATA. Il RAID 0/1/5 è supportato.

| Schenker XMG Ultra 17 Rocket Lake Samsung SSD 980 Pro 2TB MZ-V8P2T0 | MSI GT76 Titan DT 10SGS 2x WDC PC SN730 SDBPNTY-1T00 (RAID 0) | Asus Strix Scar 17 G732LXS 2x Intel SSD 660p 1TB SSDPEKNW010T8 (RAID 0) | Schenker XMG Ultra 17 Comet Lake Samsung SSD 970 EVO Plus 2TB | Alienware m17 R4 2x Micron 2300 512 GB (RAID 0) | |
|---|---|---|---|---|---|
| CrystalDiskMark 5.2 / 6 | -42% | -48% | -35% | -42% | |
| Write 4K (MB/s) | 240 | 116.4 -51% | 125.8 -48% | 172 -28% | 93.1 -61% |
| Read 4K (MB/s) | 87.8 | 43.85 -50% | 52.9 -40% | 47.3 -46% | 46.79 -47% |
| Write Seq (MB/s) | 4281 | 2927 -32% | 1795 -58% | 2980 -30% | 2853 -33% |
| Read Seq (MB/s) | 4228 | 1997 -53% | 2315 -45% | 2790 -34% | 2556 -40% |
| Write 4K Q32T1 (MB/s) | 696 | 467.6 -33% | 407.1 -42% | 481.8 -31% | 475 -32% |
| Read 4K Q32T1 (MB/s) | 778 | 538 -31% | 411.9 -47% | 565 -27% | 529 -32% |
| Write Seq Q32T1 (MB/s) | 5195 | 3362 -35% | 2844 -45% | 3295 -37% | 3331 -36% |
| Read Seq Q32T1 (MB/s) | 7099 | 3558 -50% | 3130 -56% | 3550 -50% | 3319 -53% |
| AS SSD | -52% | -54% | -16% | -53% | |
| Seq Read (MB/s) | 5010 | 2406 -52% | 2450 -51% | 2980 -41% | 2733 -45% |
| Seq Write (MB/s) | 3974 | 2867 -28% | 1436 -64% | 2585 -35% | 2822 -29% |
| 4K Read (MB/s) | 51.9 | 41.51 -20% | 49.48 -5% | 52.7 2% | 45.04 -13% |
| 4K Write (MB/s) | 156.8 | 108.8 -31% | 119.4 -24% | 163.1 4% | 88.4 -44% |
| 4K-64 Read (MB/s) | 2611 | 1525 -42% | 1032 -60% | 1954 -25% | 1388 -47% |
| 4K-64 Write (MB/s) | 3859 | 1424 -63% | 1229 -68% | 2347 -39% | 1227 -68% |
| Access Time Read * (ms) | 0.072 | 0.041 43% | 0.145 -101% | 0.039 46% | 0.079 -10% |
| Access Time Write * (ms) | 0.026 | 0.102 -292% | 0.036 -38% | 0.023 12% | 0.095 -265% |
| Score Read (Points) | 3164 | 1807 -43% | 1327 -58% | 2304 -27% | 1706 -46% |
| Score Write (Points) | 4414 | 1819 -59% | 1492 -66% | 2768 -37% | 1598 -64% |
| Score Total (Points) | 9134 | 4573 -50% | 3456 -62% | 6232 -32% | 4184 -54% |
| Copy ISO MB/s (MB/s) | 3424 | 2605 -24% | 2414 -29% | ||
| Copy Program MB/s (MB/s) | 1091 | 651 -40% | 1030 -6% | ||
| Copy Game MB/s (MB/s) | 2365 | 1709 -28% | 1991 -16% | ||
| Media totale (Programma / Settaggio) | -47% /
-48% | -51% /
-51% | -26% /
-24% | -48% /
-49% |
* ... Meglio usare valori piccoli
Carico di lettura continuo: DiskSpd Read Loop, Queue Depth 8
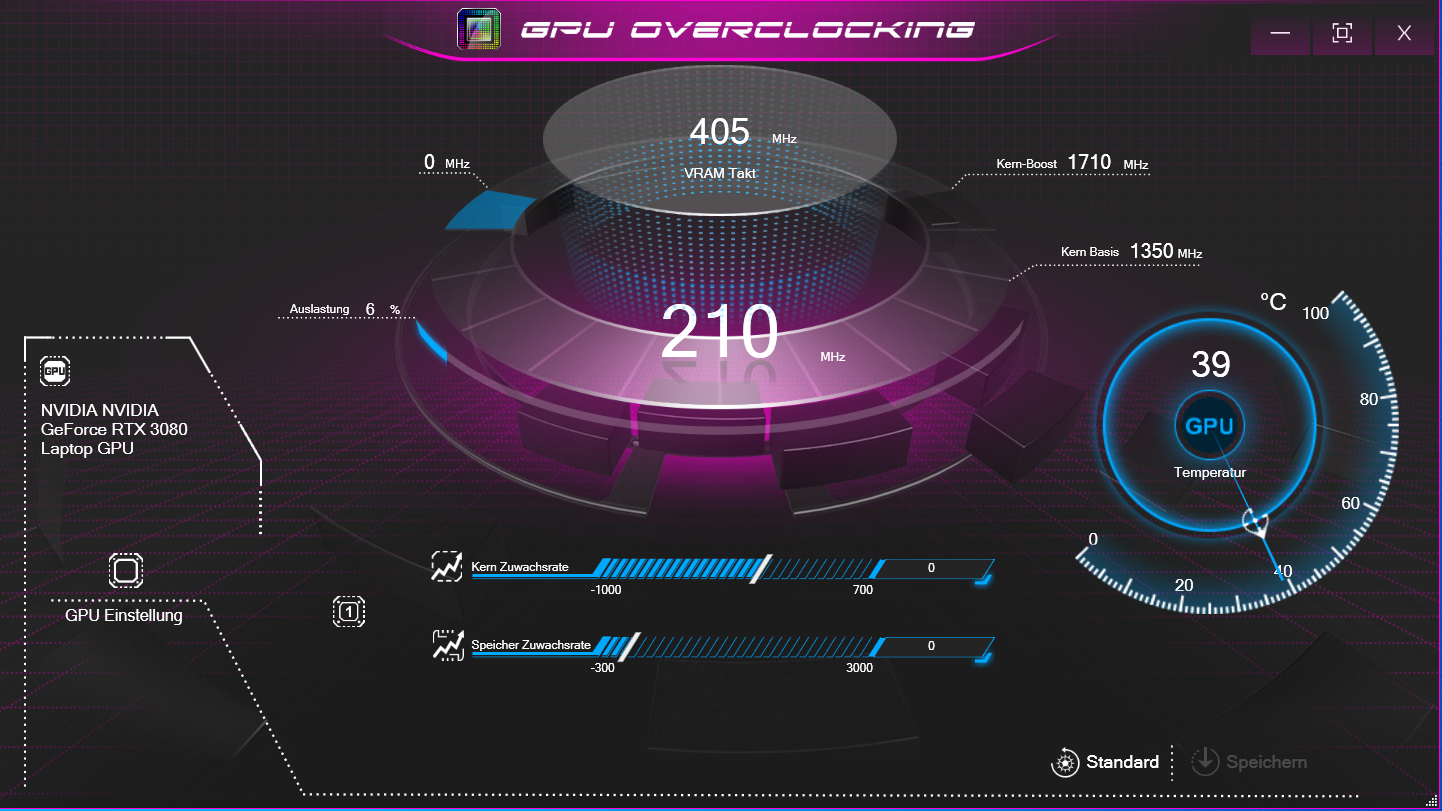
Scheda grafica
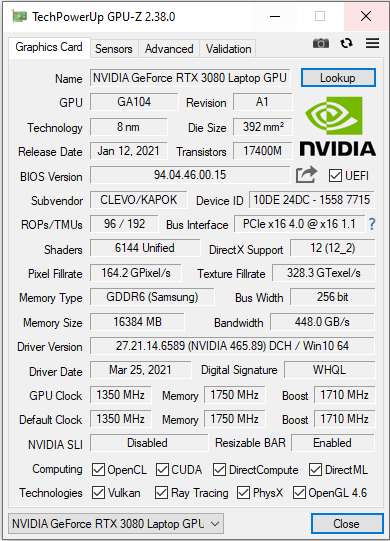
La GeForce RTX-3080 laptop rappresenta la GPU per notebook attualmente più potente di Nvidia. Può attingere alla veloce memoria grafica GDDR6 (16.384 MB). GPU e memoria non sono saldate in modo permanente alla scheda madre, ma si trovano su una scheda plug-in MXM. La sostituzione della scheda sarebbe possibile. Il processore GPU integrato UHD Graphics Xe-750-32EUs è disabilitato in fabbrica e il notebook non funziona con la soluzione grafica switching Optimus di Nvidia.
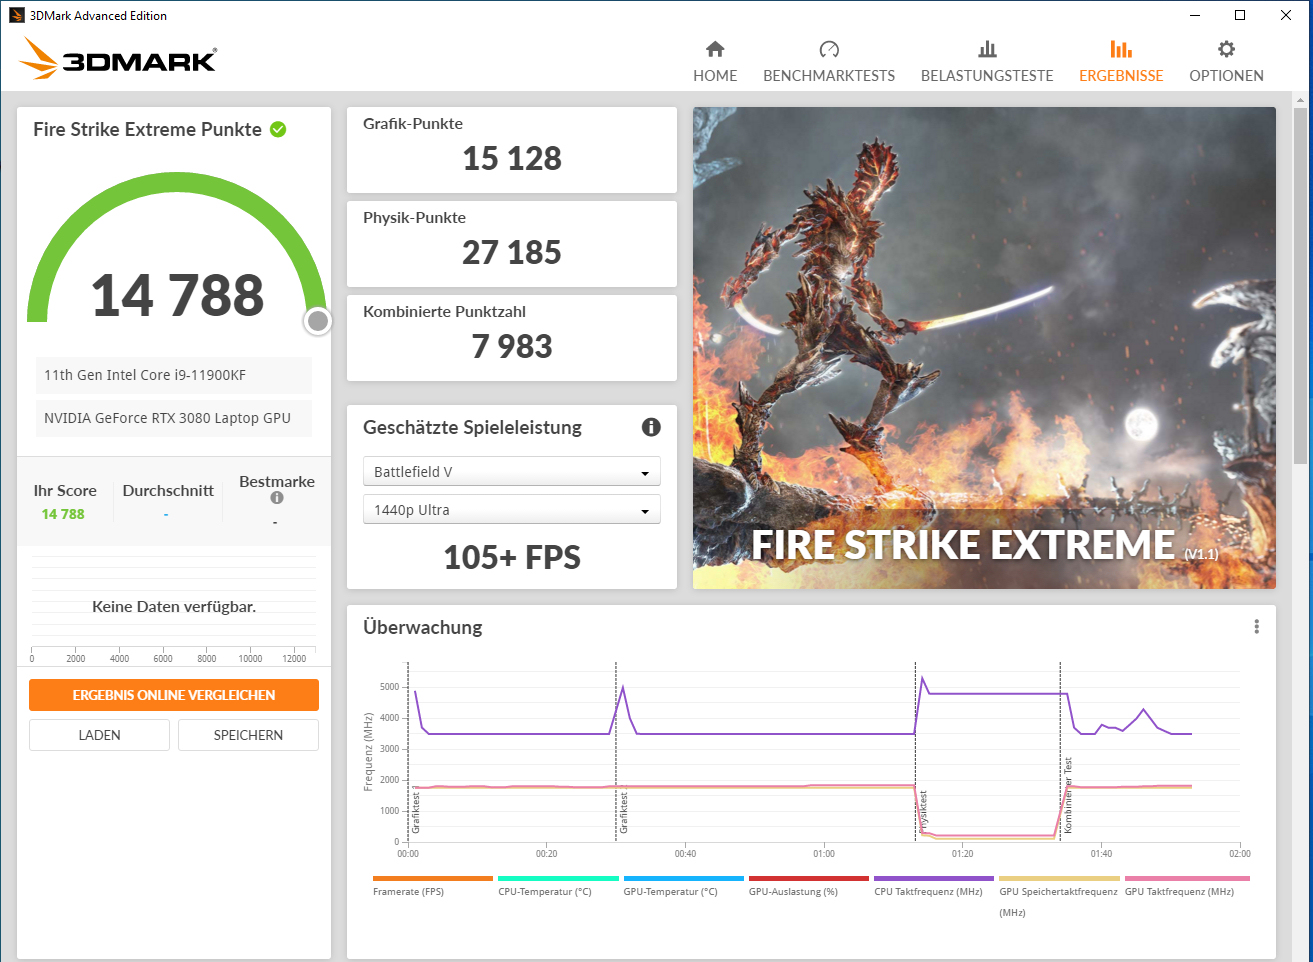
I produttori di notebooks possono scegliere il TGP e quindi la massima potenza di calcolo disponibile di un core grafico RTX-3000 abbastanza liberamente entro i limiti definiti da Nvidia (Panoramica di tutti i portatili RTX-3080 compresi i TGP) Schenker sceglie il massimo di 165 watt (150 watt + 15 watt Dynamic Boost). Di conseguenza, l'Ultra17 si comporta molto bene nei test di GPU e di gaming.
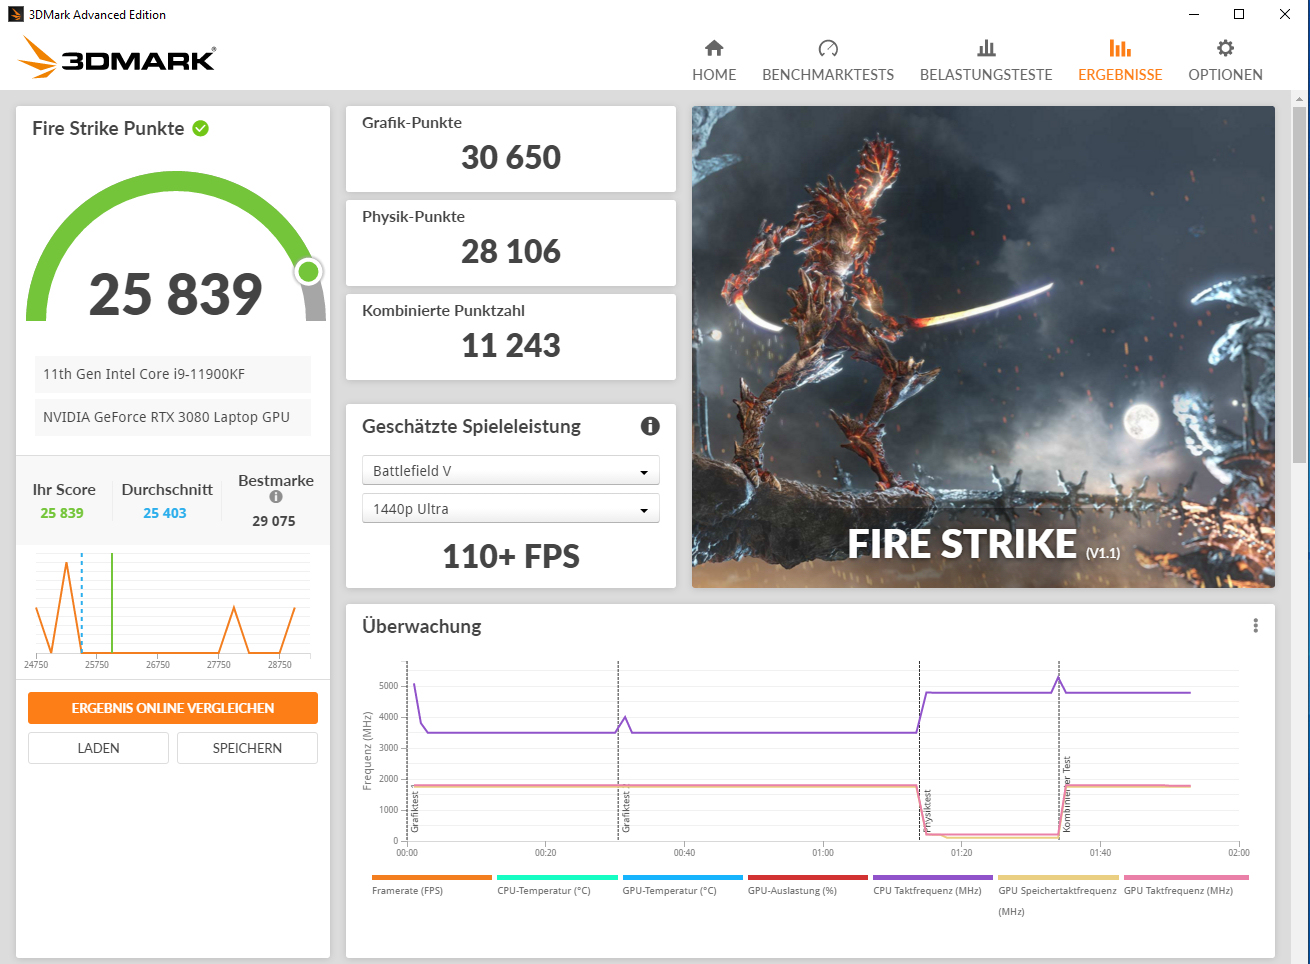
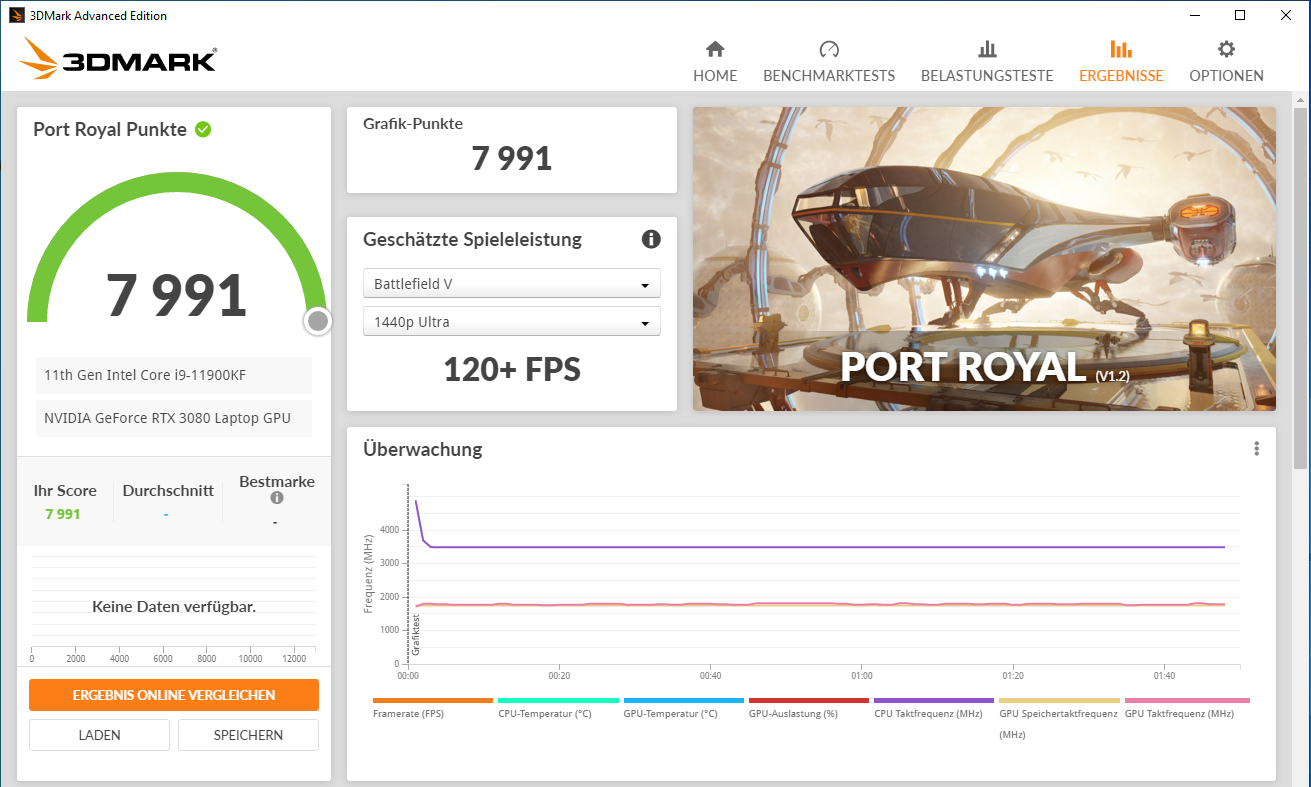
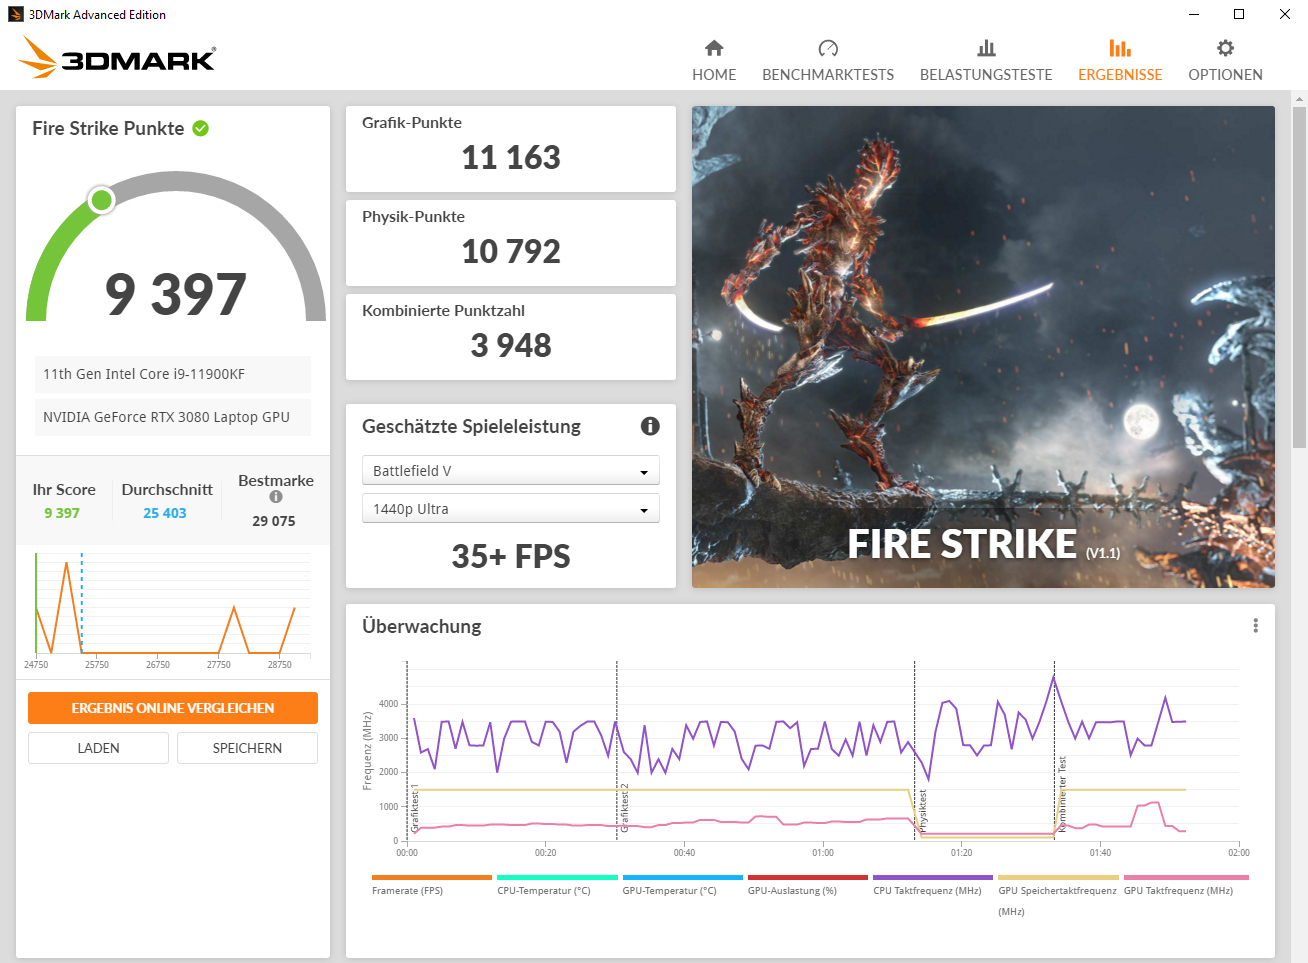
| 3DMark 11 Performance | 32922 punti | |
| 3DMark Cloud Gate Standard Score | 65479 punti | |
| 3DMark Fire Strike Score | 25839 punti | |
| 3DMark Fire Strike Extreme Score | 14788 punti | |
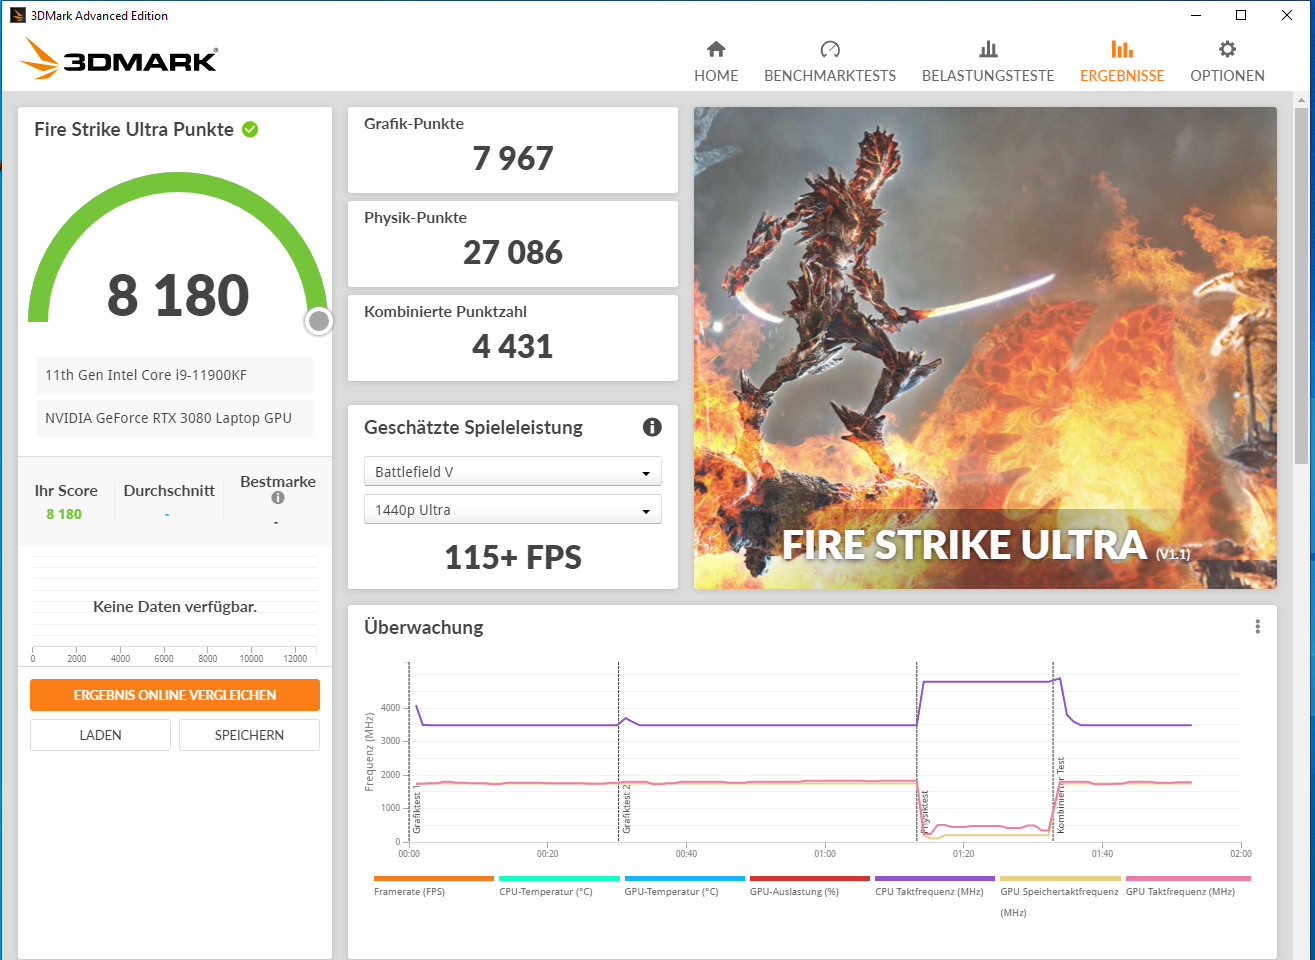
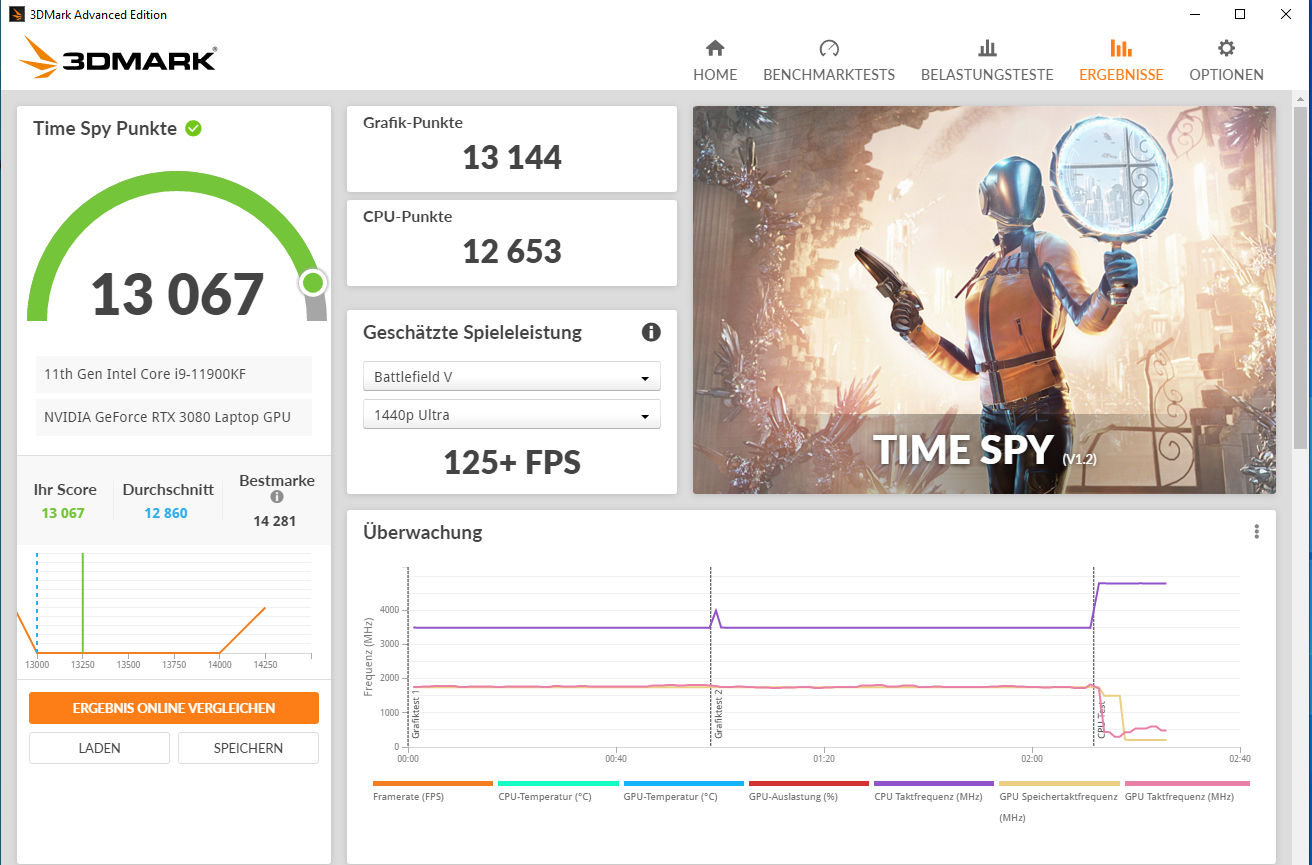
| 3DMark Time Spy Score | 13067 punti | |
Aiuto | ||
Prestazioni gaming
Questo computer portatile gestisce tutti i giochi attuali senza problemi sullo schermo. Di solito, la risoluzione FHD e le impostazioni di qualità massima possono essere selezionate. Risoluzioni più alte (un monitor corrispondente dovrebbe essere collegato per questo) sono anche gestite dalla GPU.
| The Witcher 3 - 1920x1080 Ultra Graphics & Postprocessing (HBAO+) | |
| Media della classe Gaming (104.7 - 240, n=7, ultimi 2 anni) | |
| Schenker XMG Ultra 17 Rocket Lake | |
| Alienware m17 R4 | |
| MSI GT76 Titan DT 10SGS | |
| Schenker XMG Ultra 17 Comet Lake | |
| Media NVIDIA GeForce RTX 3080 Laptop GPU (85.1 - 123, n=40) | |
| Asus Strix Scar 17 G732LXS | |
| Far Cry 5 - 1920x1080 Ultra Preset AA:T | |
| Schenker XMG Ultra 17 Rocket Lake | |
| Alienware m17 R4 | |
| Media della classe Gaming (70 - 151, n=6, ultimi 2 anni) | |
| Media NVIDIA GeForce RTX 3080 Laptop GPU (75 - 146, n=33) | |
| Shadow of the Tomb Raider - 1920x1080 Highest Preset AA:T | |
| Schenker XMG Ultra 17 Rocket Lake | |
| Schenker XMG Ultra 17 Comet Lake | |
| Asus Strix Scar 17 G732LXS | |
| Media NVIDIA GeForce RTX 3080 Laptop GPU (76.6 - 151, n=13) | |
| Media della classe Gaming (96 - 116, n=2, ultimi 2 anni) | |
| Doom Eternal - 1920x1080 Ultra Preset | |
| Schenker XMG Ultra 17 Comet Lake | |
| Asus Strix Scar 17 G732LXS | |
| Schenker XMG Ultra 17 Rocket Lake | |
| Media NVIDIA GeForce RTX 3080 Laptop GPU (163 - 190, n=4) | |
| Serious Sam 4 - 1920x1080 Ultra (DX12) AA:2xMS | |
| Schenker XMG Ultra 17 Rocket Lake | |
| Schenker XMG Ultra 17 Comet Lake | |
| Media NVIDIA GeForce RTX 3080 Laptop GPU (72.6 - 107, n=5) | |
| Cyberpunk 2077 1.0 | |
| 1920x1080 Ultra Preset | |
| Schenker XMG Ultra 17 Rocket Lake | |
| Alienware m17 R4 | |
| Media NVIDIA GeForce RTX 3080 Laptop GPU (52.9 - 84.3, n=9) | |
| 1920x1080 Ray Tracing Ultra Preset (DLSS off) | |
| Schenker XMG Ultra 17 Rocket Lake | |
| Alienware m17 R4 | |
| Media NVIDIA GeForce RTX 3080 Laptop GPU (30.6 - 43.2, n=5) | |
| Watch Dogs Legion | |
| 1920x1080 Ultra Preset (DX12) | |
| Schenker XMG Ultra 17 Rocket Lake | |
| Media NVIDIA GeForce RTX 3080 Laptop GPU (65 - 91.1, n=6) | |
| 1920x1080 Ultra Preset + Ultra Ray Tracing (DX12) | |
| Schenker XMG Ultra 17 Rocket Lake | |
| Media NVIDIA GeForce RTX 3080 Laptop GPU (41 - 61, n=6) | |
| Hitman 3 - 1920x1080 Maximum Settings AF:16x | |
| Schenker XMG Ultra 17 Rocket Lake | |
| Media NVIDIA GeForce RTX 3080 Laptop GPU (129.1 - 201, n=3) | |
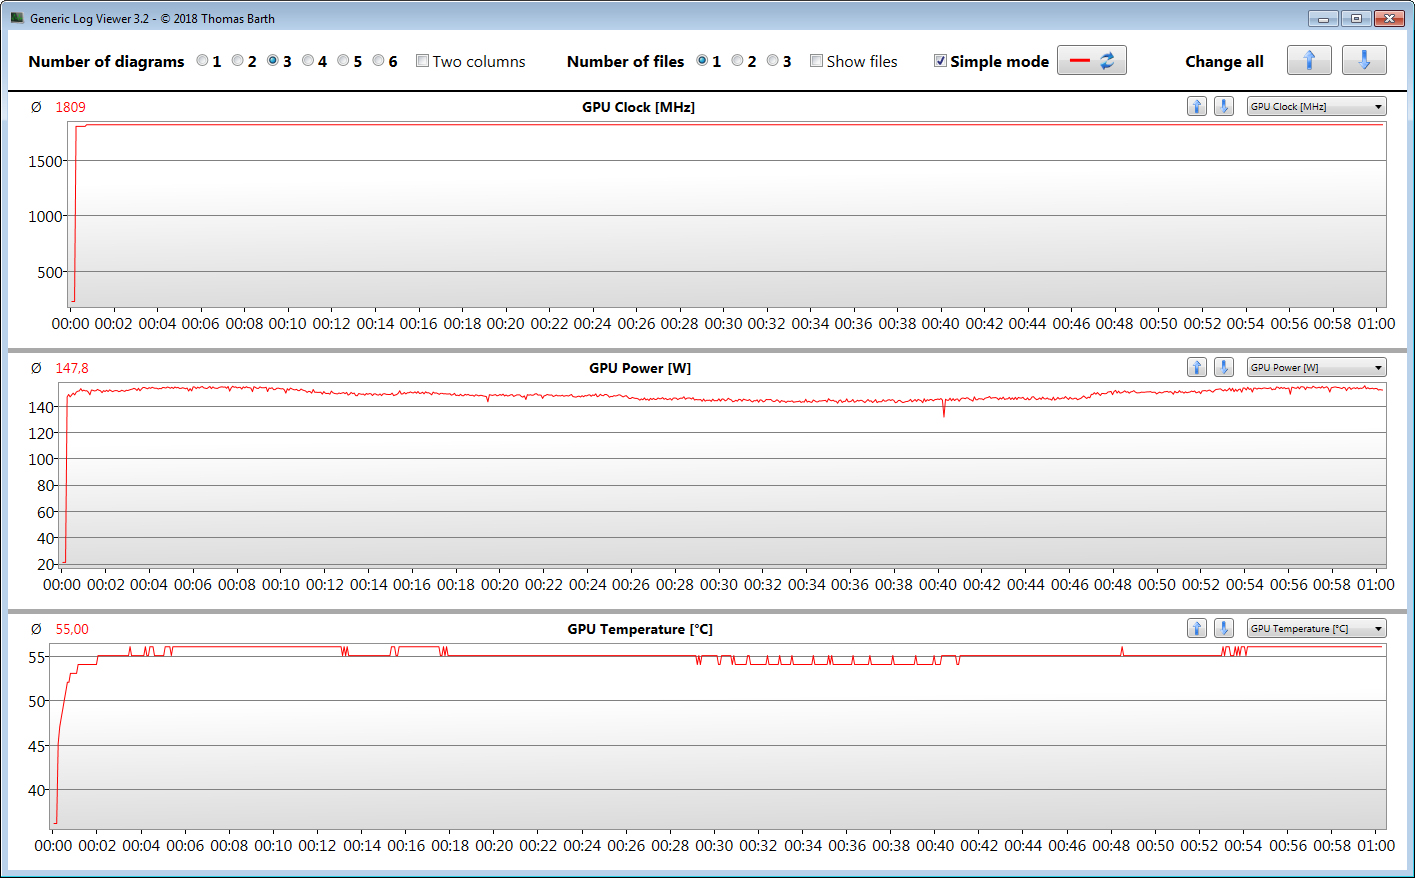
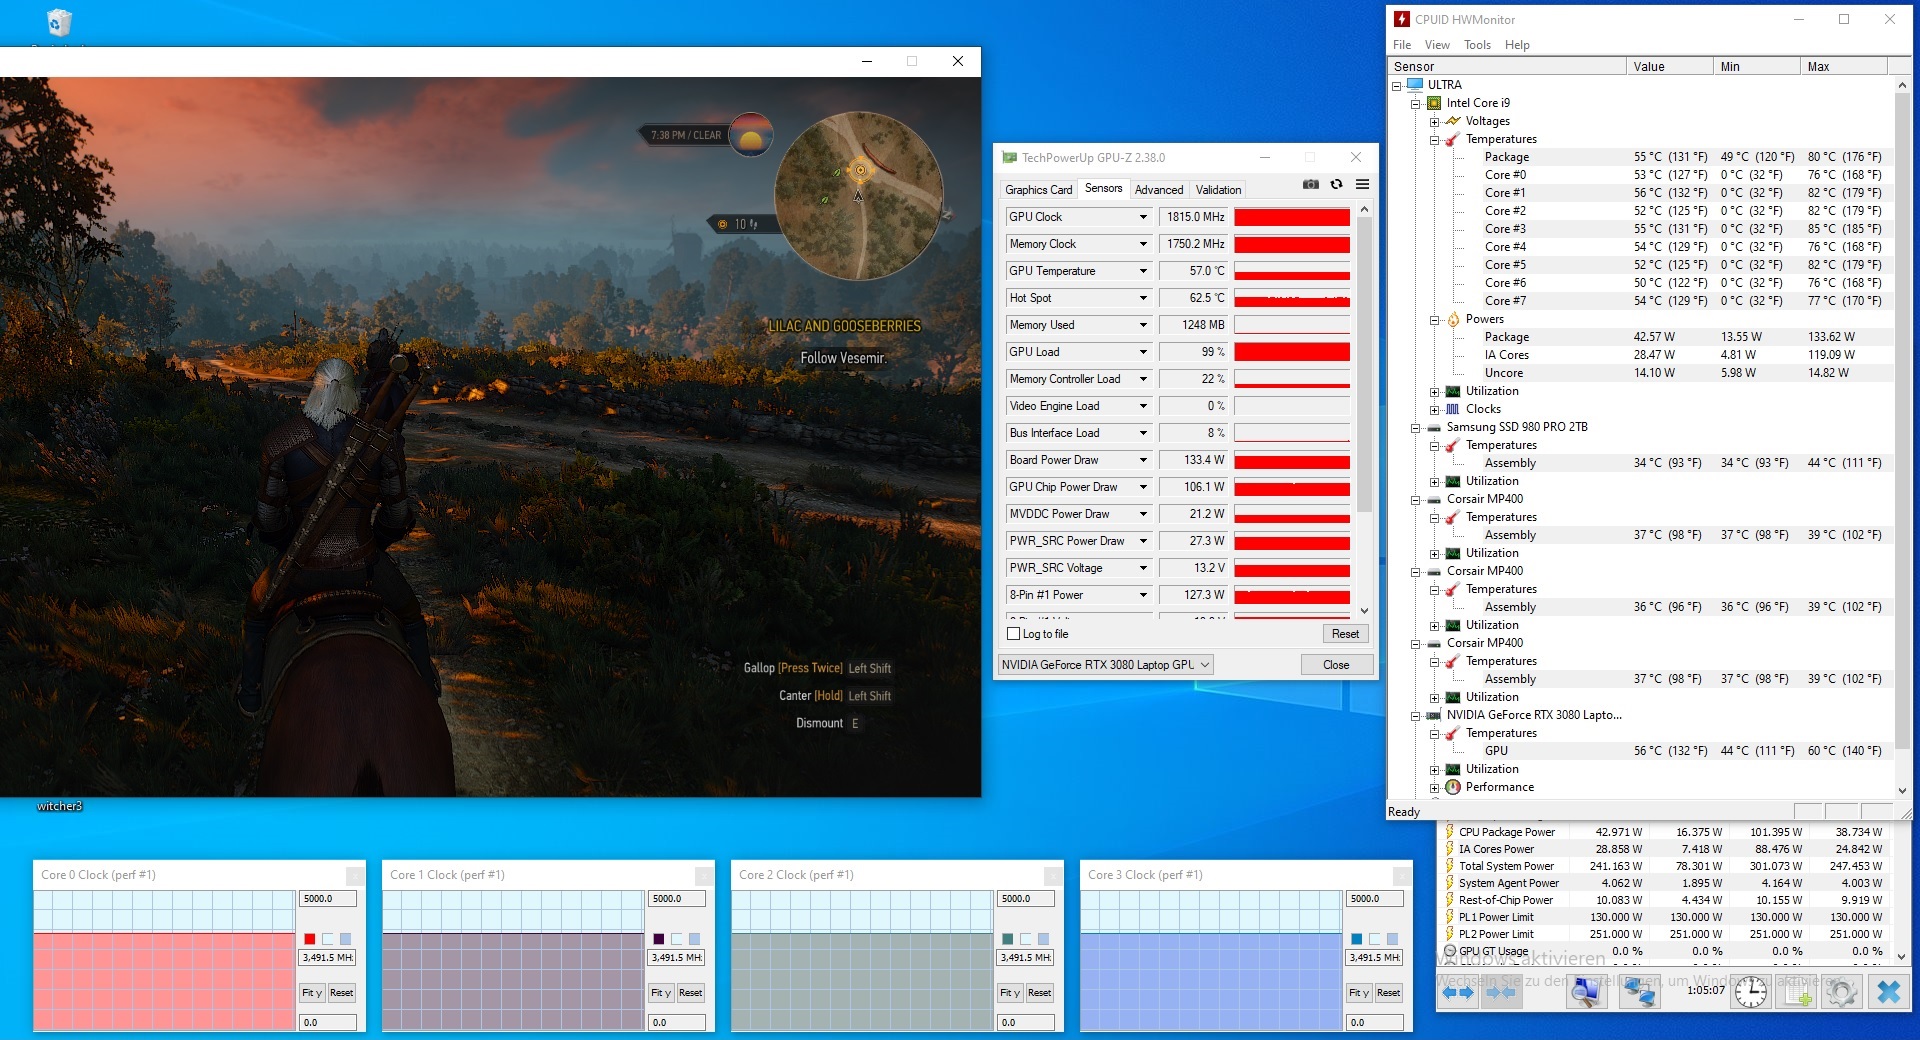
Per verificare se il frame rate rimane costante per un periodo più lungo, abbiamo eseguito il gioco"The Witcher 3" per circa 60 minuti con risoluzione Full HD e impostazioni di qualità massima. Il personaggio del gioco non viene spostato. Non si nota un calo del frame rate.
| basso | medio | alto | ultra | |
|---|---|---|---|---|
| The Witcher 3 (2015) | 453 | 374 | 242 | 123 |
| Dota 2 Reborn (2015) | 183 | 170 | 161 | 156 |
| X-Plane 11.11 (2018) | 156 | 139 | 113 | |
| Far Cry 5 (2018) | 189 | 162 | 155 | 146 |
| Shadow of the Tomb Raider (2018) | 181 | 164 | 160 | 151 |
| Doom Eternal (2020) | 211 | 199 | 193 | 190 |
| Serious Sam 4 (2020) | 162 | 118 | 111 | 107 |
| Watch Dogs Legion (2020) | 127 | 123 | 110 | 91.1 |
| Dirt 5 (2020) | 110 | 97.1 | 93.3 | 92.4 |
| Immortals Fenyx Rising (2020) | 172 | 125 | 116 | 108 |
| Cyberpunk 2077 1.0 (2020) | 147 | 116 | 96.1 | 84.3 |
| Hitman 3 (2021) | 255.1 | 216.6 | 207.7 | 200.5 |
Emissioni - Questo computer Schenker può diventare molto rumoroso
Rumorosità
Quando sono al minimo e a basso carico, le ventole sono di solito silenziose e appena udibili. Tuttavia, di tanto in tanto, aumentano molto per un breve periodo in idle, raggiungendo un livello di rumore che è quasi lo stesso che a pieno carico. In altre parole: Diventa molto rumoroso. Con livelli massimi di pressione sonora di 63 dB(A) (stress test) e 61 dB(A) (The Witcher 3 test), difficilmente si può evitare di usare le cuffie. I profili energetici "Silent Mode" e "Power Saving Mode" riducono lo sviluppo del rumore - ma a spese della potenza di calcolo.
Rumorosità
| Idle |
| 30 / 31 / 57 dB(A) |
| Sotto carico |
| 63 / 63 dB(A) |
 | ||
30 dB silenzioso 40 dB(A) udibile 50 dB(A) rumoroso |
||
min: | ||
| Schenker XMG Ultra 17 Rocket Lake i9-11900K, GeForce RTX 3080 Laptop GPU | MSI GT76 Titan DT 10SGS i9-10900K, GeForce RTX 2080 Super Mobile | Asus Strix Scar 17 G732LXS i9-10980HK, GeForce RTX 2080 Super Mobile | Schenker XMG Ultra 17 Comet Lake i9-10900K, GeForce RTX 2080 Super Mobile | Alienware m17 R4 i9-10980HK, GeForce RTX 3080 Laptop GPU | Media della classe Gaming | |
|---|---|---|---|---|---|---|
| Noise | 15% | 4% | 4% | 21% | 20% | |
| off /ambiente * (dB) | 24 | 26.4 -10% | 25 -4% | 25 -4% | 24 -0% | 24.1 ? -0% |
| Idle Minimum * (dB) | 30 | 27.5 8% | 33 -10% | 27 10% | 24 20% | 26 ? 13% |
| Idle Average * (dB) | 31 | 27.5 11% | 38 -23% | 32 -3% | 25 19% | 27.4 ? 12% |
| Idle Maximum * (dB) | 57 | 29.8 48% | 45 21% | 57 -0% | 36 37% | 30.1 ? 47% |
| Load Average * (dB) | 63 | 30.9 51% | 54 14% | 56 11% | 45 29% | 43.6 ? 31% |
| Witcher 3 ultra * (dB) | 61 | 60.7 -0% | 50 18% | 55 10% | 47 23% | |
| Load Maximum * (dB) | 63 | 66.6 -6% | 55 13% | 62 2% | 50 21% | 54.2 ? 14% |
* ... Meglio usare valori piccoli
Temperature
Nel nostro stress test (Prime95 e FurMark vengono eseguiti per almeno un'ora), la CPU e la GPU girano rispettivamente a 3,4 GHz e 1.725 MHz. Lo stress test è uno scenario estremo che non si verifica nell'uso quotidiano. Usiamo questo test per verificare se il sistema funziona stabilmente anche sotto pieno carico.
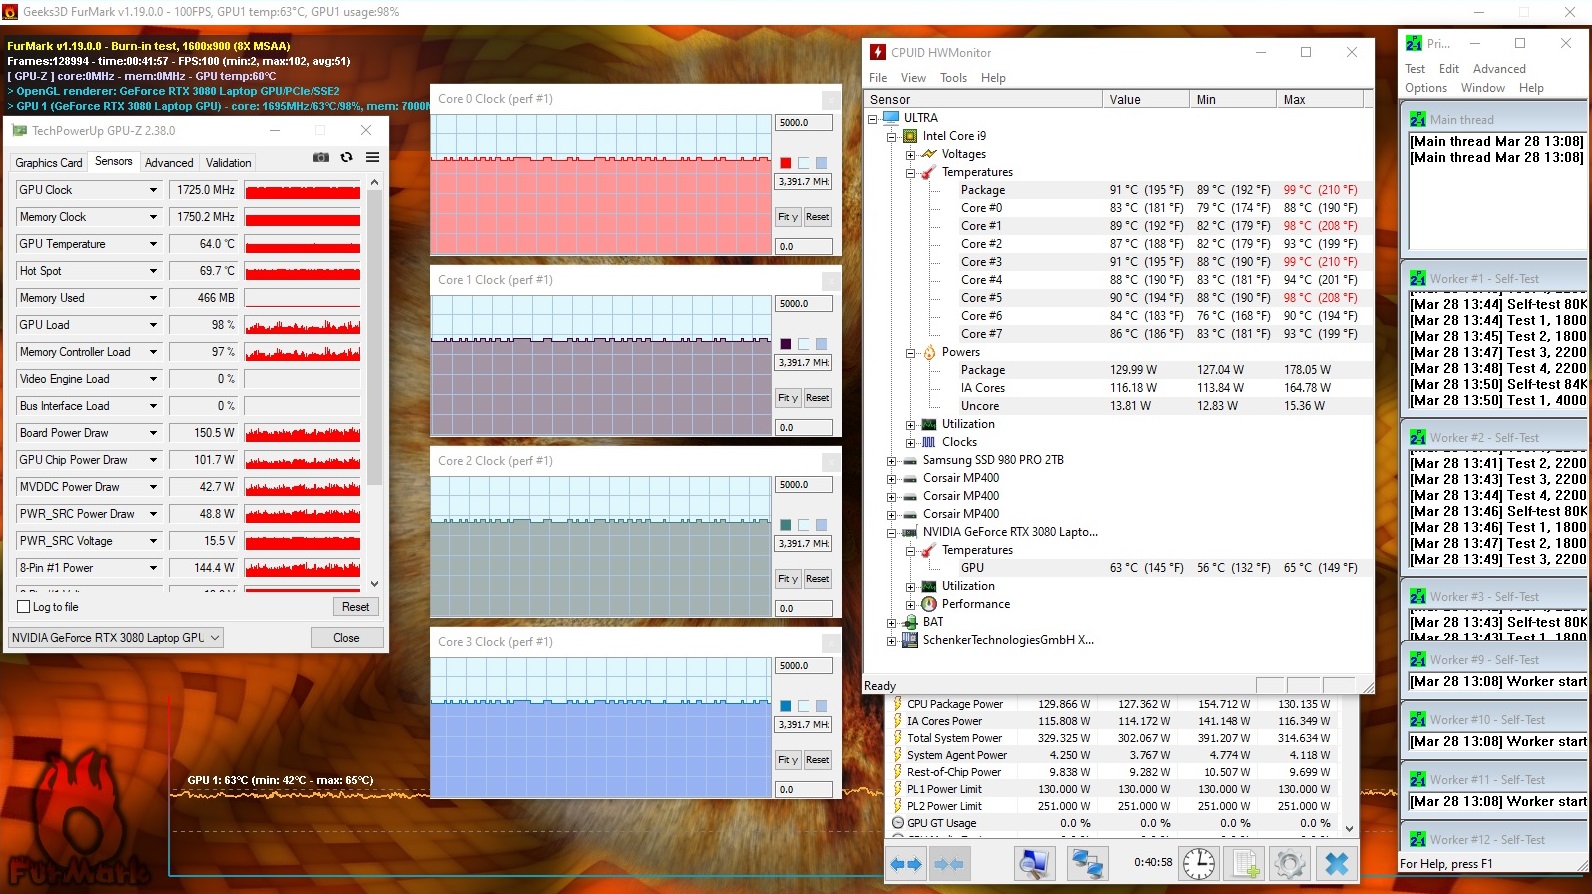
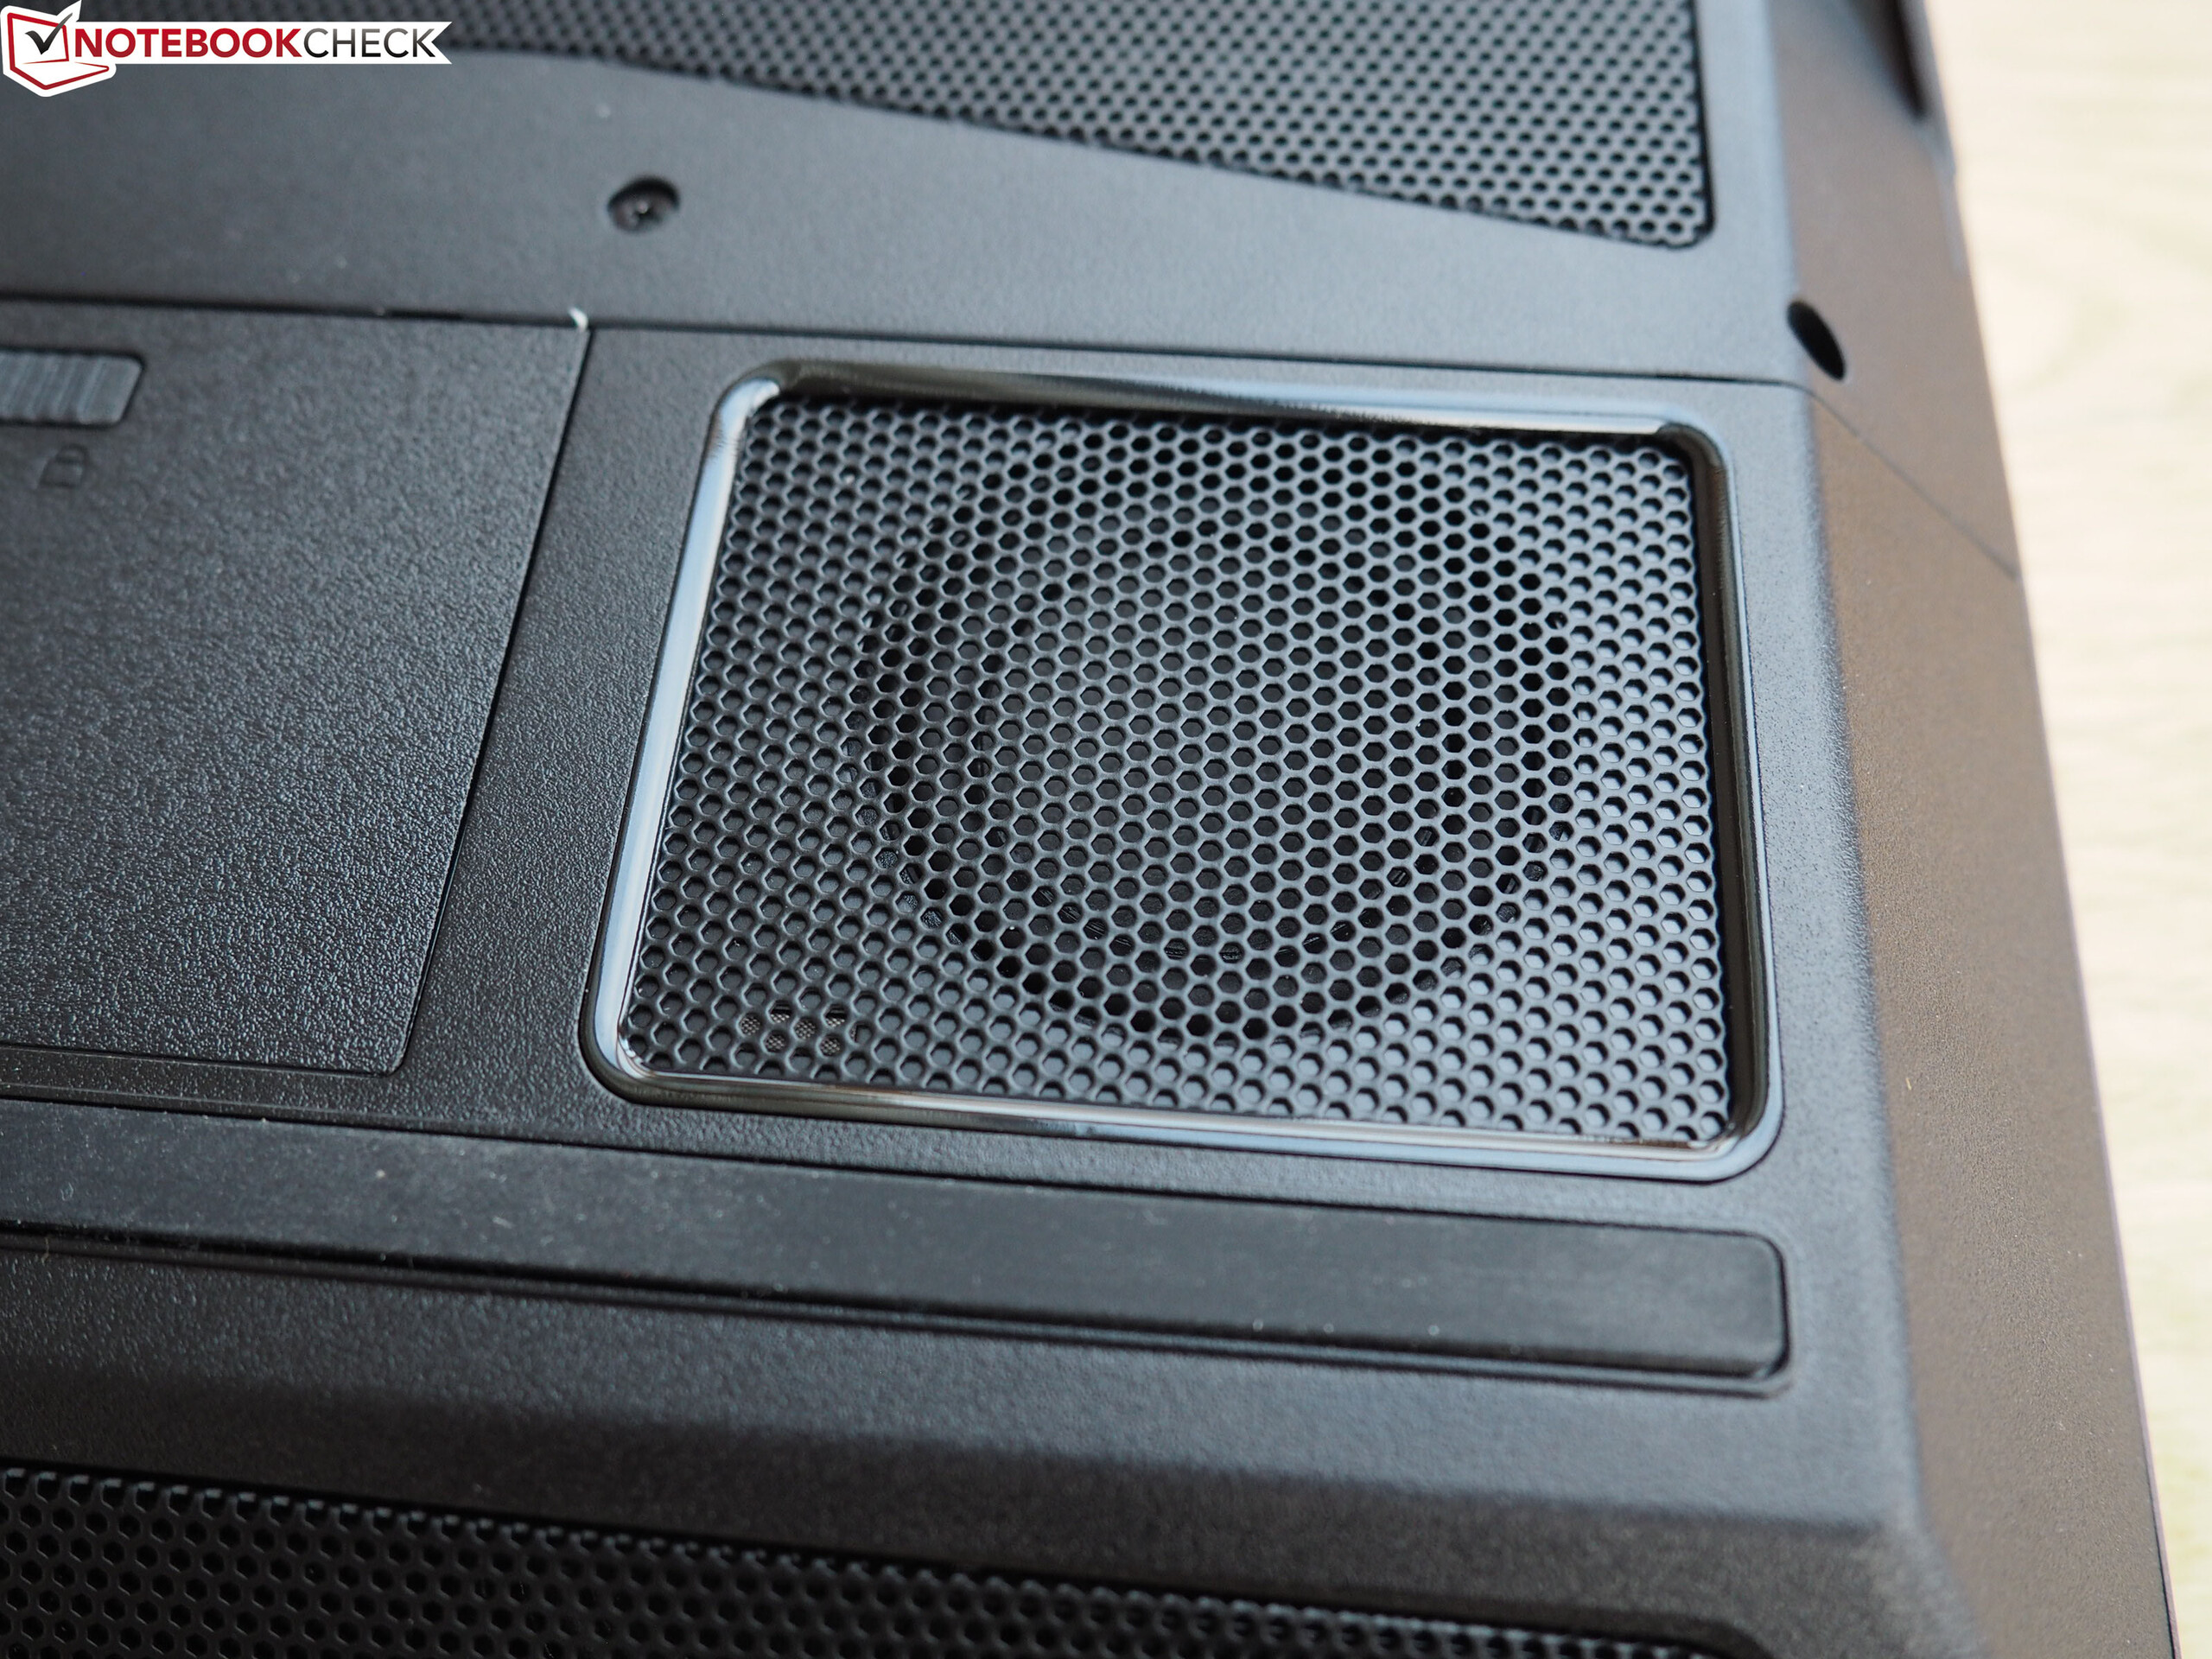
L'XMG Ultra non si scalda molto. Abbiamo registrato temperature inferiori ai 40° C (104° F) in tre punti di misurazione durante lo stress test. Il riscaldamento è inferiore quando eseguiamo il test The Witcher 3. Le temperature in idle sono a volte più alte che sotto carico perché le ventole funzionano solo a basse velocità.
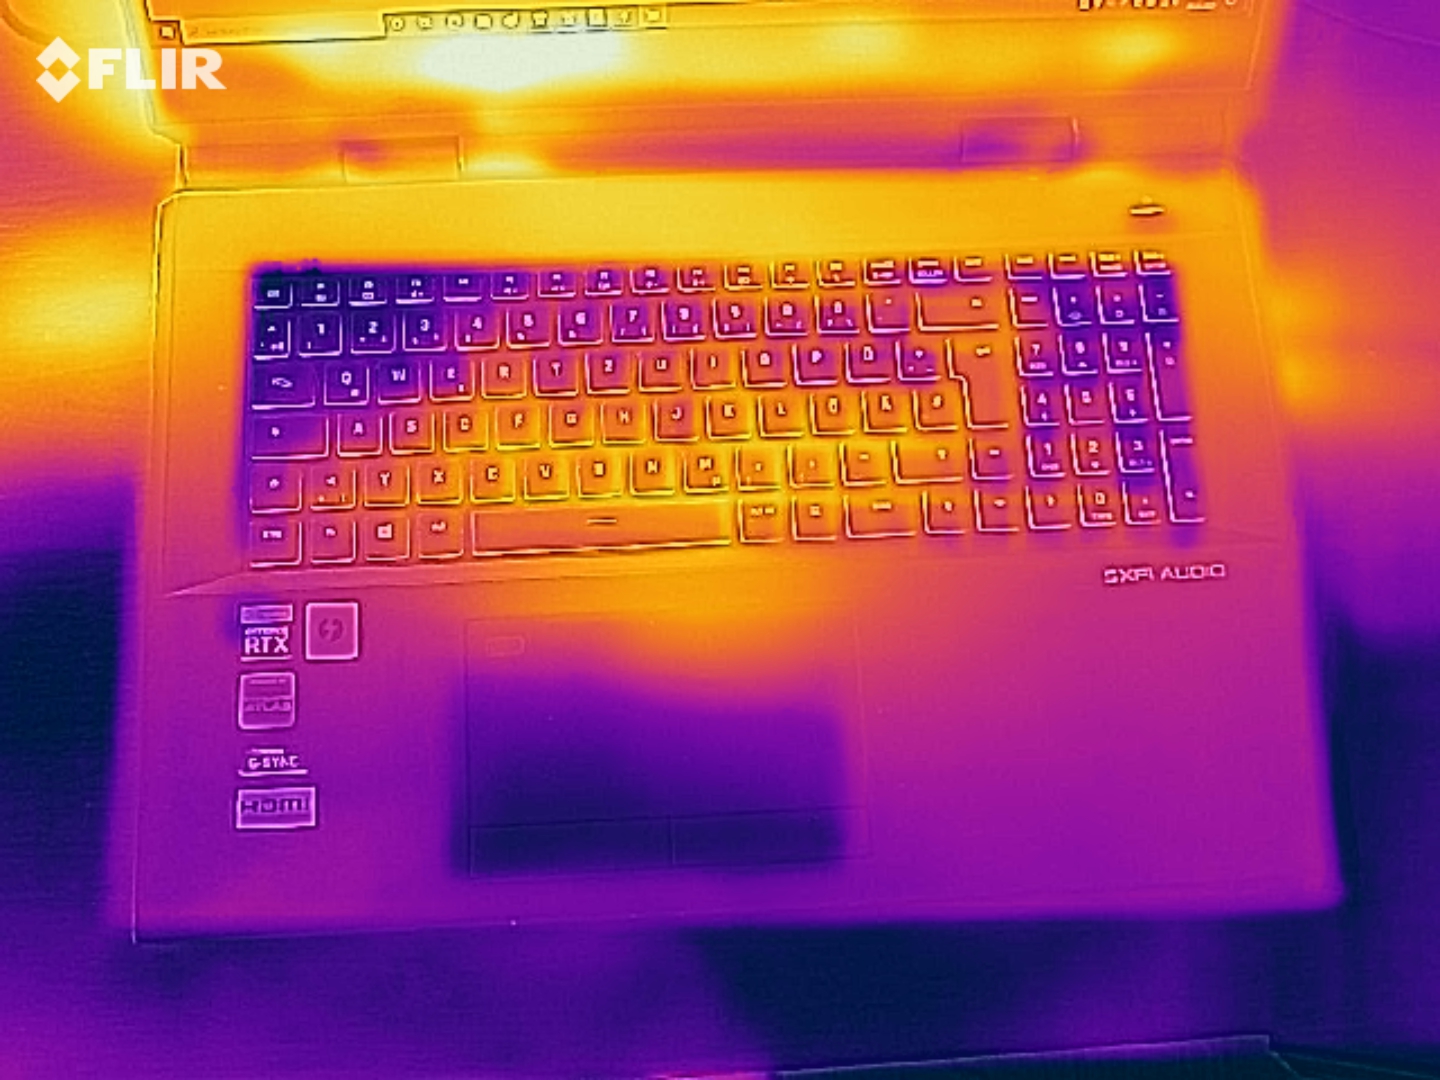
(+) La temperatura massima sul lato superiore è di 34 °C / 93 F, rispetto alla media di 40.4 °C / 105 F, che varia da 21.2 a 68.8 °C per questa classe Gaming.
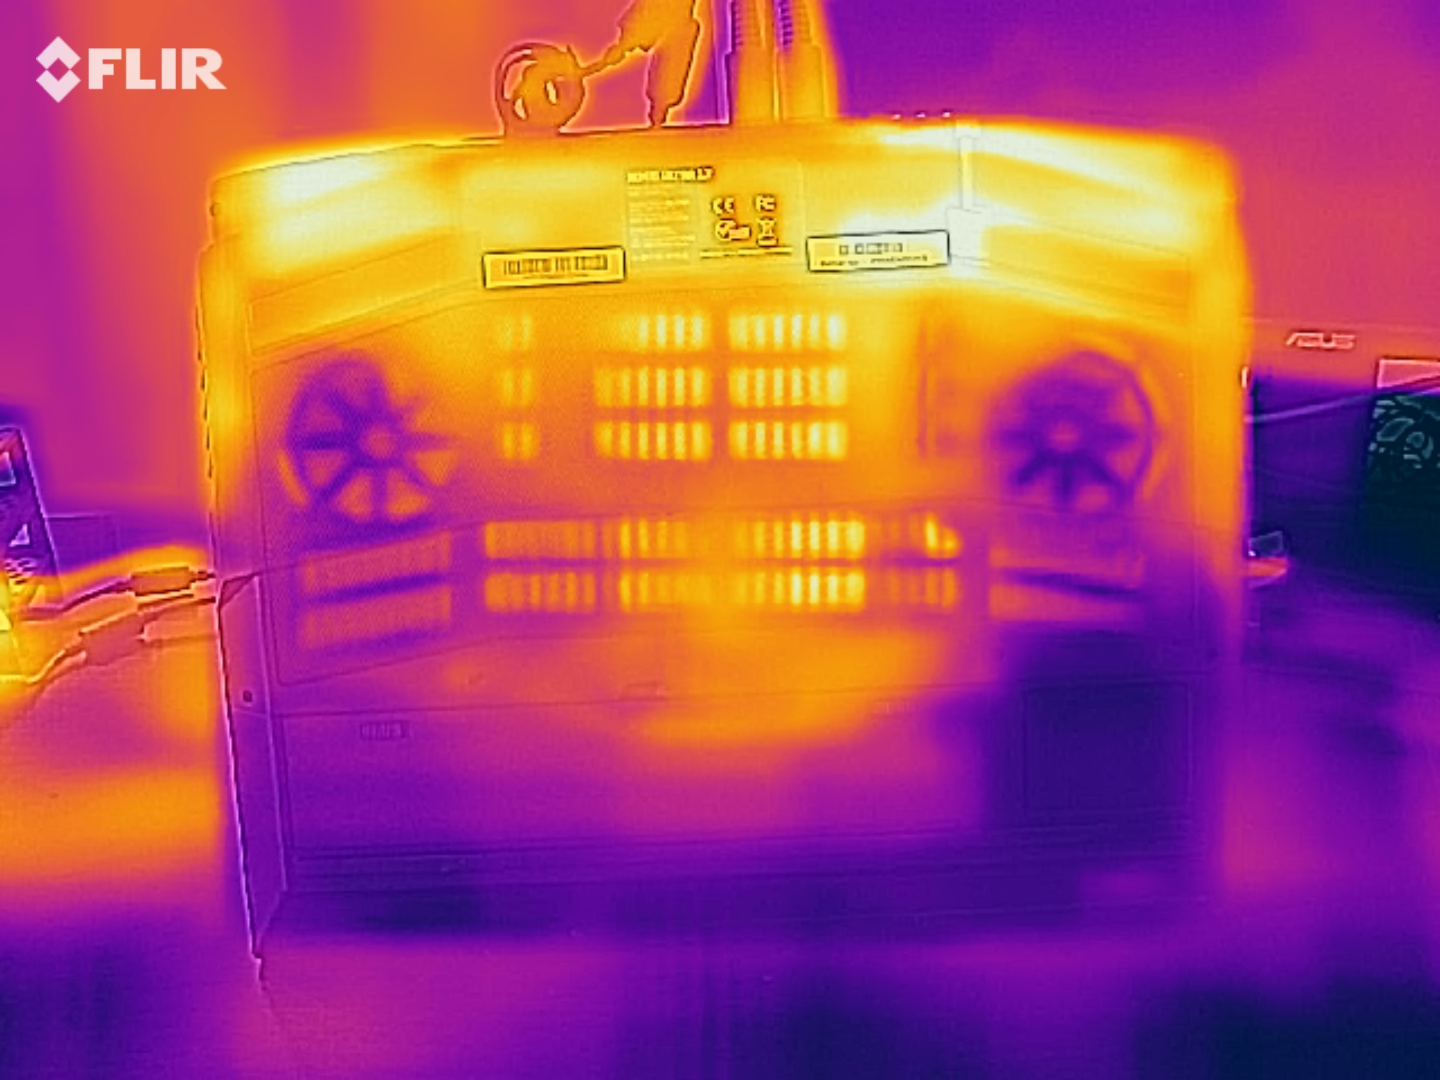
(±) Il lato inferiore si riscalda fino ad un massimo di 43 °C / 109 F, rispetto alla media di 43.2 °C / 110 F
(±) In idle, la temperatura media del lato superiore è di 33 °C / 91 F, rispetto alla media deld ispositivo di 33.9 °C / 93 F.
(+) Riproducendo The Witcher 3, la temperatura media per il lato superiore e' di 28.2 °C / 83 F, rispetto alla media del dispositivo di 33.9 °C / 93 F.
(+) I poggiapolsi e il touchpad sono piu' freddi della temperatura della pelle con un massimo di 30 °C / 86 F e sono quindi freddi al tatto.
(±) La temperatura media della zona del palmo della mano di dispositivi simili e'stata di 28.8 °C / 83.8 F (-1.2 °C / -2.2 F).
| Schenker XMG Ultra 17 Rocket Lake i9-11900K, GeForce RTX 3080 Laptop GPU | MSI GT76 Titan DT 10SGS i9-10900K, GeForce RTX 2080 Super Mobile | Asus Strix Scar 17 G732LXS i9-10980HK, GeForce RTX 2080 Super Mobile | Schenker XMG Ultra 17 Comet Lake i9-10900K, GeForce RTX 2080 Super Mobile | Alienware m17 R4 i9-10980HK, GeForce RTX 3080 Laptop GPU | Media della classe Gaming | |
|---|---|---|---|---|---|---|
| Heat | 8% | -12% | 1% | -29% | -4% | |
| Maximum Upper Side * (°C) | 34 | 36.4 -7% | 59 -74% | 39 -15% | 58 -71% | 45.2 ? -33% |
| Maximum Bottom * (°C) | 43 | 43 -0% | 52 -21% | 46 -7% | 46 -7% | 48.1 ? -12% |
| Idle Upper Side * (°C) | 38 | 28 26% | 30 21% | 32 16% | 45 -18% | 31 ? 18% |
| Idle Bottom * (°C) | 39 | 33.4 14% | 29 26% | 35 10% | 46 -18% | 34.2 ? 12% |
* ... Meglio usare valori piccoli
Altoparlanti
Schenker XMG Ultra 17 Rocket Lake analisi audio
(+) | gli altoparlanti sono relativamente potenti (91 dB)
Bassi 100 - 315 Hz
(±) | bassi ridotti - in media 8.1% inferiori alla media
(+) | bassi in lineaa (5.9% delta rispetto alla precedente frequenza)
Medi 400 - 2000 Hz
(+) | medi bilanciati - solo only 3.4% rispetto alla media
(+) | medi lineari (3.8% delta rispetto alla precedente frequenza)
Alti 2 - 16 kHz
(±) | alti elevati - circa 5.2% superiori alla media
(+) | alti lineari (6.4% delta rispetto alla precedente frequenza)
Nel complesso 100 - 16.000 Hz
(+) | suono nel complesso lineare (10.3% differenza dalla media)
Rispetto alla stessa classe
» 6% di tutti i dispositivi testati in questa classe è stato migliore, 2% simile, 93% peggiore
» Il migliore ha avuto un delta di 6%, medio di 18%, peggiore di 132%
Rispetto a tutti i dispositivi testati
» 5% di tutti i dispositivi testati in questa classe è stato migliore, 1% similare, 94% peggiore
» Il migliore ha avuto un delta di 4%, medio di 23%, peggiore di 134%
Gestione dell'energia - Schenker DTR con consumi notevoli
Consumo di energia
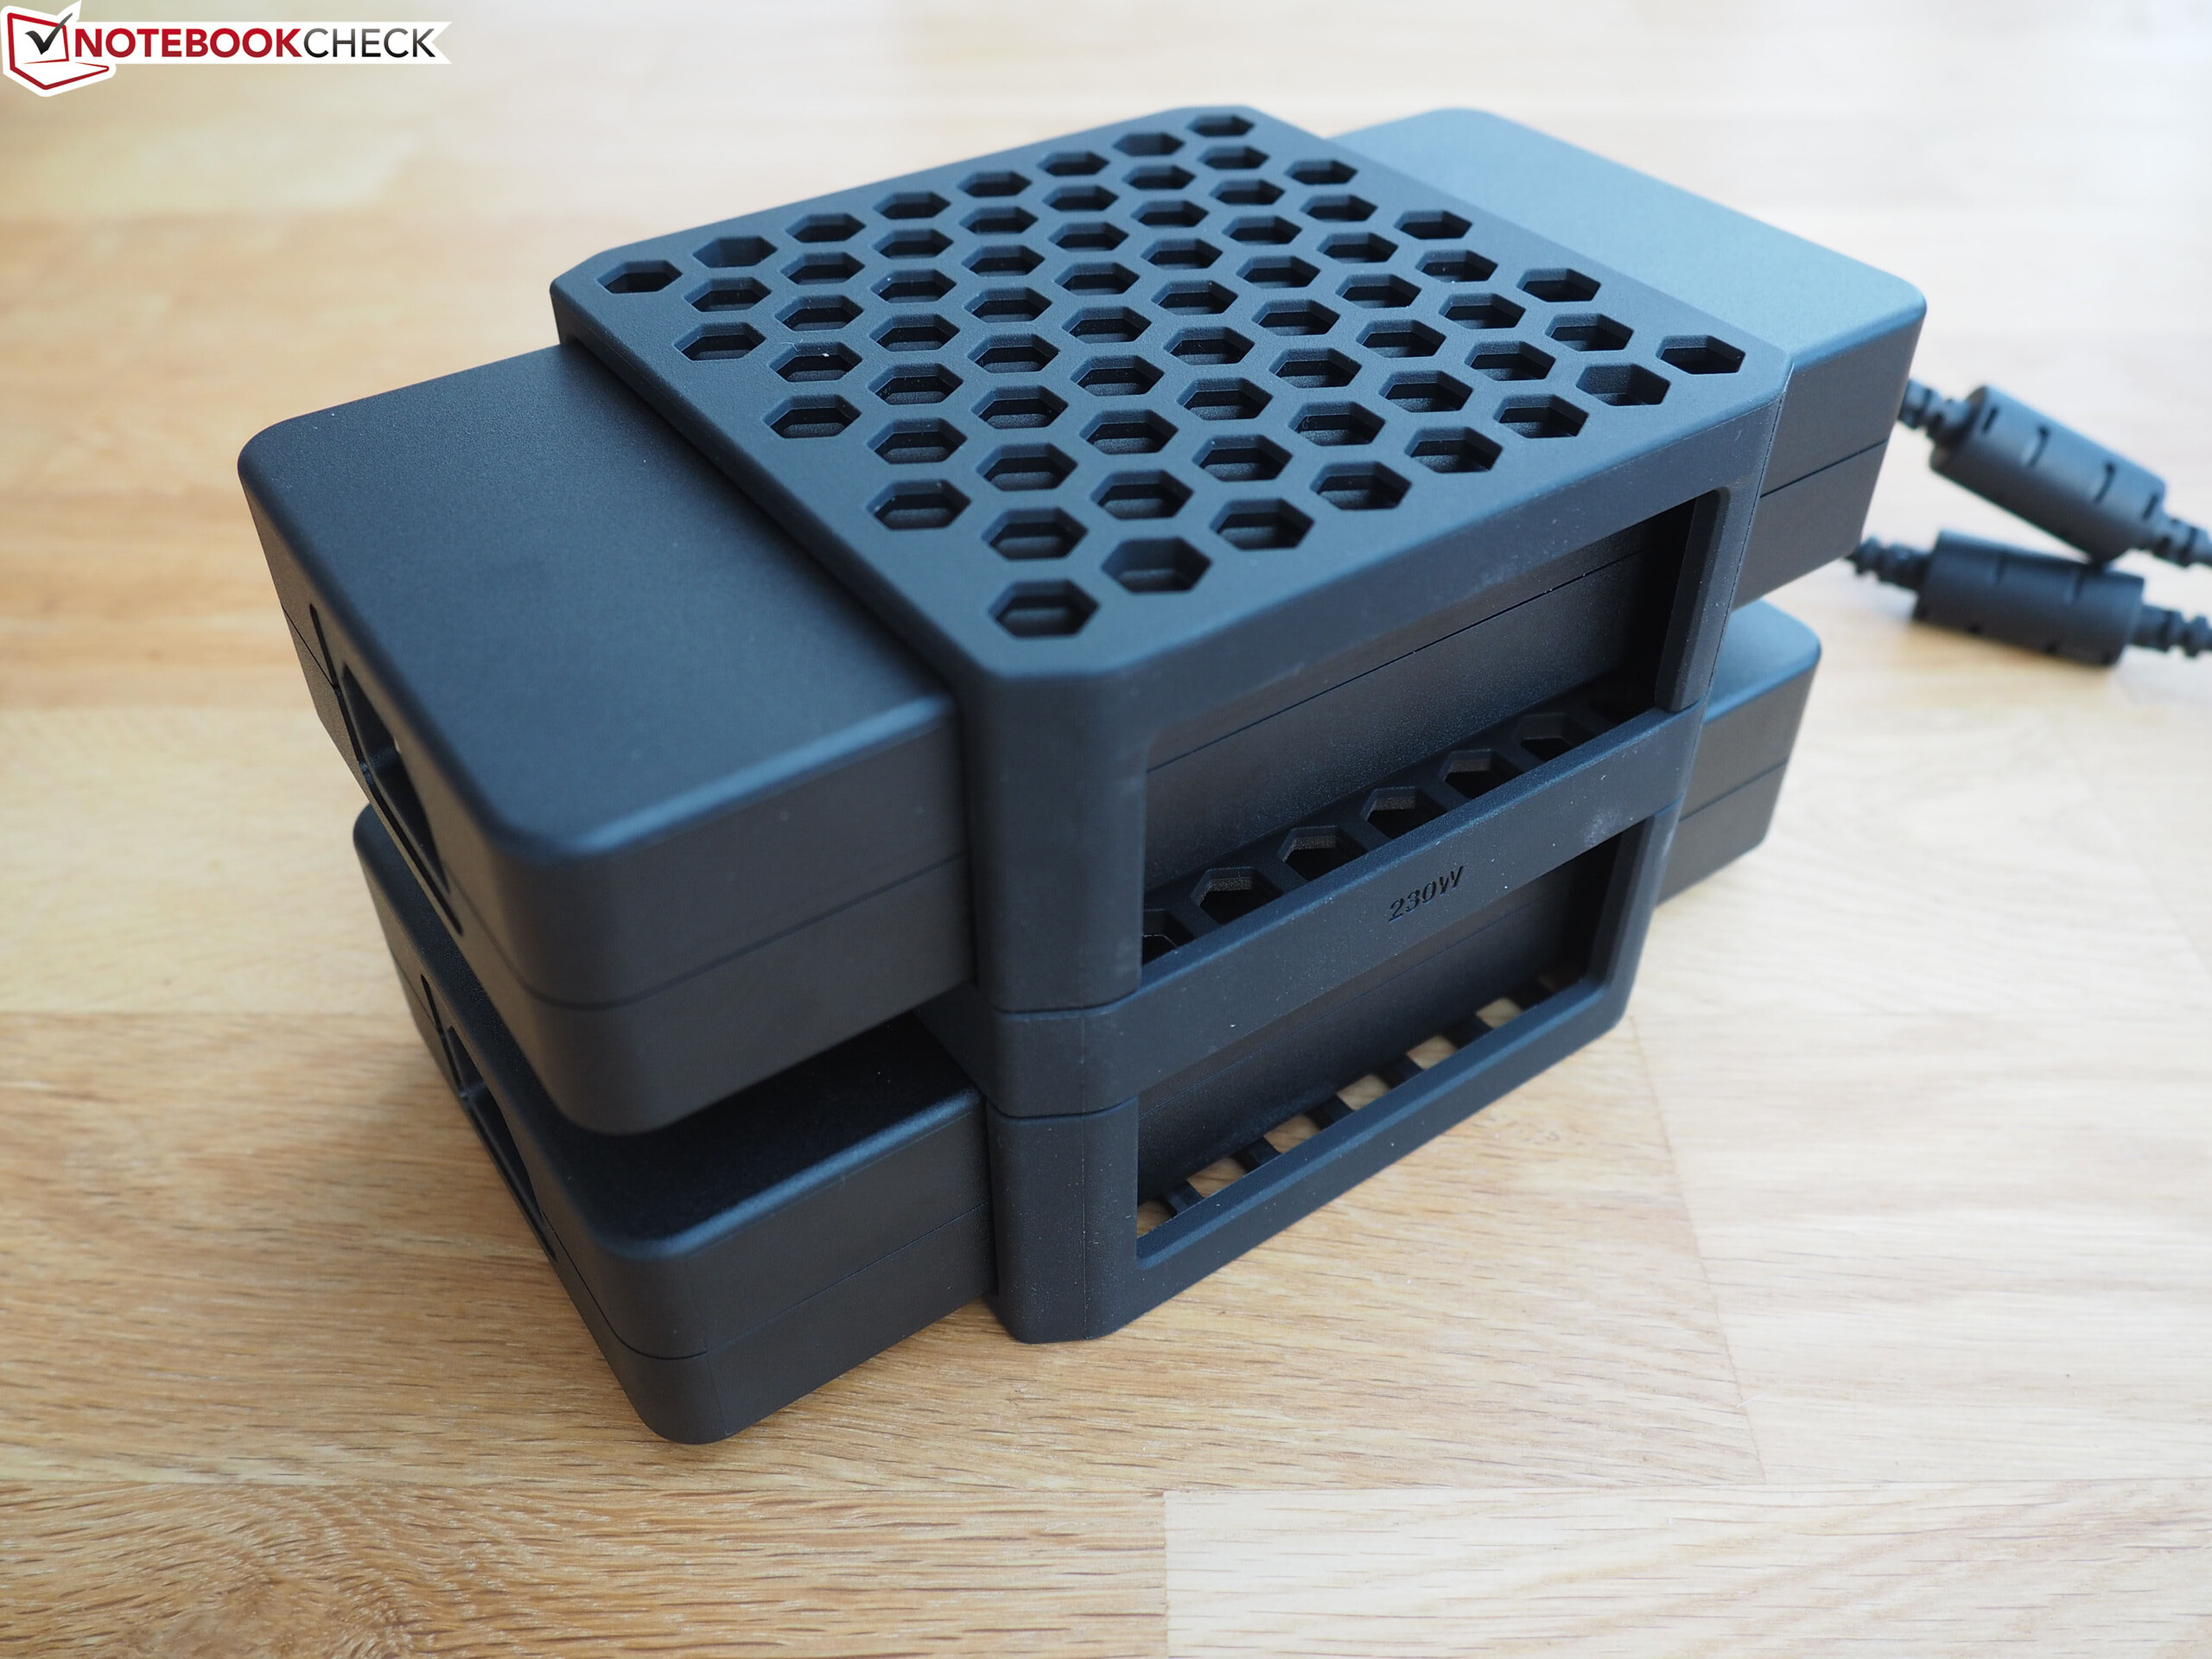
Abbiamo registrato un consumo massimo di 69 watt in idle - un valore che molti notebook da ufficio non raggiungono a pieno carico. La combinazione di una CPU ad alte prestazioni e di una GPU GeForce permanentemente attiva si nota qui. Il test di stress e The Witcher 3 aumentano la richiesta fino a 368 watts e 297 watts in media, rispettivamente. I due alimentatori forniscono una potenza nominale di 280 watts ciascuno.
| Off / Standby | |
| Idle | |
| Sotto carico |
|
Leggenda:
min: | |
| Schenker XMG Ultra 17 Rocket Lake i9-11900K, GeForce RTX 3080 Laptop GPU | MSI GT76 Titan DT 10SGS i9-10900K, GeForce RTX 2080 Super Mobile | Asus Strix Scar 17 G732LXS i9-10980HK, GeForce RTX 2080 Super Mobile | Schenker XMG Ultra 17 Comet Lake i9-10900K, GeForce RTX 2080 Super Mobile | Alienware m17 R4 i9-10980HK, GeForce RTX 3080 Laptop GPU | Media della classe Gaming | |
|---|---|---|---|---|---|---|
| Power Consumption | 21% | 39% | 16% | 23% | 57% | |
| Idle Minimum * (Watt) | 62 | 25.9 58% | 16 74% | 34 45% | 42 32% | 13 ? 79% |
| Idle Average * (Watt) | 64 | 38 41% | 25 61% | 40 37% | 48 25% | 18.7 ? 71% |
| Idle Maximum * (Watt) | 69 | 53.2 23% | 35 49% | 47 32% | 58 16% | 24.3 ? 65% |
| Load Average * (Watt) | 183 | 123.8 32% | 177 3% | 130 29% | 124 32% | 110.2 ? 40% |
| Witcher 3 ultra * (Watt) | 297 | 312.5 -5% | 227 24% | 318 -7% | 219 26% | |
| Load Maximum * (Watt) | 368 | 459.8 -25% | 280 24% | 512 -39% | 337 8% | 258 ? 30% |
* ... Meglio usare valori piccoli
Durata della batteria
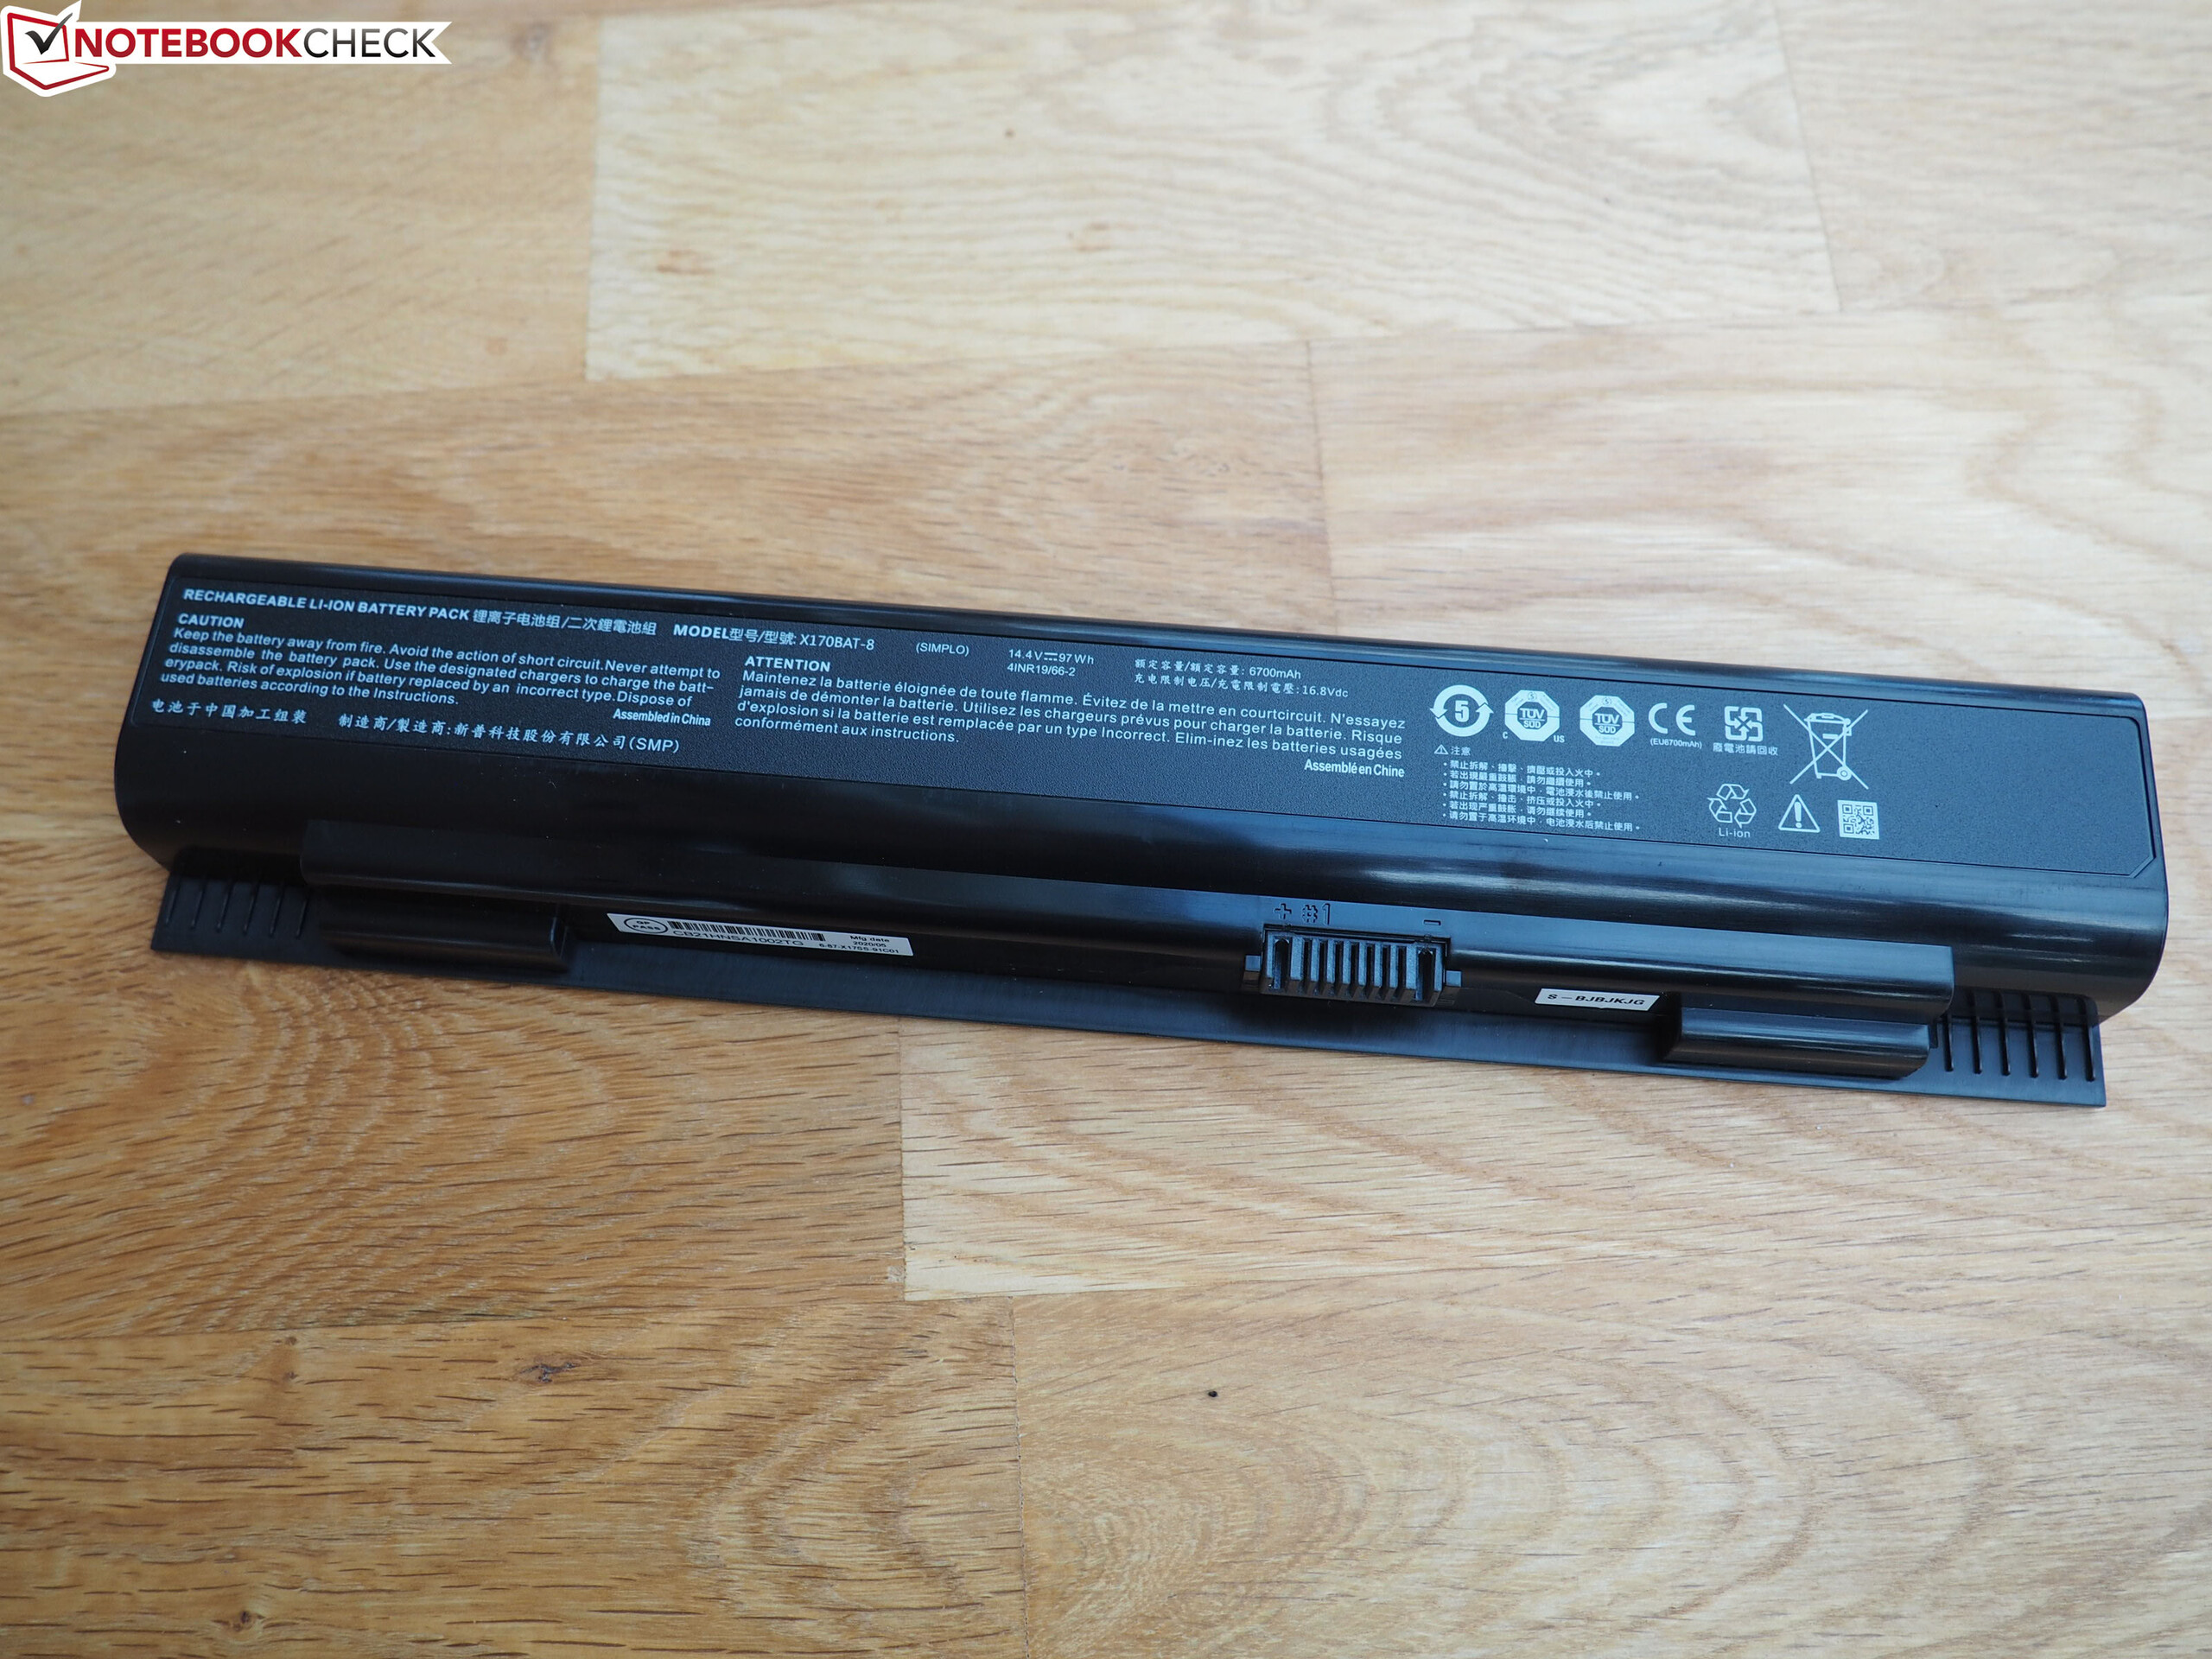
La fame sfrenata di energia dell'hardware significa che anche la batteria installata da 97 Wh consente solo tempi di automia scarsi. Questo 17.3" raggiunge tempi di autonomia di 1:50 h e 1:55 h nel test WLAN (richiamando siti web tramite uno script) e nel test video (cortometraggio Big Buck Bunny (codifica H.264, FHD) in loop), rispettivamente. La batteria serve più come alimentazione di emergenza che come fattore di mobilità in un dispositivo come l'Ultra 17.
| Schenker XMG Ultra 17 Rocket Lake i9-11900K, GeForce RTX 3080 Laptop GPU, 97 Wh | MSI GT76 Titan DT 10SGS i9-10900K, GeForce RTX 2080 Super Mobile, 90 Wh | Asus Strix Scar 17 G732LXS i9-10980HK, GeForce RTX 2080 Super Mobile, 66 Wh | Schenker XMG Ultra 17 Comet Lake i9-10900K, GeForce RTX 2080 Super Mobile, 97 Wh | Alienware m17 R4 i9-10980HK, GeForce RTX 3080 Laptop GPU, 86 Wh | Media della classe Gaming | |
|---|---|---|---|---|---|---|
| Autonomia della batteria | 33% | 166% | 61% | 19% | 211% | |
| Reader / Idle (h) | 3 | 10 233% | 4.9 63% | 8.16 ? 172% | ||
| H.264 (h) | 1.9 | 2.2 16% | 8.32 ? 338% | |||
| WiFi v1.3 (h) | 1.8 | 2.4 33% | 5.9 228% | 3.8 111% | 2.4 33% | 7.11 ? 295% |
| Load (h) | 1.1 | 1.5 36% | 1.2 9% | 1.2 9% | 1.502 ? 37% |
Pro
Contro
Valutazione complessiva del computer portatile Schenker XMG Ultra 17
Questo massiccio dreplacement di Schenker non scende a compromessi in termini di dotazioni e potenza di calcolo. Poiché non solo laRAM e i supporti di memorizzazione, ma anche la CPU (socketed) e la GPU (MXM) sono intercambiabili, il notebook può essere personalizzato in base alle esigenze. Ci sono tre GPU (Ampere) e dieci CPU (Comet Lake, Rocket Lake) tra cui scegliere.
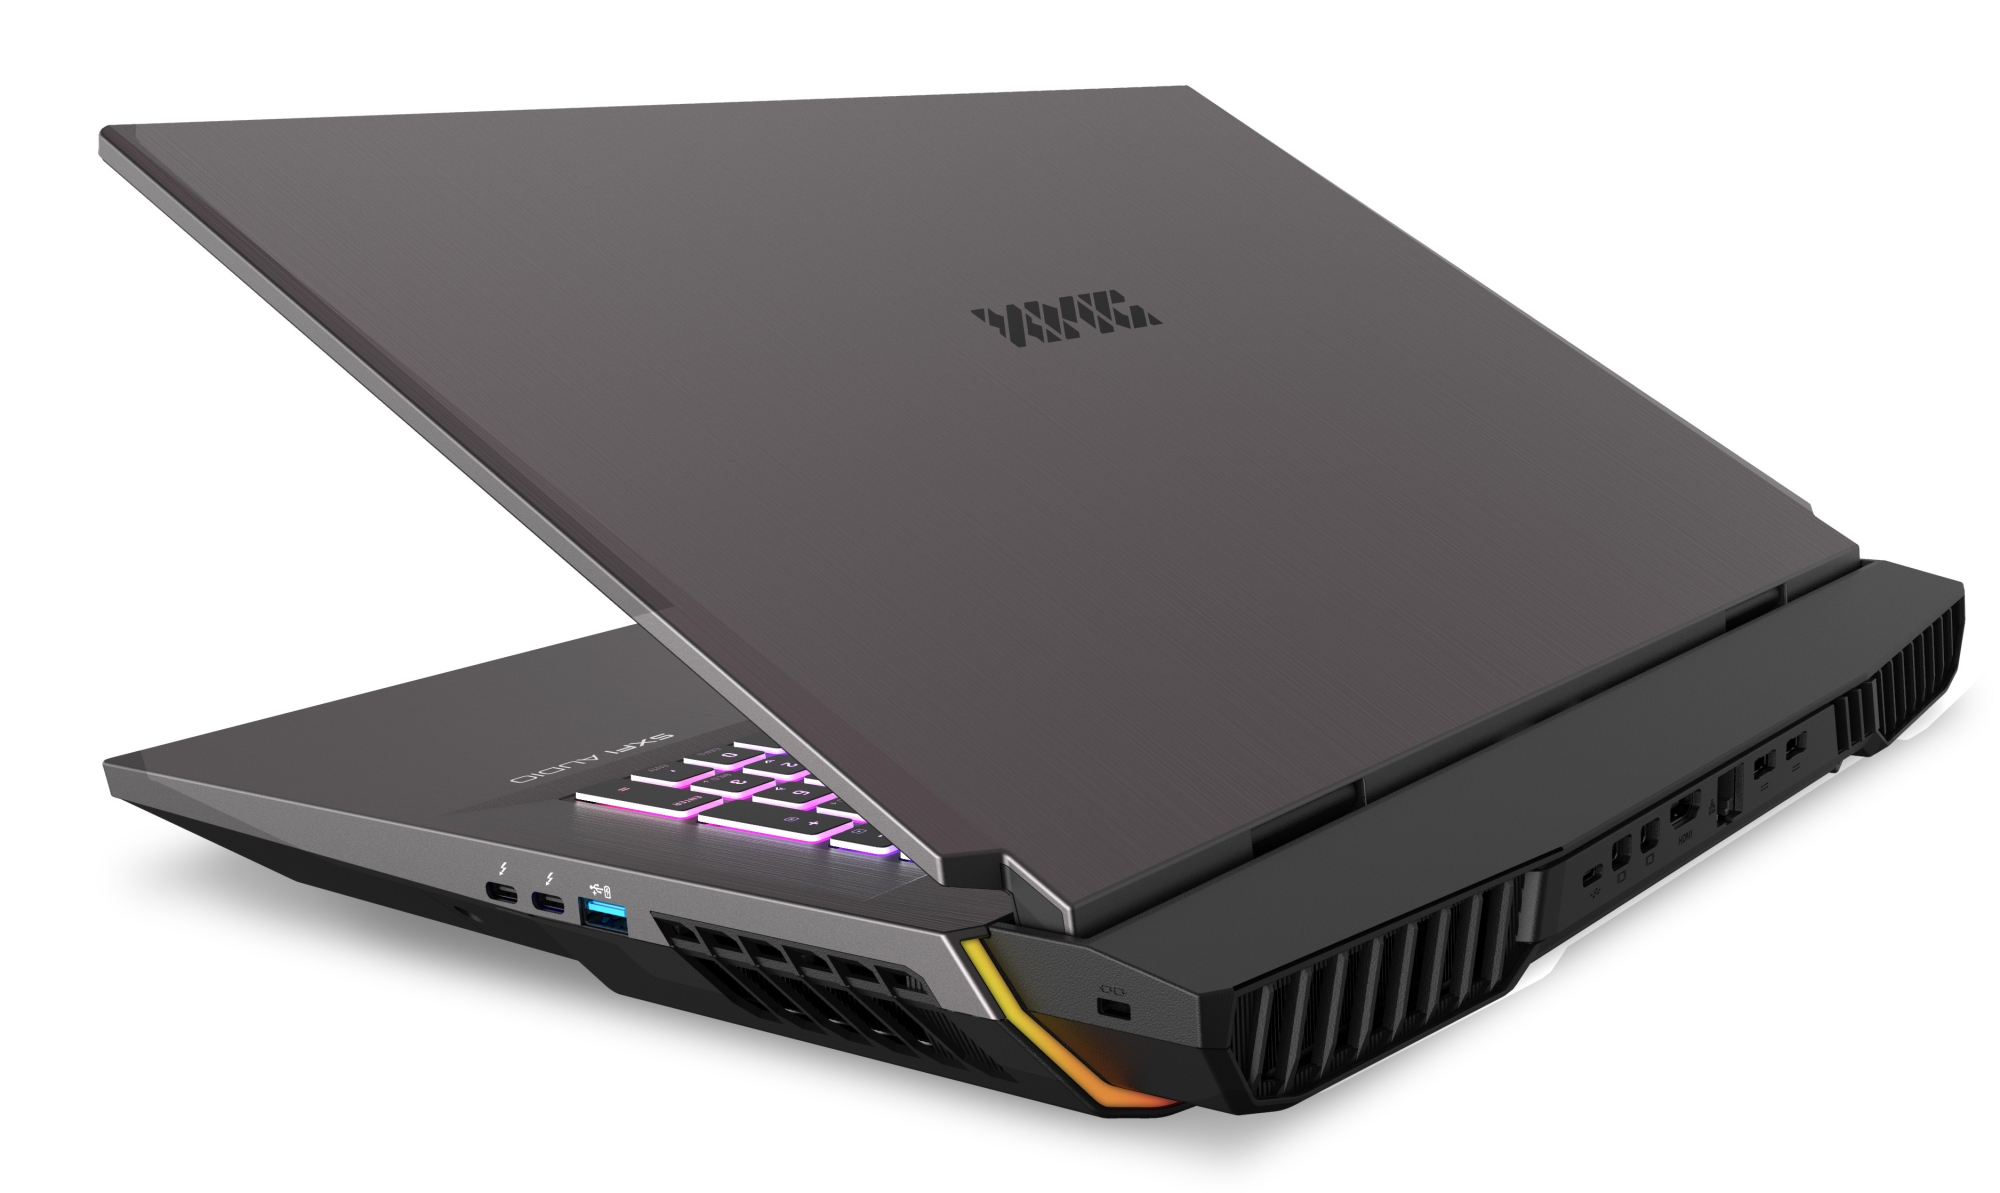
Lo Schenker XMG Ultra 17 offre molta potenza di calcolo, numerose interfacce e molte opzioni di espansione.
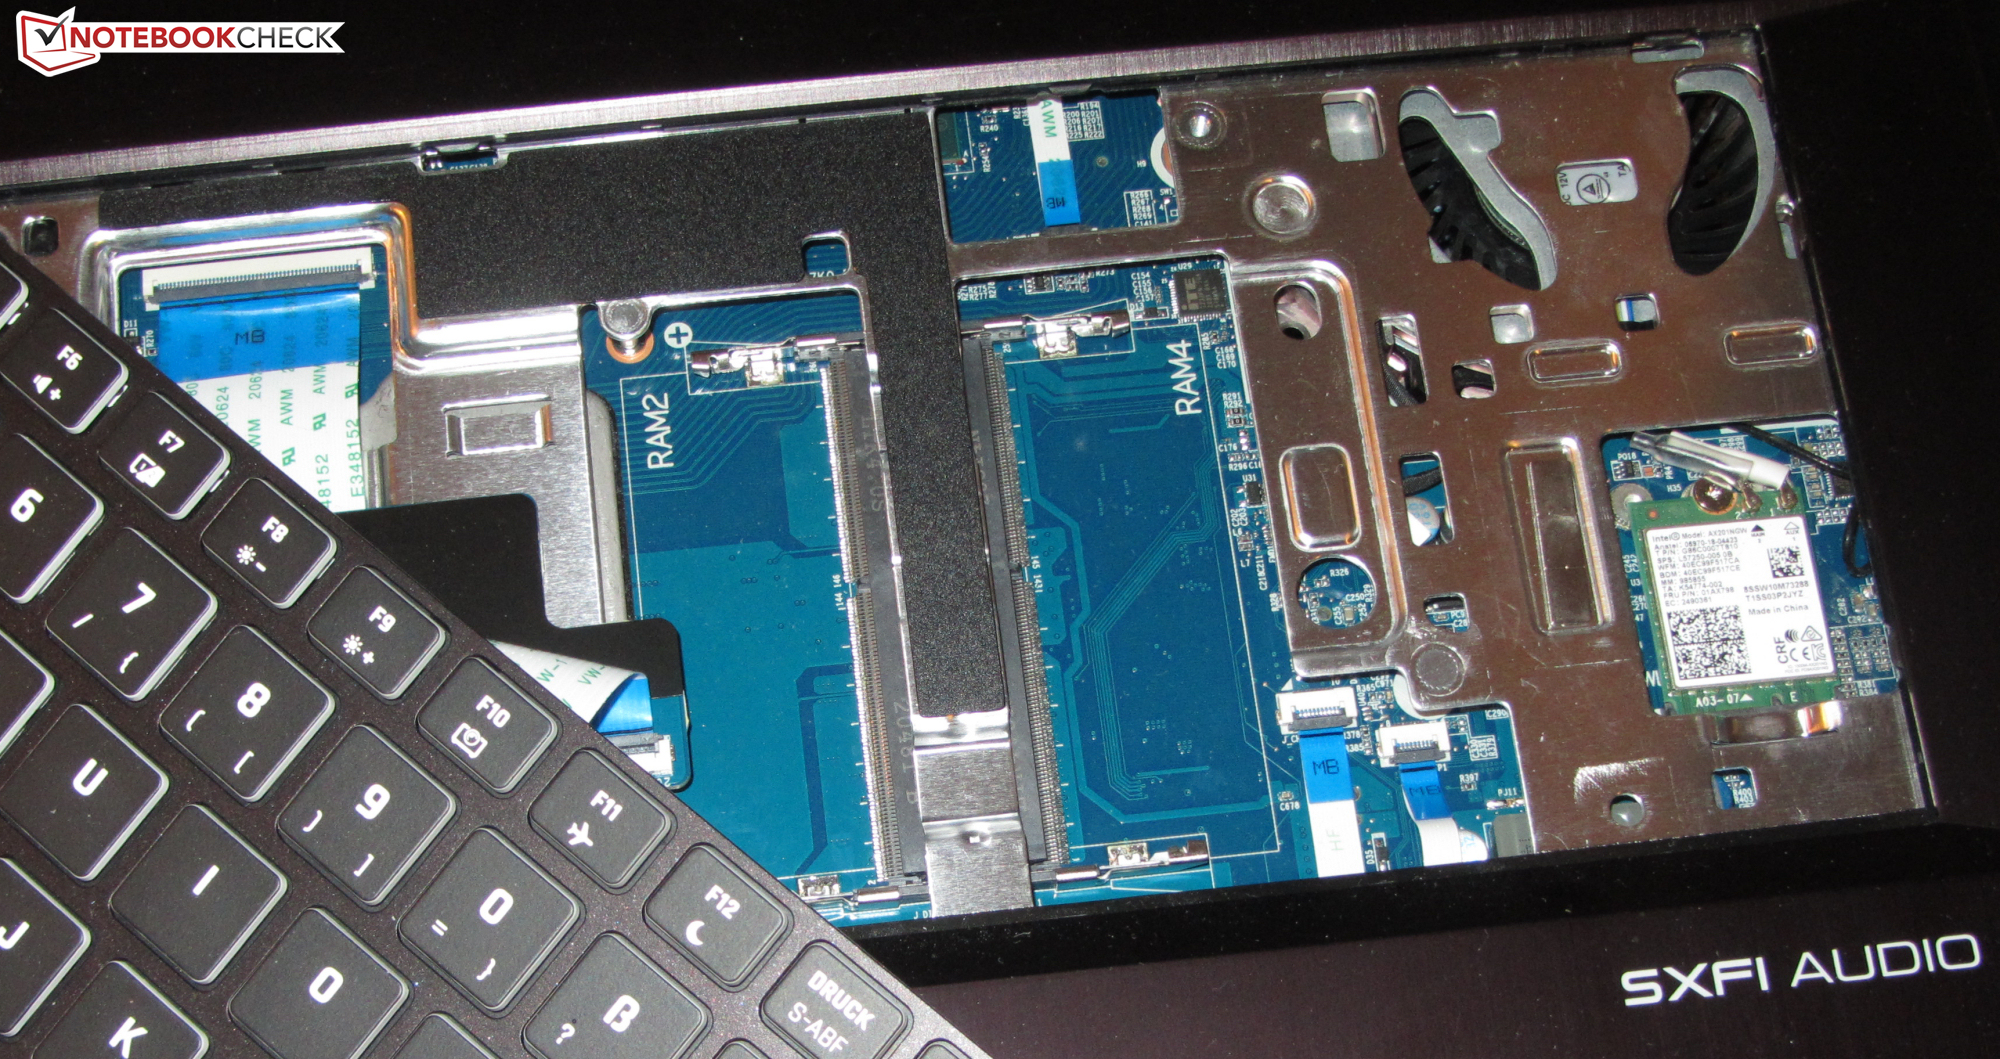
L'esemplare in prova fornitoci è molto buono grazie alla combinazione del processore Core-i9-11900K, GPU GeForce RTX-3080 laptop, 64 GB di memoria di lavoro (max. 128 GB) e 4 SSD NVMe con un totale di 26 TB di spazio di archiviazione, il dispositivo di prova fornitoci è più che attrezzato per tutte le aree di applicazione comuni. Ufficio, Internet, editing video, elaborazione delle immagini, streaming e giochi sono tutti gestiti senza problemi.
La tecnologia G-Sync di Nvidia assicura una visualizzazione fluida delle immagini sullo schermo IPS a 300 Hz. Quest'ultimo si fa notare con una superficie opaca, un buon contrasto, tempi di risposta brevi, angoli di visione stabili, ottima riproduzione dei colori e una copertura decente dello spazio colore. Tuttavia, la luminosità massima dovrebbe essere un po' più alta. Dal momento che il dispositivo sarà utilizzato principalmente in ambienti chiusi a causa della sua bassa mobilità, è accettabile.
Prezzo e disponibilità
Lo Schenker XMG Ultra 17 (2021) può essere personalizzato nel negozio online Schenker. La variante di configurazione che ci è stata fornita è disponibile per poco meno di 9.000 euro (~$10.887). I modelli entry-level sono disponibili a partire da circa 2.500 euro (~$3.024).
Schenker XMG Ultra 17 Rocket Lake
- 04/19/2021 v7 (old)
Sascha Mölck
Price comparison
