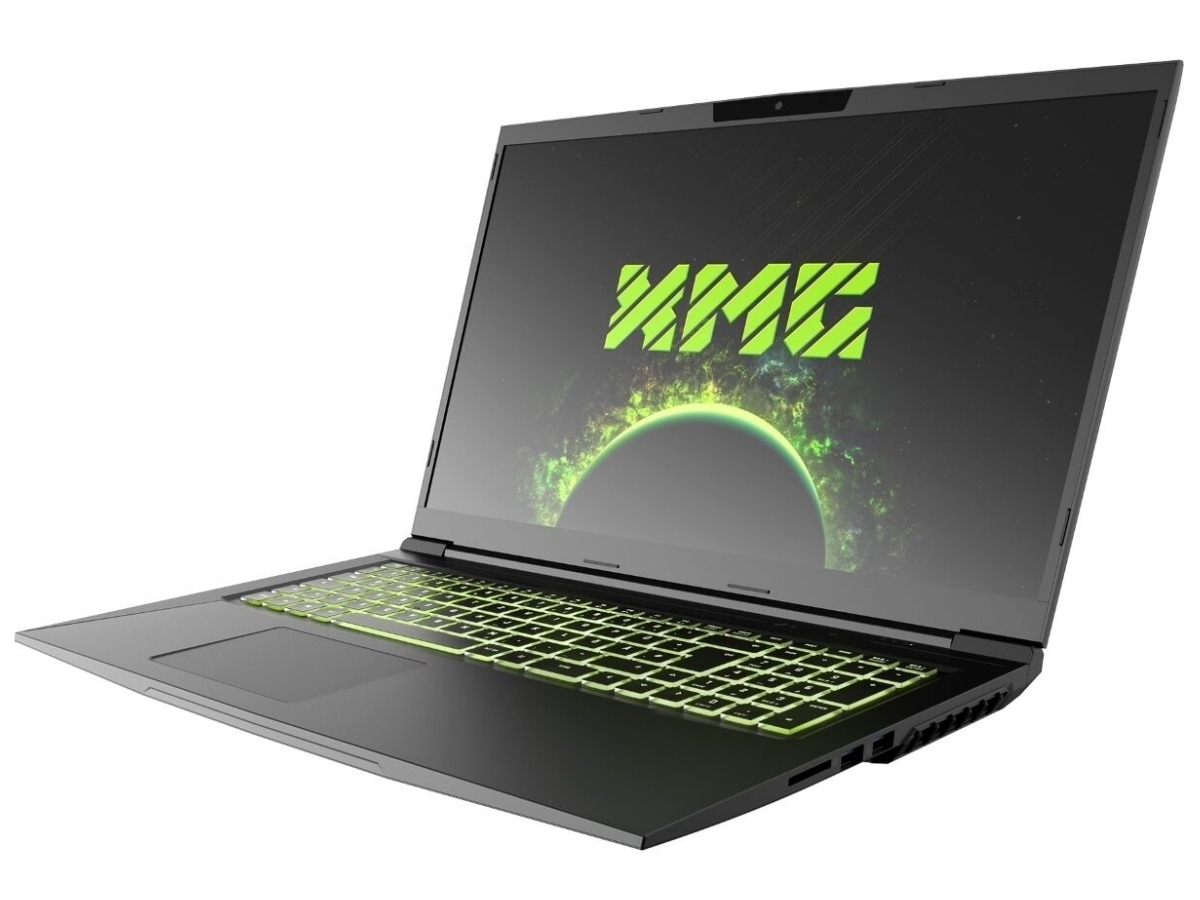
Recensione del laptop Schenker XMG Core 17 (Tongfang GK7MRFR): computer portatile gaming di fascia media senza vampate di calore
Punteggio | Data | Modello | Peso | Altezza | Dimensione | Risoluzione | Prezzo |
|---|---|---|---|---|---|---|---|
| 81.4 % v7 (old) | 12/2020 | Schenker XMG Core 17 Comet Lake i7-10750H, GeForce GTX 1650 Ti Mobile | 2.5 kg | 30 mm | 17.30" | 1920x1080 | |
| 81.9 % v7 (old) | 10/2020 | Lenovo Legion 5 17IMH05 i5-10300H, GeForce GTX 1650 Mobile | 2.9 kg | 26.2 mm | 17.30" | 1920x1080 | |
| 83.6 % v7 (old) | 10/2020 | Acer Predator Helios 300 PH317-54-75G8 i7-10750H, GeForce RTX 2060 Mobile | 2.8 kg | 25 mm | 17.30" | 1920x1080 | |
| 79.8 % v7 (old) | 10/2020 | MSI GF75 Thin 10SDR i7-10750H, GeForce GTX 1660 Ti Mobile | 2.2 kg | 23 mm | 17.30" | 1920x1080 | |
| 81.5 % v7 (old) | 09/2020 | Nexoc GH7 716IG i7-10750H, GeForce GTX 1660 Ti Mobile | 2.5 kg | 29.5 mm | 17.30" | 1920x1080 |
| SD Card Reader | |
| average JPG Copy Test (av. of 3 runs) | |
| Media della classe Gaming (20.9 - 210, n=55, ultimi 2 anni) | |
| Nexoc GH7 716IG (Toshiba Exceria Pro SDXC 64 GB UHS-II) | |
| Lenovo Legion 5 17IMH05 (Toshiba Exceria Pro SDXC 64 GB UHS-II) | |
| Schenker XMG Core 17 (Toshiba Exceria Pro SDXC 64 GB UHS-II) | |
| Schenker XMG Core 17 Comet Lake (Toshiba Exceria Pro SDXC 64 GB UHS-II) | |
| maximum AS SSD Seq Read Test (1GB) | |
| Media della classe Gaming (25.5 - 261, n=52, ultimi 2 anni) | |
| Lenovo Legion 5 17IMH05 (Toshiba Exceria Pro SDXC 64 GB UHS-II) | |
| Nexoc GH7 716IG (Toshiba Exceria Pro SDXC 64 GB UHS-II) | |
| Schenker XMG Core 17 (Toshiba Exceria Pro SDXC 64 GB UHS-II) | |
| Schenker XMG Core 17 Comet Lake (Toshiba Exceria Pro SDXC 64 GB UHS-II) | |


| |||||||||||||||||||||||||
Distribuzione della luminosità: 88 %
Al centro con la batteria: 315 cd/m²
Contrasto: 1086:1 (Nero: 0.29 cd/m²)
ΔE ColorChecker Calman: 4.3 | ∀{0.5-29.43 Ø4.71}
calibrated: 2.29
ΔE Greyscale Calman: 4.3 | ∀{0.09-98 Ø4.96}
92% sRGB (Argyll 1.6.3 3D)
66% AdobeRGB 1998 (Argyll 1.6.3 3D)
66.5% AdobeRGB 1998 (Argyll 3D)
92.6% sRGB (Argyll 3D)
65.3% Display P3 (Argyll 3D)
Gamma: 2.084
CCT: 7434 K
| Schenker XMG Core 17 Comet Lake BOE HF NV173FHM-N44, IPS, 1920x1080, 17.3" | Schenker XMG Core 17 LG Philips LP173WFG-SPB1 (LGD0615), IPS, 1920x1080, 17.3" | Lenovo Legion 5 17IMH05 AU Optronics B173HAN04.3, IPS, 1920x1080, 17.3" | Acer Predator Helios 300 PH317-54-75G8 Chi Mei N173HCE-G33, IPS, 1920x1080, 17.3" | MSI GF75 Thin 10SDR B173HAN04.9 (AUO978F), IPS, 1920x1080, 17.3" | Nexoc GH7 716IG LG Philips LGD0615, IPS, 1920x1080, 17.3" | |
|---|---|---|---|---|---|---|
| Display | 0% | 6% | -2% | -37% | 0% | |
| Display P3 Coverage (%) | 65.3 | 64.4 -1% | 69.4 6% | 62.6 -4% | 39.98 -39% | 64.6 -1% |
| sRGB Coverage (%) | 92.6 | 95.6 3% | 97.1 5% | 94.3 2% | 59.9 -35% | 95.8 3% |
| AdobeRGB 1998 Coverage (%) | 66.5 | 65.6 -1% | 71.2 7% | 64.7 -3% | 41.31 -38% | 65.7 -1% |
| Response Times | 11% | -149% | -1% | -147% | 14% | |
| Response Time Grey 50% / Grey 80% * (ms) | 17.6 ? | 14.4 ? 18% | 38.4 ? -118% | 16.4 ? 7% | 38.4 ? -118% | 15.2 ? 14% |
| Response Time Black / White * (ms) | 10 ? | 9.6 ? 4% | 28 ? -180% | 10.8 ? -8% | 27.6 ? -176% | 8.6 ? 14% |
| PWM Frequency (Hz) | 1000 ? | 24510 ? | ||||
| Screen | 9% | 1% | 32% | -27% | 0% | |
| Brightness middle (cd/m²) | 315 | 329 4% | 326 3% | 322 2% | 252 -20% | 303 -4% |
| Brightness (cd/m²) | 298 | 286 -4% | 304 2% | 308 3% | 253 -15% | 277 -7% |
| Brightness Distribution (%) | 88 | 79 -10% | 89 1% | 92 5% | 92 5% | 86 -2% |
| Black Level * (cd/m²) | 0.29 | 0.3 -3% | 0.25 14% | 0.18 38% | 0.23 21% | 0.25 14% |
| Contrast (:1) | 1086 | 1097 1% | 1304 20% | 1789 65% | 1096 1% | 1212 12% |
| Colorchecker dE 2000 * | 4.3 | 2.52 41% | 4.42 -3% | 1.53 64% | 4.24 1% | 4.15 3% |
| Colorchecker dE 2000 max. * | 7.3 | 6.9 5% | 9.44 -29% | 3.14 57% | 21.4 -193% | 10.52 -44% |
| Colorchecker dE 2000 calibrated * | 2.29 | 1.31 43% | 1.53 33% | 0.74 68% | 3.64 -59% | 0.9 61% |
| Greyscale dE 2000 * | 4.3 | 2.98 31% | 5.8 -35% | 1.9 56% | 2.8 35% | 5.38 -25% |
| Gamma | 2.084 106% | 2.38 92% | 2.261 97% | 2.144 103% | 2.196 100% | 2.35 94% |
| CCT | 7434 87% | 6738 96% | 6822 95% | 6809 95% | 7027 93% | 7680 85% |
| Color Space (Percent of AdobeRGB 1998) (%) | 66 | 60 -9% | 71 8% | 65 -2% | 41 -38% | 61 -8% |
| Color Space (Percent of sRGB) (%) | 92 | 95 3% | 93 1% | 87 -5% | 59 -36% | 96 4% |
| Media totale (Programma / Settaggio) | 7% /
8% | -47% /
-17% | 10% /
22% | -70% /
-44% | 5% /
2% |
* ... Meglio usare valori piccoli
Tempi di risposta del Display
| ↔ Tempi di risposta dal Nero al Bianco | ||
|---|---|---|
| 10 ms ... aumenta ↗ e diminuisce ↘ combinato | ↗ 5.2 ms Incremento | 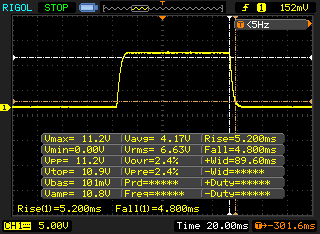 |
| ↘ 4.8 ms Calo | ||
| Lo schermo mostra buoni tempi di risposta durante i nostri tests, ma potrebbe essere troppo lento per i gamers competitivi. In confronto, tutti i dispositivi di test variano da 0.1 (minimo) a 240 (massimo) ms. » 27 % di tutti i dispositivi è migliore. Questo significa che i tempi di risposta rilevati sono migliori rispettto alla media di tutti i dispositivi testati (19.8 ms). | ||
| ↔ Tempo di risposta dal 50% Grigio all'80% Grigio | ||
| 17.6 ms ... aumenta ↗ e diminuisce ↘ combinato | ↗ 8.4 ms Incremento | 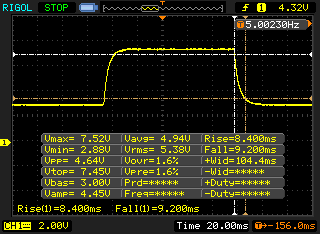 |
| ↘ 9.2 ms Calo | ||
| Lo schermo mostra buoni tempi di risposta durante i nostri tests, ma potrebbe essere troppo lento per i gamers competitivi. In confronto, tutti i dispositivi di test variano da 0.165 (minimo) a 636 (massimo) ms. » 32 % di tutti i dispositivi è migliore. Questo significa che i tempi di risposta rilevati sono migliori rispettto alla media di tutti i dispositivi testati (30.9 ms). | ||
Sfarfallio dello schermo / PWM (Pulse-Width Modulation)
| flickering dello schermo / PWM rilevato | 1000 Hz | ≤ 99 % settaggio luminosita' | 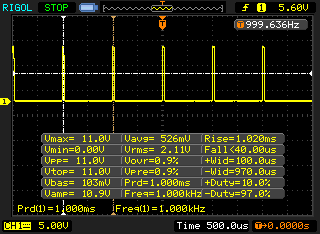 |
Il display sfarfalla a 1000 Hz (Probabilmente a causa dell'uso di PWM) Flickering rilevato ad una luminosita' di 99 % o inferiore. Non dovrebbe verificarsi flickering o PWM sopra questo valore di luminosita'. La frequenza di 1000 Hz è abbastanza alta, quindi la maggioranza degli utenti sensibili al PWM non dovrebbero notare alcun flickering. In confronto: 52 % di tutti i dispositivi testati non utilizza PWM per ridurre la luminosita' del display. Se è rilevato PWM, una media di 7748 (minimo: 5 - massimo: 343500) Hz è stata rilevata. | |||
| Cinebench R15 | |
| CPU Single 64Bit | |
| Media della classe Gaming (188.8 - 350, n=107, ultimi 2 anni) | |
| Schenker XMG Core 17 Comet Lake | |
| Nexoc GH7 716IG | |
| MSI GF75 Thin 10SDR | |
| Media Intel Core i7-10750H (184 - 213, n=45) | |
| Acer Predator Helios 300 PH317-54-75G8 | |
| Schenker XMG Core 17 | |
| Lenovo Legion 5 17IMH05 | |
| CPU Multi 64Bit | |
| Media della classe Gaming (1578 - 6330, n=106, ultimi 2 anni) | |
| Nexoc GH7 716IG | |
| Acer Predator Helios 300 PH317-54-75G8 | |
| Schenker XMG Core 17 Comet Lake (Overboost) | |
| Schenker XMG Core 17 Comet Lake | |
| Media Intel Core i7-10750H (804 - 1418, n=50) | |
| MSI GF75 Thin 10SDR | |
| Schenker XMG Core 17 Comet Lake (Balanced) | |
| Schenker XMG Core 17 | |
| Lenovo Legion 5 17IMH05 | |
| Blender - v2.79 BMW27 CPU | |
| Lenovo Legion 5 17IMH05 | |
| Schenker XMG Core 17 Comet Lake (Balanced) | |
| Media Intel Core i7-10750H (322 - 587, n=43) | |
| MSI GF75 Thin 10SDR | |
| Schenker XMG Core 17 Comet Lake | |
| Acer Predator Helios 300 PH317-54-75G8 | |
| Schenker XMG Core 17 Comet Lake (Overboost) | |
| Media della classe Gaming (79 - 330, n=105, ultimi 2 anni) | |
| 7-Zip 18.03 | |
| 7z b 4 -mmt1 | |
| Media della classe Gaming (4199 - 7436, n=106, ultimi 2 anni) | |
| Schenker XMG Core 17 Comet Lake (Overboost) | |
| Schenker XMG Core 17 Comet Lake | |
| Schenker XMG Core 17 Comet Lake (Balanced) | |
| Acer Predator Helios 300 PH317-54-75G8 | |
| Media Intel Core i7-10750H (4504 - 5470, n=43) | |
| MSI GF75 Thin 10SDR | |
| Lenovo Legion 5 17IMH05 | |
| 7z b 4 | |
| Media della classe Gaming (33491 - 148086, n=106, ultimi 2 anni) | |
| Schenker XMG Core 17 Comet Lake (Overboost) | |
| Schenker XMG Core 17 Comet Lake | |
| Media Intel Core i7-10750H (26040 - 37345, n=43) | |
| MSI GF75 Thin 10SDR | |
| Acer Predator Helios 300 PH317-54-75G8 | |
| Schenker XMG Core 17 Comet Lake (Balanced) | |
| Lenovo Legion 5 17IMH05 | |
| Cinebench R20 | |
| CPU (Single Core) | |
| Media della classe Gaming (442 - 913, n=107, ultimi 2 anni) | |
| Schenker XMG Core 17 Comet Lake (Overboost) | |
| Schenker XMG Core 17 Comet Lake | |
| Schenker XMG Core 17 Comet Lake (Balanced) | |
| Media Intel Core i7-10750H (431 - 504, n=43) | |
| MSI GF75 Thin 10SDR | |
| Acer Predator Helios 300 PH317-54-75G8 | |
| Schenker XMG Core 17 | |
| Lenovo Legion 5 17IMH05 | |
| CPU (Multi Core) | |
| Media della classe Gaming (4029 - 16433, n=107, ultimi 2 anni) | |
| Schenker XMG Core 17 Comet Lake (Overboost) | |
| Acer Predator Helios 300 PH317-54-75G8 | |
| Schenker XMG Core 17 Comet Lake | |
| Media Intel Core i7-10750H (1749 - 3325, n=43) | |
| MSI GF75 Thin 10SDR | |
| Schenker XMG Core 17 | |
| Schenker XMG Core 17 Comet Lake (Balanced) | |
| Lenovo Legion 5 17IMH05 | |
| Geekbench 5.5 | |
| Single-Core | |
| Media della classe Gaming (986 - 2474, n=106, ultimi 2 anni) | |
| Schenker XMG Core 17 Comet Lake | |
| Schenker XMG Core 17 Comet Lake (Overboost) | |
| Nexoc GH7 716IG | |
| MSI GF75 Thin 10SDR | |
| Schenker XMG Core 17 Comet Lake (Balanced) | |
| Media Intel Core i7-10750H (1114 - 1333, n=43) | |
| Acer Predator Helios 300 PH317-54-75G8 | |
| Lenovo Legion 5 17IMH05 | |
| Multi-Core | |
| Media della classe Gaming (6460 - 28263, n=106, ultimi 2 anni) | |
| Schenker XMG Core 17 Comet Lake (Overboost) | |
| Nexoc GH7 716IG | |
| Schenker XMG Core 17 Comet Lake | |
| MSI GF75 Thin 10SDR | |
| Acer Predator Helios 300 PH317-54-75G8 | |
| Media Intel Core i7-10750H (4443 - 6674, n=43) | |
| Schenker XMG Core 17 Comet Lake (Balanced) | |
| Lenovo Legion 5 17IMH05 | |
| HWBOT x265 Benchmark v2.2 - 4k Preset | |
| Media della classe Gaming (11.5 - 44.4, n=106, ultimi 2 anni) | |
| Schenker XMG Core 17 Comet Lake (Overboost) | |
| Acer Predator Helios 300 PH317-54-75G8 | |
| Schenker XMG Core 17 Comet Lake | |
| Media Intel Core i7-10750H (5.54 - 11.6, n=43) | |
| MSI GF75 Thin 10SDR | |
| Schenker XMG Core 17 Comet Lake (Balanced) | |
| Lenovo Legion 5 17IMH05 | |
| LibreOffice - 20 Documents To PDF | |
| Lenovo Legion 5 17IMH05 | |
| Acer Predator Helios 300 PH317-54-75G8 | |
| MSI GF75 Thin 10SDR | |
| Schenker XMG Core 17 Comet Lake | |
| Media Intel Core i7-10750H (43.1 - 99.2, n=43) | |
| Media della classe Gaming (33.2 - 88.8, n=106, ultimi 2 anni) | |
| Nexoc GH7 716IG | |
| Schenker XMG Core 17 Comet Lake (Overboost) | |
| R Benchmark 2.5 - Overall mean | |
| Lenovo Legion 5 17IMH05 | |
| MSI GF75 Thin 10SDR | |
| Acer Predator Helios 300 PH317-54-75G8 | |
| Media Intel Core i7-10750H (0.578 - 0.708, n=42) | |
| Schenker XMG Core 17 Comet Lake (Balanced) | |
| Schenker XMG Core 17 Comet Lake (Overboost) | |
| Schenker XMG Core 17 Comet Lake | |
| Media della classe Gaming (0.3439 - 0.759, n=107, ultimi 2 anni) | |
* ... Meglio usare valori piccoli
| PCMark 8 Home Score Accelerated v2 | 4136 punti | |
| PCMark 8 Creative Score Accelerated v2 | 5002 punti | |
| PCMark 8 Work Score Accelerated v2 | 5610 punti | |
| PCMark 10 Score | 5185 punti | |
Aiuto | ||
| DPC Latencies / LatencyMon - interrupt to process latency (max), Web, Youtube, Prime95 | |
| Lenovo Legion 5 17IMH05 | |
| MSI GF75 Thin 10SDR | |
| Schenker XMG Core 17 Comet Lake | |
| Nexoc GH7 716IG | |
| Acer Predator Helios 300 PH317-54-75G8 | |
* ... Meglio usare valori piccoli

| Schenker XMG Core 17 Comet Lake Samsung SSD 970 EVO Plus 1TB | Lenovo Legion 5 17IMH05 SK hynix BC511 HFM512GDHTNI-87A0B | Acer Predator Helios 300 PH317-54-75G8 WDC PC SN730 SDBQNTY-1T00 | MSI GF75 Thin 10SDR Samsung PM991 MZVLQ512HALU | Nexoc GH7 716IG Samsung SSD 970 EVO Plus 500GB | Schenker XMG Core 17 Samsung SSD 970 EVO Plus 500GB | |
|---|---|---|---|---|---|---|
| CrystalDiskMark 5.2 / 6 | -36% | -15% | -34% | 4% | -31% | |
| Write 4K (MB/s) | 169.5 | 134.7 -21% | 141.9 -16% | 138.8 -18% | 201.6 19% | 99.3 -41% |
| Read 4K (MB/s) | 51.5 | 44.84 -13% | 48.75 -5% | 50.6 -2% | 54.8 6% | 38.47 -25% |
| Write Seq (MB/s) | 3009 | 1053 -65% | 2734 -9% | 1032 -66% | 2999 0% | 1449 -52% |
| Read Seq (MB/s) | 2959 | 1241 -58% | 1921 -35% | 1199 -59% | 3023 2% | 1237 -58% |
| Write 4K Q32T1 (MB/s) | 536 | 499.8 -7% | 422.6 -21% | 464.6 -13% | 545 2% | 364.4 -32% |
| Read 4K Q32T1 (MB/s) | 621 | 518 -17% | 509 -18% | 550 -11% | 636 2% | 421.9 -32% |
| Write Seq Q32T1 (MB/s) | 3339 | 1022 -69% | 3055 -9% | 1216 -64% | 3262 -2% | 3276 -2% |
| Read Seq Q32T1 (MB/s) | 3561 | 2263 -36% | 3257 -9% | 2275 -36% | 3550 0% | 3338 -6% |
| AS SSD | -50% | -18% | -69% | 1% | -34% | |
| Seq Read (MB/s) | 2937 | 1635 -44% | 2828 -4% | 1976 -33% | 3008 2% | 2283 -22% |
| Seq Write (MB/s) | 2858 | 913 -68% | 2677 -6% | 1057 -63% | 2521 -12% | 2779 -3% |
| 4K Read (MB/s) | 50.3 | 46.18 -8% | 39.94 -21% | 45.31 -10% | 64.3 28% | 29.99 -40% |
| 4K Write (MB/s) | 130.6 | 101.7 -22% | 100.9 -23% | 119.1 -9% | 142.5 9% | 99.1 -24% |
| 4K-64 Read (MB/s) | 1710 | 773 -55% | 1562 -9% | 817 -52% | 1664 -3% | 1156 -32% |
| 4K-64 Write (MB/s) | 2355 | 745 -68% | 1867 -21% | 672 -71% | 2447 4% | 2333 -1% |
| Access Time Read * (ms) | 0.037 | 0.05 -35% | 0.156 -322% | 0.047 -27% | 0.092 -149% | |
| Access Time Write * (ms) | 0.028 | 0.037 -32% | 0.037 -32% | 0.034 -21% | 0.026 7% | 0.037 -32% |
| Score Read (Points) | 2054 | 983 -52% | 1885 -8% | 1060 -48% | 2029 -1% | 1414 -31% |
| Score Write (Points) | 2771 | 938 -66% | 2236 -19% | 897 -68% | 2842 3% | 2710 -2% |
| Score Total (Points) | 5873 | 2399 -59% | 5076 -14% | 2464 -58% | 5893 0% | 4871 -17% |
| Copy ISO MB/s (MB/s) | 2225 | 573 -74% | 1870 -16% | 1394 -37% | ||
| Copy Program MB/s (MB/s) | 779 | 344.4 -56% | 545 -30% | 379.8 -51% | ||
| Copy Game MB/s (MB/s) | 1590 | 535 -66% | 1083 -32% | 976 -39% | ||
| Media totale (Programma / Settaggio) | -43% /
-45% | -17% /
-17% | -52% /
-54% | 3% /
2% | -33% /
-33% |
* ... Meglio usare valori piccoli
Continuous load read: DiskSpd Read Loop, Queue Depth 8
| 3DMark 11 Performance | 13280 punti | |
| 3DMark Cloud Gate Standard Score | 33280 punti | |
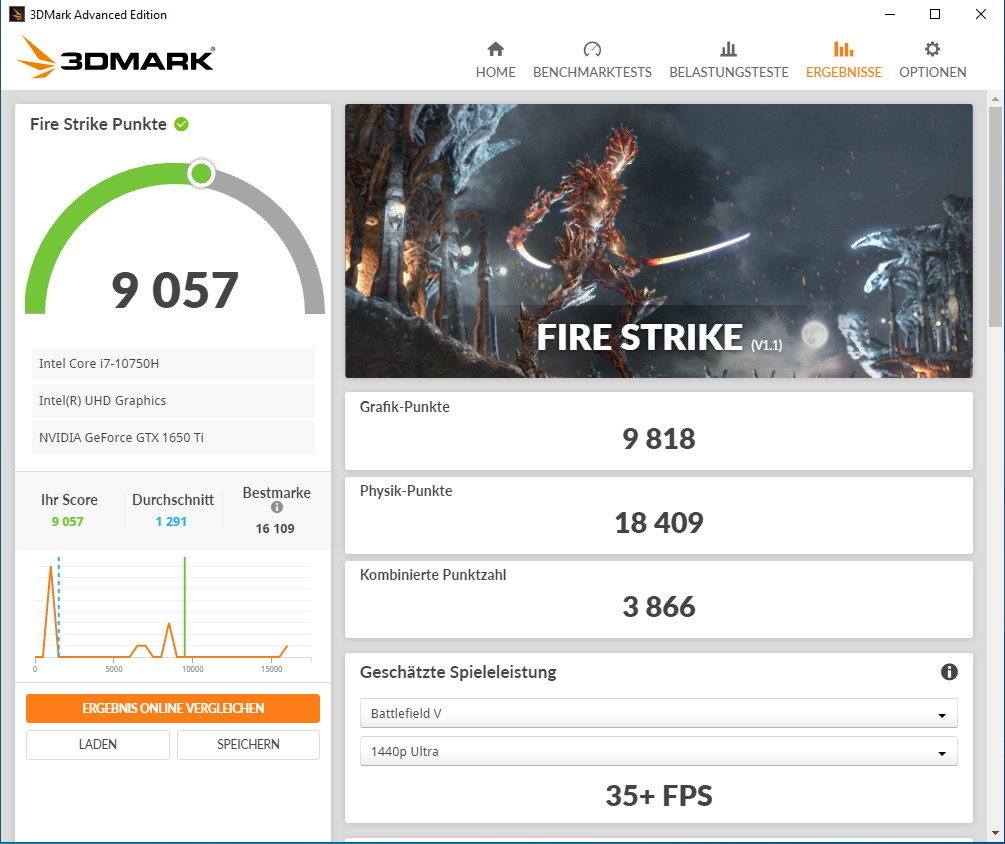
| 3DMark Fire Strike Score | 9057 punti | |
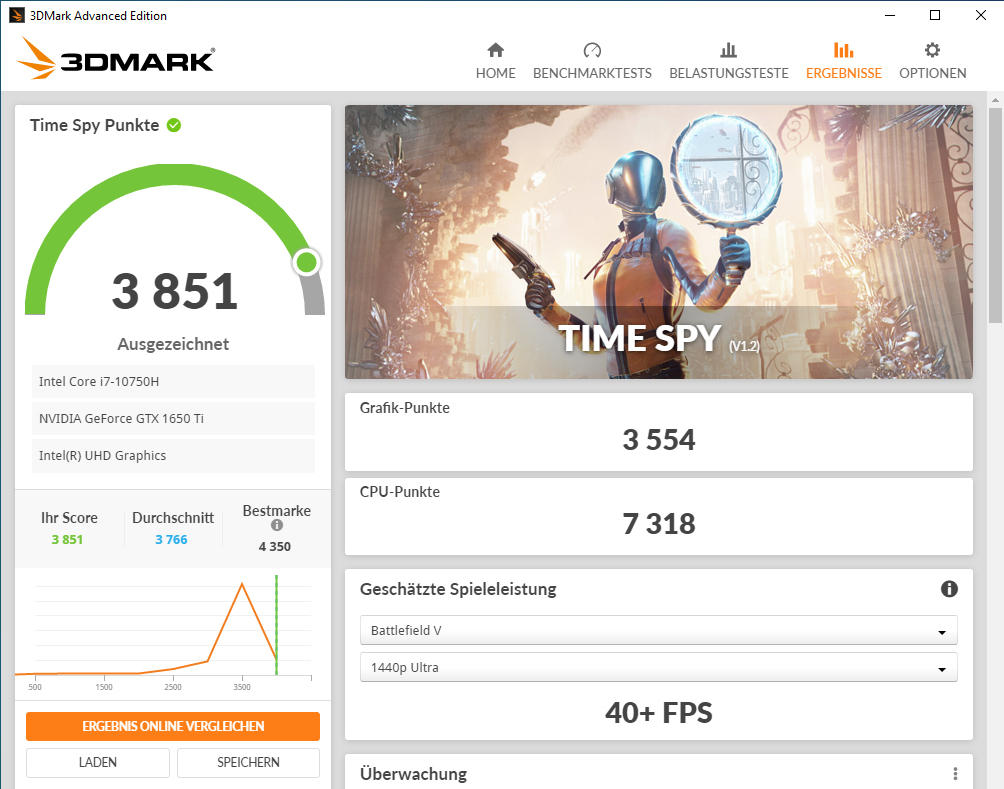
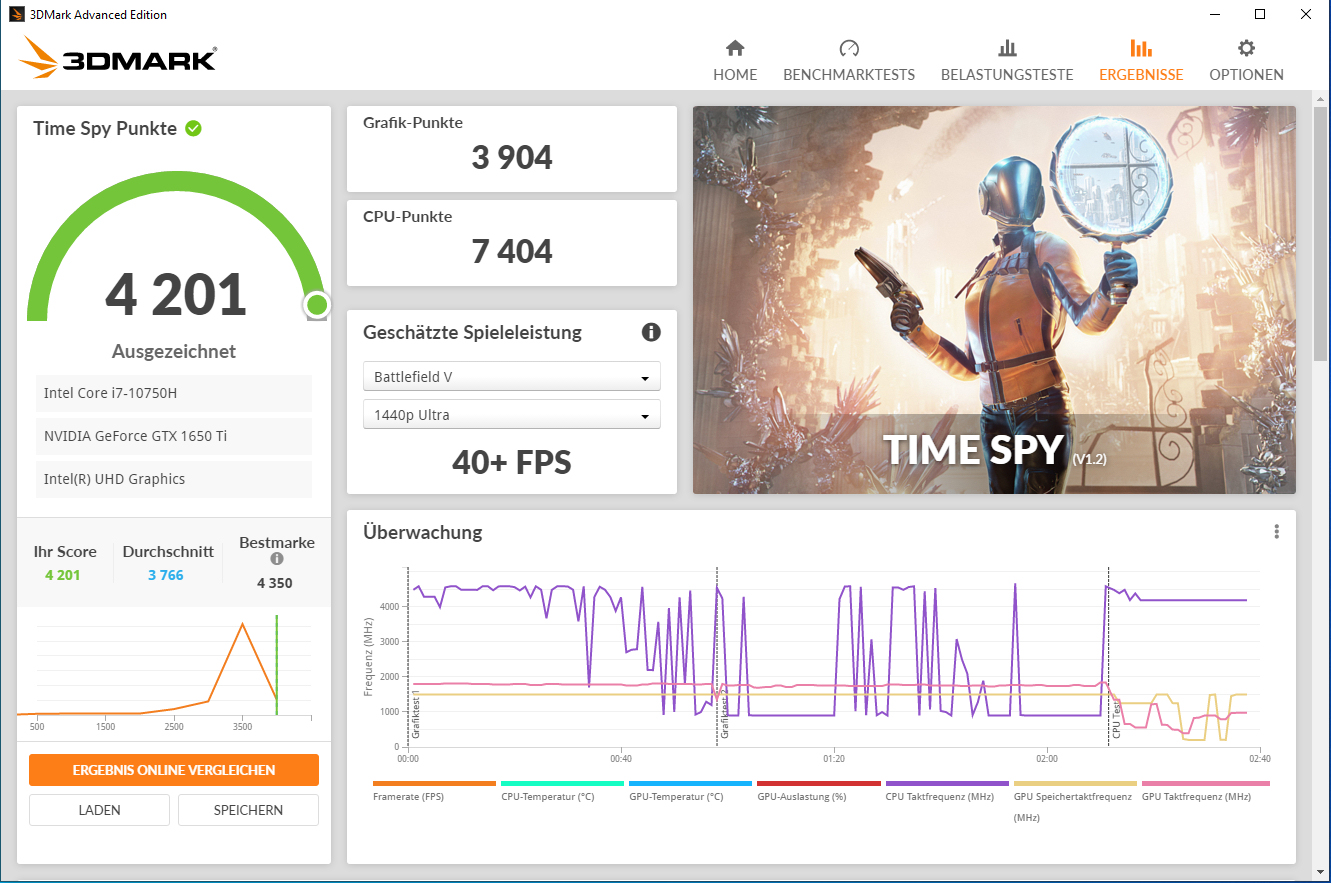
| 3DMark Time Spy Score | 3851 punti | |
Aiuto | ||
| 3DMark | |
| 1280x720 Cloud Gate Standard Graphics | |
| Media della classe Gaming (86886 - 223650, n=60, ultimi 2 anni) | |
| Acer Predator Helios 300 PH317-54-75G8 | |
| Schenker XMG Core 17 | |
| Schenker XMG Core 17 Comet Lake | |
| Lenovo Legion 5 17IMH05 | |
| Media NVIDIA GeForce GTX 1650 Ti Mobile (34971 - 70377, n=7) | |
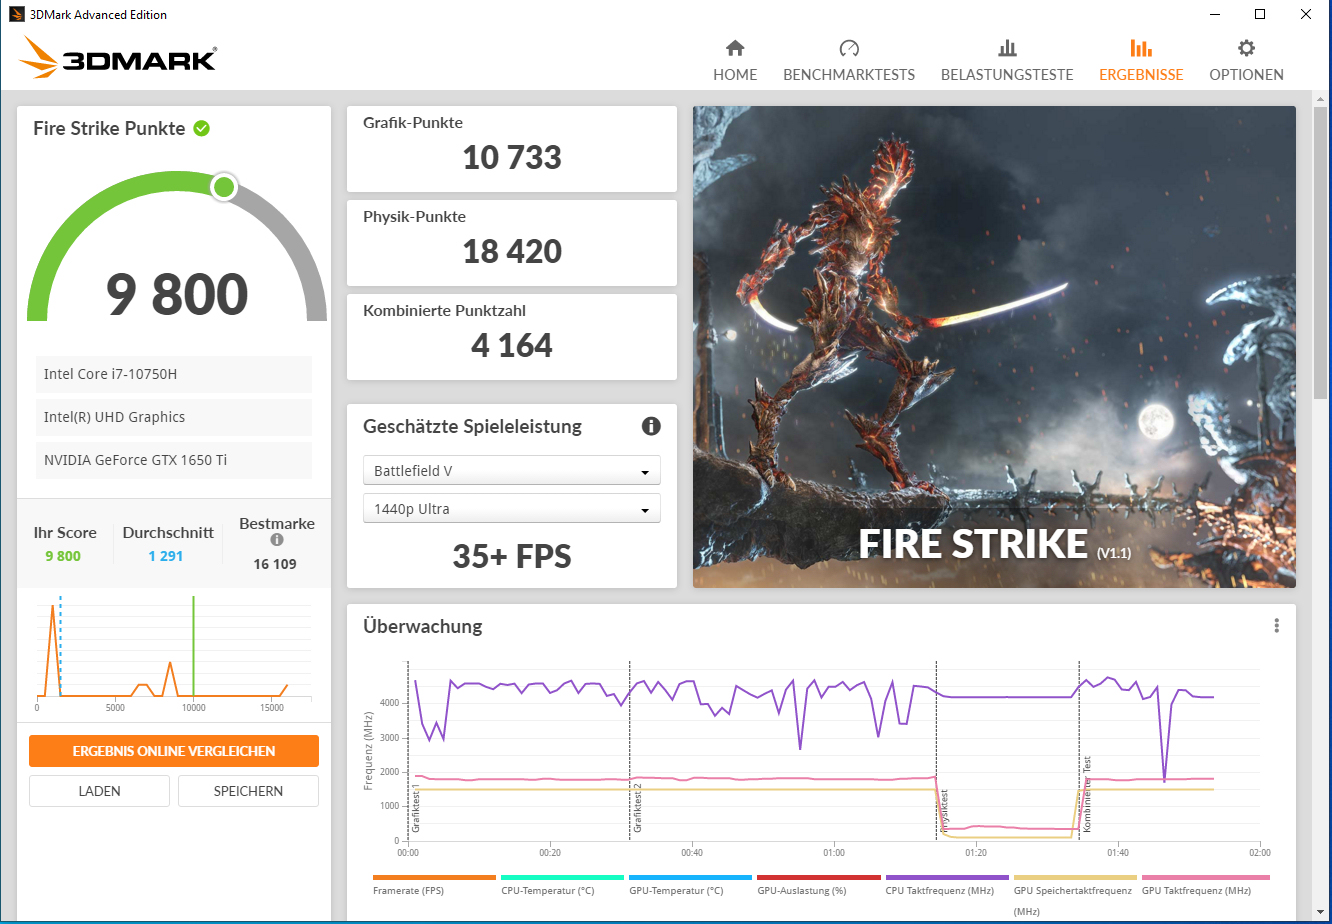
| 1920x1080 Fire Strike Graphics | |
| Media della classe Gaming (12242 - 62849, n=116, ultimi 2 anni) | |
| Acer Predator Helios 300 PH317-54-75G8 | |
| MSI GF75 Thin 10SDR | |
| Schenker XMG Core 17 | |
| Schenker XMG Core 17 Comet Lake (Overboost) | |
| Media NVIDIA GeForce GTX 1650 Ti Mobile (9691 - 10733, n=9) | |
| Schenker XMG Core 17 Comet Lake | |
| Lenovo Legion 5 17IMH05 | |
| 2560x1440 Time Spy Graphics | |
| Media della classe Gaming (5012 - 26212, n=116, ultimi 2 anni) | |
| Acer Predator Helios 300 PH317-54-75G8 | |
| MSI GF75 Thin 10SDR | |
| Schenker XMG Core 17 | |
| Schenker XMG Core 17 Comet Lake (Overboost) | |
| Media NVIDIA GeForce GTX 1650 Ti Mobile (3554 - 3904, n=9) | |
| Schenker XMG Core 17 Comet Lake | |
| Lenovo Legion 5 17IMH05 | |
| The Witcher 3 - 1920x1080 Ultra Graphics & Postprocessing (HBAO+) | |
| Media della classe Gaming (104.7 - 240, n=7, ultimi 2 anni) | |
| Acer Predator Helios 300 PH317-54-75G8 | |
| MSI GF75 Thin 10SDR | |
| Schenker XMG Core 17 | |
| Nexoc GH7 716IG | |
| Schenker XMG Core 17 Comet Lake | |
| Schenker XMG Core 17 Comet Lake (Overboost) | |
| Lenovo Legion 5 17IMH05 | |
| Media NVIDIA GeForce GTX 1650 Ti Mobile (34.7 - 42.3, n=8) | |
| Dota 2 Reborn - 1920x1080 ultra (3/3) best looking | |
| Media della classe Gaming (84.8 - 252, n=108, ultimi 2 anni) | |
| Nexoc GH7 716IG | |
| MSI GF75 Thin 10SDR | |
| Schenker XMG Core 17 Comet Lake | |
| Schenker XMG Core 17 Comet Lake (Overboost) | |
| Media NVIDIA GeForce GTX 1650 Ti Mobile (87.1 - 120, n=8) | |
| Schenker XMG Core 17 Comet Lake (Balanced) | |
| X-Plane 11.11 - 1920x1080 high (fps_test=3) | |
| Media della classe Gaming (55.5 - 148.5, n=110, ultimi 2 anni) | |
| Nexoc GH7 716IG | |
| MSI GF75 Thin 10SDR | |
| Schenker XMG Core 17 Comet Lake (Overboost) | |
| Schenker XMG Core 17 Comet Lake | |
| Schenker XMG Core 17 Comet Lake (Balanced) | |
| Media NVIDIA GeForce GTX 1650 Ti Mobile (59.1 - 75.9, n=8) | |
| Horizon Zero Dawn - 1920x1080 Ultimate Quality | |
| Acer Predator Helios 300 PH317-54-75G8 | |
| MSI GF75 Thin 10SDR | |
| Media NVIDIA GeForce GTX 1650 Ti Mobile (43 - 48, n=4) | |
| Schenker XMG Core 17 Comet Lake | |
| Schenker XMG Core 17 Comet Lake (Overboost) | |
| Watch Dogs Legion - 1920x1080 High Preset (DX12) | |
| Media NVIDIA GeForce GTX 1650 Ti Mobile (50 - 53.1, n=2) | |
| Schenker XMG Core 17 Comet Lake | |
| Immortals Fenyx Rising - 1920x1080 High Preset | |
| Media NVIDIA GeForce GTX 1650 Ti Mobile (38 - 46, n=2) | |
| Schenker XMG Core 17 Comet Lake | |
| basso | medio | alto | ultra | |
|---|---|---|---|---|
| The Witcher 3 (2015) | 217 | 133.4 | 74.1 | 42.3 |
| Dota 2 Reborn (2015) | 148 | 129 | 120 | 112 |
| X-Plane 11.11 (2018) | 103 | 89.9 | 75.7 | |
| Doom Eternal (2020) | 188.3 | 97.9 | 82.3 | |
| F1 2020 (2020) | 206 | 110 | 87.9 | 61.4 |
| Horizon Zero Dawn (2020) | 110 | 62 | 50 | 43 |
| Serious Sam 4 (2020) | 119 | 55.8 | 43.4 | 32.9 |
| Watch Dogs Legion (2020) | 97 | 57 | 50 | 22 |
| Assassin´s Creed Valhalla (2020) | 85 | 49 | 35 | 15 |
| Yakuza Like a Dragon (2020) | 121.1 | 49.4 | 49 | 42.9 |
| Immortals Fenyx Rising (2020) | 92 | 54 | 38 | 33 |
| Cyberpunk 2077 1.0 (2020) | 69.5 | 34.2 | 27.9 | 23.2 |
Rumorosità
| Idle |
| 25 / 31 / 32 dB(A) |
| Sotto carico |
| 48 / 51 dB(A) |
 | ||
30 dB silenzioso 40 dB(A) udibile 50 dB(A) rumoroso |
||
min: | ||
(±) La temperatura massima sul lato superiore è di 45 °C / 113 F, rispetto alla media di 40.4 °C / 105 F, che varia da 21.2 a 68.8 °C per questa classe Gaming.
(-) Il lato inferiore si riscalda fino ad un massimo di 48 °C / 118 F, rispetto alla media di 43.2 °C / 110 F
(+) In idle, la temperatura media del lato superiore è di 26.3 °C / 79 F, rispetto alla media deld ispositivo di 33.9 °C / 93 F.
(±) Riproducendo The Witcher 3, la temperatura media per il lato superiore e' di 34.7 °C / 94 F, rispetto alla media del dispositivo di 33.9 °C / 93 F.
(+) I poggiapolsi e il touchpad sono piu' freddi della temperatura della pelle con un massimo di 31 °C / 87.8 F e sono quindi freddi al tatto.
(-) La temperatura media della zona del palmo della mano di dispositivi simili e'stata di 28.8 °C / 83.8 F (-2.2 °C / -4 F).
Schenker XMG Core 17 Comet Lake analisi audio
(-) | altoparlanti non molto potenti (67 dB)
Bassi 100 - 315 Hz
(-) | quasi nessun basso - in media 20.8% inferiori alla media
(±) | la linearità dei bassi è media (11.1% delta rispetto alla precedente frequenza)
Medi 400 - 2000 Hz
(+) | medi bilanciati - solo only 3.2% rispetto alla media
(±) | linearità dei medi adeguata (8.5% delta rispetto alla precedente frequenza)
Alti 2 - 16 kHz
(+) | Alti bilanciati - appena 3.9% dalla media
(±) | la linearità degli alti è media (7.1% delta rispetto alla precedente frequenza)
Nel complesso 100 - 16.000 Hz
(±) | la linearità complessiva del suono è media (23.6% di differenza rispetto alla media
Rispetto alla stessa classe
» 86% di tutti i dispositivi testati in questa classe è stato migliore, 4% simile, 10% peggiore
» Il migliore ha avuto un delta di 6%, medio di 18%, peggiore di 132%
Rispetto a tutti i dispositivi testati
» 71% di tutti i dispositivi testati in questa classe è stato migliore, 6% similare, 23% peggiore
» Il migliore ha avuto un delta di 4%, medio di 23%, peggiore di 134%
| Off / Standby | |
| Idle | |
| Sotto carico |
|
Leggenda:
min: | |
Pro
Contro
Grazie al processore Core i7-10750H e alla GPU GeForce GTX 1650 Ti, lo Schenker XMG Core 17 gestisce tutti i giochi per computer moderni senza problemi sullo schermo. Tuttavia, la GPU non è progettata per impostazioni di massima qualità.
I potenziali acquirenti dovrebbero chiedersi se il modello con la GPU GeForce RTX 2060 potrebbe essere una scelta migliore prima di acquistare il portatile. Questa GPU di classe superiore è disponibile per un sovrapprezzo di prezzo di poco meno di 150 Euro (~$183), e potrebbe ripagare a lungo termine.
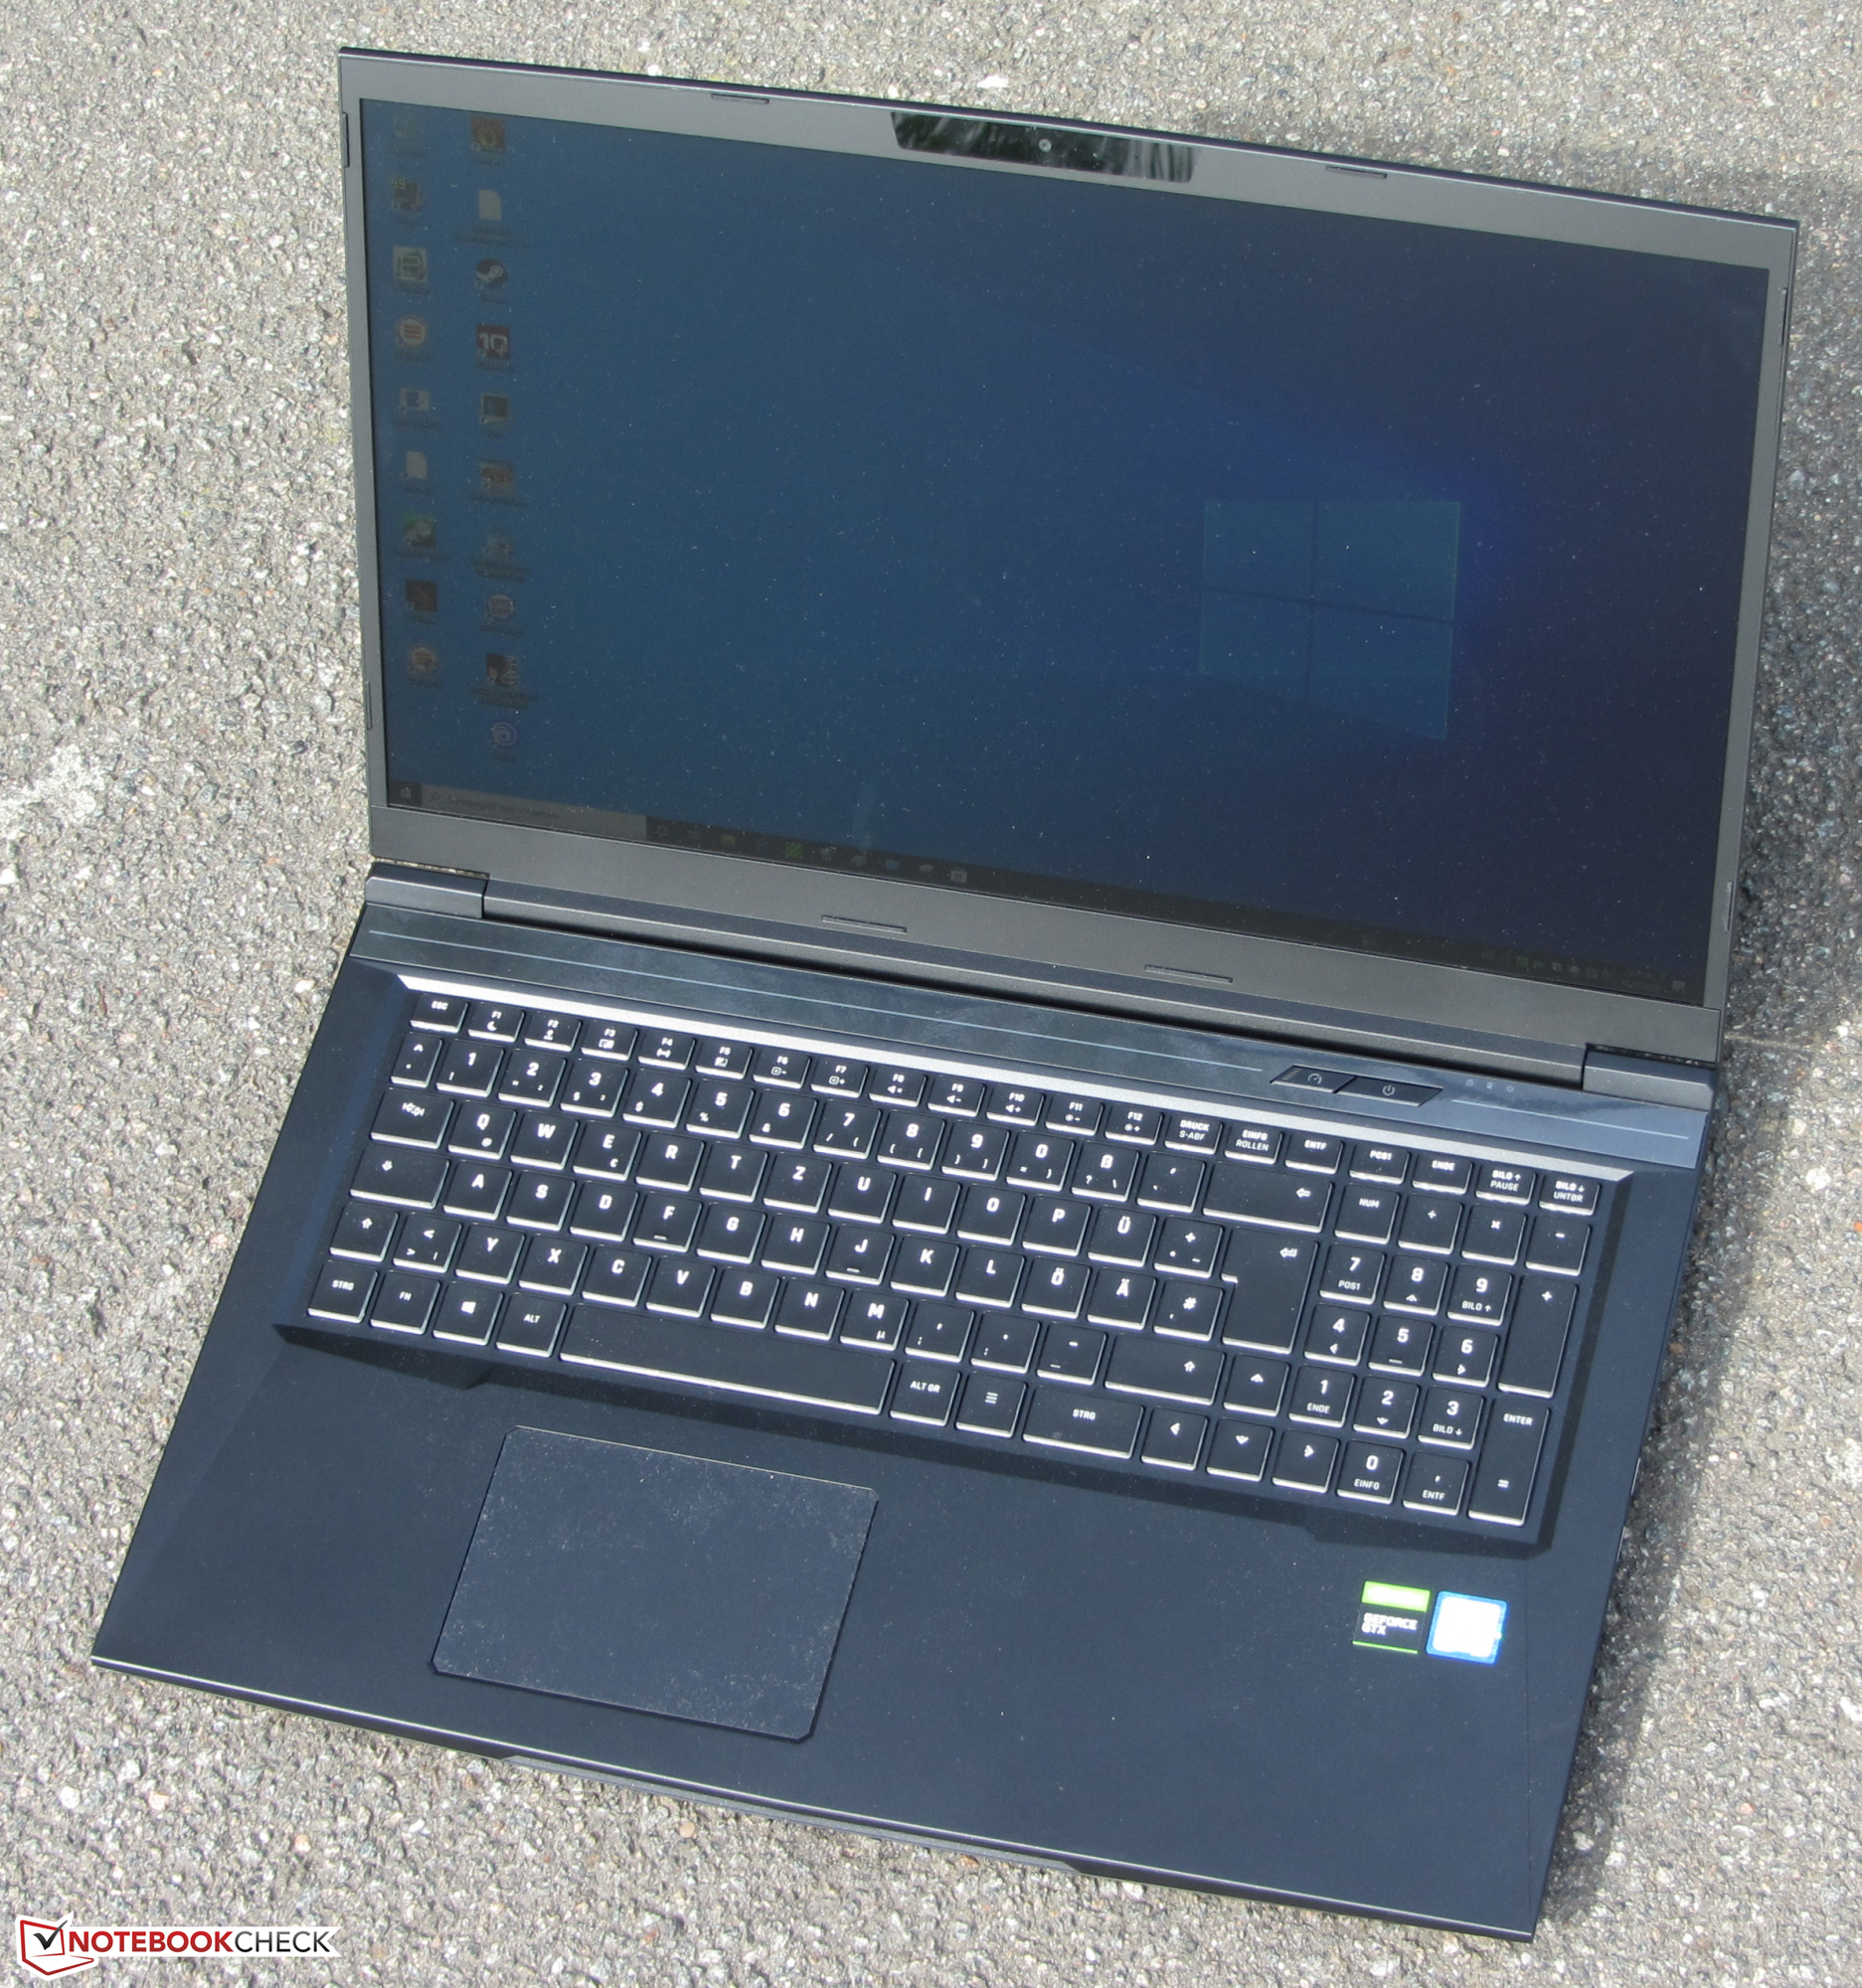
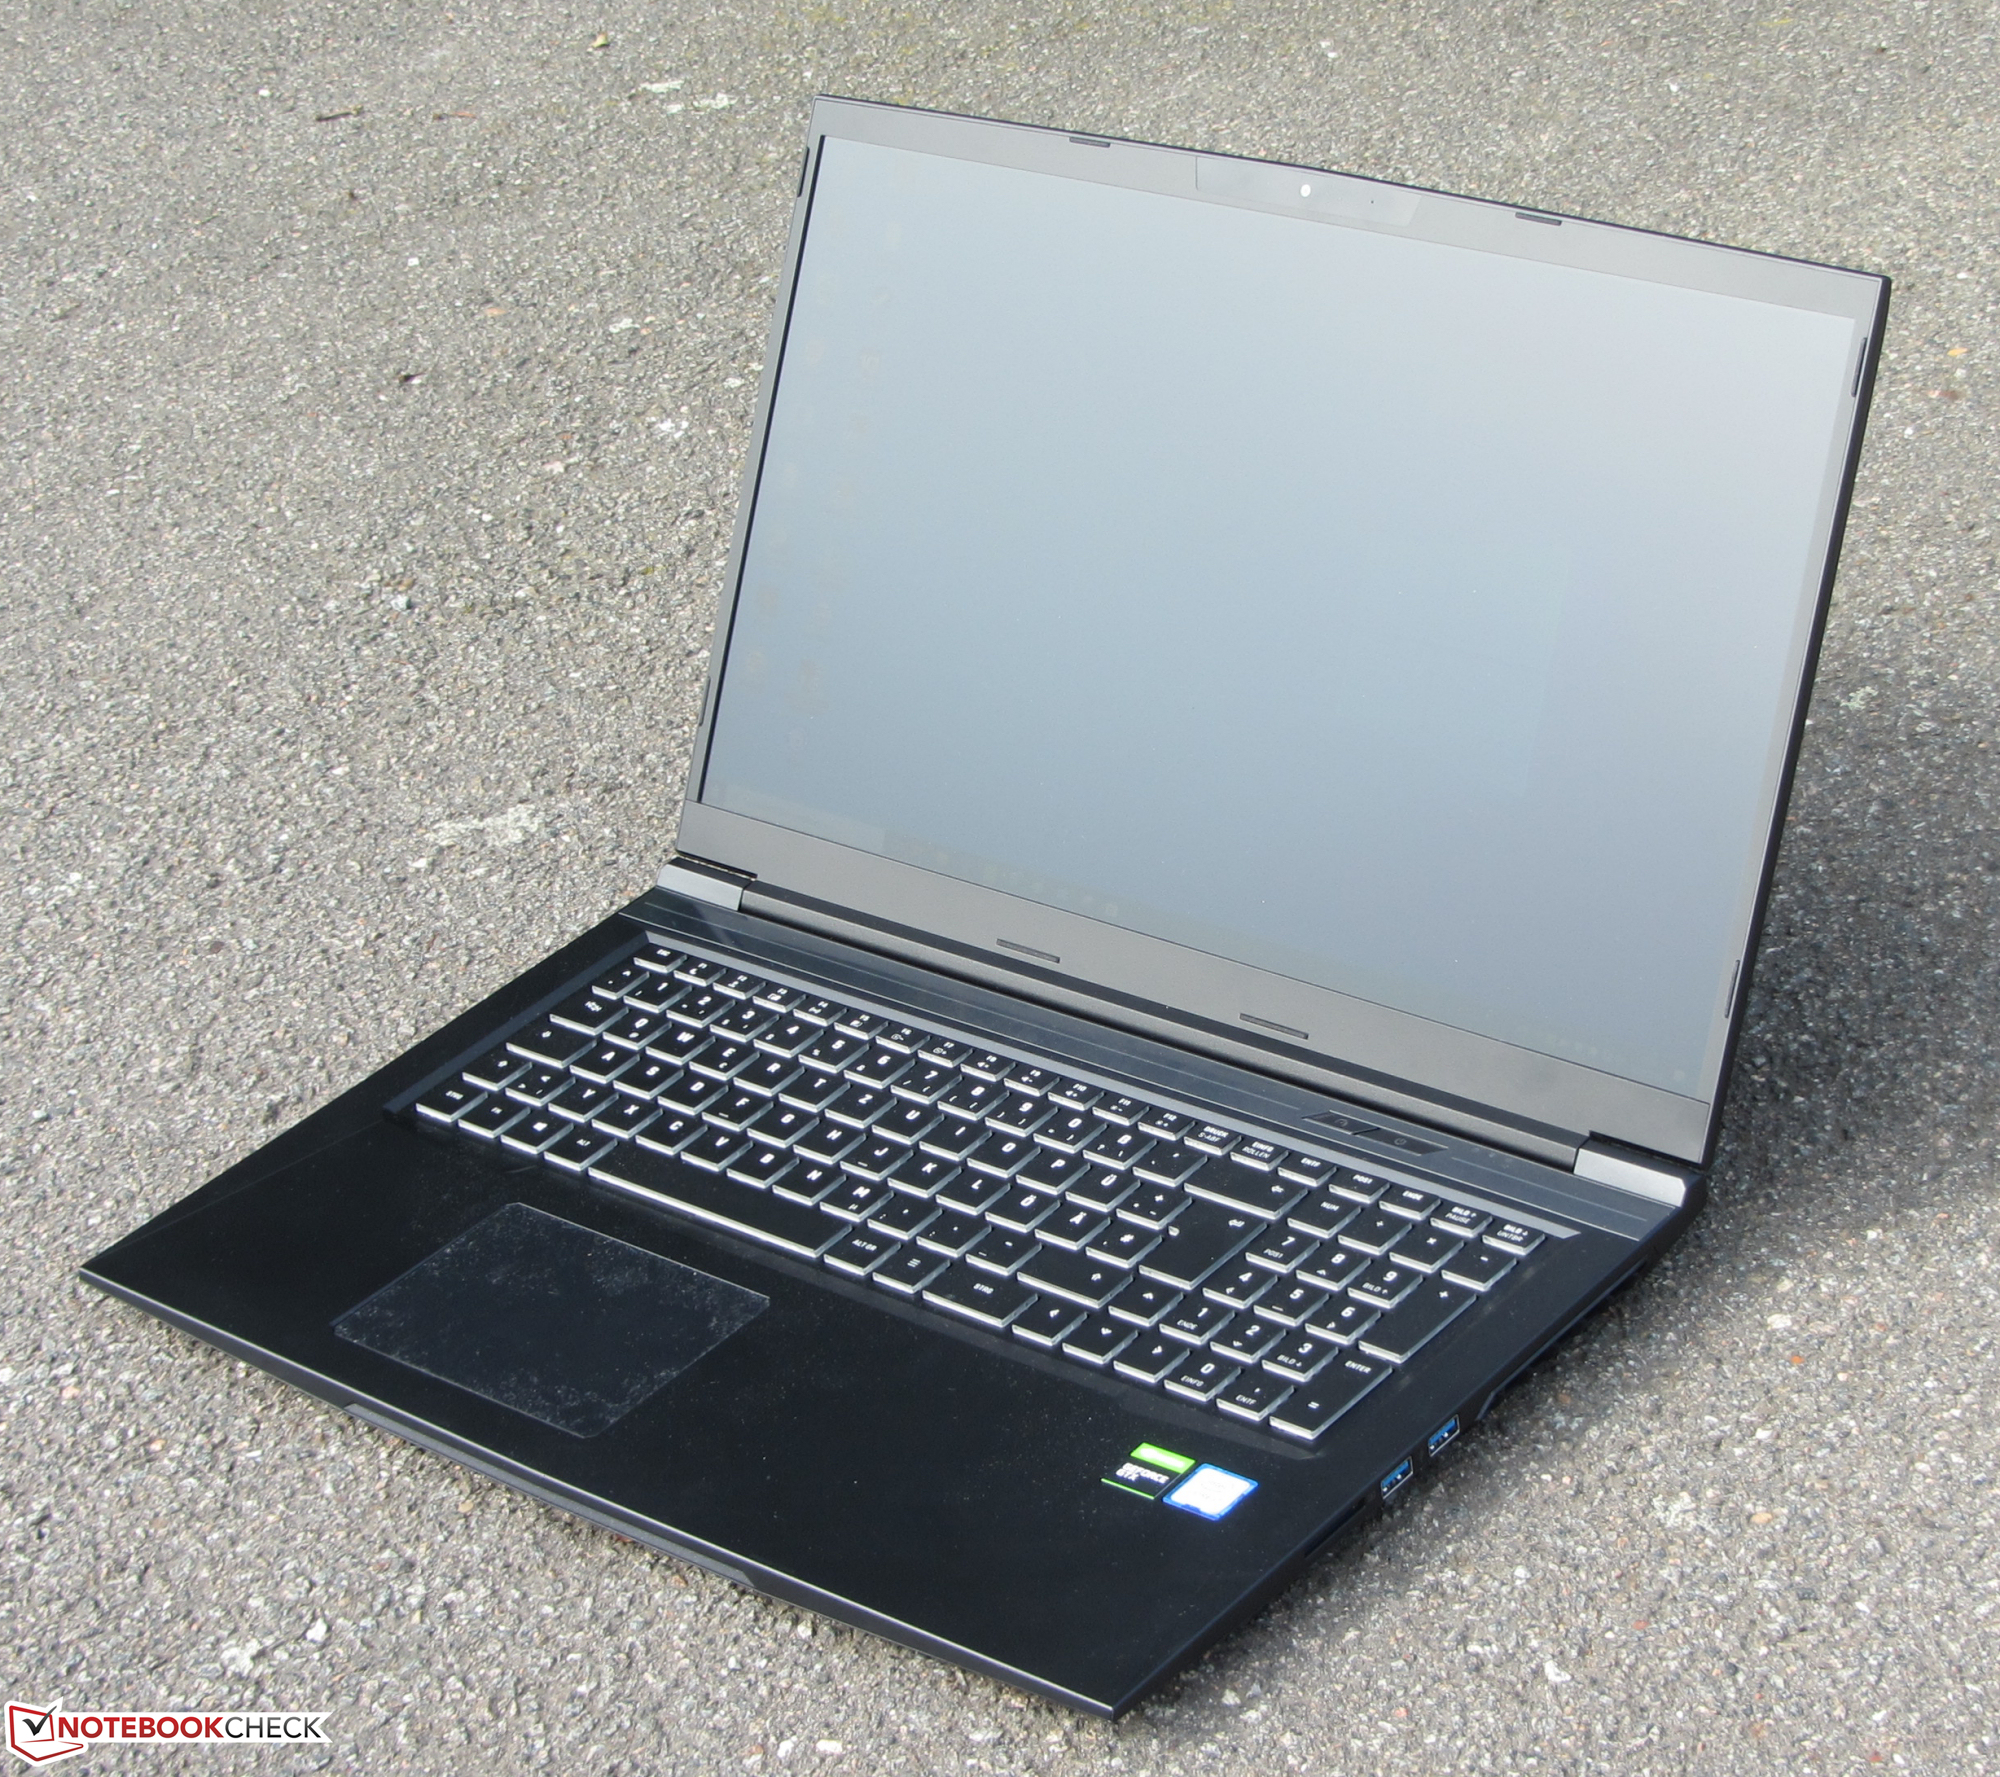
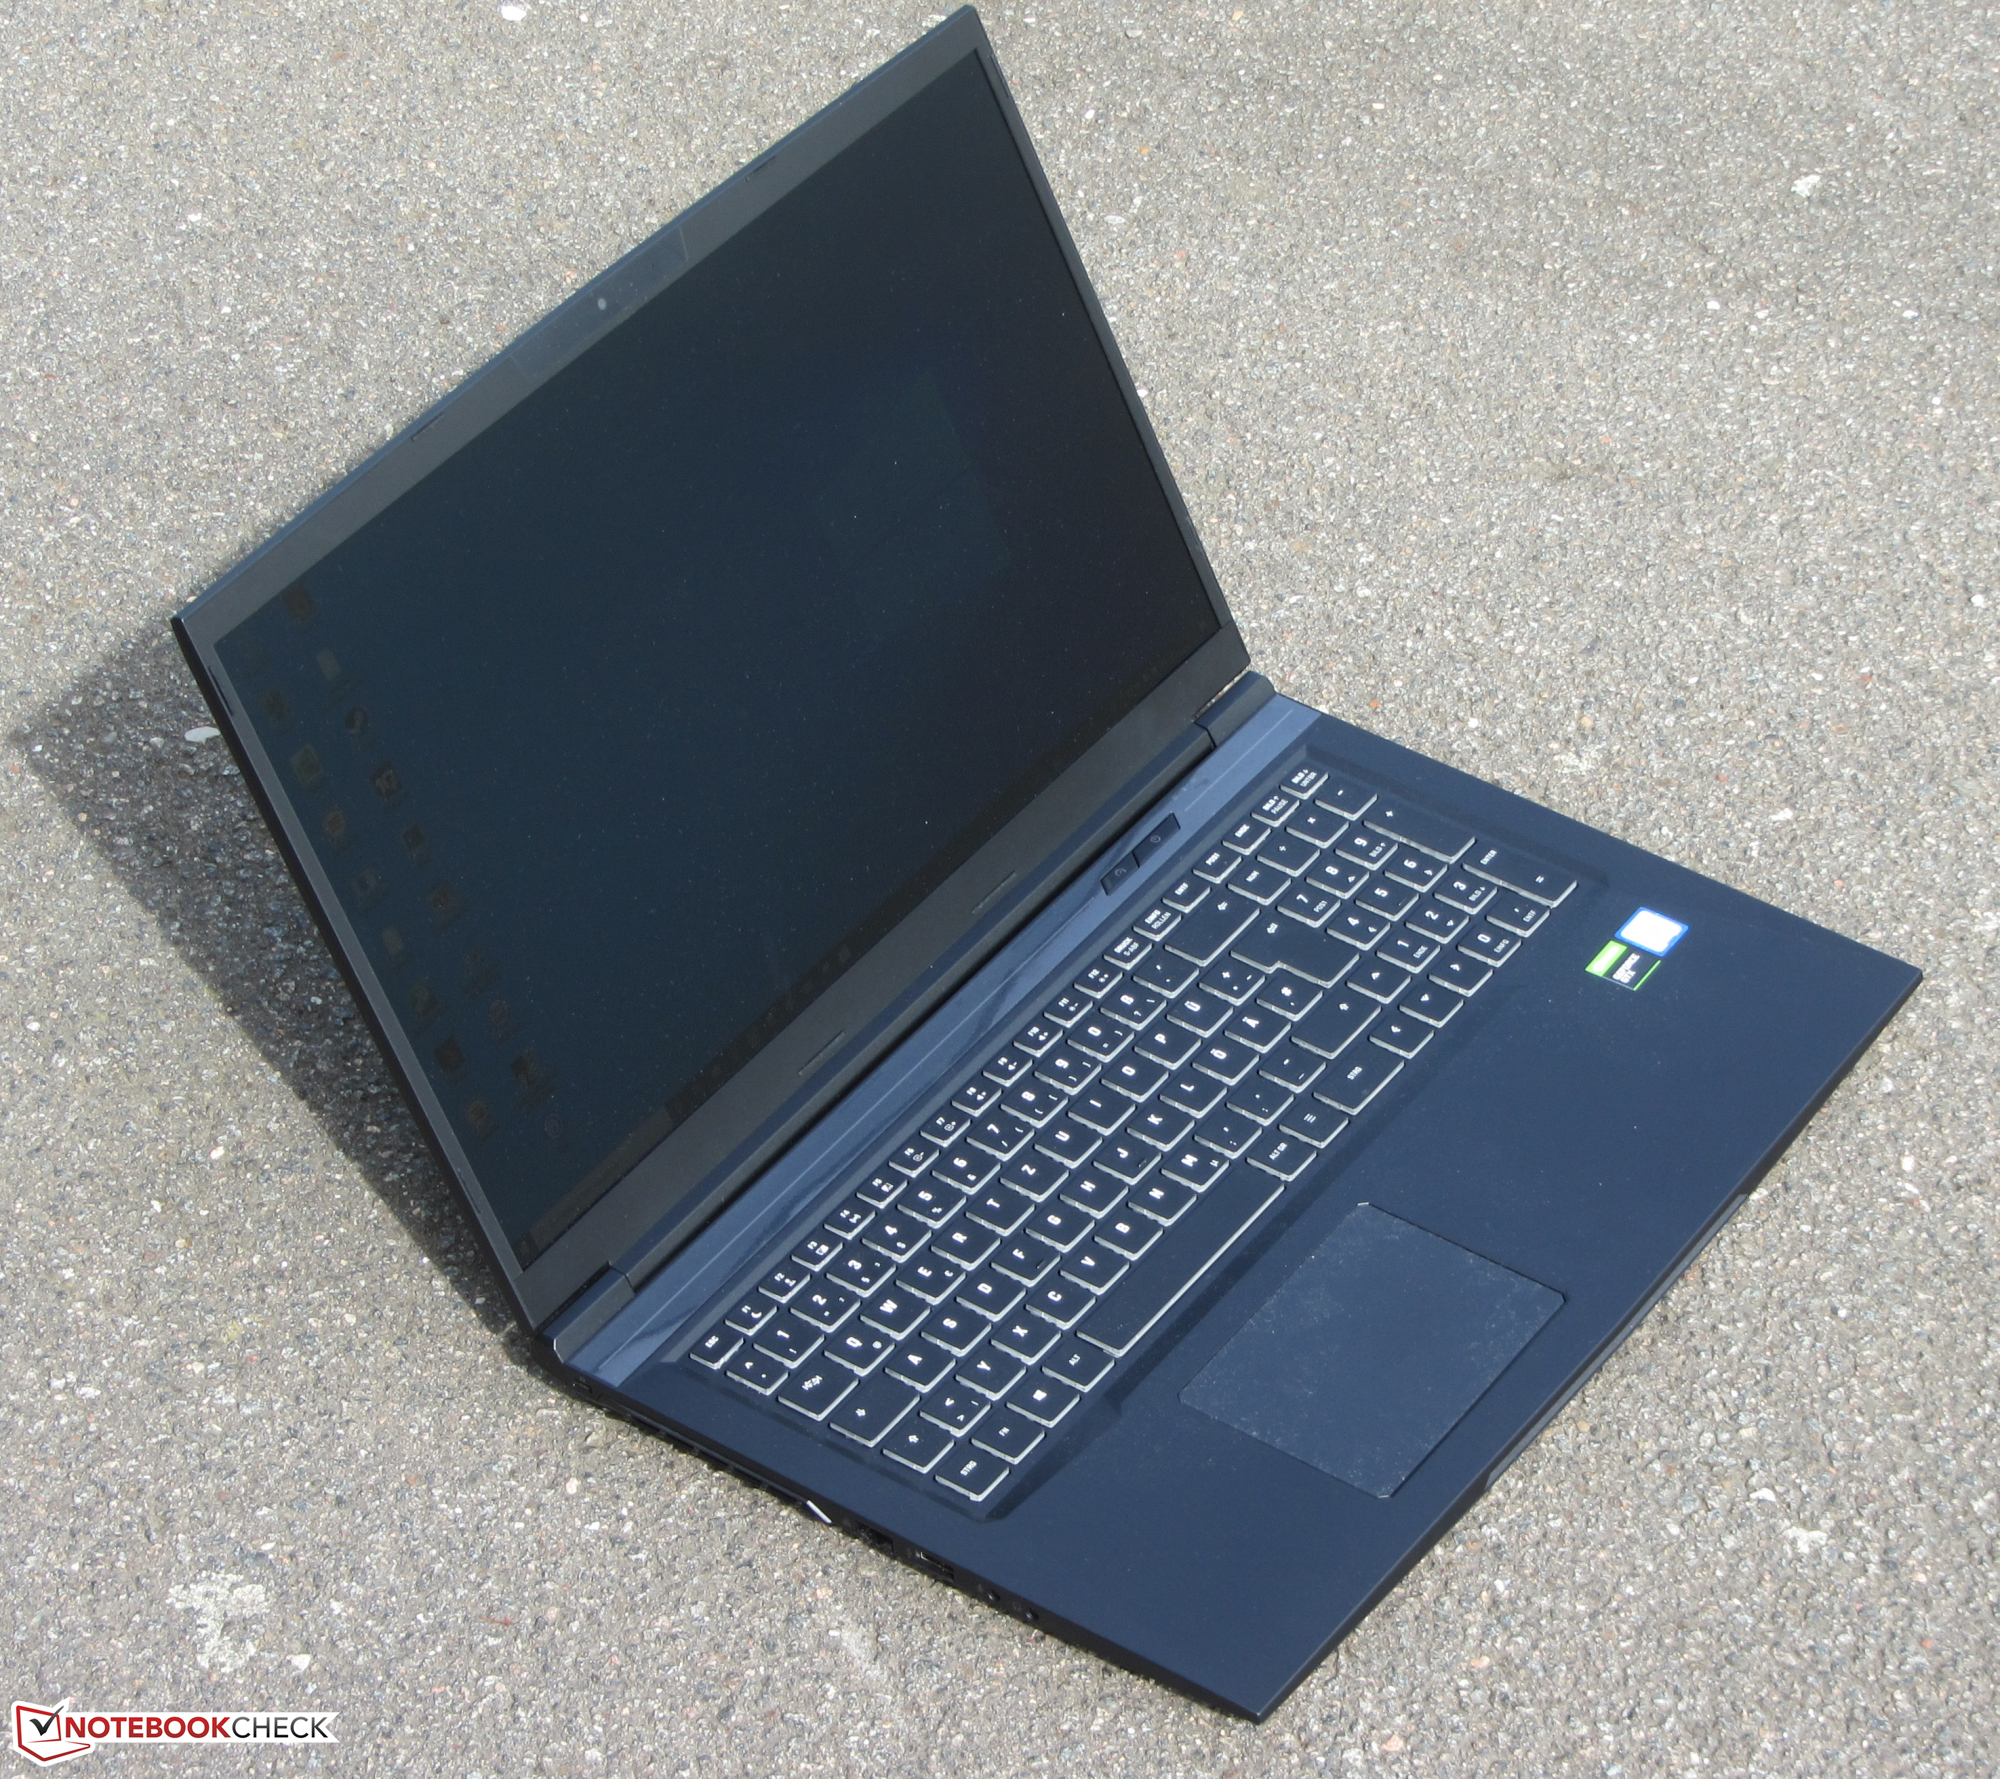
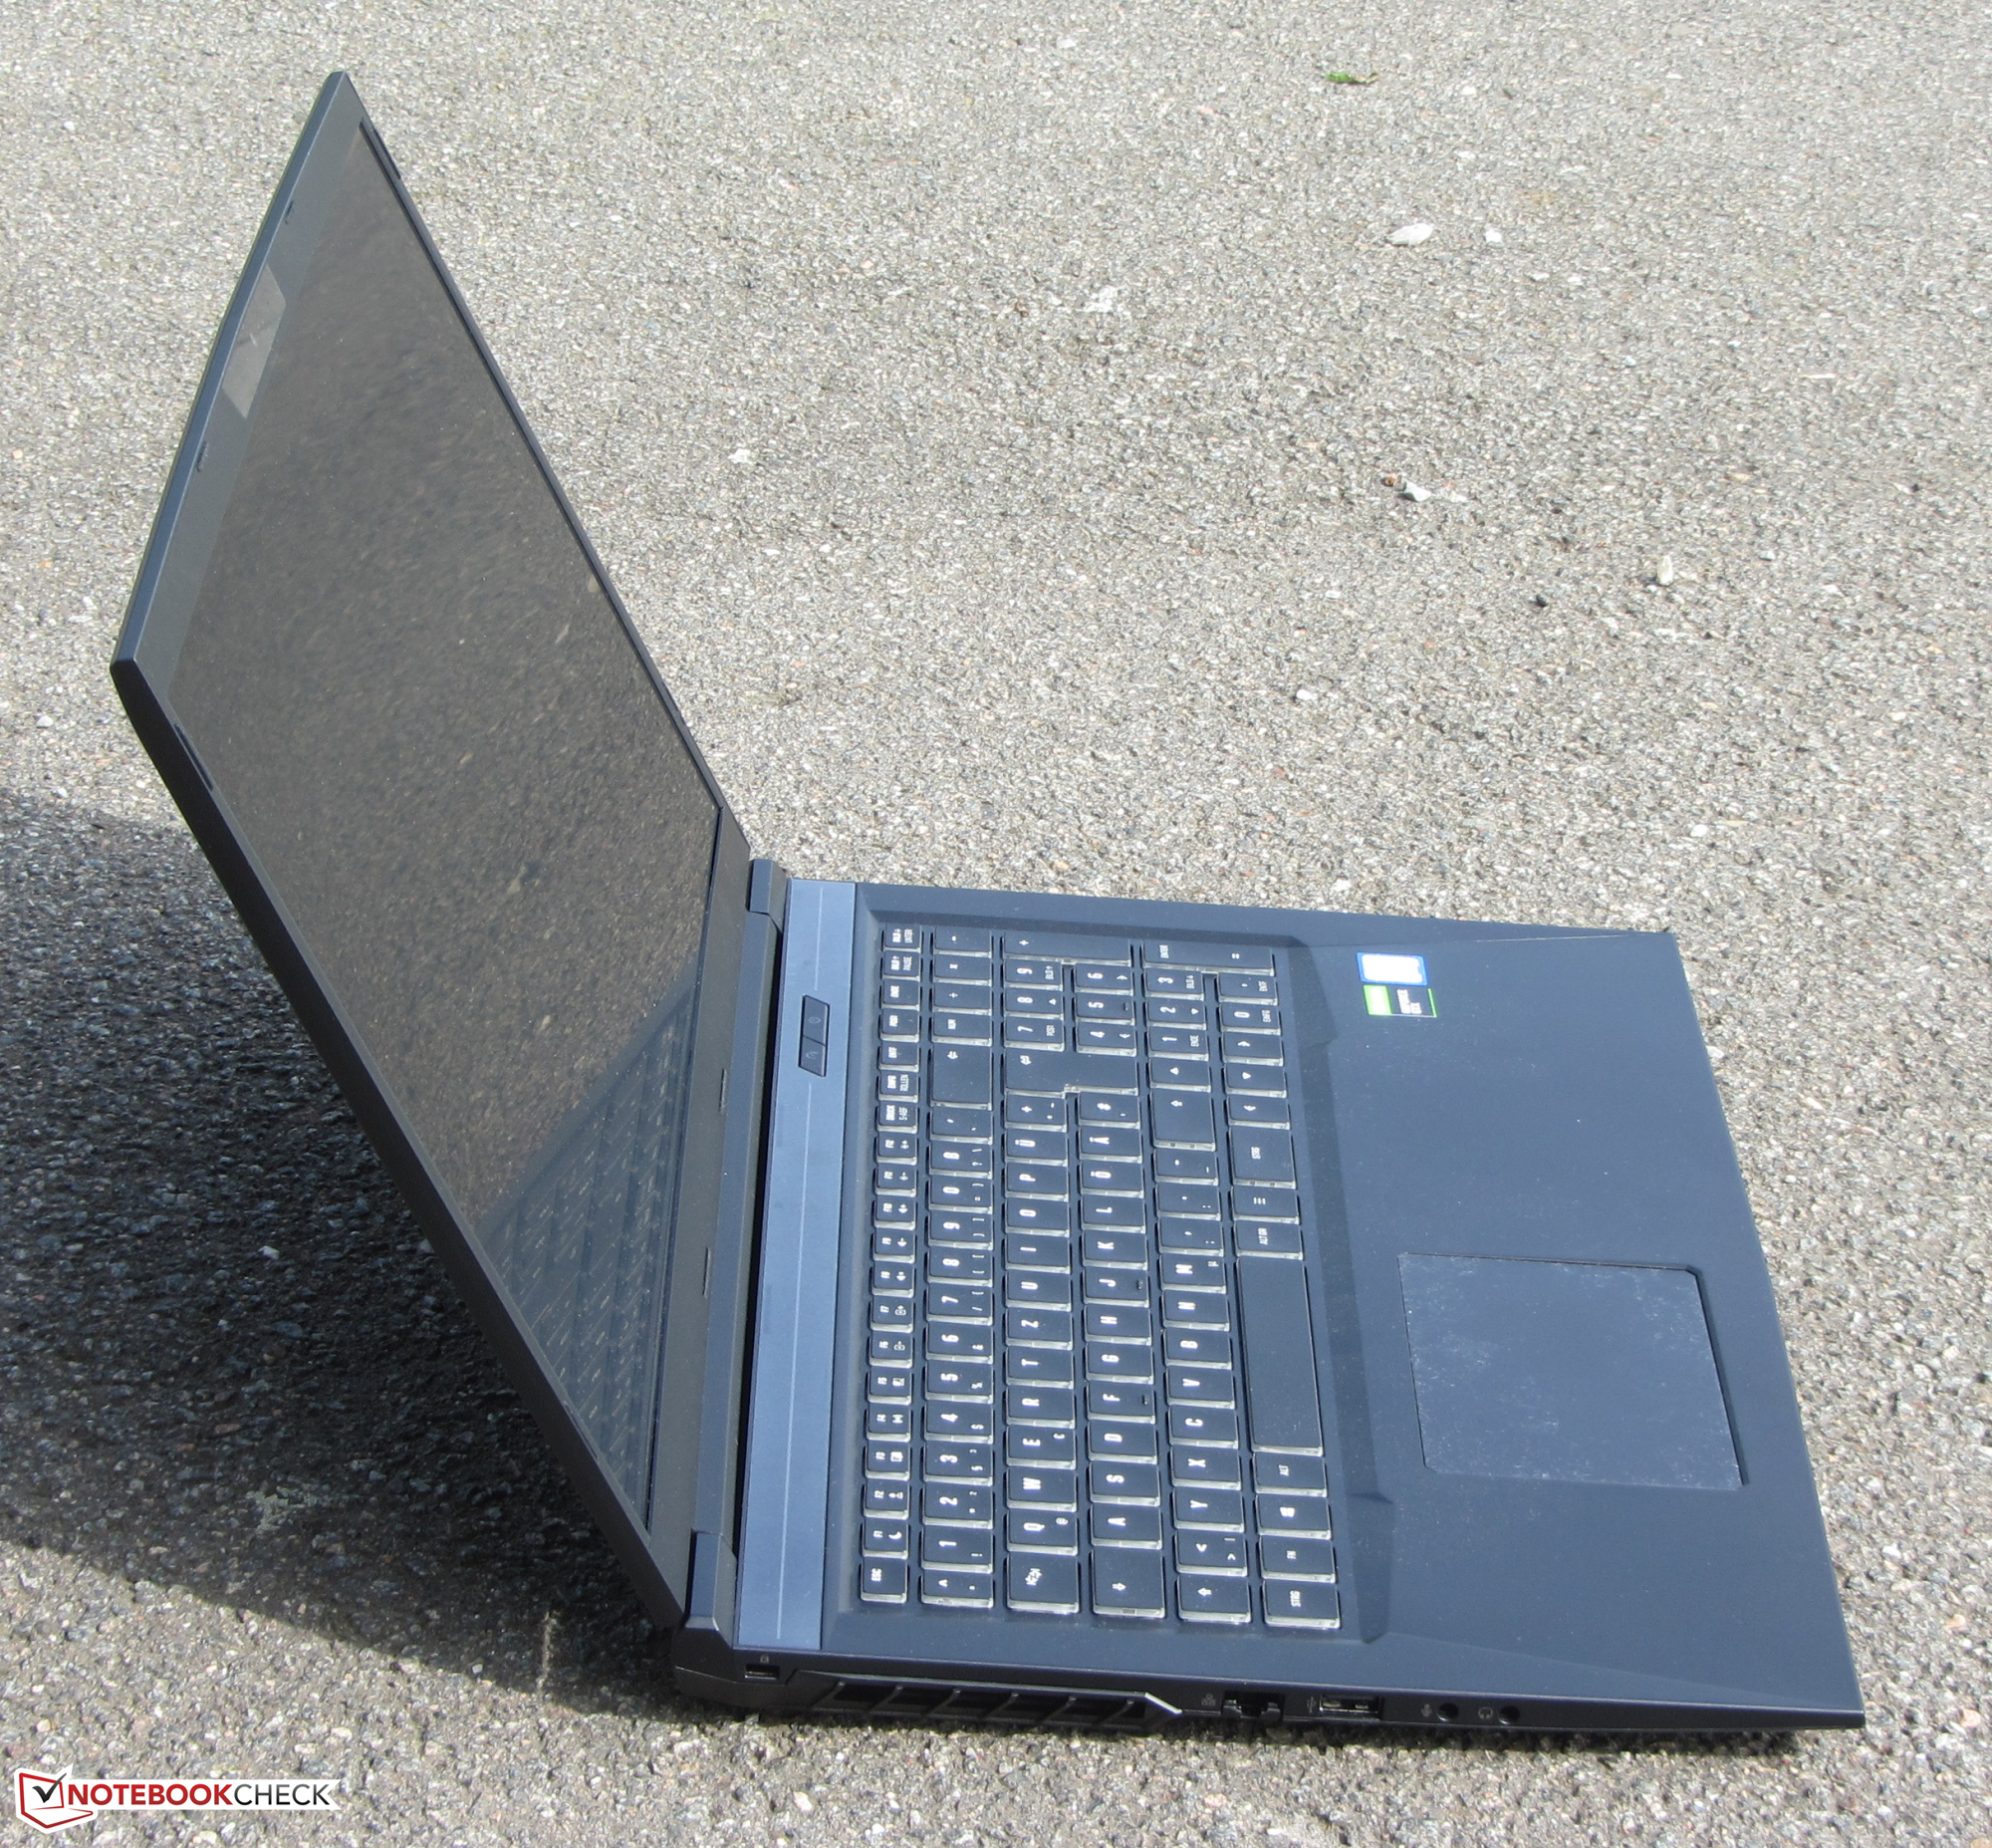
Schenker fornisce un solido laptop da 17,3 pollici di fascia media per il gaming con l'XMG Core 17.
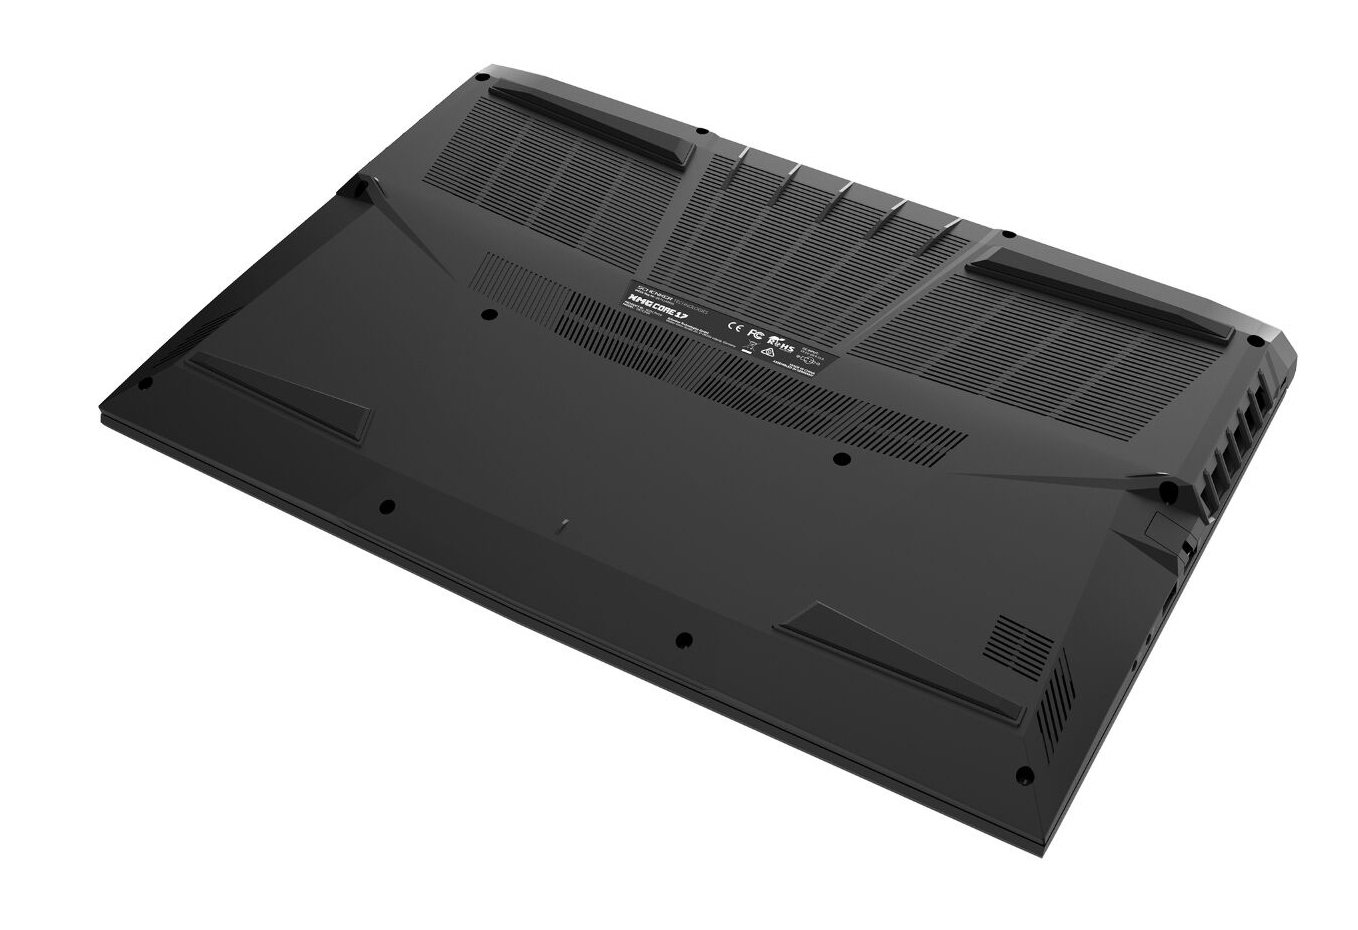
Esternamente, non è cambiato nulla rispetto al Modello 2019 ma l'hardware è stato aggiornato all'interno. Inoltre, le buone caratteristiche del Modello 2019 sono state ereditate: Il laptop non si riscalda eccessivamente sotto carico e produce poco rumore - almeno nell'uso inattivo e a basso carico.
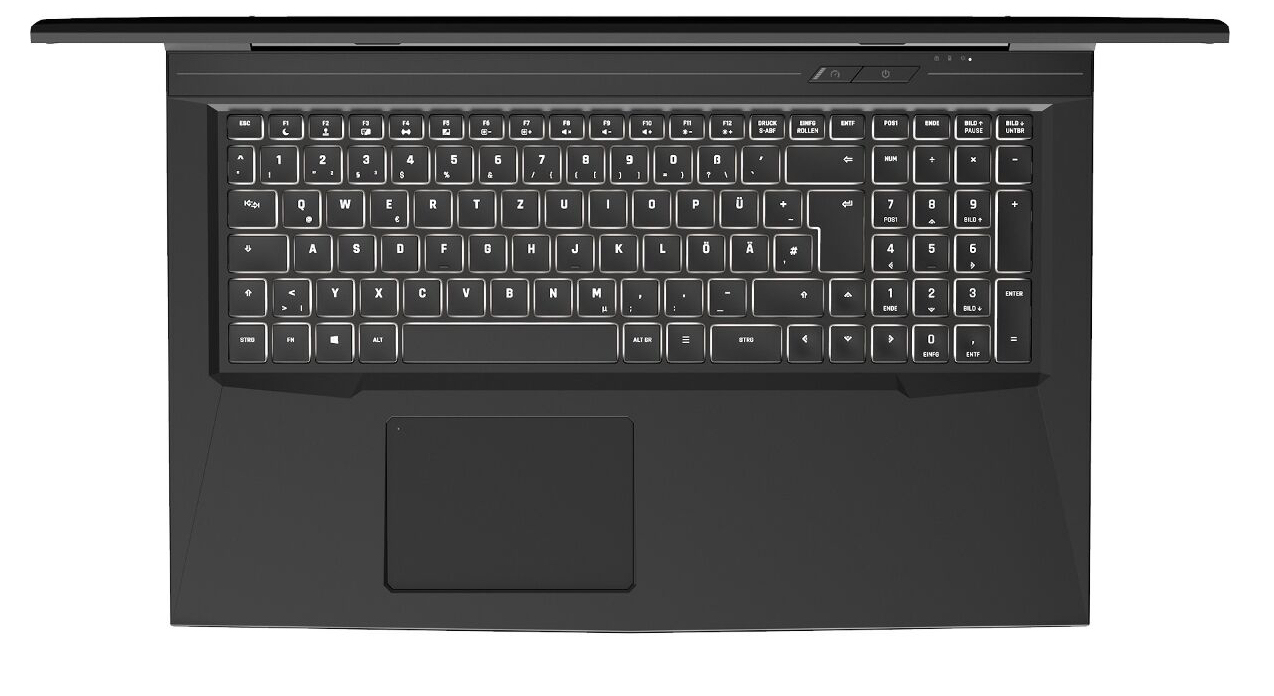
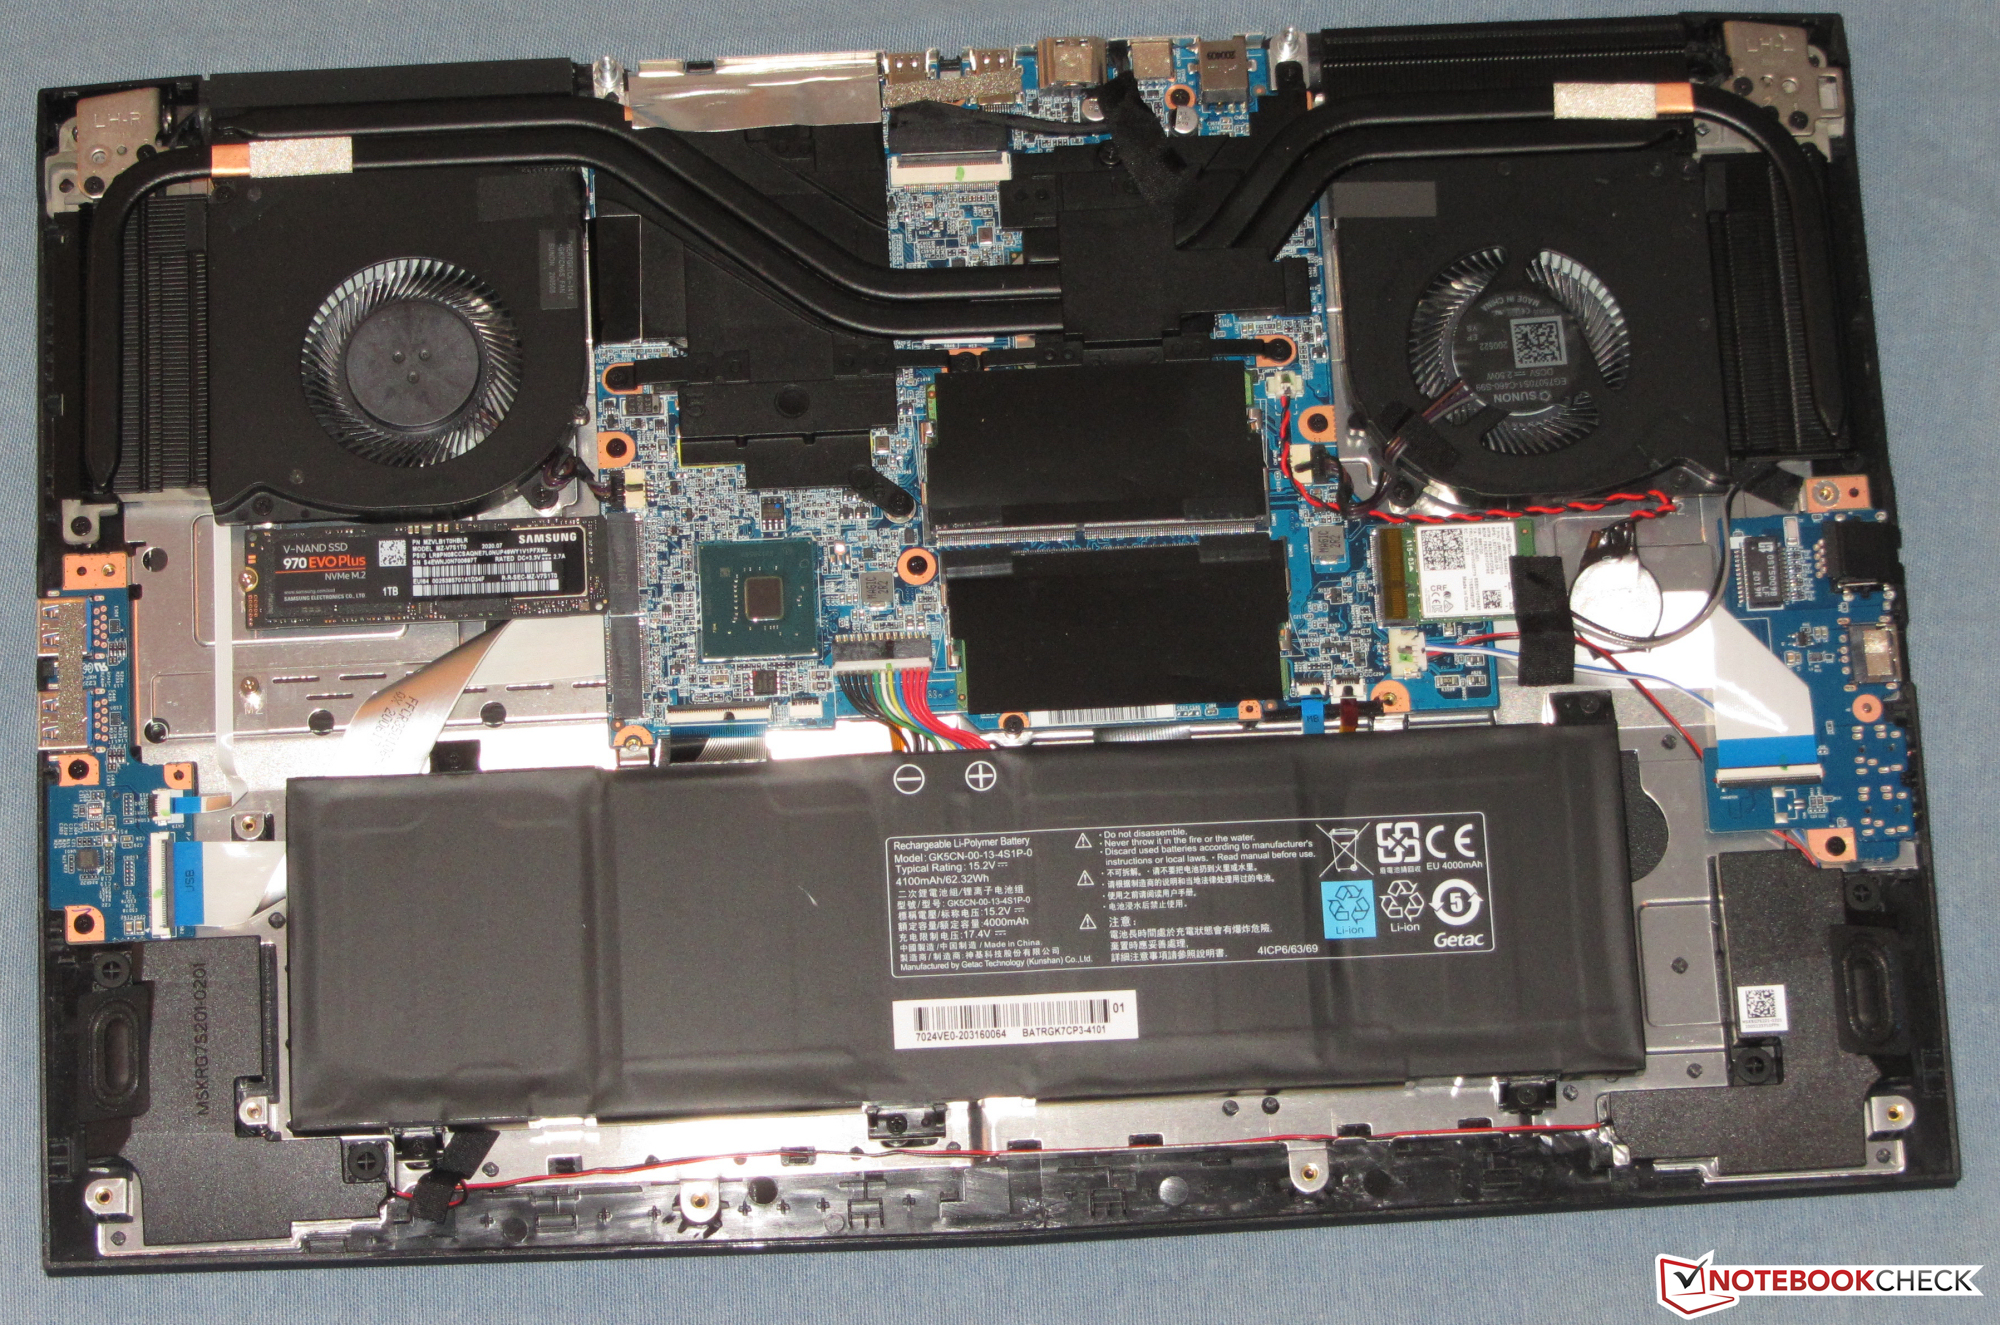
Il laptop offre spazio per due SSD M.2 2280 (1x NVMe, 1x NVMe/SATA; RAID 0/1). Il nostro dispositivo di prova è dotato di un SSD NVMe da 1 TB NVMe. Lo schermo reattivo (Full HD, IPS, 144 Hz) si fa notare per la superficie opaca, una discreta riproduzione del colore e una copertura dello spazio colore accettabile. Inoltre, anche la luminosità e il contrasto sono accettabili.
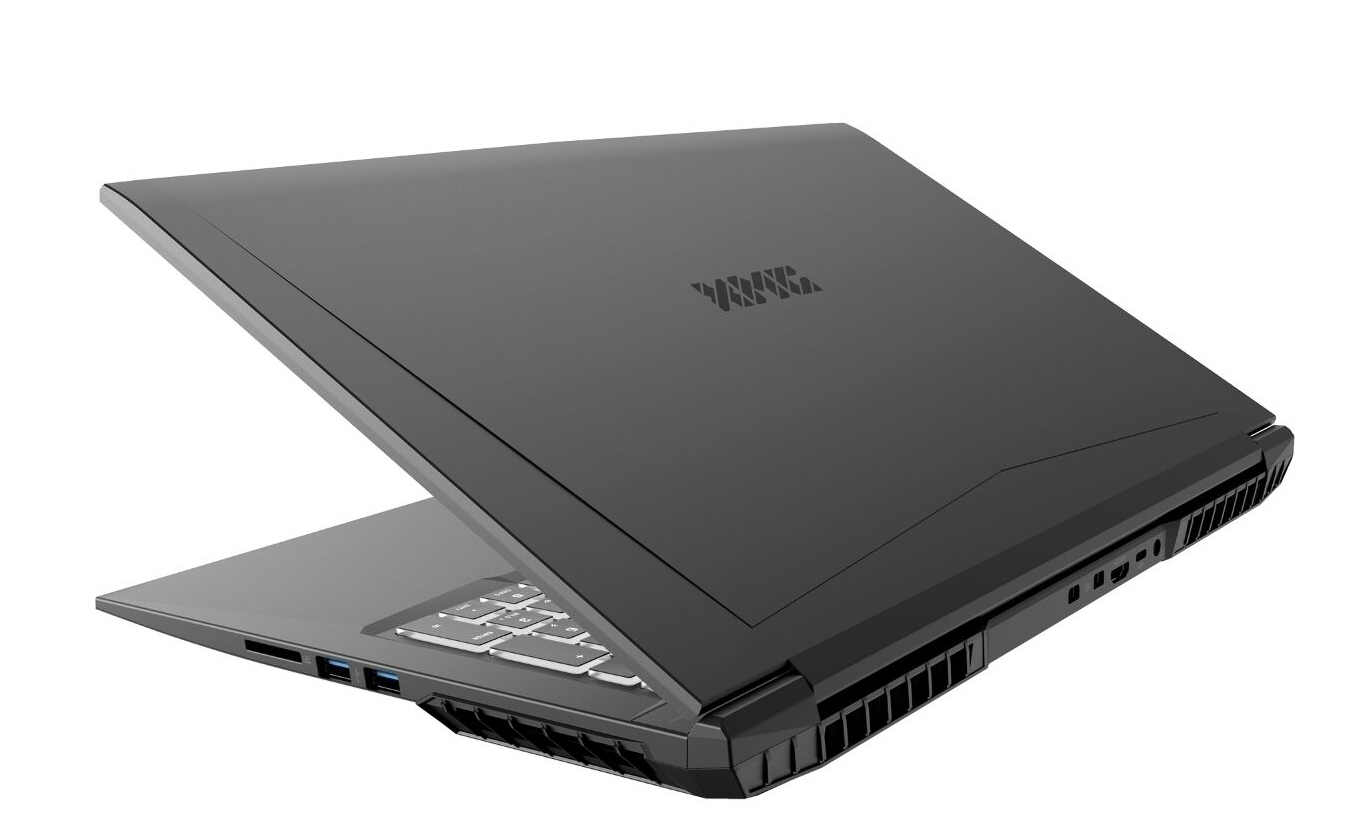
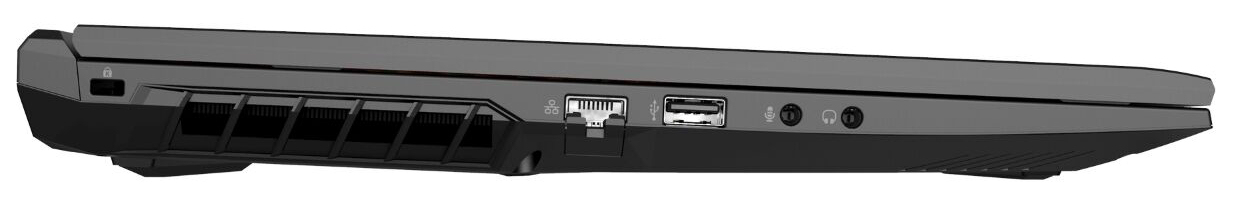
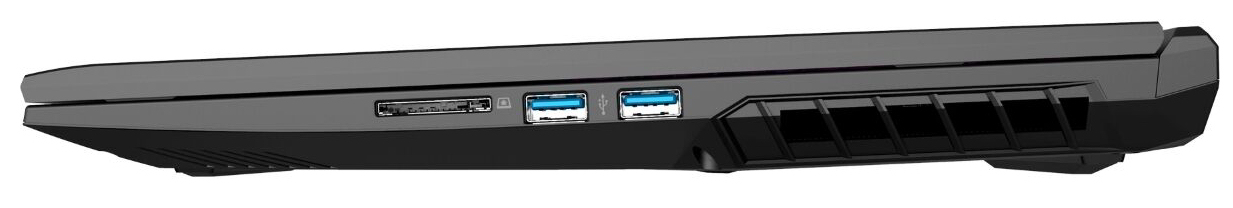
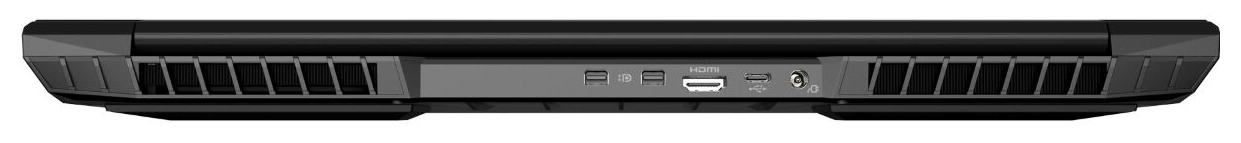
La durata della batteria è ad un livello normale per un portatile gaming. Inoltre, la vasta gamma di interfacce del laptop comprende, tra l'altro, tre uscite video - due delle quali supportano G-Sync. Non c'è una porta Thunderbolt 3.
Nota: i punteggi delle singole categorie differiscono in parte da quelli del Core 17 del 2019, perché abbiamo aggiornato il sistema di valutazione. I punteggi dei due modelli Core 17 non sono comparabili.
Schenker XMG Core 17 Comet Lake
- 12/21/2020 v7 (old)
Sascha Mölck
Price comparison
