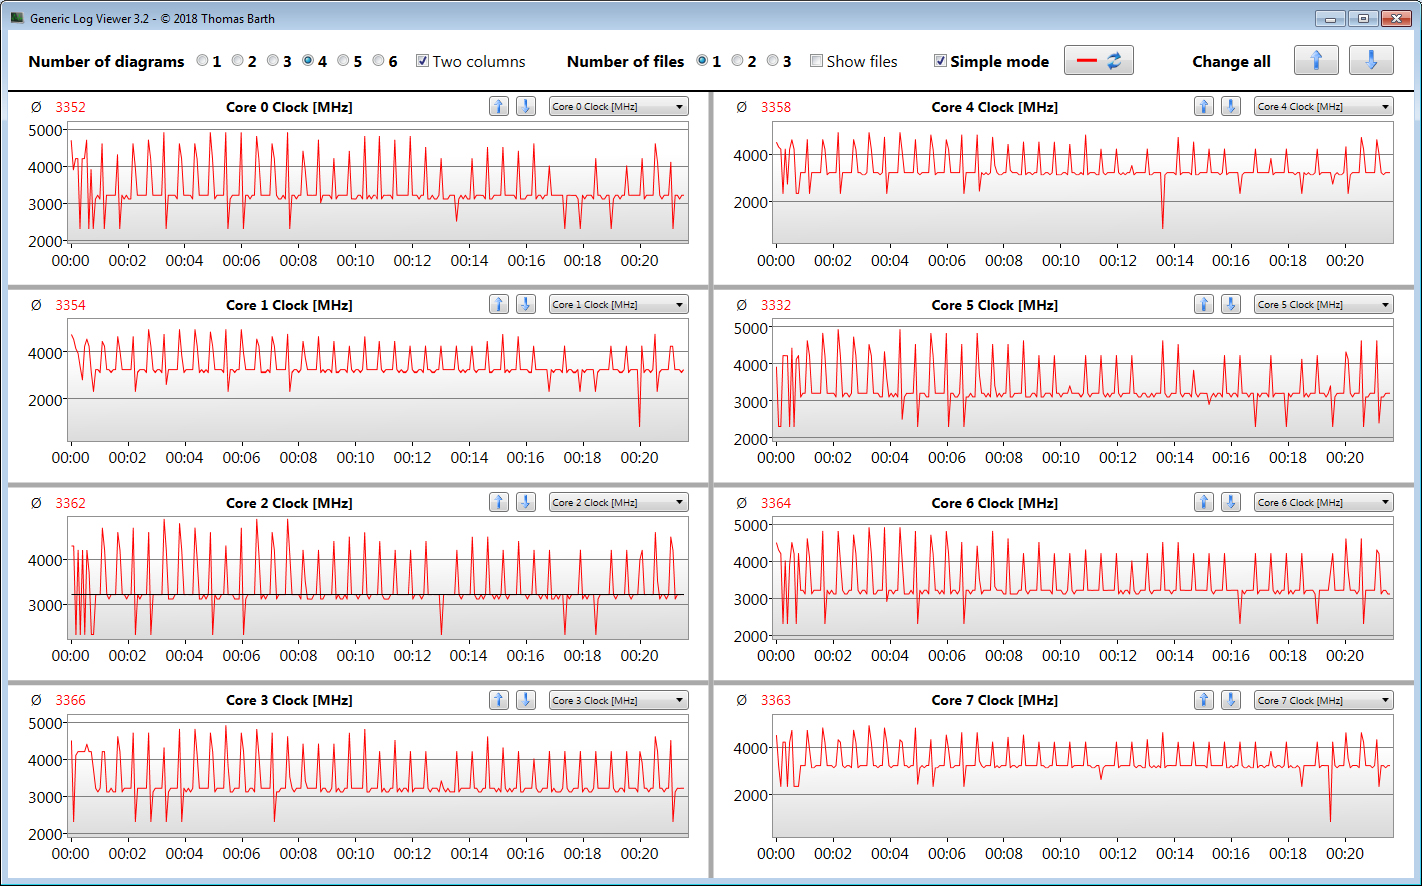
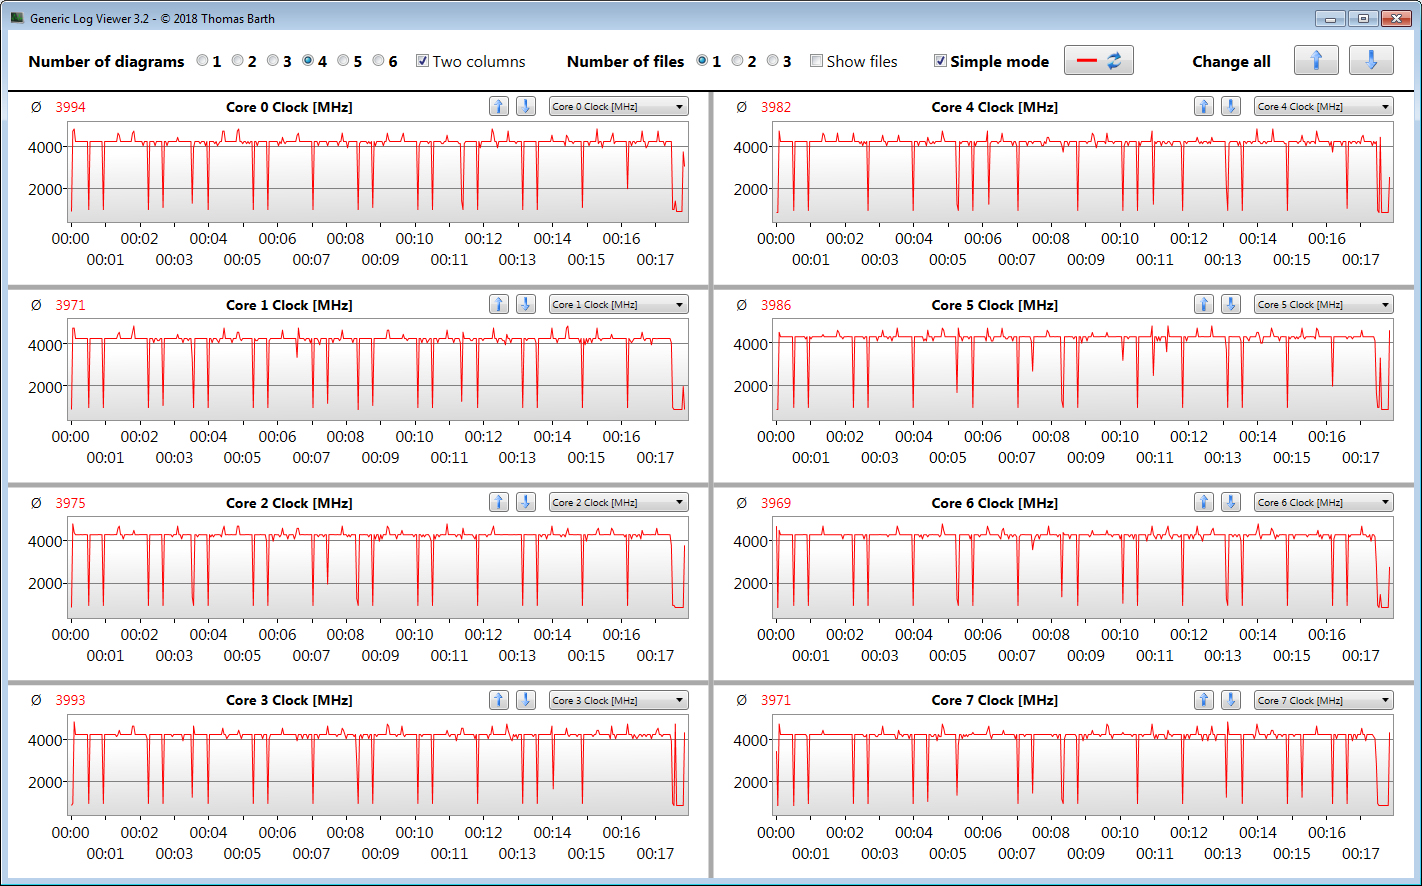
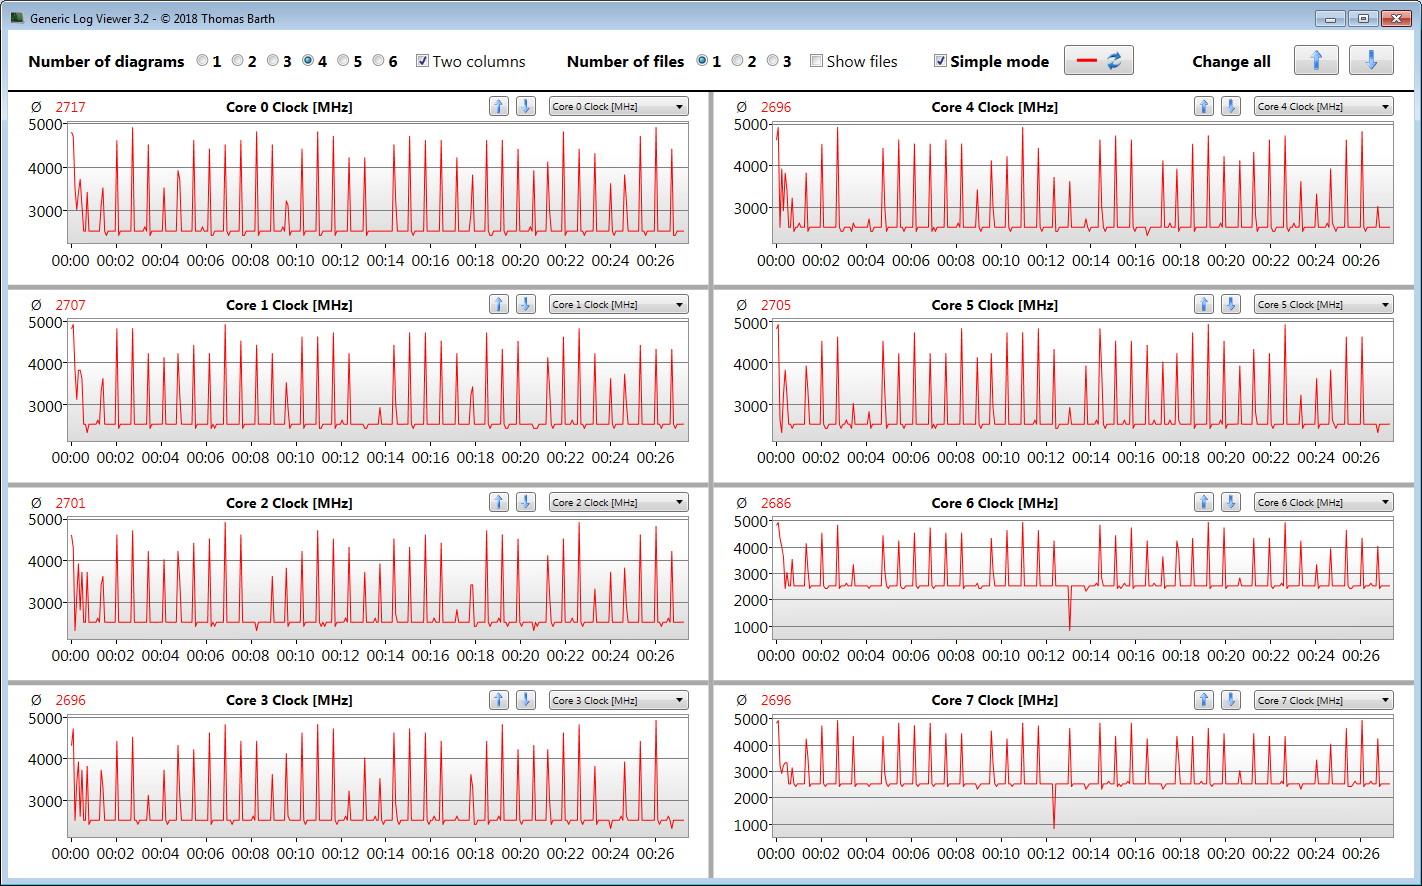
Recensione del Laptop Schenker XMG Neo 17 (2020, Tongfang GM7MPHS): l'Overboost scatena il processore Core-i7
Punteggio | Data | Modello | Peso | Altezza | Dimensione | Risoluzione | Prezzo |
|---|---|---|---|---|---|---|---|
| 85.8 % v7 (old) | 11/2020 | Schenker XMG Neo 17 Comet Lake i7-10875H, GeForce RTX 2070 Super Mobile | 2.6 kg | 27.45 mm | 17.30" | 1920x1080 | |
| 83.6 % v7 (old) | 10/2020 | Acer Predator Helios 300 PH317-54-75G8 i7-10750H, GeForce RTX 2060 Mobile | 2.8 kg | 25 mm | 17.30" | 1920x1080 | |
| 83.5 % v7 (old) | 08/2020 | MSI GL75 10SFR i7-10750H, GeForce RTX 2070 Mobile | 2.6 kg | 28 mm | 17.30" | 1920x1080 | |
| 83.1 % v7 (old) | 10/2020 | Asus Strix G17 G712LWS i7-10750H, GeForce RTX 2070 Super Mobile | 2.8 kg | 26.5 mm | 17.30" | 1920x1080 | |
| 86.5 % v7 (old) | 05/2020 | Aorus 17G XB i7-10875H, GeForce RTX 2070 Super Max-Q | 2.7 kg | 26 mm | 17.30" | 1920x1080 |
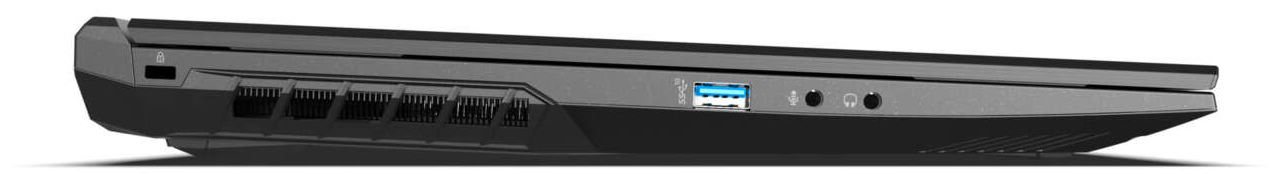
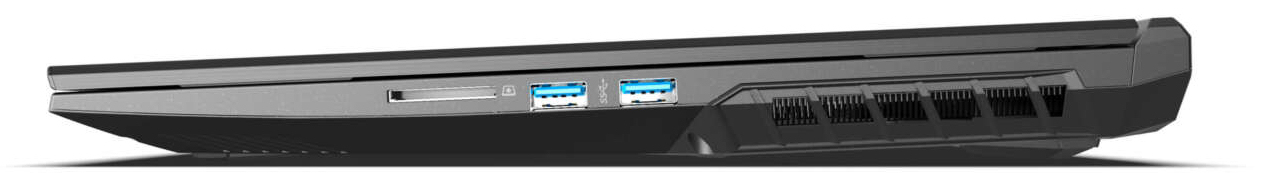
Connessioni

| SD Card Reader | |
| average JPG Copy Test (av. of 3 runs) | |
| Aorus 17G XB (Toshiba Exceria Pro SDXC 64 GB UHS-II) | |
| Media della classe Gaming (20.9 - 210, n=54, ultimi 2 anni) | |
| Schenker XMG Neo 17 Comet Lake (Toshiba Exceria Pro SDXC 64 GB UHS-II) | |
| Schenker XMG Neo 17 (Toshiba Exceria Pro SDXC 64 GB UHS-II) | |
| Schenker XMG Neo 17 XNE17M19 (Toshiba Exceria Pro SDXC 64 GB UHS-II) | |
| MSI GL75 10SFR (Toshiba Exceria Pro SDXC 64 GB UHS-II) | |
| maximum AS SSD Seq Read Test (1GB) | |
| Aorus 17G XB (Toshiba Exceria Pro SDXC 64 GB UHS-II) | |
| Media della classe Gaming (25.5 - 261, n=51, ultimi 2 anni) | |
| Schenker XMG Neo 17 (Toshiba Exceria Pro SDXC 64 GB UHS-II) | |
| Schenker XMG Neo 17 XNE17M19 (Toshiba Exceria Pro SDXC 64 GB UHS-II) | |
| Schenker XMG Neo 17 Comet Lake (Toshiba Exceria Pro SDXC 64 GB UHS-II) | |
| MSI GL75 10SFR (Toshiba Exceria Pro SDXC 64 GB UHS-II) | |


| |||||||||||||||||||||||||
Distribuzione della luminosità: 87 %
Al centro con la batteria: 327 cd/m²
Contrasto: 1022:1 (Nero: 0.32 cd/m²)
ΔE ColorChecker Calman: 2.16 | ∀{0.5-29.43 Ø4.71}
calibrated: 0.89
ΔE Greyscale Calman: 3.7 | ∀{0.09-98 Ø4.96}
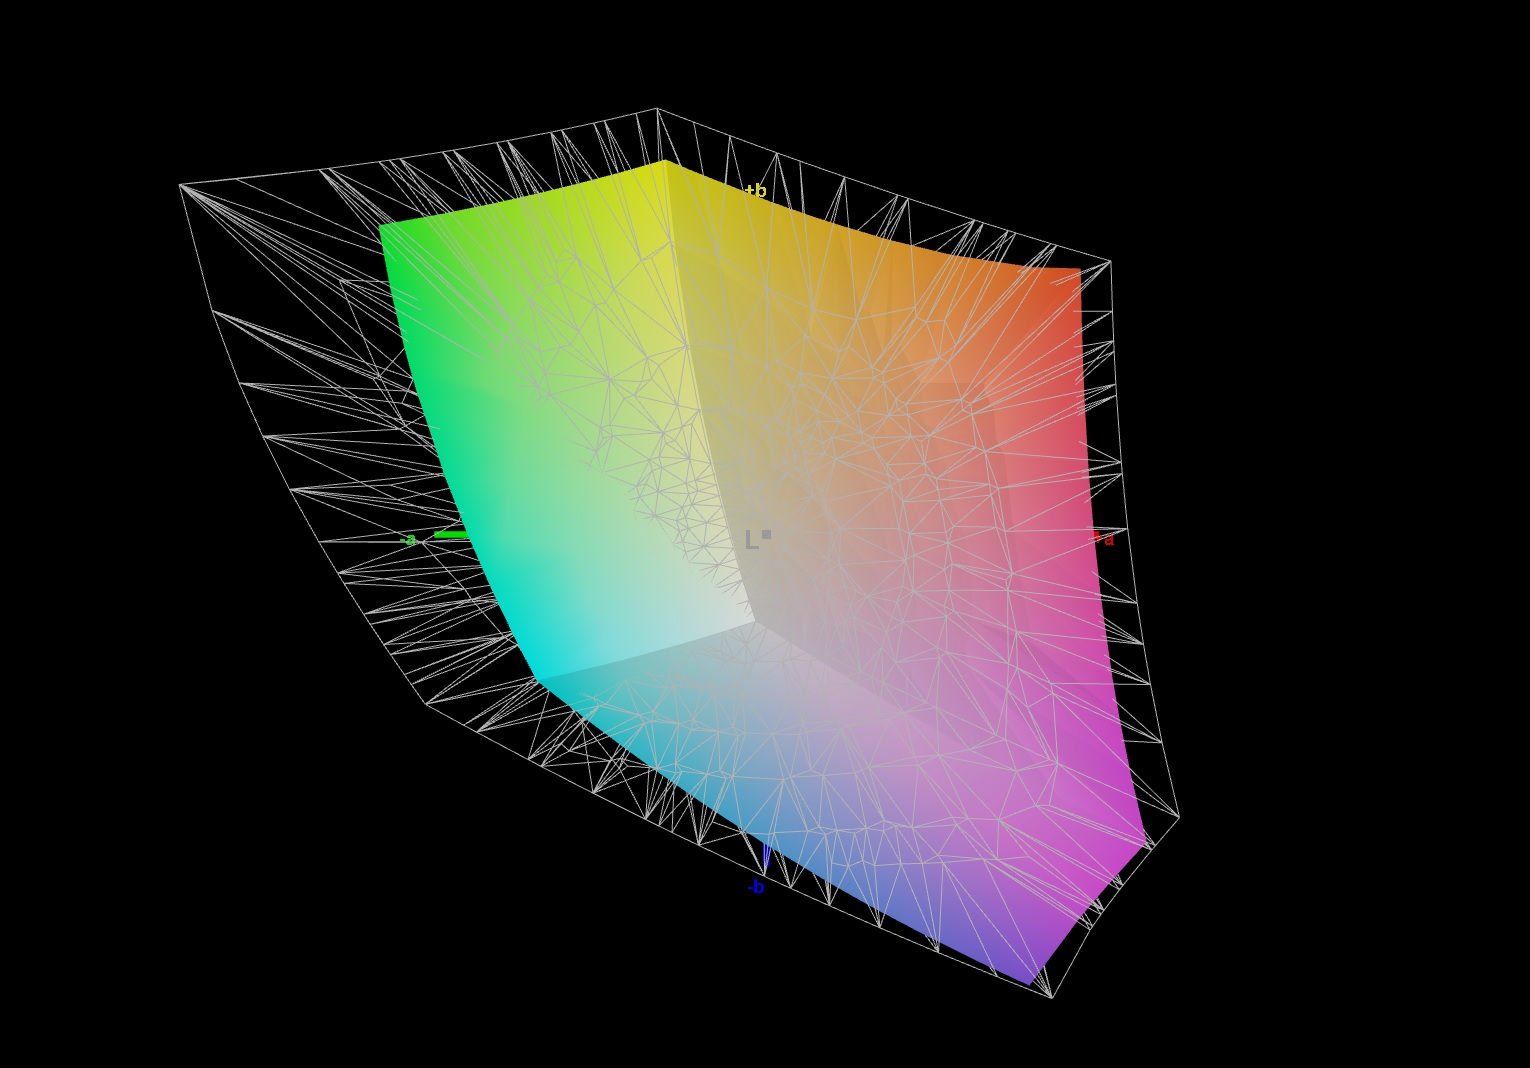
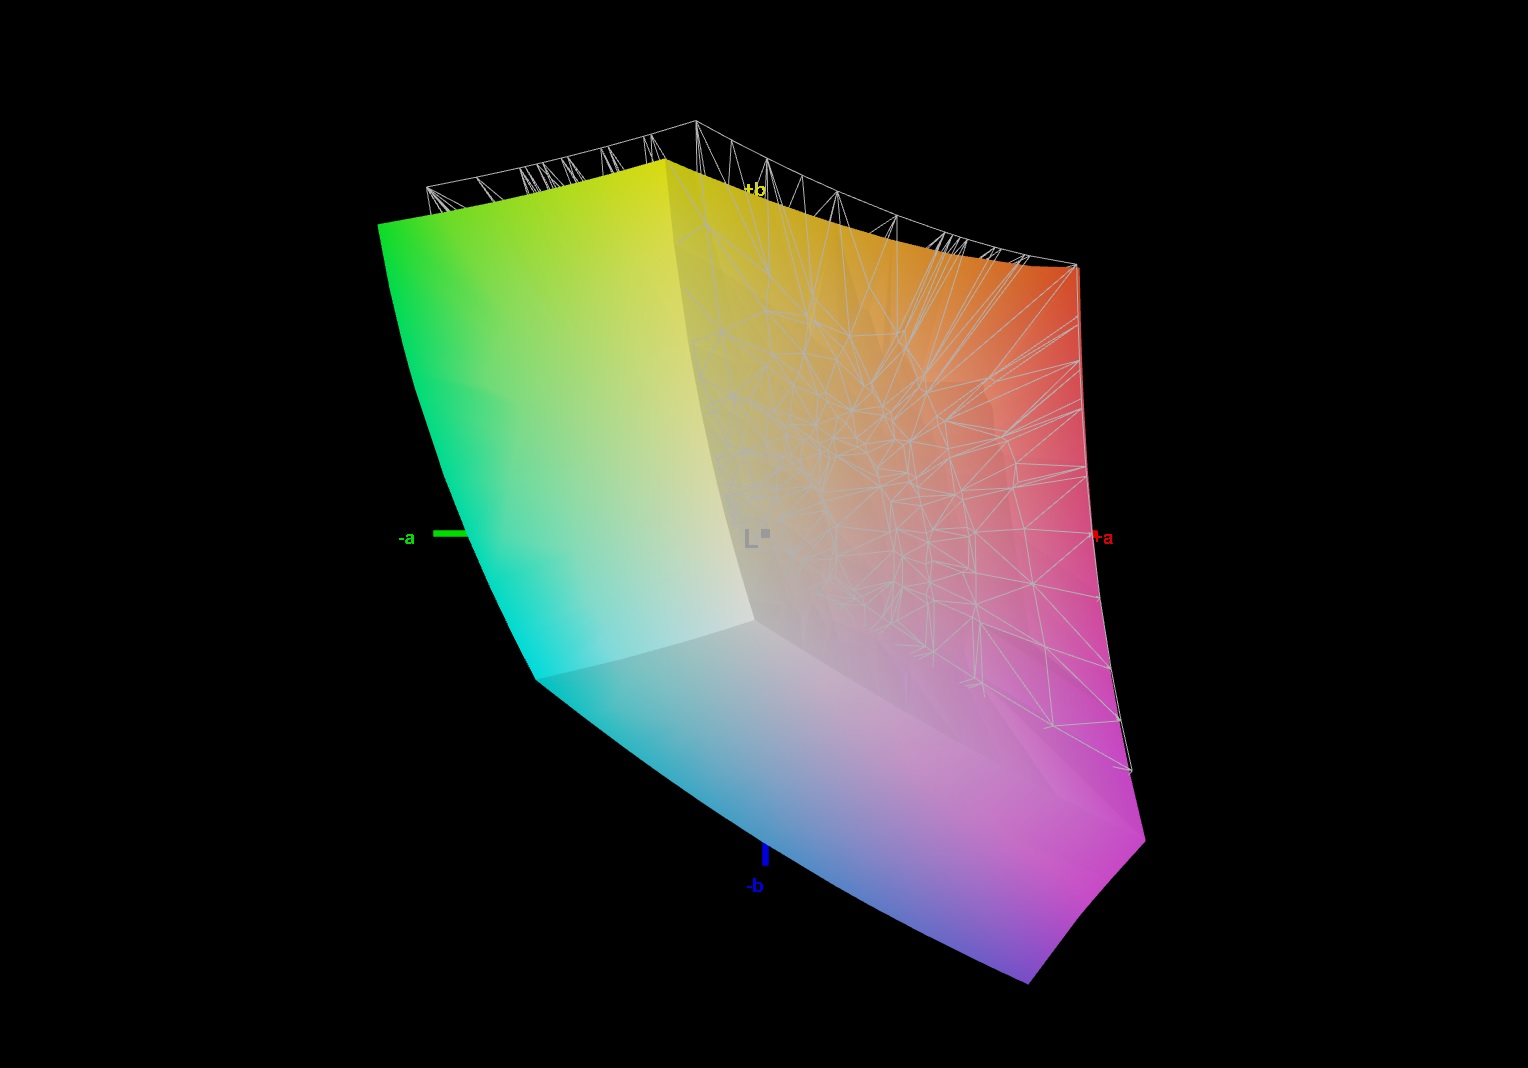
93% sRGB (Argyll 1.6.3 3D)
71% AdobeRGB 1998 (Argyll 1.6.3 3D)
70.9% AdobeRGB 1998 (Argyll 3D)
99.2% sRGB (Argyll 3D)
69.4% Display P3 (Argyll 3D)
Gamma: 2.24
CCT: 6799 K
| Schenker XMG Neo 17 Comet Lake BOE HF NE173FHM-NZ1, IPS, 1920x1080, 17.3" | Schenker XMG Neo 17 BOEhydis NV173FHM-N44 (BOE07B6), IPS, 1920x1080, 17.3" | Schenker XMG Neo 17 XNE17M19 LG LP173WFG-SPB1 (LGD0615), IPS, 1920x1080, 17.3" | Acer Predator Helios 300 PH317-54-75G8 Chi Mei N173HCE-G33, IPS, 1920x1080, 17.3" | MSI GL75 10SFR Chi Mei N173HCE-G33, IPS, 1920x1080, 17.3" | Asus Strix G17 G712LWS LG Philips LP173WFG-SPB3, IPS, 1920x1080, 17.3" | Aorus 17G XB AU Optronics B173HAN05.0 (AUO509D), IPS, 1920x1080, 17.3" | |
|---|---|---|---|---|---|---|---|
| Display | -6% | -6% | -8% | -6% | -5% | 1% | |
| Display P3 Coverage (%) | 69.4 | 65.2 -6% | 64.6 -7% | 62.6 -10% | 63.9 -8% | 65.2 -6% | 70.6 2% |
| sRGB Coverage (%) | 99.2 | 92.2 -7% | 95.6 -4% | 94.3 -5% | 96.2 -3% | 96.8 -2% | 97.2 -2% |
| AdobeRGB 1998 Coverage (%) | 70.9 | 66.5 -6% | 65.6 -7% | 64.7 -9% | 66 -7% | 66.4 -6% | 72.8 3% |
| Response Times | -81% | -63% | -61% | -26% | -48% | -68% | |
| Response Time Grey 50% / Grey 80% * (ms) | 10.8 ? | 18.8 ? -74% | 15.6 ? -44% | 16.4 ? -52% | 12 ? -11% | 14.4 ? -33% | 16 ? -48% |
| Response Time Black / White * (ms) | 6.4 ? | 12 ? -88% | 11.6 ? -81% | 10.8 ? -69% | 9 ? -41% | 10.4 ? -63% | 12 ? -88% |
| PWM Frequency (Hz) | 971 ? | 24510 ? | 208 ? | ||||
| Screen | -5% | -15% | 23% | 1% | -8% | 17% | |
| Brightness middle (cd/m²) | 327 | 304 -7% | 318 -3% | 322 -2% | 333 2% | 323 -1% | 293 -10% |
| Brightness (cd/m²) | 305 | 289 -5% | 286 -6% | 308 1% | 309 1% | 300 -2% | 285 -7% |
| Brightness Distribution (%) | 87 | 90 3% | 86 -1% | 92 6% | 86 -1% | 89 2% | 95 9% |
| Black Level * (cd/m²) | 0.32 | 0.26 19% | 0.23 28% | 0.18 44% | 0.215 33% | 0.31 3% | 0.24 25% |
| Contrast (:1) | 1022 | 1169 14% | 1383 35% | 1789 75% | 1549 52% | 1042 2% | 1221 19% |
| Colorchecker dE 2000 * | 2.16 | 2.65 -23% | 3.89 -80% | 1.53 29% | 1.98 8% | 3.01 -39% | 1.27 41% |
| Colorchecker dE 2000 max. * | 6.14 | 6.11 -0% | 10.56 -72% | 3.14 49% | 4.34 29% | 7.65 -25% | 2.24 64% |
| Colorchecker dE 2000 calibrated * | 0.89 | 1.5 -69% | 1.03 -16% | 0.74 17% | 2.01 -126% | 1 -12% | 1.06 -19% |
| Greyscale dE 2000 * | 3.7 | 2.75 26% | 5.3 -43% | 1.9 49% | 2.97 20% | 3.8 -3% | 1.34 64% |
| Gamma | 2.24 98% | 2.46 89% | 2.46 89% | 2.144 103% | 2.41 91% | 2.154 102% | 2.38 92% |
| CCT | 6799 96% | 6763 96% | 7462 87% | 6809 95% | 6750 96% | 7507 87% | 6542 99% |
| Color Space (Percent of AdobeRGB 1998) (%) | 71 | 60 -15% | 60 -15% | 65 -8% | 61 -14% | 66 -7% | 73 3% |
| Color Space (Percent of sRGB) (%) | 93 | 92 -1% | 96 3% | 87 -6% | 96 3% | 90 -3% | 94 1% |
| Media totale (Programma / Settaggio) | -31% /
-15% | -28% /
-20% | -15% /
7% | -10% /
-4% | -20% /
-12% | -17% /
4% |
* ... Meglio usare valori piccoli
Tempi di risposta del Display
| ↔ Tempi di risposta dal Nero al Bianco | ||
|---|---|---|
| 6.4 ms ... aumenta ↗ e diminuisce ↘ combinato | ↗ 3 ms Incremento | 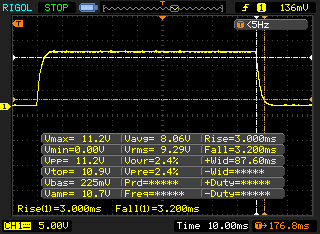 |
| ↘ 3.2 ms Calo | ||
| Lo schermo ha mostrato valori di risposta molto veloci nei nostri tests ed è molto adatto per i gaming veloce. In confronto, tutti i dispositivi di test variano da 0.1 (minimo) a 240 (massimo) ms. » 20 % di tutti i dispositivi è migliore. Questo significa che i tempi di risposta rilevati sono migliori rispettto alla media di tutti i dispositivi testati (19.8 ms). | ||
| ↔ Tempo di risposta dal 50% Grigio all'80% Grigio | ||
| 10.8 ms ... aumenta ↗ e diminuisce ↘ combinato | ↗ 5.6 ms Incremento | 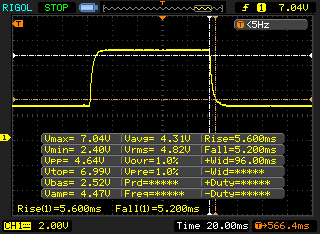 |
| ↘ 5.2 ms Calo | ||
| Lo schermo mostra buoni tempi di risposta durante i nostri tests, ma potrebbe essere troppo lento per i gamers competitivi. In confronto, tutti i dispositivi di test variano da 0.165 (minimo) a 636 (massimo) ms. » 25 % di tutti i dispositivi è migliore. Questo significa che i tempi di risposta rilevati sono migliori rispettto alla media di tutti i dispositivi testati (31 ms). | ||
Sfarfallio dello schermo / PWM (Pulse-Width Modulation)
| flickering dello schermo / PWM non rilevato | 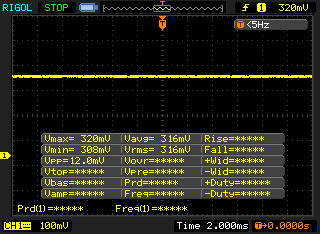 | ||
In confronto: 52 % di tutti i dispositivi testati non utilizza PWM per ridurre la luminosita' del display. Se è rilevato PWM, una media di 7747 (minimo: 5 - massimo: 343500) Hz è stata rilevata. | |||
| Cinebench R15 | |
| CPU Single 64Bit | |
| Media della classe Gaming (188.8 - 350, n=106, ultimi 2 anni) | |
| Schenker XMG Neo 17 Comet Lake | |
| Schenker XMG Neo 17 Comet Lake (Overboost) | |
| Media Intel Core i7-10875H (190 - 220, n=37) | |
| Aorus 17G XB | |
| Asus Strix G17 G712LWS | |
| Acer Predator Helios 300 PH317-54-75G8 | |
| Schenker XMG Neo 17 XNE17M19 | |
| MSI GL75 10SFR | |
| Schenker XMG Neo 17 | |
| CPU Multi 64Bit | |
| Media della classe Gaming (1578 - 6330, n=105, ultimi 2 anni) | |
| Aorus 17G XB | |
| Schenker XMG Neo 17 Comet Lake (Overboost) | |
| Media Intel Core i7-10875H (1003 - 1833, n=38) | |
| Schenker XMG Neo 17 Comet Lake | |
| Asus Strix G17 G712LWS | |
| Acer Predator Helios 300 PH317-54-75G8 | |
| MSI GL75 10SFR | |
| Schenker XMG Neo 17 XNE17M19 | |
| Schenker XMG Neo 17 | |
| Blender - v2.79 BMW27 CPU | |
| MSI GL75 10SFR | |
| Acer Predator Helios 300 PH317-54-75G8 | |
| Asus Strix G17 G712LWS | |
| Media Intel Core i7-10875H (259 - 535, n=30) | |
| Schenker XMG Neo 17 Comet Lake | |
| Aorus 17G XB | |
| Schenker XMG Neo 17 Comet Lake (Overboost) | |
| Media della classe Gaming (79 - 330, n=104, ultimi 2 anni) | |
| 7-Zip 18.03 | |
| 7z b 4 -mmt1 | |
| Media della classe Gaming (4199 - 7436, n=105, ultimi 2 anni) | |
| Schenker XMG Neo 17 Comet Lake | |
| Schenker XMG Neo 17 Comet Lake (Overboost) | |
| Media Intel Core i7-10875H (5071 - 5780, n=31) | |
| Aorus 17G XB | |
| Acer Predator Helios 300 PH317-54-75G8 | |
| MSI GL75 10SFR | |
| Asus Strix G17 G712LWS | |
| 7z b 4 | |
| Media della classe Gaming (33491 - 148086, n=105, ultimi 2 anni) | |
| Schenker XMG Neo 17 Comet Lake (Overboost) | |
| Aorus 17G XB | |
| Schenker XMG Neo 17 Comet Lake | |
| Media Intel Core i7-10875H (29844 - 49562, n=31) | |
| Asus Strix G17 G712LWS | |
| MSI GL75 10SFR | |
| Acer Predator Helios 300 PH317-54-75G8 | |
| Cinebench R20 | |
| CPU (Single Core) | |
| Media della classe Gaming (442 - 913, n=106, ultimi 2 anni) | |
| Schenker XMG Neo 17 Comet Lake | |
| Schenker XMG Neo 17 Comet Lake (Overboost) | |
| Asus Strix G17 G712LWS | |
| Aorus 17G XB | |
| Media Intel Core i7-10875H (430 - 524, n=32) | |
| MSI GL75 10SFR | |
| Acer Predator Helios 300 PH317-54-75G8 | |
| Schenker XMG Neo 17 XNE17M19 | |
| CPU (Multi Core) | |
| Media della classe Gaming (4029 - 16433, n=106, ultimi 2 anni) | |
| Schenker XMG Neo 17 Comet Lake (Overboost) | |
| Aorus 17G XB | |
| Media Intel Core i7-10875H (1986 - 4176, n=32) | |
| Schenker XMG Neo 17 Comet Lake | |
| Asus Strix G17 G712LWS | |
| Acer Predator Helios 300 PH317-54-75G8 | |
| MSI GL75 10SFR | |
| Schenker XMG Neo 17 XNE17M19 | |
| Geekbench 5.5 | |
| Single-Core | |
| Media della classe Gaming (986 - 2474, n=105, ultimi 2 anni) | |
| Schenker XMG Neo 17 Comet Lake | |
| Schenker XMG Neo 17 Comet Lake (Overboost) | |
| Media Intel Core i7-10875H (1233 - 1371, n=29) | |
| Aorus 17G XB | |
| MSI GL75 10SFR | |
| Asus Strix G17 G712LWS | |
| Acer Predator Helios 300 PH317-54-75G8 | |
| Multi-Core | |
| Media della classe Gaming (6460 - 28263, n=105, ultimi 2 anni) | |
| Schenker XMG Neo 17 Comet Lake (Overboost) | |
| Aorus 17G XB | |
| Media Intel Core i7-10875H (5715 - 8620, n=29) | |
| Schenker XMG Neo 17 Comet Lake | |
| Asus Strix G17 G712LWS | |
| Acer Predator Helios 300 PH317-54-75G8 | |
| MSI GL75 10SFR | |
| HWBOT x265 Benchmark v2.2 - 4k Preset | |
| Media della classe Gaming (11.5 - 44.4, n=105, ultimi 2 anni) | |
| Schenker XMG Neo 17 Comet Lake (Overboost) | |
| Aorus 17G XB | |
| Schenker XMG Neo 17 Comet Lake | |
| Media Intel Core i7-10875H (7.27 - 14.1, n=27) | |
| Asus Strix G17 G712LWS | |
| Acer Predator Helios 300 PH317-54-75G8 | |
| MSI GL75 10SFR | |
| LibreOffice - 20 Documents To PDF | |
| Asus Strix G17 G712LWS | |
| Acer Predator Helios 300 PH317-54-75G8 | |
| Aorus 17G XB | |
| Schenker XMG Neo 17 Comet Lake | |
| MSI GL75 10SFR | |
| Media Intel Core i7-10875H (30.2 - 84.3, n=30) | |
| Media della classe Gaming (33.2 - 88.8, n=105, ultimi 2 anni) | |
| Schenker XMG Neo 17 Comet Lake (Overboost) | |
| R Benchmark 2.5 - Overall mean | |
| Acer Predator Helios 300 PH317-54-75G8 | |
| Asus Strix G17 G712LWS | |
| MSI GL75 10SFR | |
| Aorus 17G XB | |
| Media Intel Core i7-10875H (0.546 - 0.662, n=29) | |
| Schenker XMG Neo 17 Comet Lake (Overboost) | |
| Schenker XMG Neo 17 Comet Lake | |
| Media della classe Gaming (0.3439 - 0.759, n=106, ultimi 2 anni) | |
* ... Meglio usare valori piccoli
| PCMark 8 Home Score Accelerated v2 | 4405 punti | |
| PCMark 8 Creative Score Accelerated v2 | 6494 punti | |
| PCMark 8 Work Score Accelerated v2 | 5803 punti | |
| PCMark 10 Score | 5747 punti | |
Aiuto | ||
| DPC Latencies / LatencyMon - interrupt to process latency (max), Web, Youtube, Prime95 | |
| Aorus 17G XB | |
| Asus Strix G17 G712LWS | |
| MSI GL75 10SFR | |
| Acer Predator Helios 300 PH317-54-75G8 | |
| Schenker XMG Neo 17 Comet Lake | |
* ... Meglio usare valori piccoli

| Schenker XMG Neo 17 Comet Lake Samsung SSD 970 EVO Plus 1TB | Schenker XMG Neo 17 Samsung SSD 970 EVO Plus 1TB | Acer Predator Helios 300 PH317-54-75G8 WDC PC SN730 SDBQNTY-1T00 | MSI GL75 10SFR Lite-On CL1-8D512 | Asus Strix G17 G712LWS Intel SSD 660p 1TB SSDPEKNW010T8 | Aorus 17G XB Samsung SSD PM981a MZVLB512HBJQ | Media Samsung SSD 970 EVO Plus 1TB | Media della classe Gaming | |
|---|---|---|---|---|---|---|---|---|
| CrystalDiskMark 5.2 / 6 | -31% | -10% | -28% | -25% | -9% | -3% | 48% | |
| Write 4K (MB/s) | 158.6 | 92.7 -42% | 141.9 -11% | 132.2 -17% | 141.1 -11% | 123.4 -22% | 155.5 ? -2% | 199.6 ? 26% |
| Read 4K (MB/s) | 53.6 | 41.4 -23% | 48.75 -9% | 45.62 -15% | 60.9 14% | 45.02 -16% | 51.6 ? -4% | 78.6 ? 47% |
| Write Seq (MB/s) | 2671 | 1363 -49% | 2734 2% | 1511 -43% | 1681 -37% | 2526 -5% | 2660 ? 0% | 3758 ? 41% |
| Read Seq (MB/s) | 2130 | 1259 -41% | 1921 -10% | 1890 -11% | 1602 -25% | 2062 -3% | 2390 ? 12% | 3633 ? 71% |
| Write 4K Q32T1 (MB/s) | 525 | 289.7 -45% | 422.6 -20% | 375.9 -28% | 406.6 -23% | 497.9 -5% | 447 ? -15% | 614 ? 17% |
| Read 4K Q32T1 (MB/s) | 609 | 337.5 -45% | 509 -16% | 525 -14% | 470.2 -23% | 579 -5% | 544 ? -11% | 710 ? 17% |
| Write Seq Q32T1 (MB/s) | 3308 | 3332 1% | 3055 -8% | 1505 -55% | 1759 -47% | 2982 -10% | 3296 ? 0% | 5333 ? 61% |
| Read Seq Q32T1 (MB/s) | 3557 | 3477 -2% | 3257 -8% | 2008 -44% | 1932 -46% | 3440 -3% | 3551 ? 0% | 7102 ? 100% |
| AS SSD | -7% | -12% | -63% | -42% | -16% | 5% | 36% | |
| Seq Read (MB/s) | 2882 | 2359 -18% | 2828 -2% | 1923 -33% | 1778 -38% | 1791 -38% | 2800 ? -3% | 5591 ? 94% |
| Seq Write (MB/s) | 2764 | 2469 -11% | 2677 -3% | 1065 -61% | 1478 -47% | 2193 -21% | 2633 ? -5% | 3972 ? 44% |
| 4K Read (MB/s) | 55.9 | 53.5 -4% | 39.94 -29% | 25.43 -55% | 49.76 -11% | 50.7 -9% | 51.2 ? -8% | 71.1 ? 27% |
| 4K Write (MB/s) | 129.4 | 117.6 -9% | 100.9 -22% | 101.9 -21% | 117.9 -9% | 116.8 -10% | 131.2 ? 1% | 215 ? 66% |
| 4K-64 Read (MB/s) | 1793 | 1579 -12% | 1562 -13% | 477.9 -73% | 591 -67% | 1525 -15% | 1839 ? 3% | 1618 ? -10% |
| 4K-64 Write (MB/s) | 2140 | 2048 -4% | 1867 -13% | 563 -74% | 875 -59% | 1958 -9% | 2144 ? 0% | 2935 ? 37% |
| Access Time Read * (ms) | 0.054 | 0.048 11% | 0.053 2% | 0.082 -52% | 0.07 -30% | 0.04528 ? 16% | 0.06364 ? -18% | |
| Access Time Write * (ms) | 0.03 | 0.03 -0% | 0.037 -23% | 0.126 -320% | 0.041 -37% | 0.032 -7% | 0.03128 ? -4% | 0.03794 ? -26% |
| Score Read (Points) | 2137 | 1869 -13% | 1885 -12% | 696 -67% | 818 -62% | 1755 -18% | 2171 ? 2% | 2248 ? 5% |
| Score Write (Points) | 2546 | 2413 -5% | 2236 -12% | 771 -70% | 1140 -55% | 2294 -10% | 2539 ? 0% | 3547 ? 39% |
| Score Total (Points) | 5774 | 5248 -9% | 5076 -12% | 1785 -69% | 2377 -59% | 4972 -14% | 5812 ? 1% | 6872 ? 19% |
| Copy ISO MB/s (MB/s) | 2189 | 1870 -15% | 1710 -22% | 1495 -32% | 2133 ? -3% | 3168 ? 45% | ||
| Copy Program MB/s (MB/s) | 625 | 545 -13% | 465.3 -26% | 446 -29% | 698 ? 12% | 981 ? 57% | ||
| Copy Game MB/s (MB/s) | 936 | 1083 16% | 1042 11% | 697 -26% | 1521 ? 63% | 2112 ? 126% | ||
| Media totale (Programma / Settaggio) | -19% /
-17% | -11% /
-11% | -46% /
-50% | -34% /
-36% | -13% /
-13% | 1% /
3% | 42% /
40% |
* ... Meglio usare valori piccoli
Velocità di lettura costante: DiskSpd Read Loop, Queue Depth 8


| 3DMark 11 Performance | 24031 punti | |
| 3DMark Cloud Gate Standard Score | 46745 punti | |
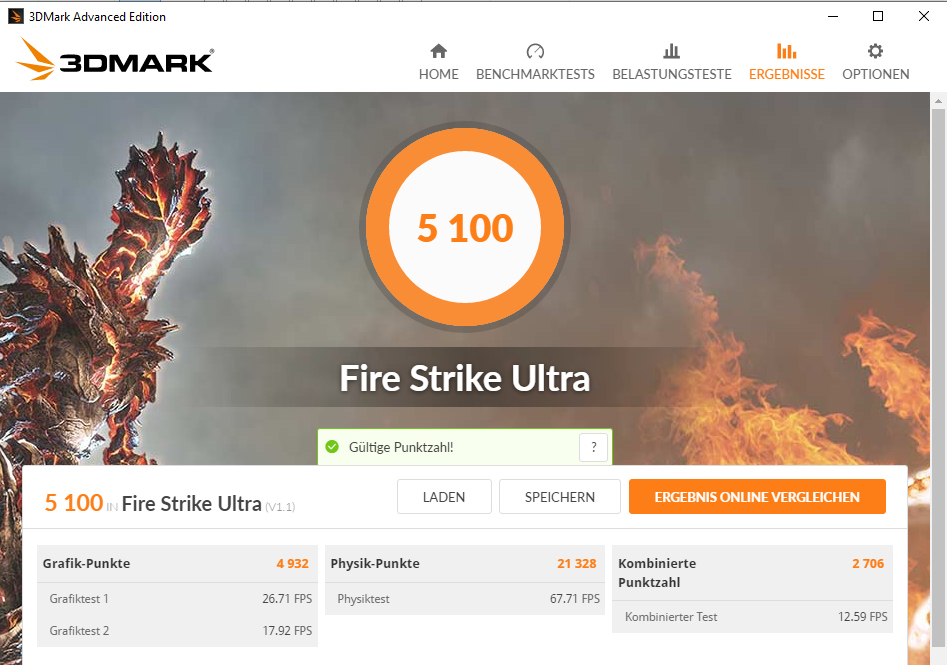
| 3DMark Fire Strike Score | 18229 punti | |
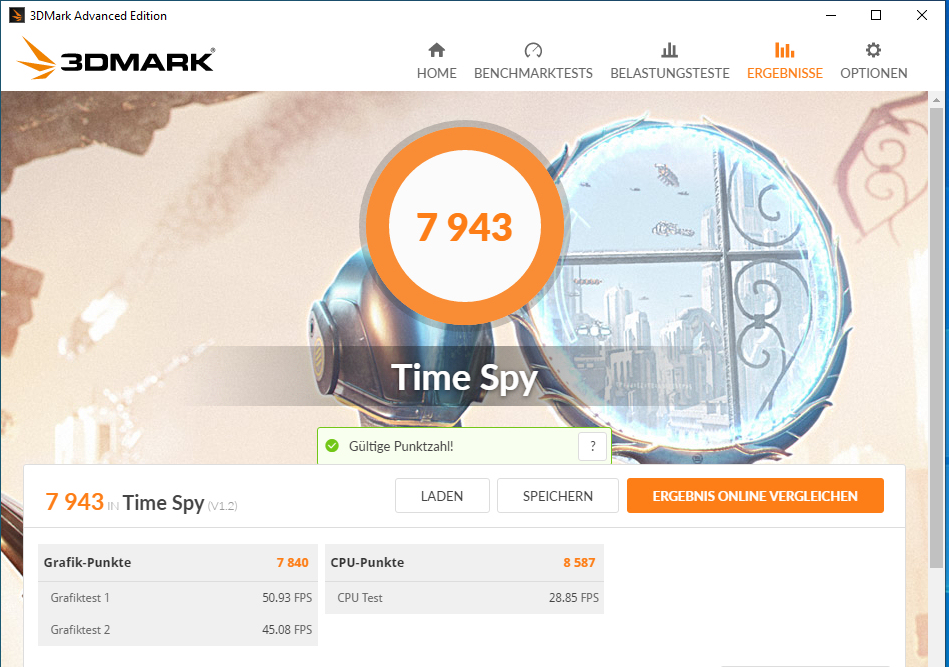
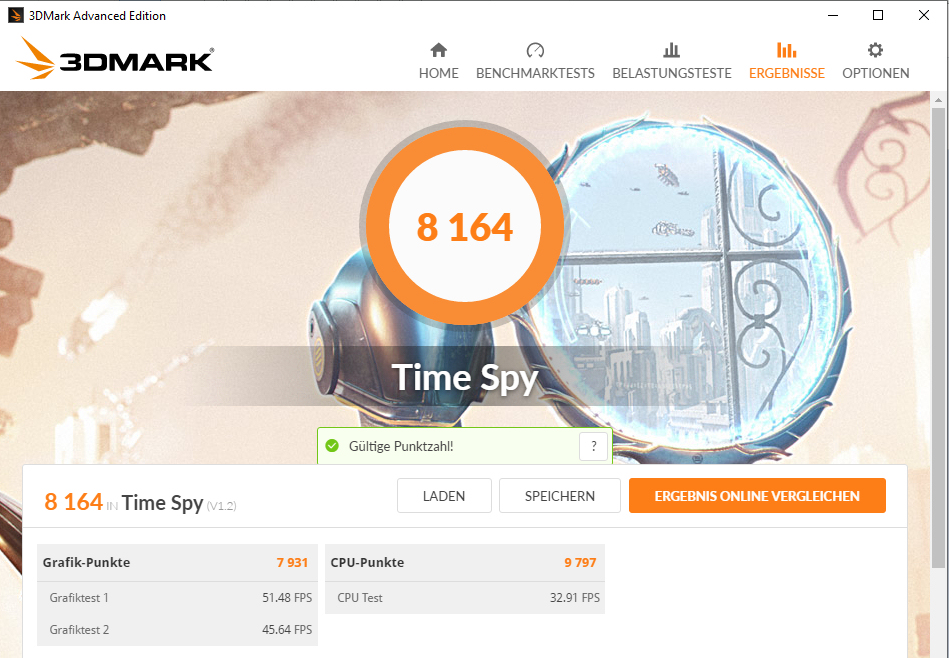
| 3DMark Time Spy Score | 7943 punti | |
Aiuto | ||
| The Witcher 3 - 1920x1080 Ultra Graphics & Postprocessing (HBAO+) | |
| Media della classe Gaming (104.7 - 240, n=6, ultimi 2 anni) | |
| Schenker XMG Neo 17 Comet Lake | |
| Asus Strix G17 G712LWS | |
| Media NVIDIA GeForce RTX 2070 Super Mobile (76.3 - 94.6, n=8) | |
| MSI GL75 10SFR | |
| Aorus 17G XB | |
| Schenker XMG Neo 17 | |
| Acer Predator Helios 300 PH317-54-75G8 | |
| Schenker XMG Neo 17 XNE17M19 | |
| Serious Sam 4 - 1920x1080 Ultra (DX12) AA:2xMS | |
| Media NVIDIA GeForce RTX 2070 Super Mobile (71.1 - 82.1, n=4) | |
| Schenker XMG Neo 17 Comet Lake | |
| Asus Strix G17 G712LWS | |
| Acer Predator Helios 300 PH317-54-75G8 | |
| Mafia Definitive Edition - 1920x1080 High Preset | |
| Schenker XMG Neo 17 Comet Lake | |
| Media NVIDIA GeForce RTX 2070 Super Mobile (92 - 96.6, n=2) | |
| Asus Strix G17 G712LWS | |
| Acer Predator Helios 300 PH317-54-75G8 | |
| Doom Eternal - 1920x1080 Ultra Preset | |
| Media NVIDIA GeForce RTX 2070 Super Mobile (151 - 190.4, n=5) | |
| Asus Strix G17 G712LWS | |
| Schenker XMG Neo 17 Comet Lake | |
| MSI GL75 10SFR | |
| Acer Predator Helios 300 PH317-54-75G8 | |
| Watch Dogs Legion - 1920x1080 Ultra Preset (DX12) | |
| Media NVIDIA GeForce RTX 2070 Super Mobile (59.3 - 64, n=4) | |
| Schenker XMG Neo 17 Comet Lake (Overboost) | |
| Schenker XMG Neo 17 Comet Lake | |
| Dirt 5 - 1920x1080 Ultra High Preset | |
| Media NVIDIA GeForce RTX 2070 Super Mobile (45.5 - 68.6, n=3) | |
| Schenker XMG Neo 17 Comet Lake | |
| Flight Simulator 2020 - 1920x1080 Ultra AA:TAA AF:16x | |
| Schenker XMG Neo 17 Comet Lake (Overboost) | |
| Schenker XMG Neo 17 Comet Lake | |
| Media NVIDIA GeForce RTX 2070 Super Mobile (37.8 - 43.8, n=3) | |
| Asus Strix G17 G712LWS | |
| Acer Predator Helios 300 PH317-54-75G8 | |
| basso | medio | alto | ultra | |
|---|---|---|---|---|
| The Witcher 3 (2015) | 274 | 247.1 | 162.9 | 90.8 |
| Doom Eternal (2020) | 234.1 | 171.5 | 151.9 | 151 |
| Horizon Zero Dawn (2020) | 152 | 129 | 116 | 98 |
| Flight Simulator 2020 (2020) | 71.2 | 61.7 | 53.3 | 42.1 |
| Serious Sam 4 (2020) | 122 | 93.7 | 87.8 | 72.5 |
| Mafia Definitive Edition (2020) | 149.5 | 106 | 96.6 | |
| Watch Dogs Legion (2020) | 112.2 | 102.7 | 90.1 | 59.3 |
| Dirt 5 (2020) | 157 | 91 | 73.6 | 45.5 |
| Assassin´s Creed Valhalla (2020) | 122 | 83 | 71 | 60 |
Rumorosità
| Idle |
| 26 / 30 / 33 dB(A) |
| Sotto carico |
| 50 / 52 dB(A) |
 | ||
30 dB silenzioso 40 dB(A) udibile 50 dB(A) rumoroso |
||
min: | ||
(-) La temperatura massima sul lato superiore è di 48 °C / 118 F, rispetto alla media di 40.4 °C / 105 F, che varia da 21.2 a 68.8 °C per questa classe Gaming.
(-) Il lato inferiore si riscalda fino ad un massimo di 54 °C / 129 F, rispetto alla media di 43.2 °C / 110 F
(+) In idle, la temperatura media del lato superiore è di 29.1 °C / 84 F, rispetto alla media deld ispositivo di 33.9 °C / 93 F.
(-) Riproducendo The Witcher 3, la temperatura media per il lato superiore e' di 41.6 °C / 107 F, rispetto alla media del dispositivo di 33.9 °C / 93 F.
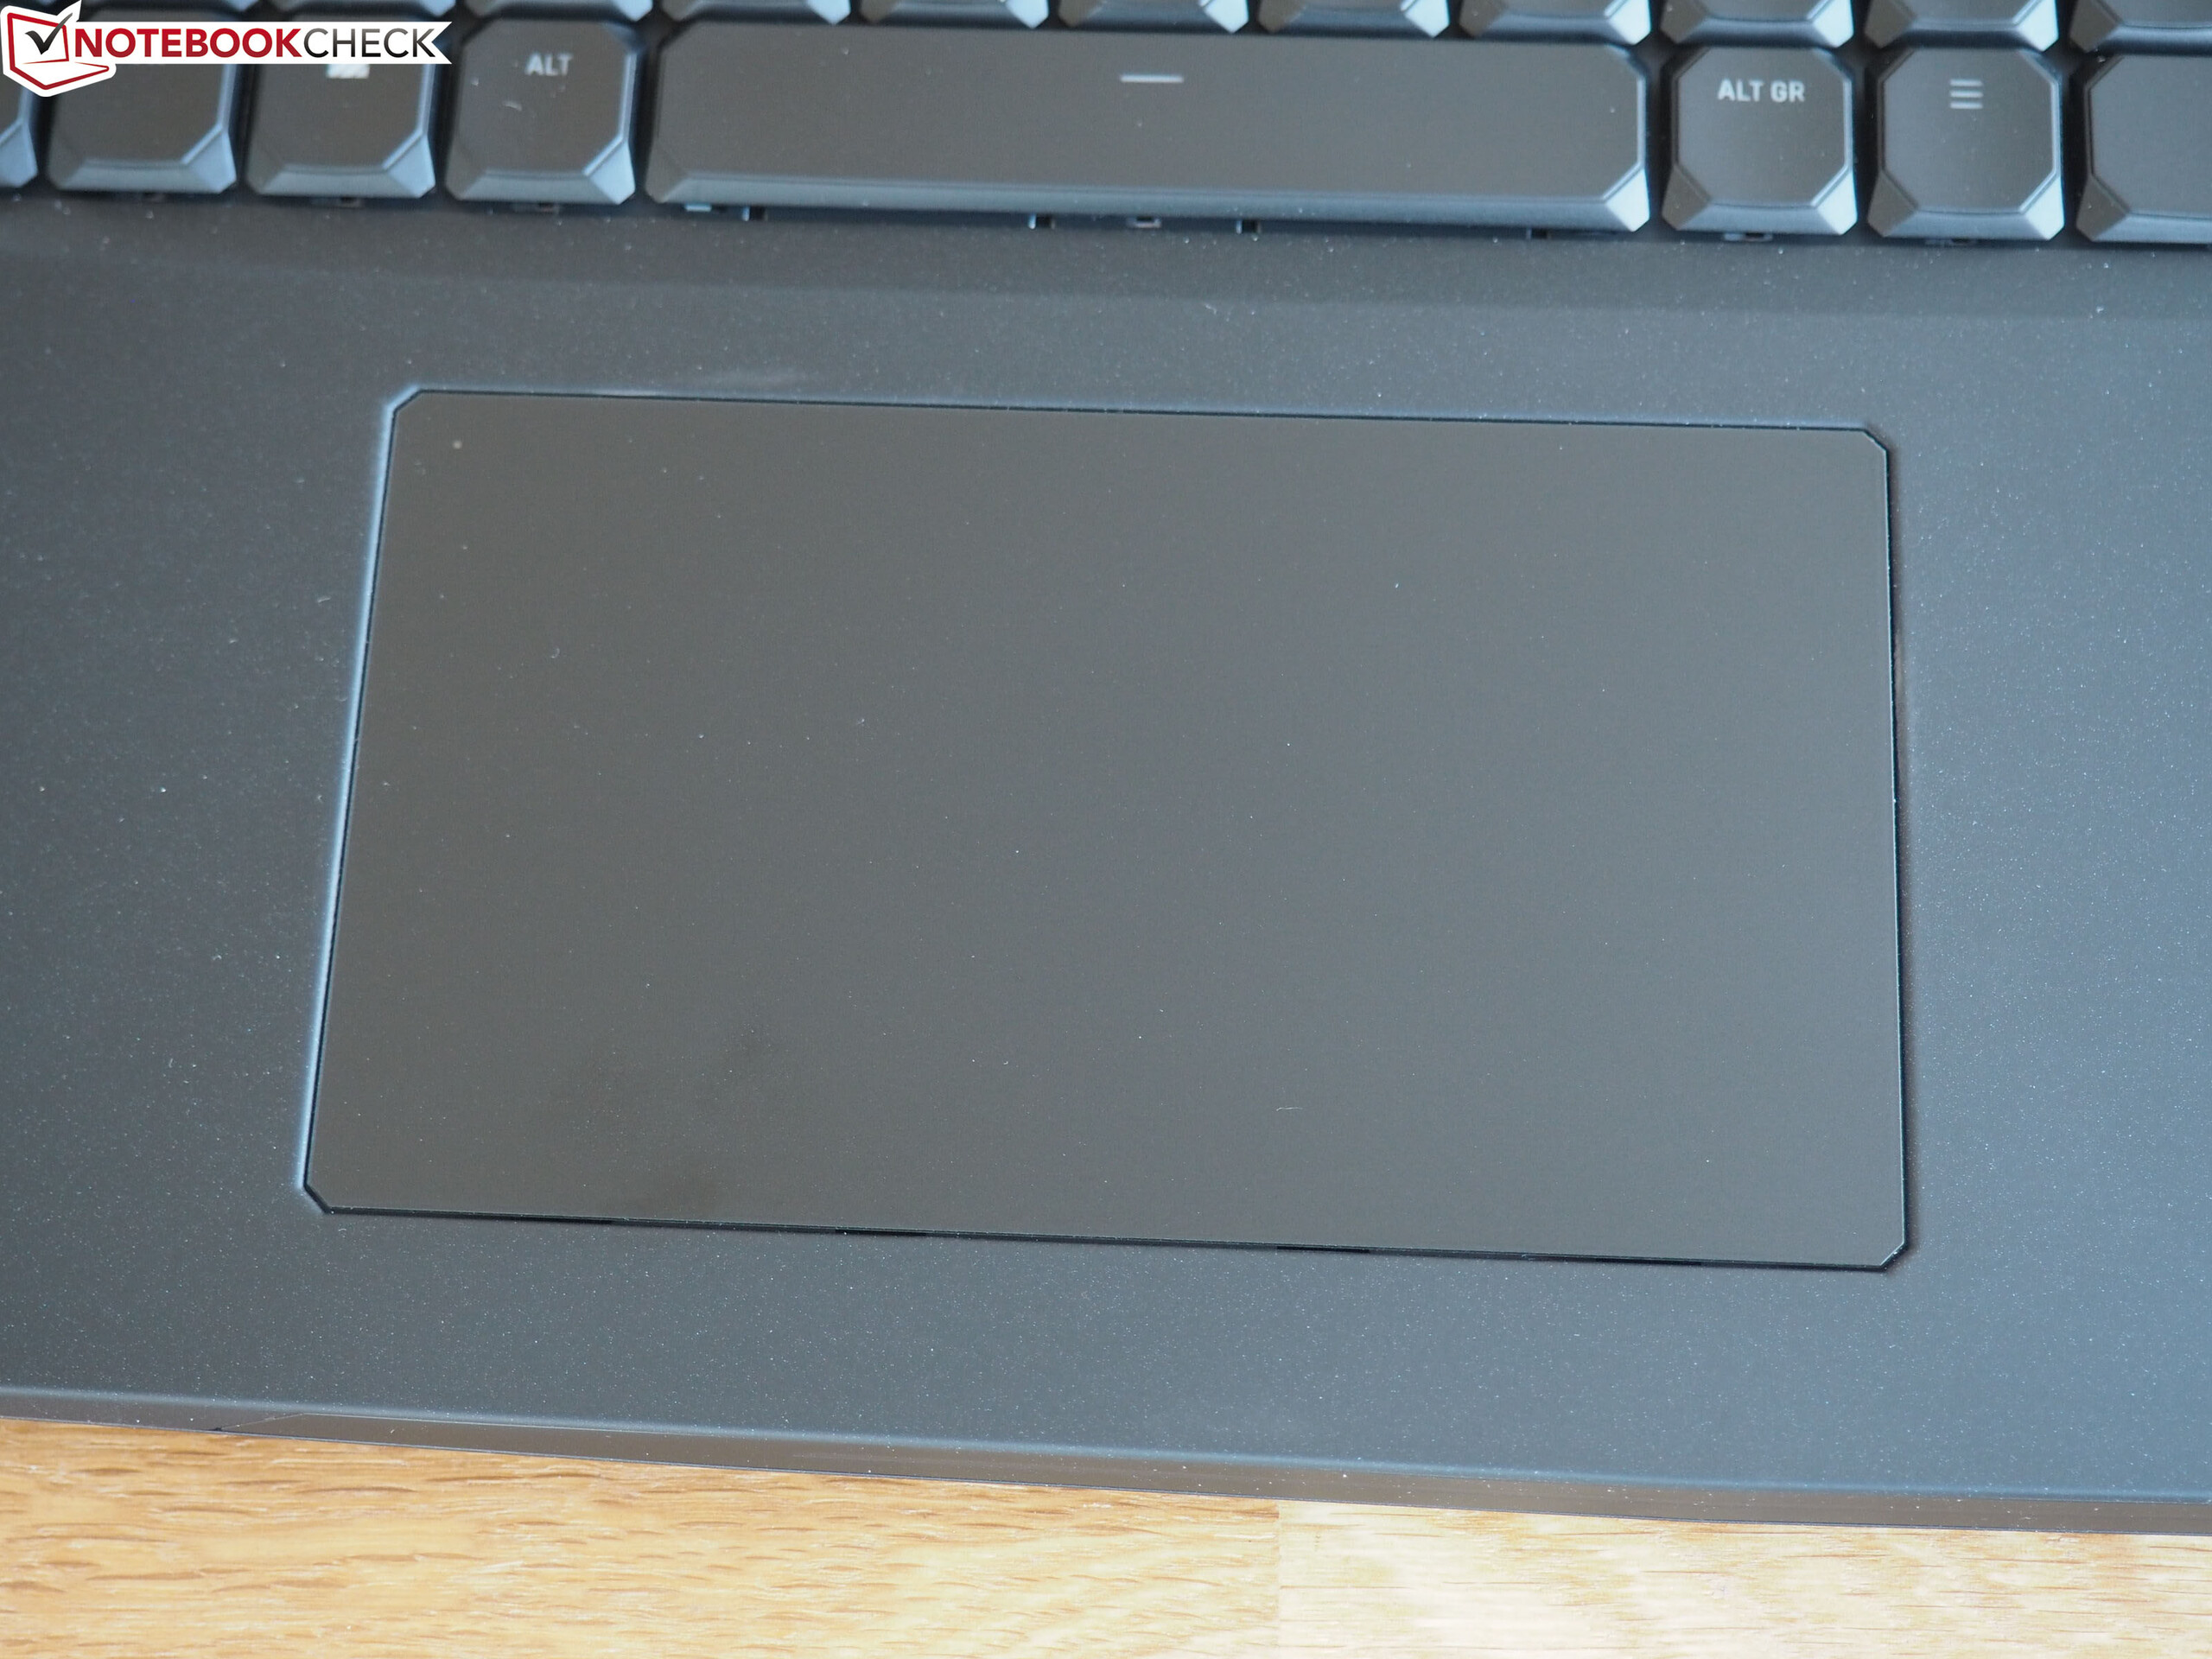
(±) I poggiapolsi e il touchpad possono diventare molto caldi al tatto con un massimo di 39 °C / 102.2 F.
(-) La temperatura media della zona del palmo della mano di dispositivi simili e'stata di 28.8 °C / 83.8 F (-10.2 °C / -18.4 F).
Schenker XMG Neo 17 Comet Lake analisi audio
(+) | gli altoparlanti sono relativamente potenti (82 dB)
Bassi 100 - 315 Hz
(-) | quasi nessun basso - in media 25.2% inferiori alla media
(±) | la linearità dei bassi è media (12.7% delta rispetto alla precedente frequenza)
Medi 400 - 2000 Hz
(+) | medi bilanciati - solo only 3.3% rispetto alla media
(+) | medi lineari (4.4% delta rispetto alla precedente frequenza)
Alti 2 - 16 kHz
(+) | Alti bilanciati - appena 2.8% dalla media
(±) | la linearità degli alti è media (7.8% delta rispetto alla precedente frequenza)
Nel complesso 100 - 16.000 Hz
(±) | la linearità complessiva del suono è media (17.1% di differenza rispetto alla media
Rispetto alla stessa classe
» 46% di tutti i dispositivi testati in questa classe è stato migliore, 12% simile, 43% peggiore
» Il migliore ha avuto un delta di 6%, medio di 18%, peggiore di 132%
Rispetto a tutti i dispositivi testati
» 31% di tutti i dispositivi testati in questa classe è stato migliore, 8% similare, 61% peggiore
» Il migliore ha avuto un delta di 4%, medio di 23%, peggiore di 134%
| Off / Standby | |
| Idle | |
| Sotto carico |
|
Leggenda:
min: | |
Pro
Contro
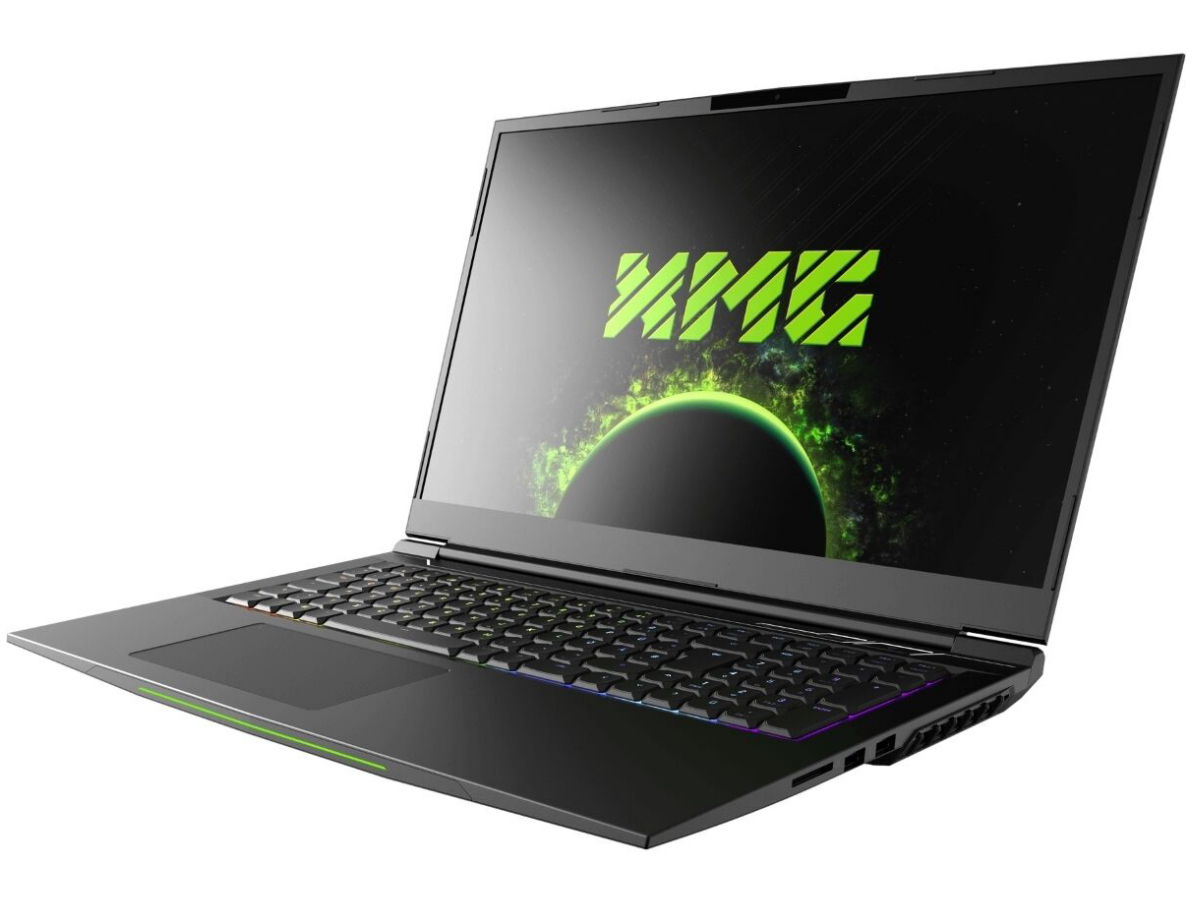
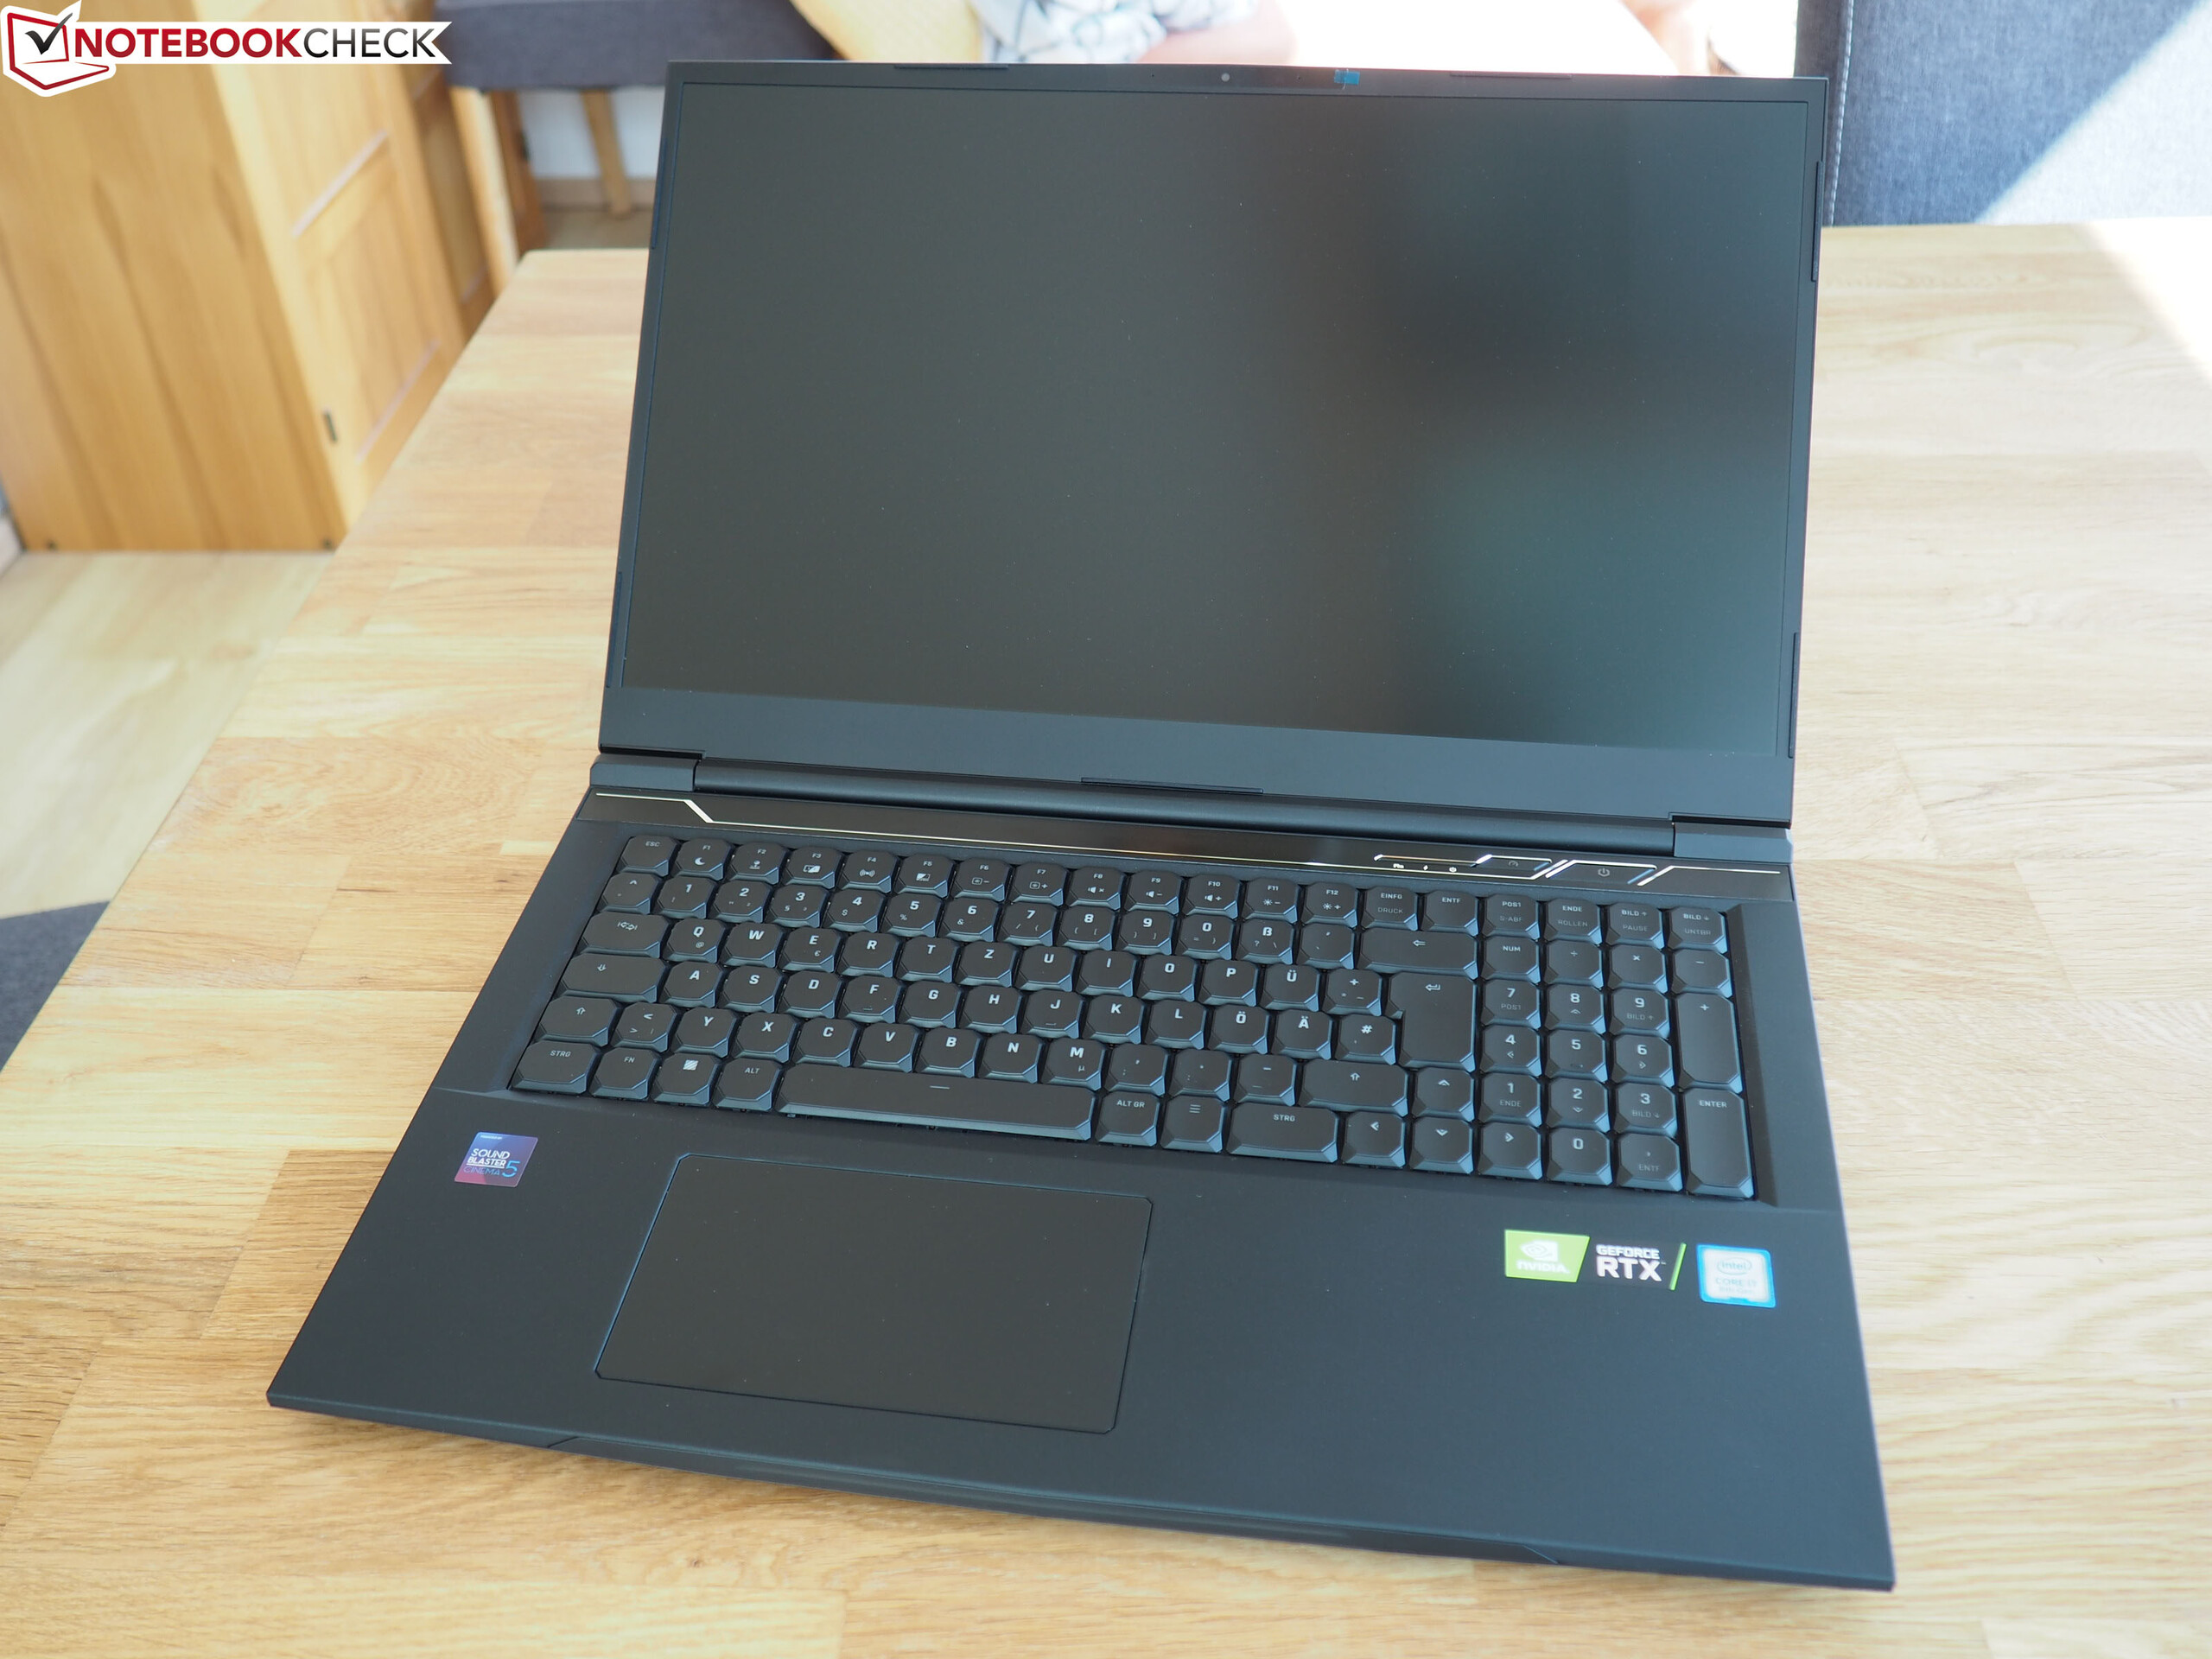
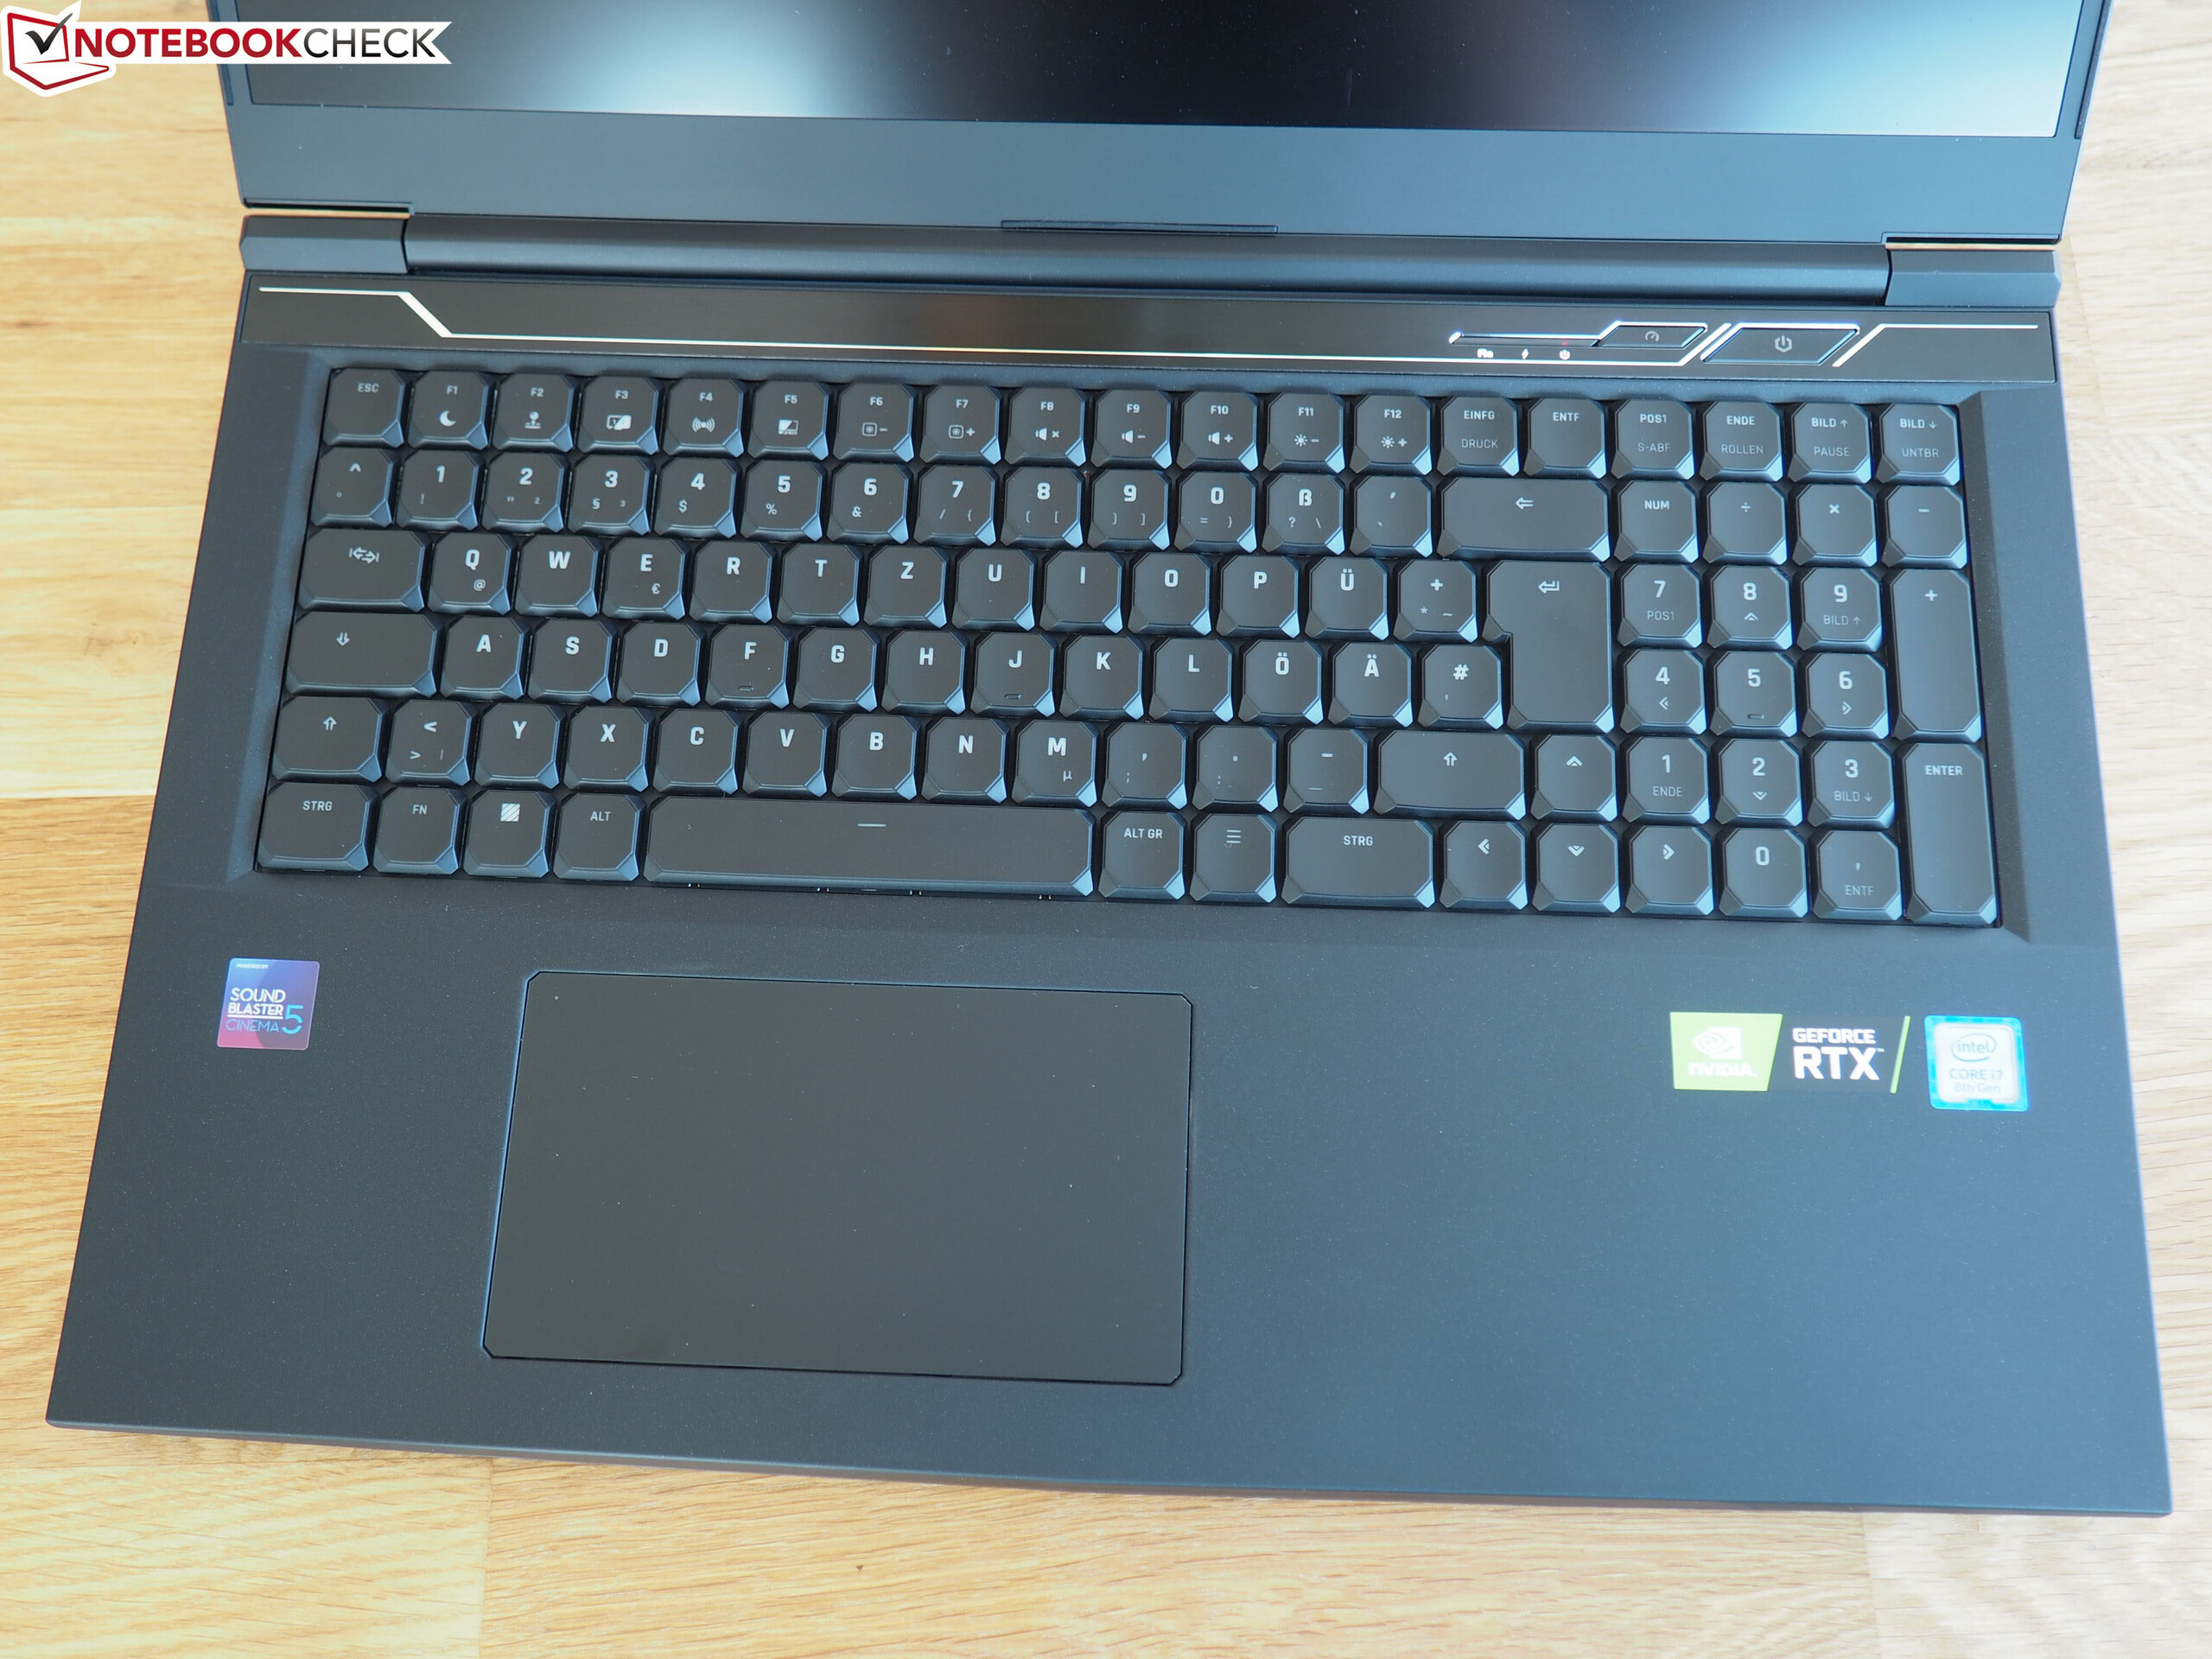
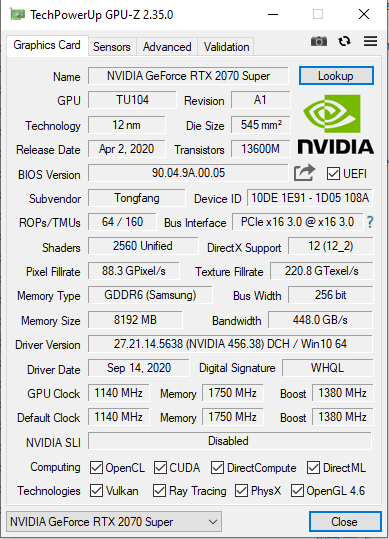
Grazie al processore corei7-10875H octa-core, al core grafico GeForce RTX 2070-Super e ai 32 GB di memoria di lavoro, l'XMG Neo 17 è equipaggiato per ogni possibile sfida. L'hardware è in grado di gestire sullo schermo tutti i giochi per computer attuali senza problemi, senza la necessità di alcun compromesso.
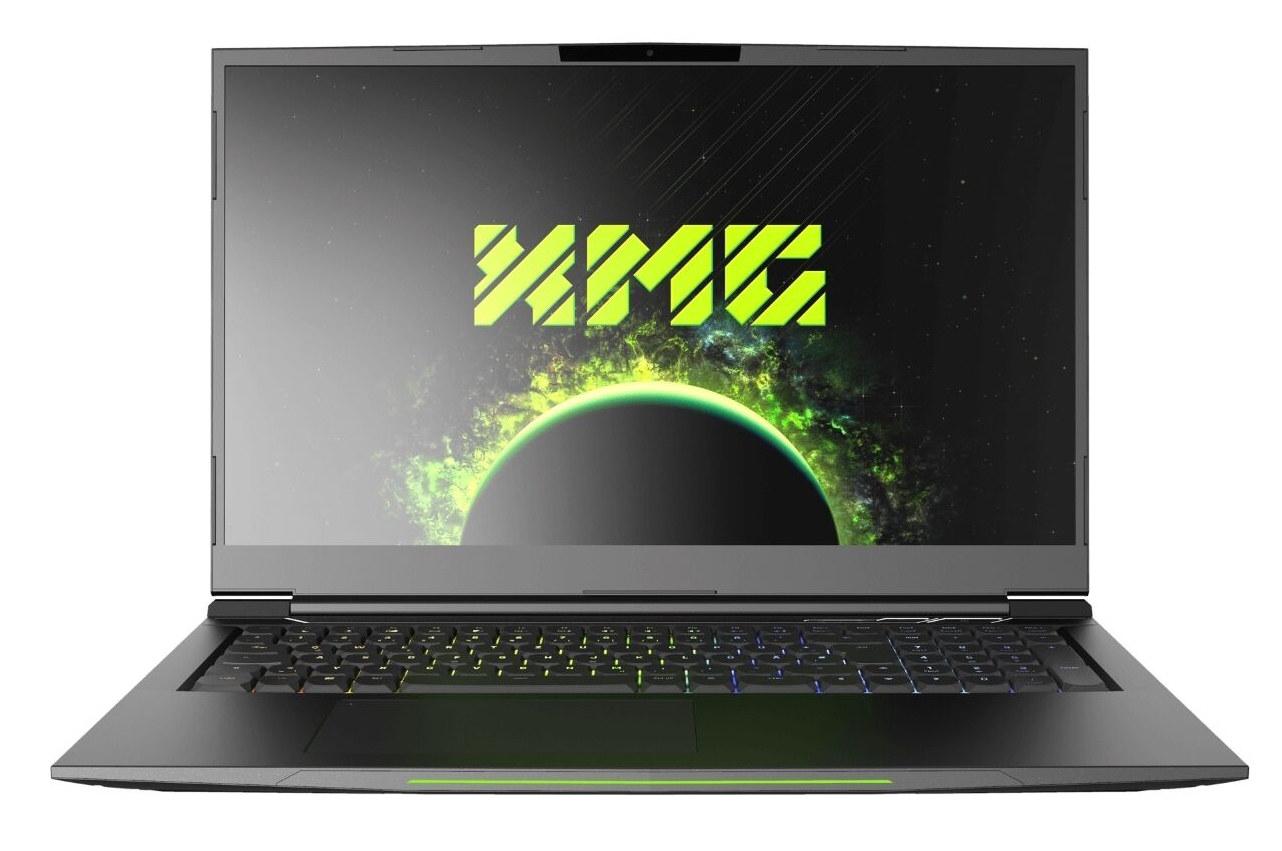
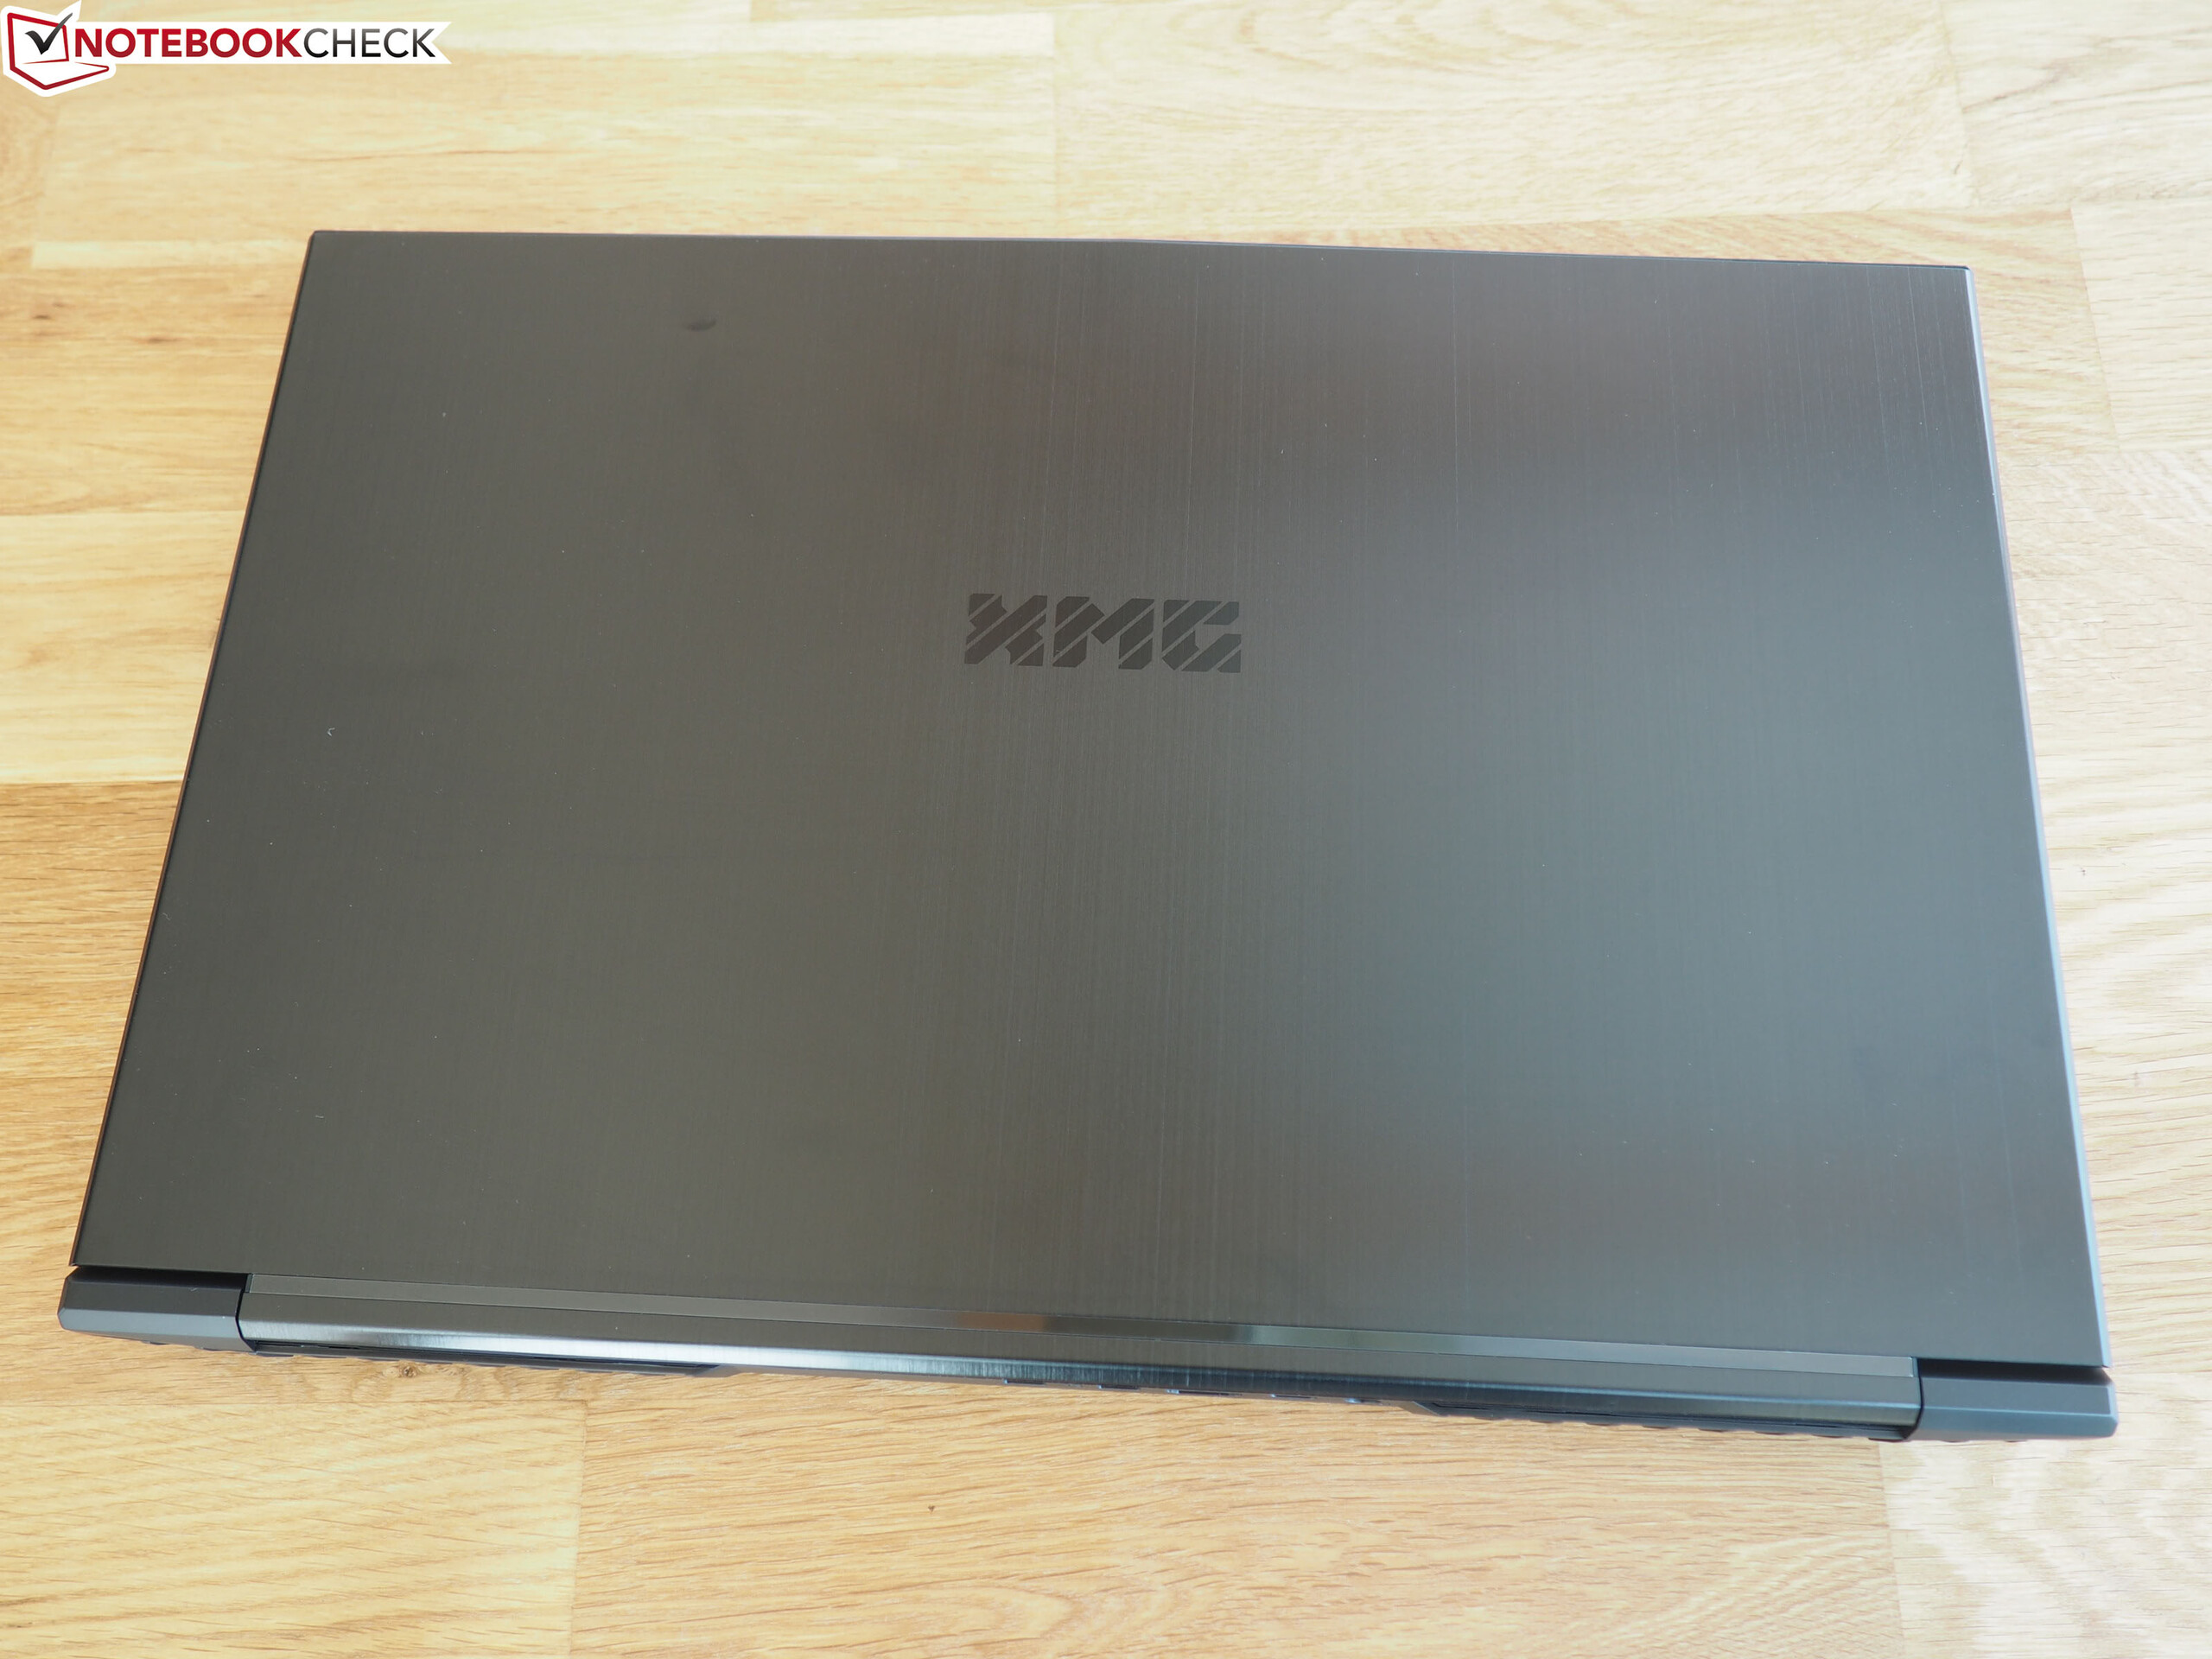
Con l'XMG Neo 17 (2020), Schenkeroffre un portatile da gioco estremamente potente, il cui aspetto moderato permette di utilizzarlo in ufficio
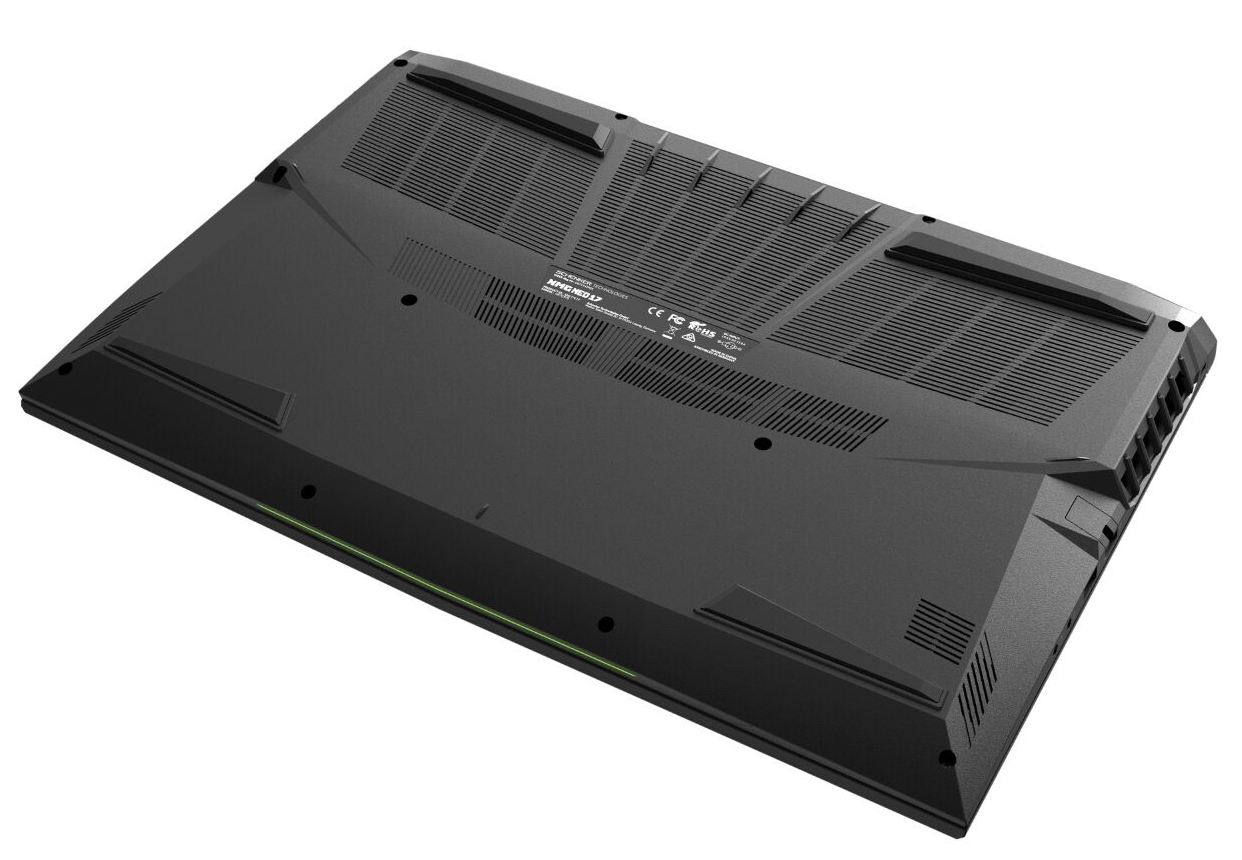
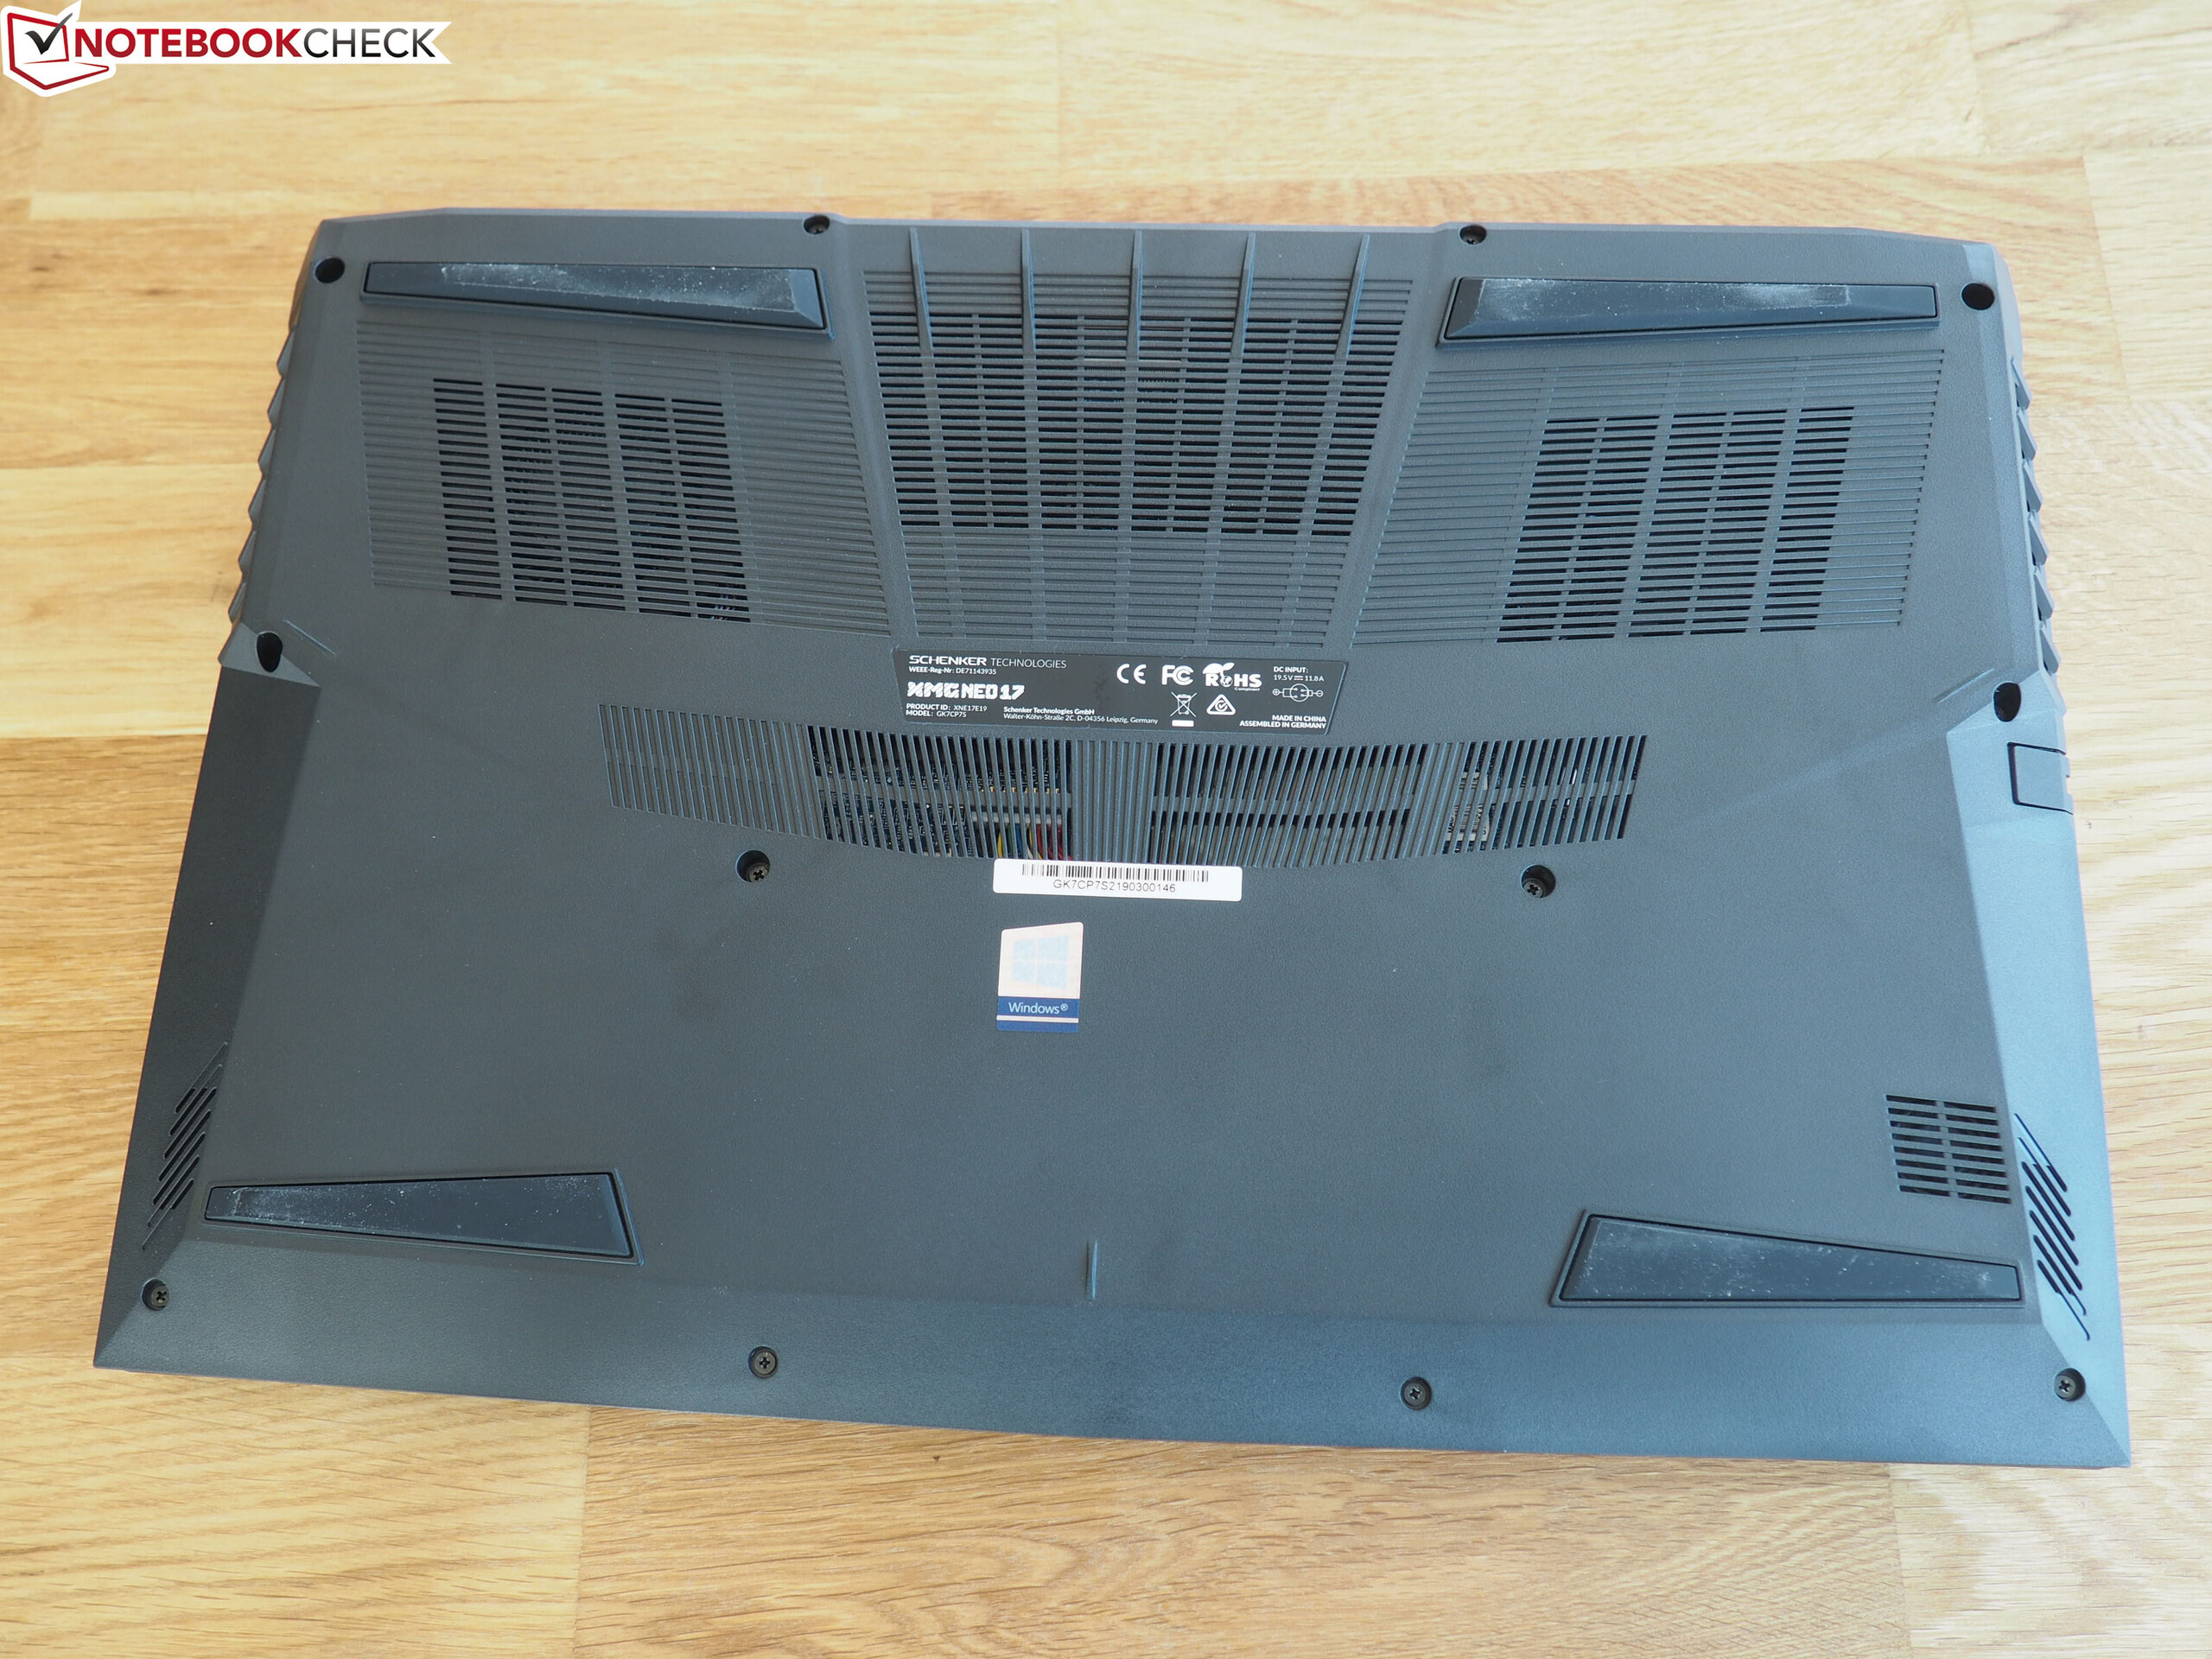
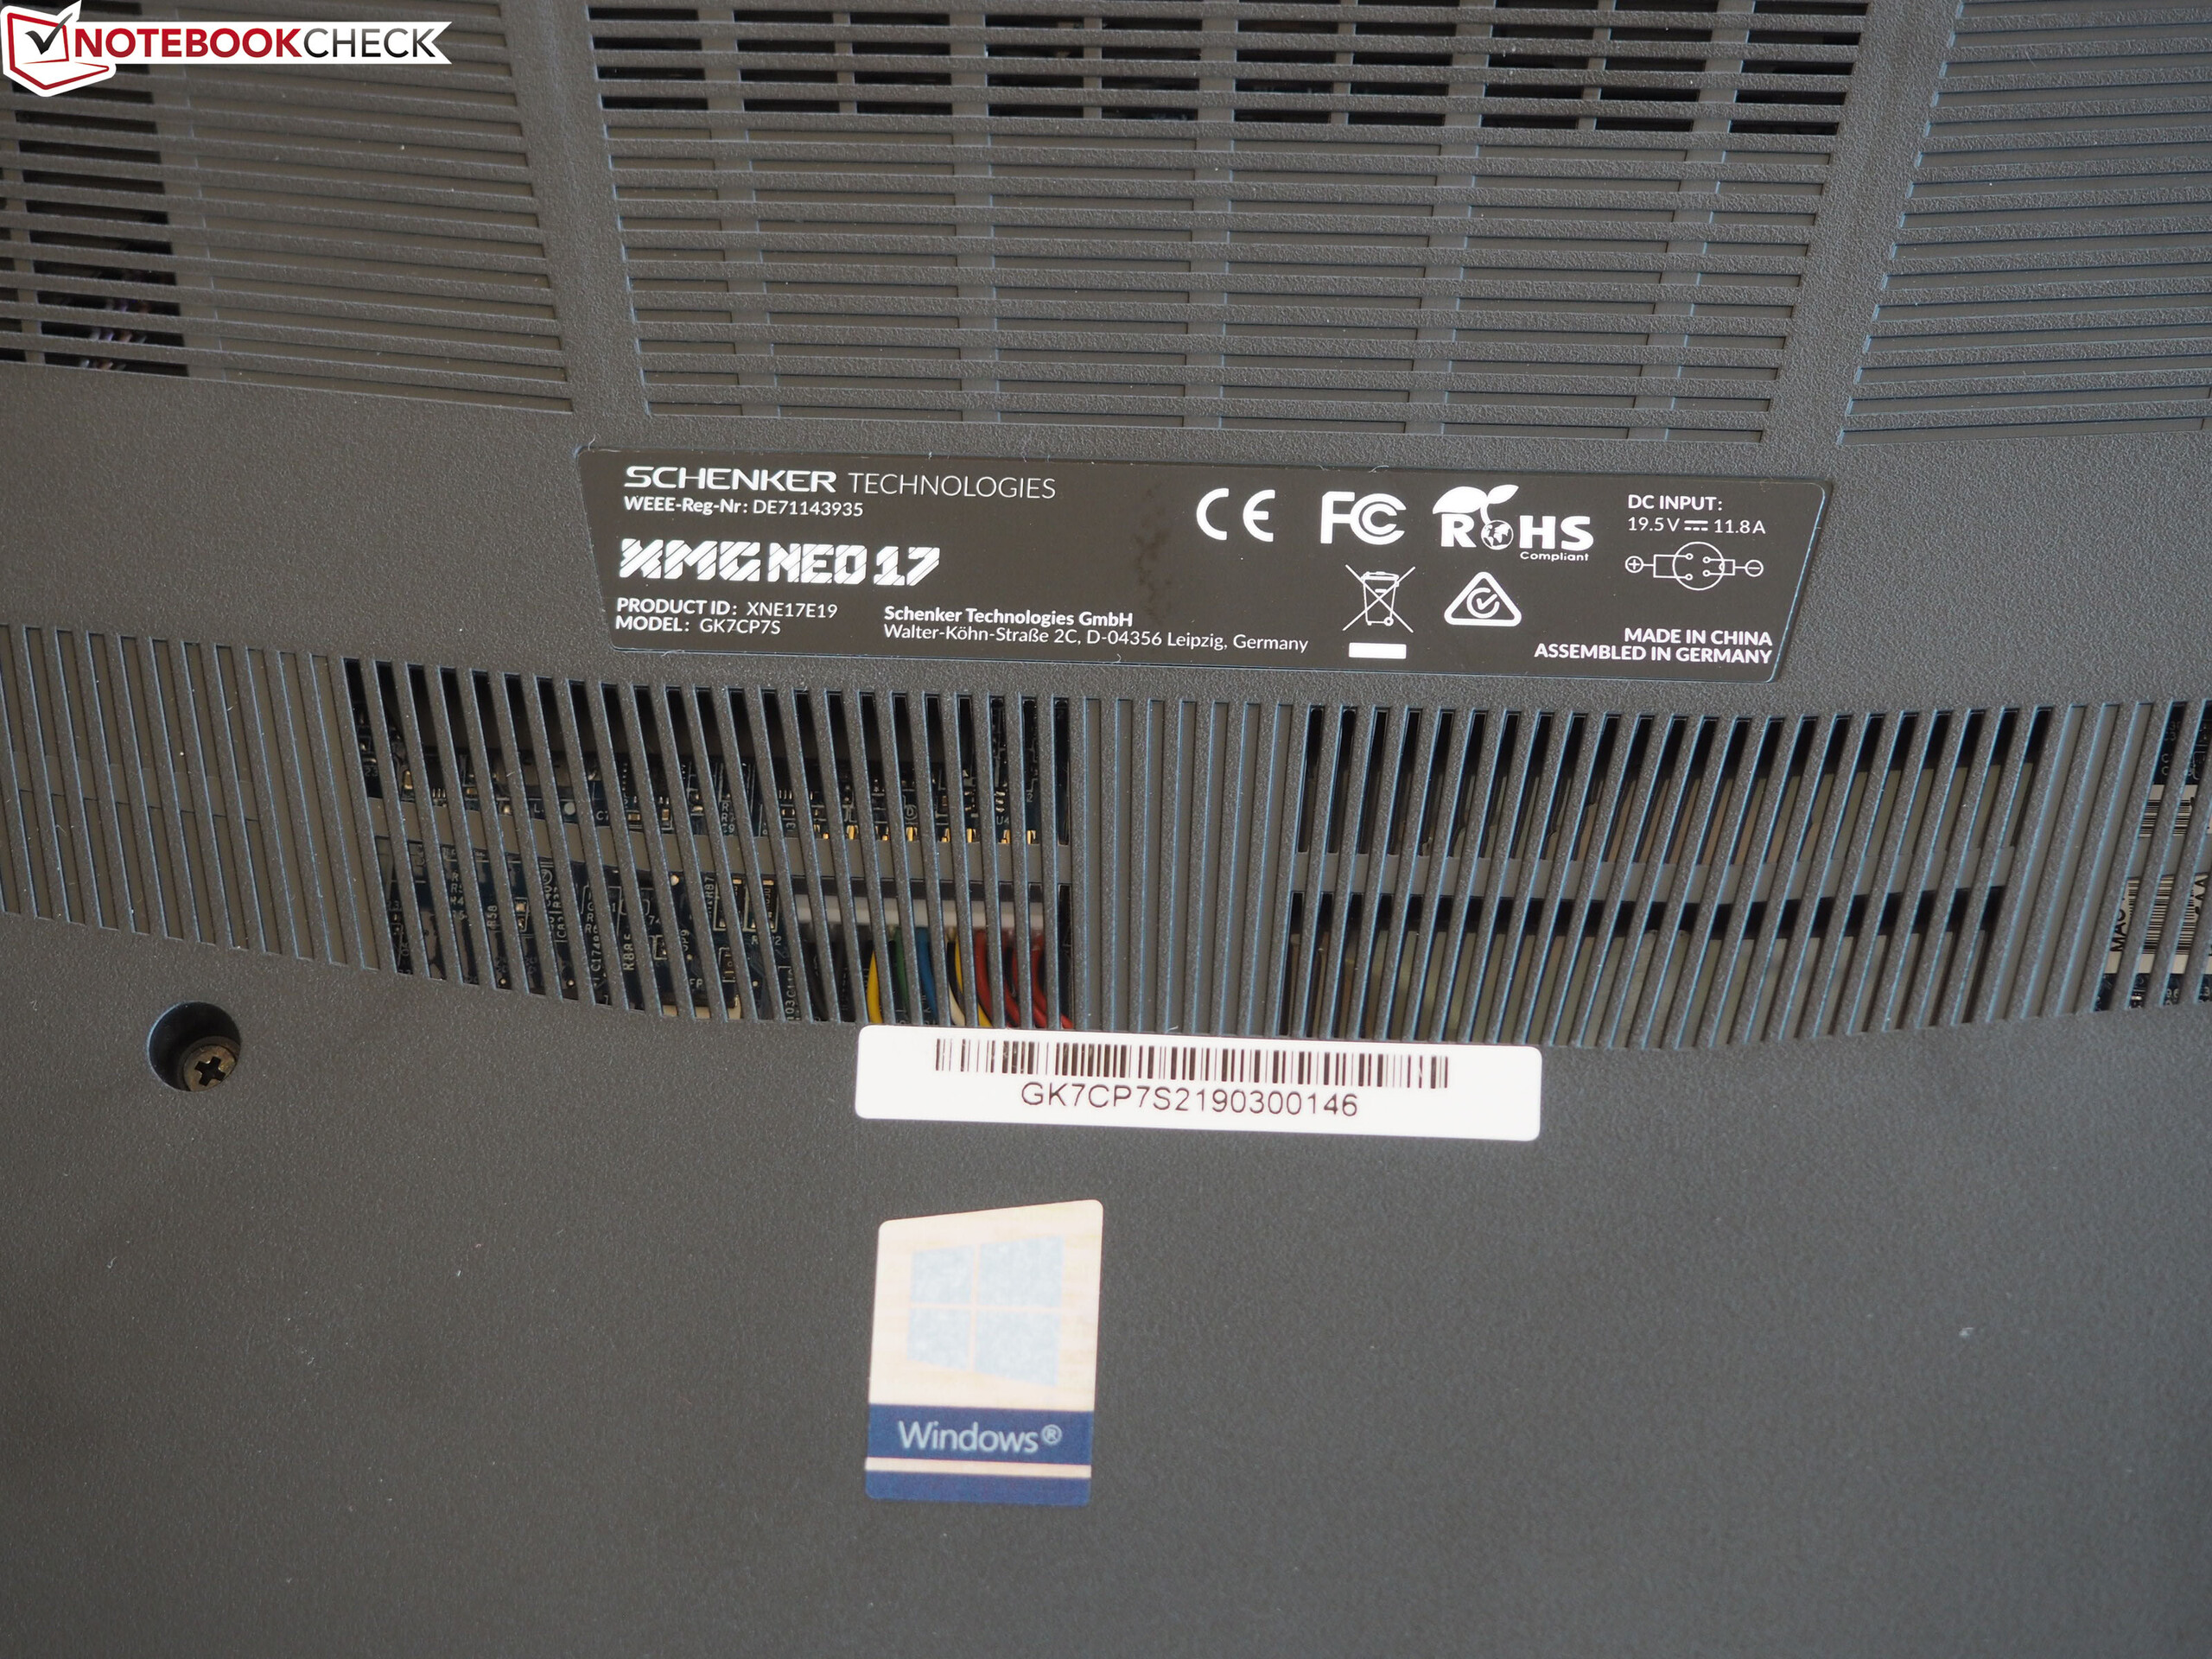
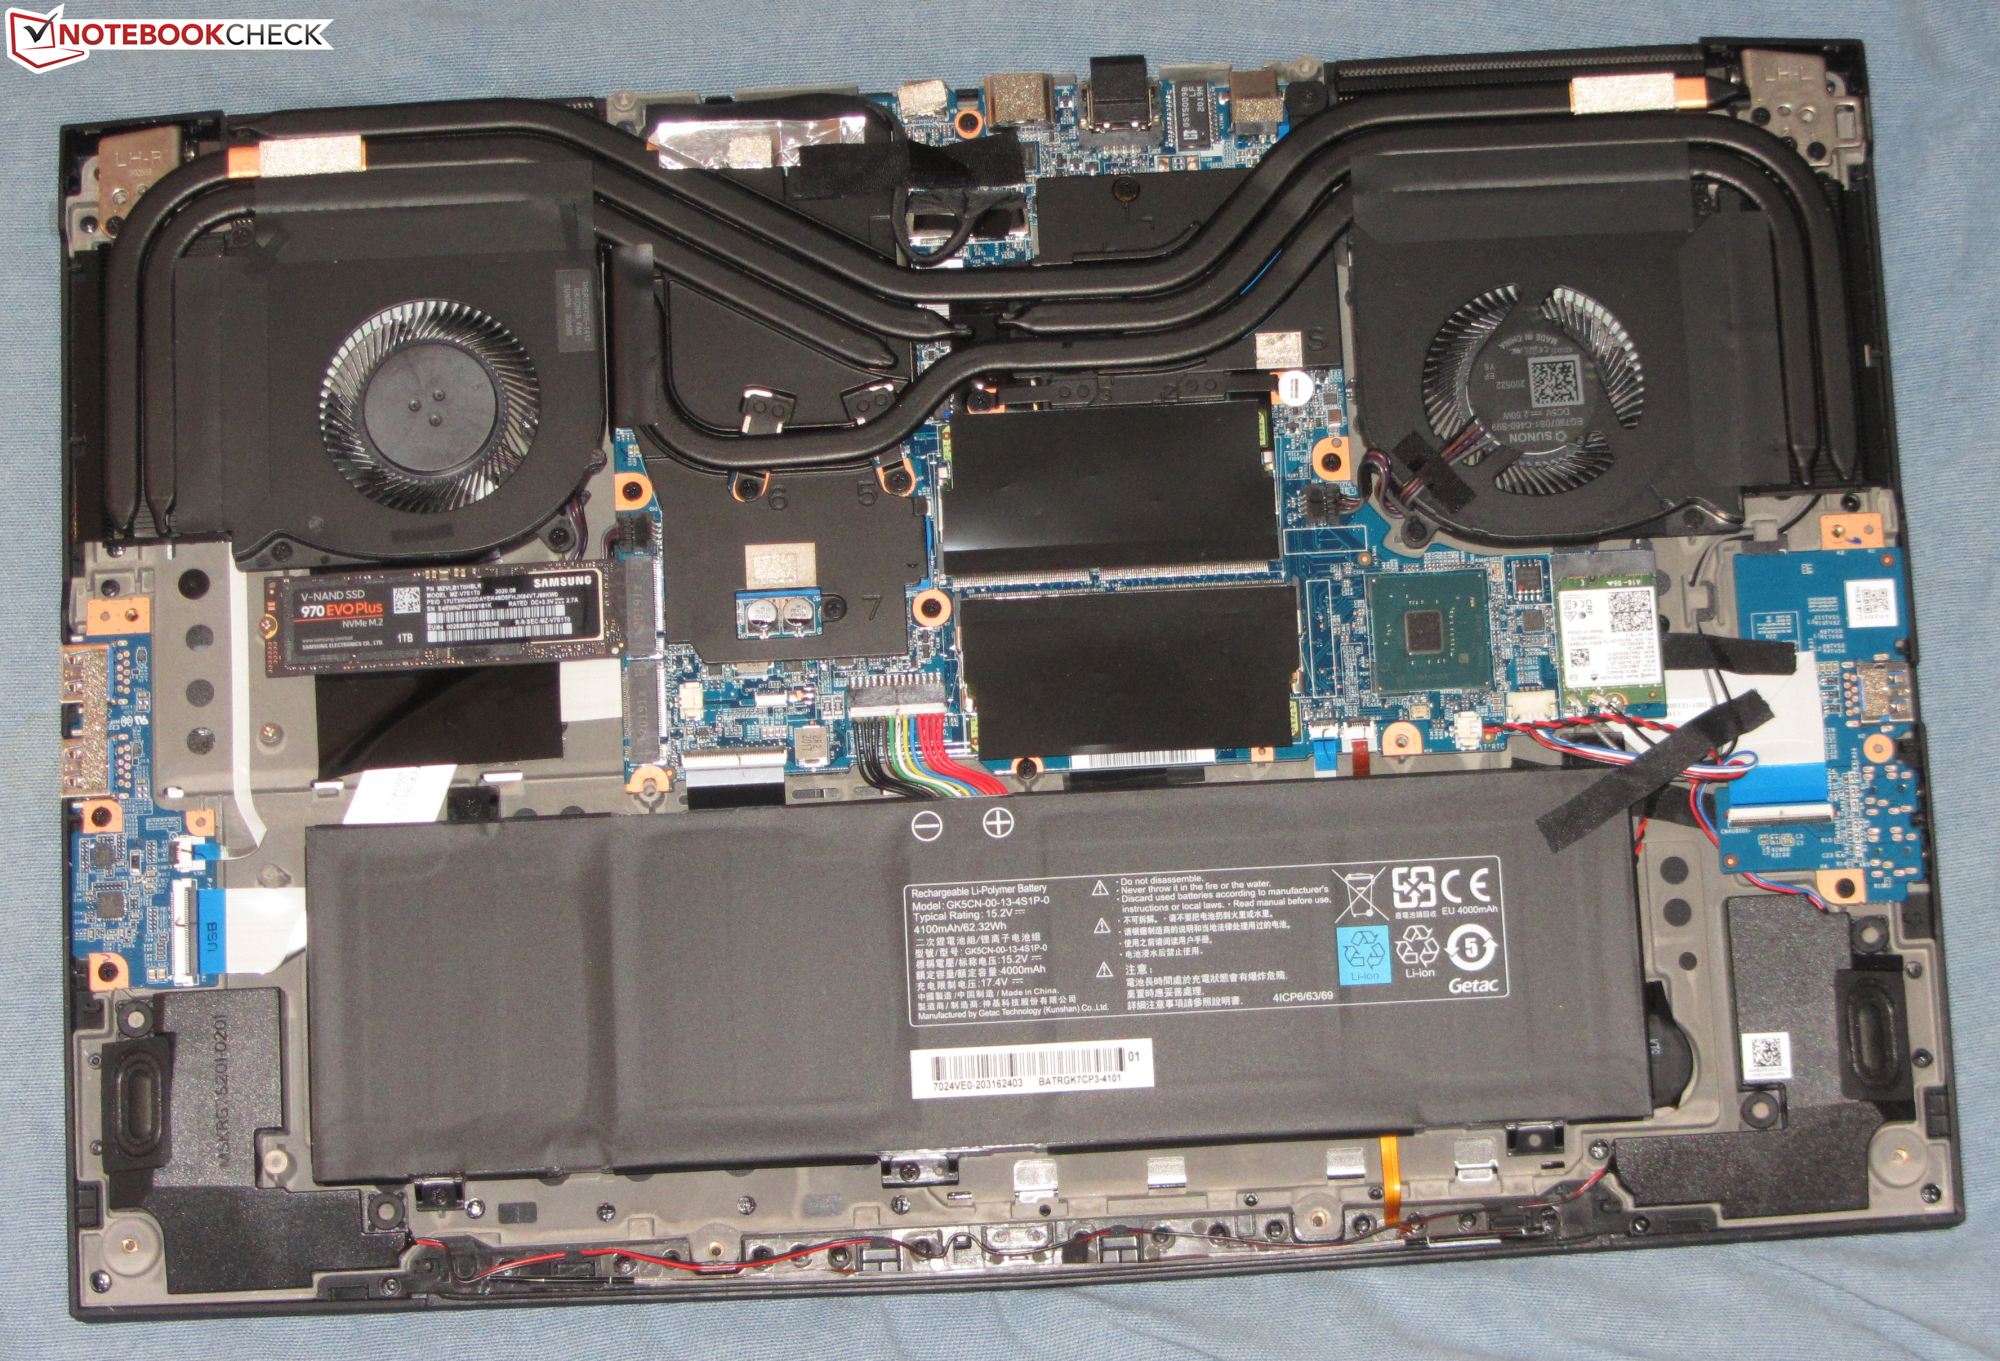
Se si esaurisce lo spazio di archiviazione con l'SSD NVMe 1-TB integrato, è possibile un upgrade, poiché il laptop offre spazio per due SSD M.2-2280 (1x NVMe, 1x NVMe/SATA; RAID 0/1). Il display molto reattivo (FHD, IPS, 240 Hz) ha una buona riproduzione dei colori e una copertura dello spazio colore accettabile. La luminosità e il contrasto soddisfano i requisiti, ma la durata della batteria risulta mediocre.
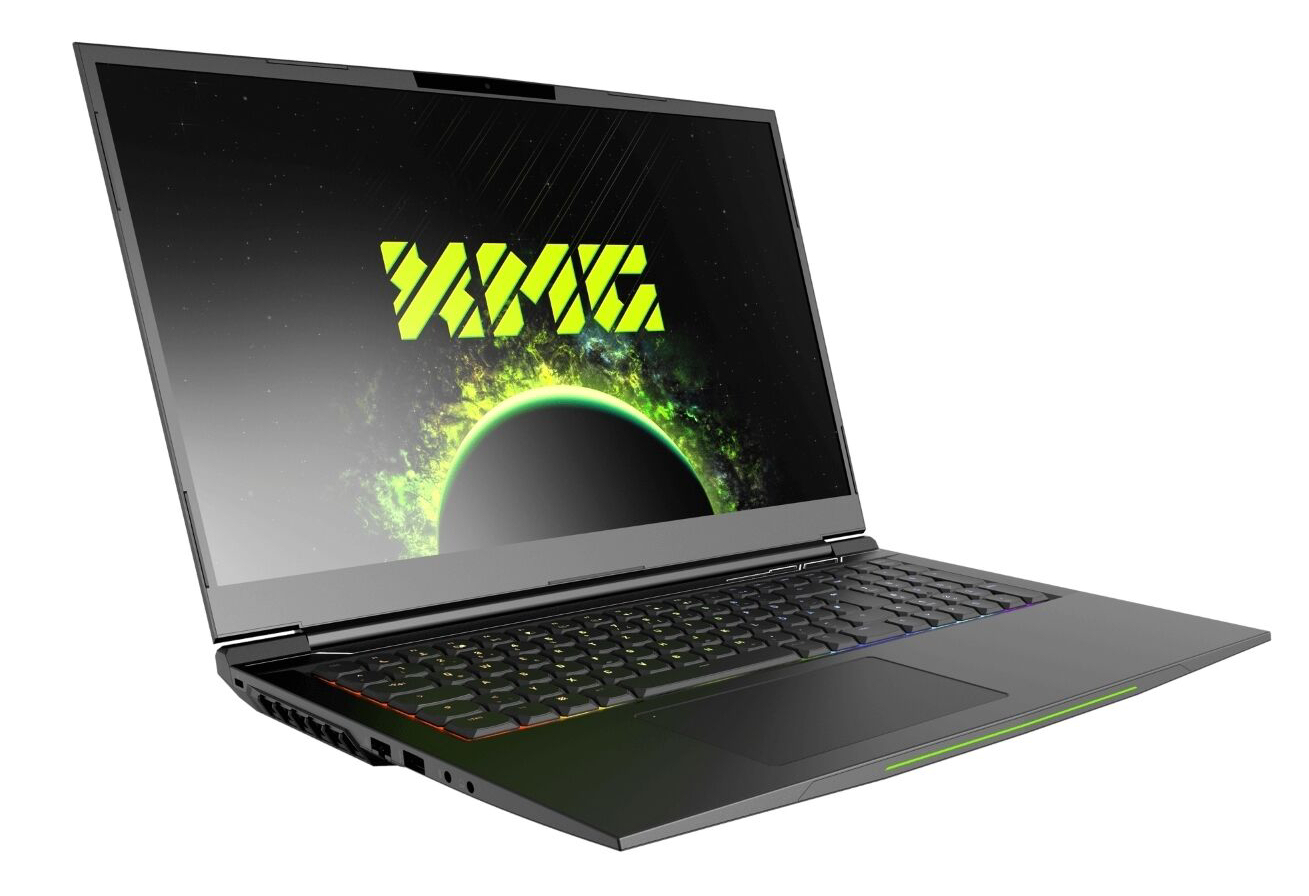
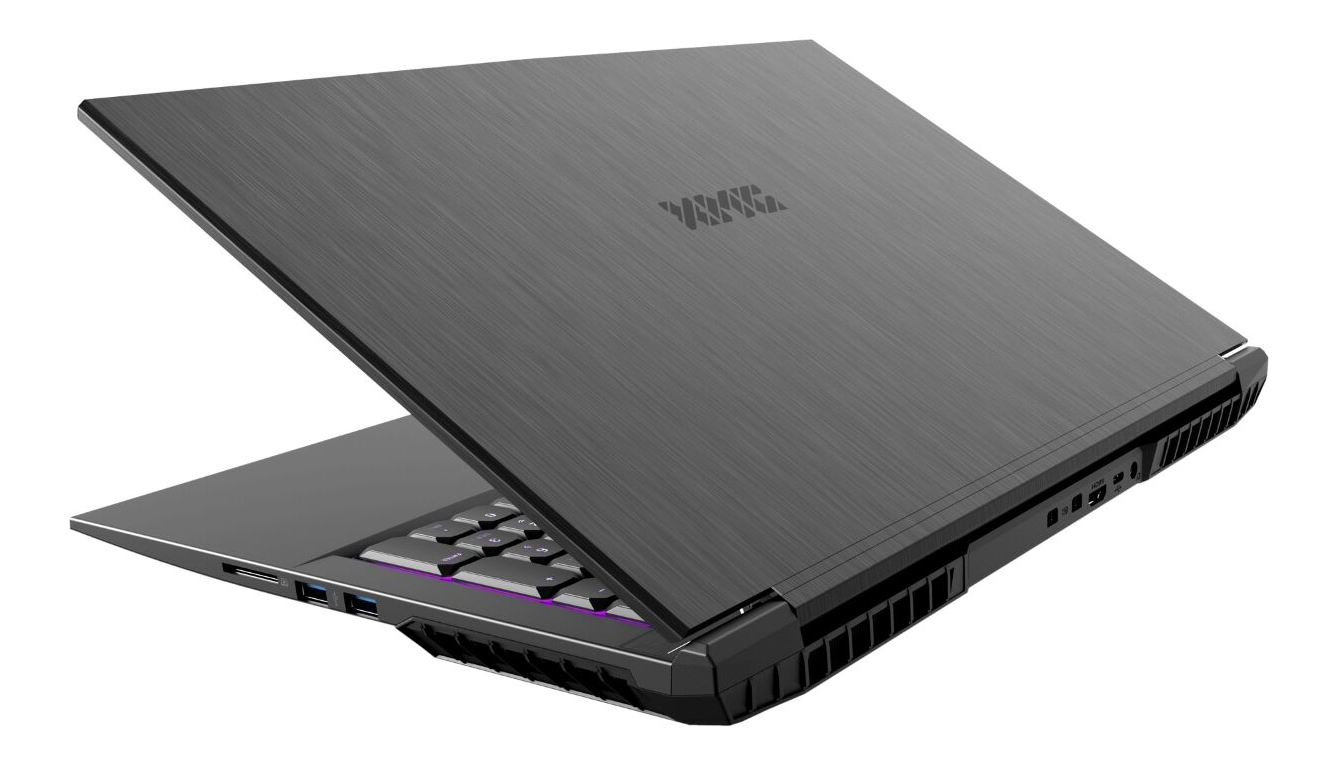
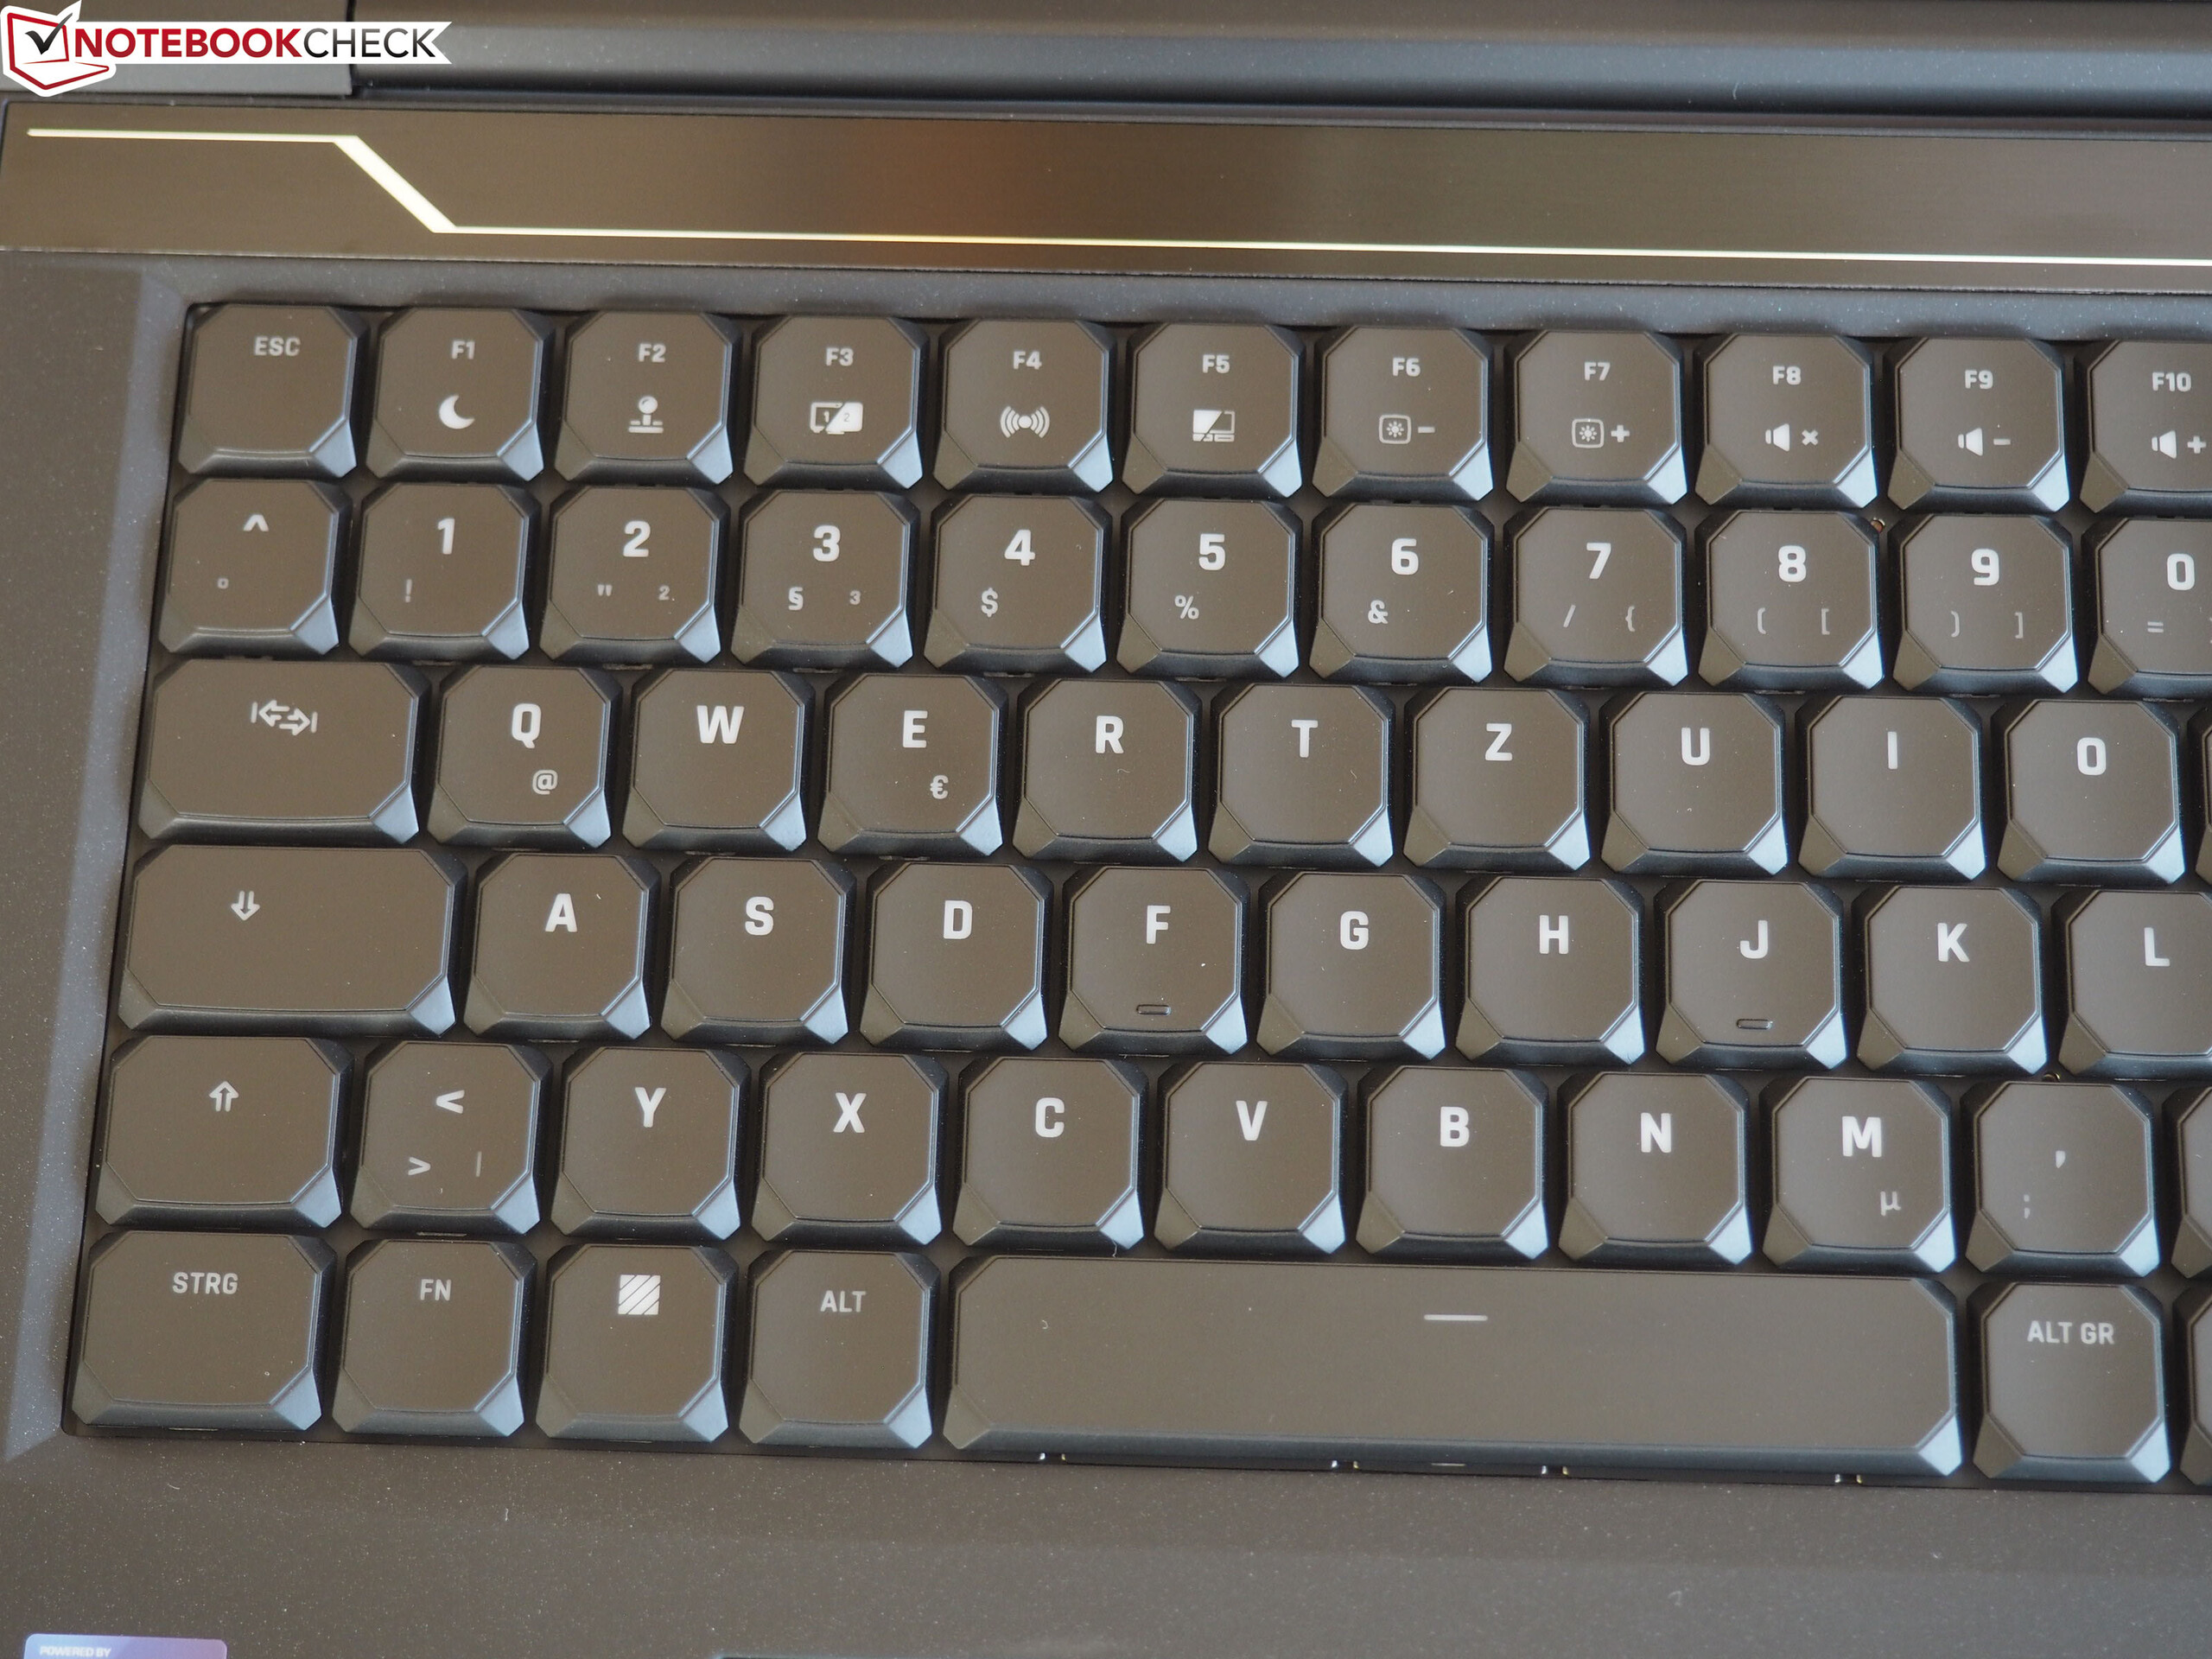
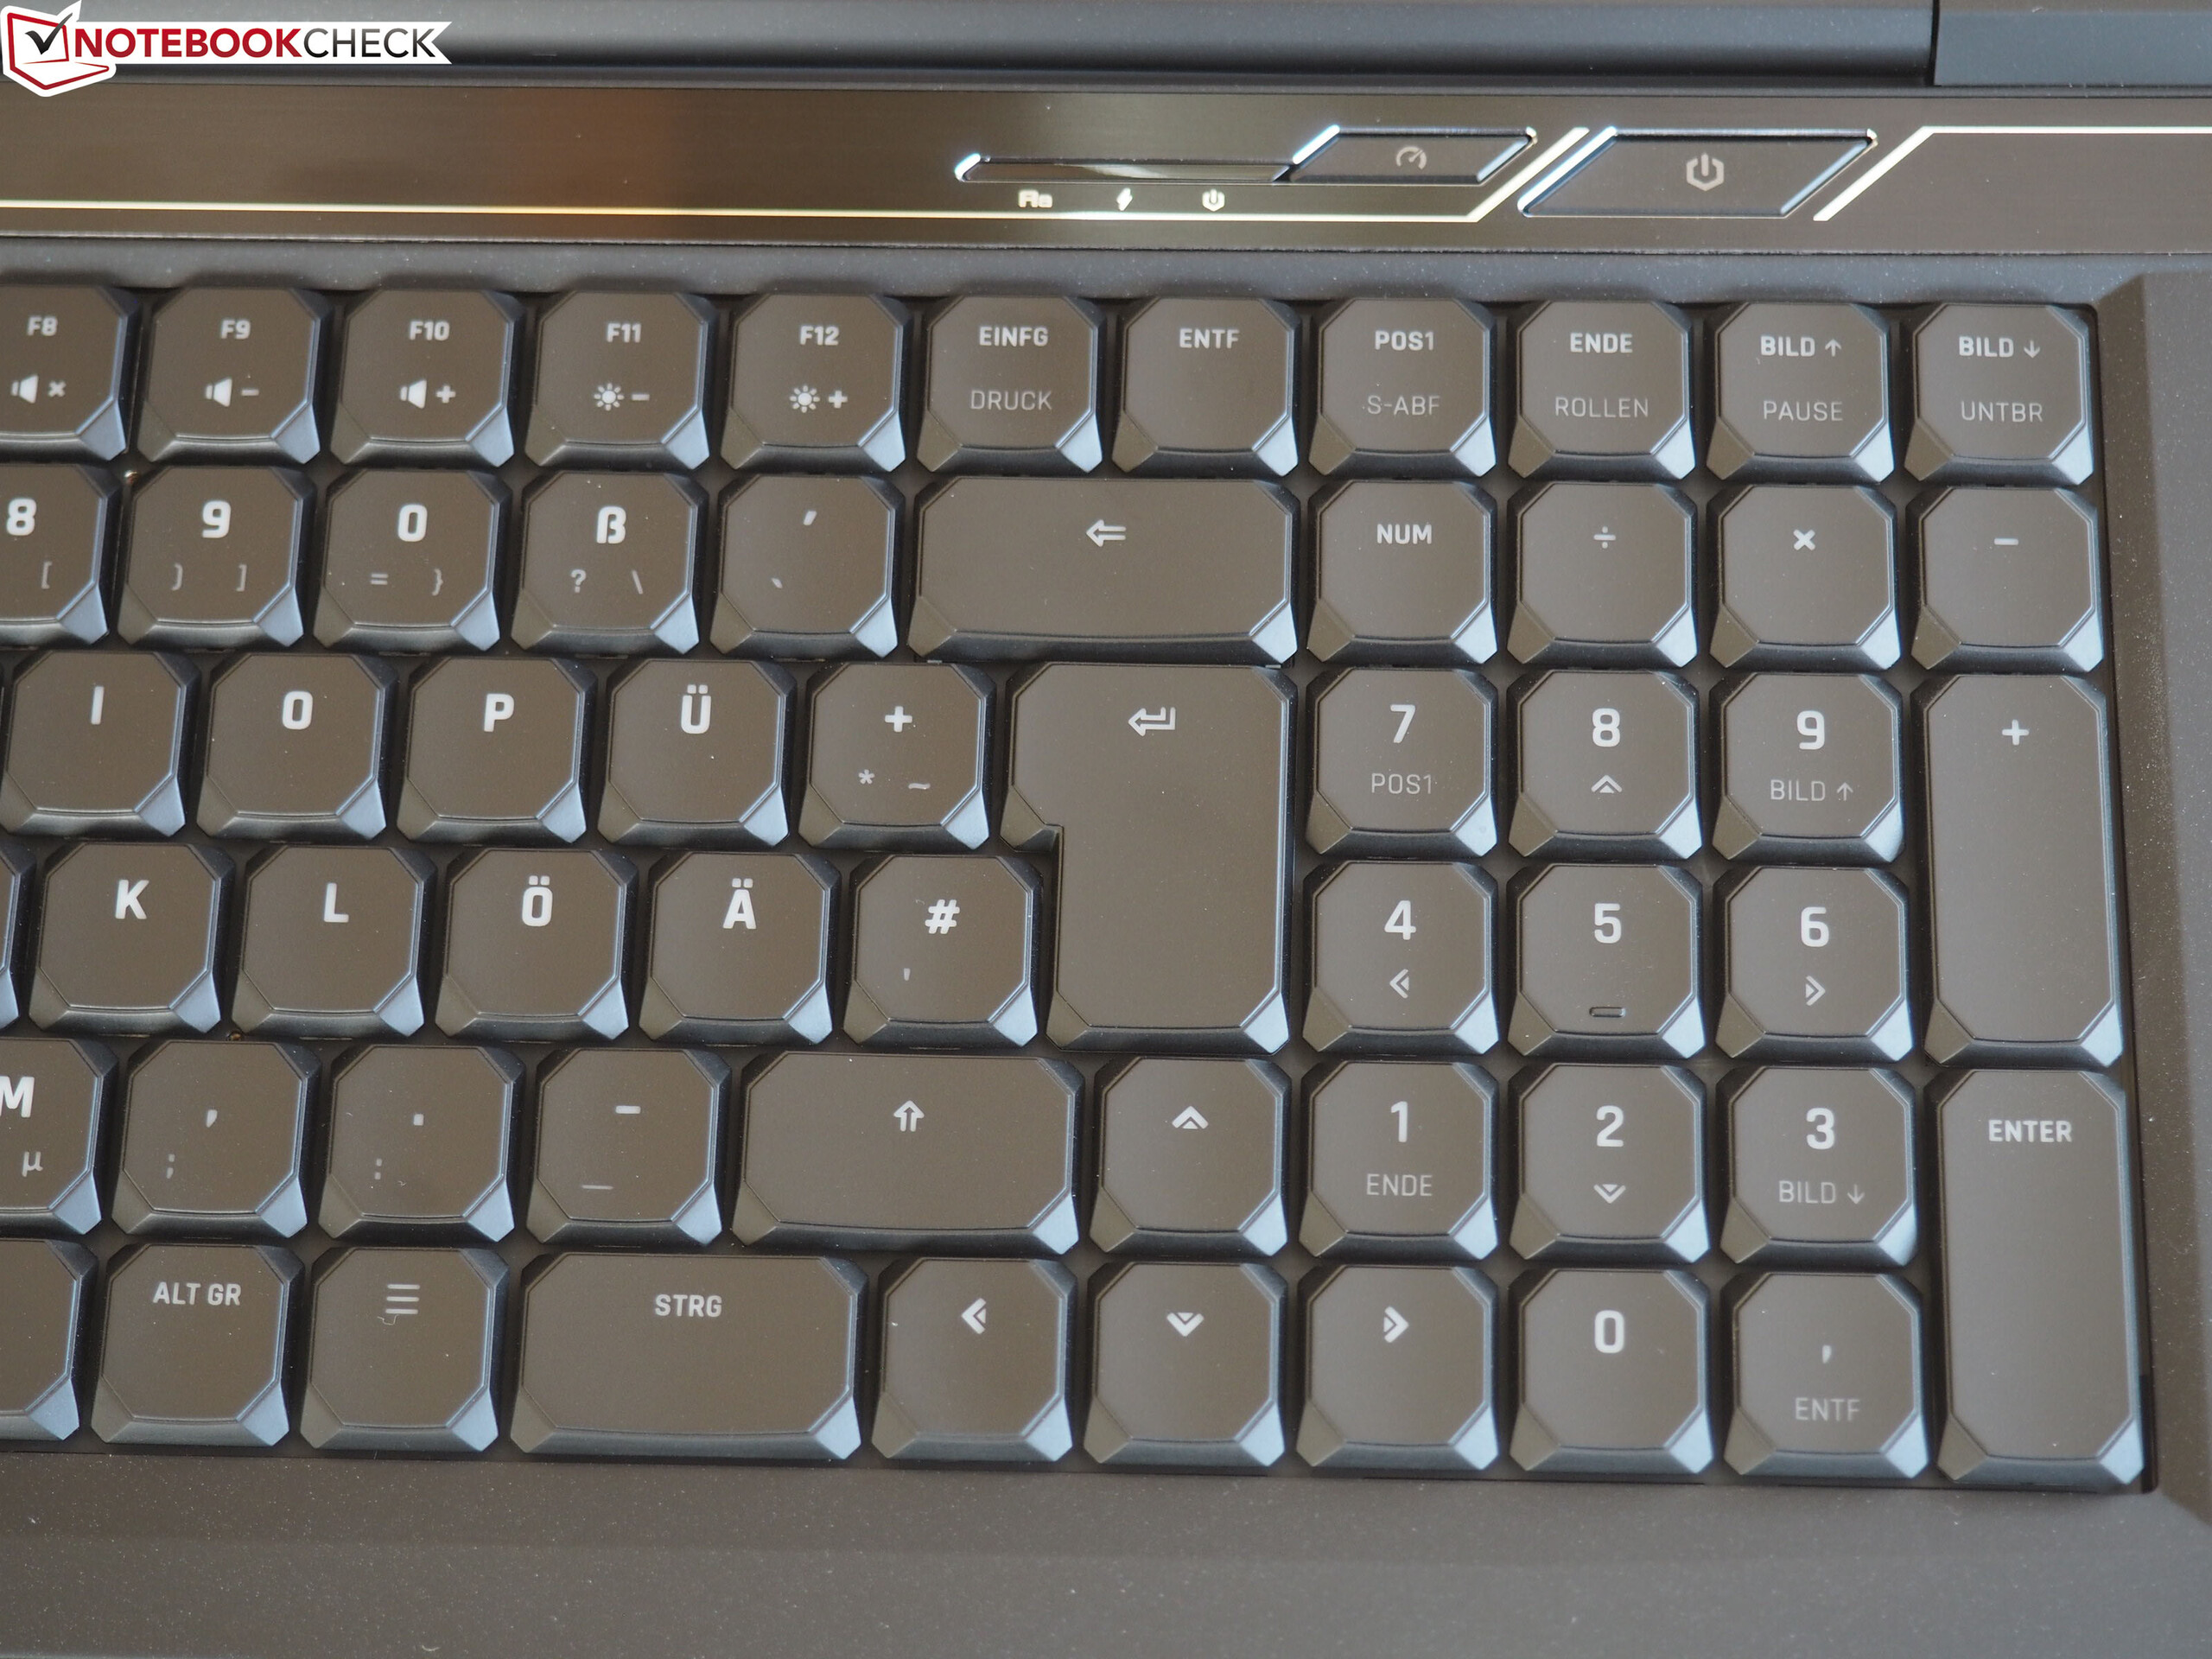
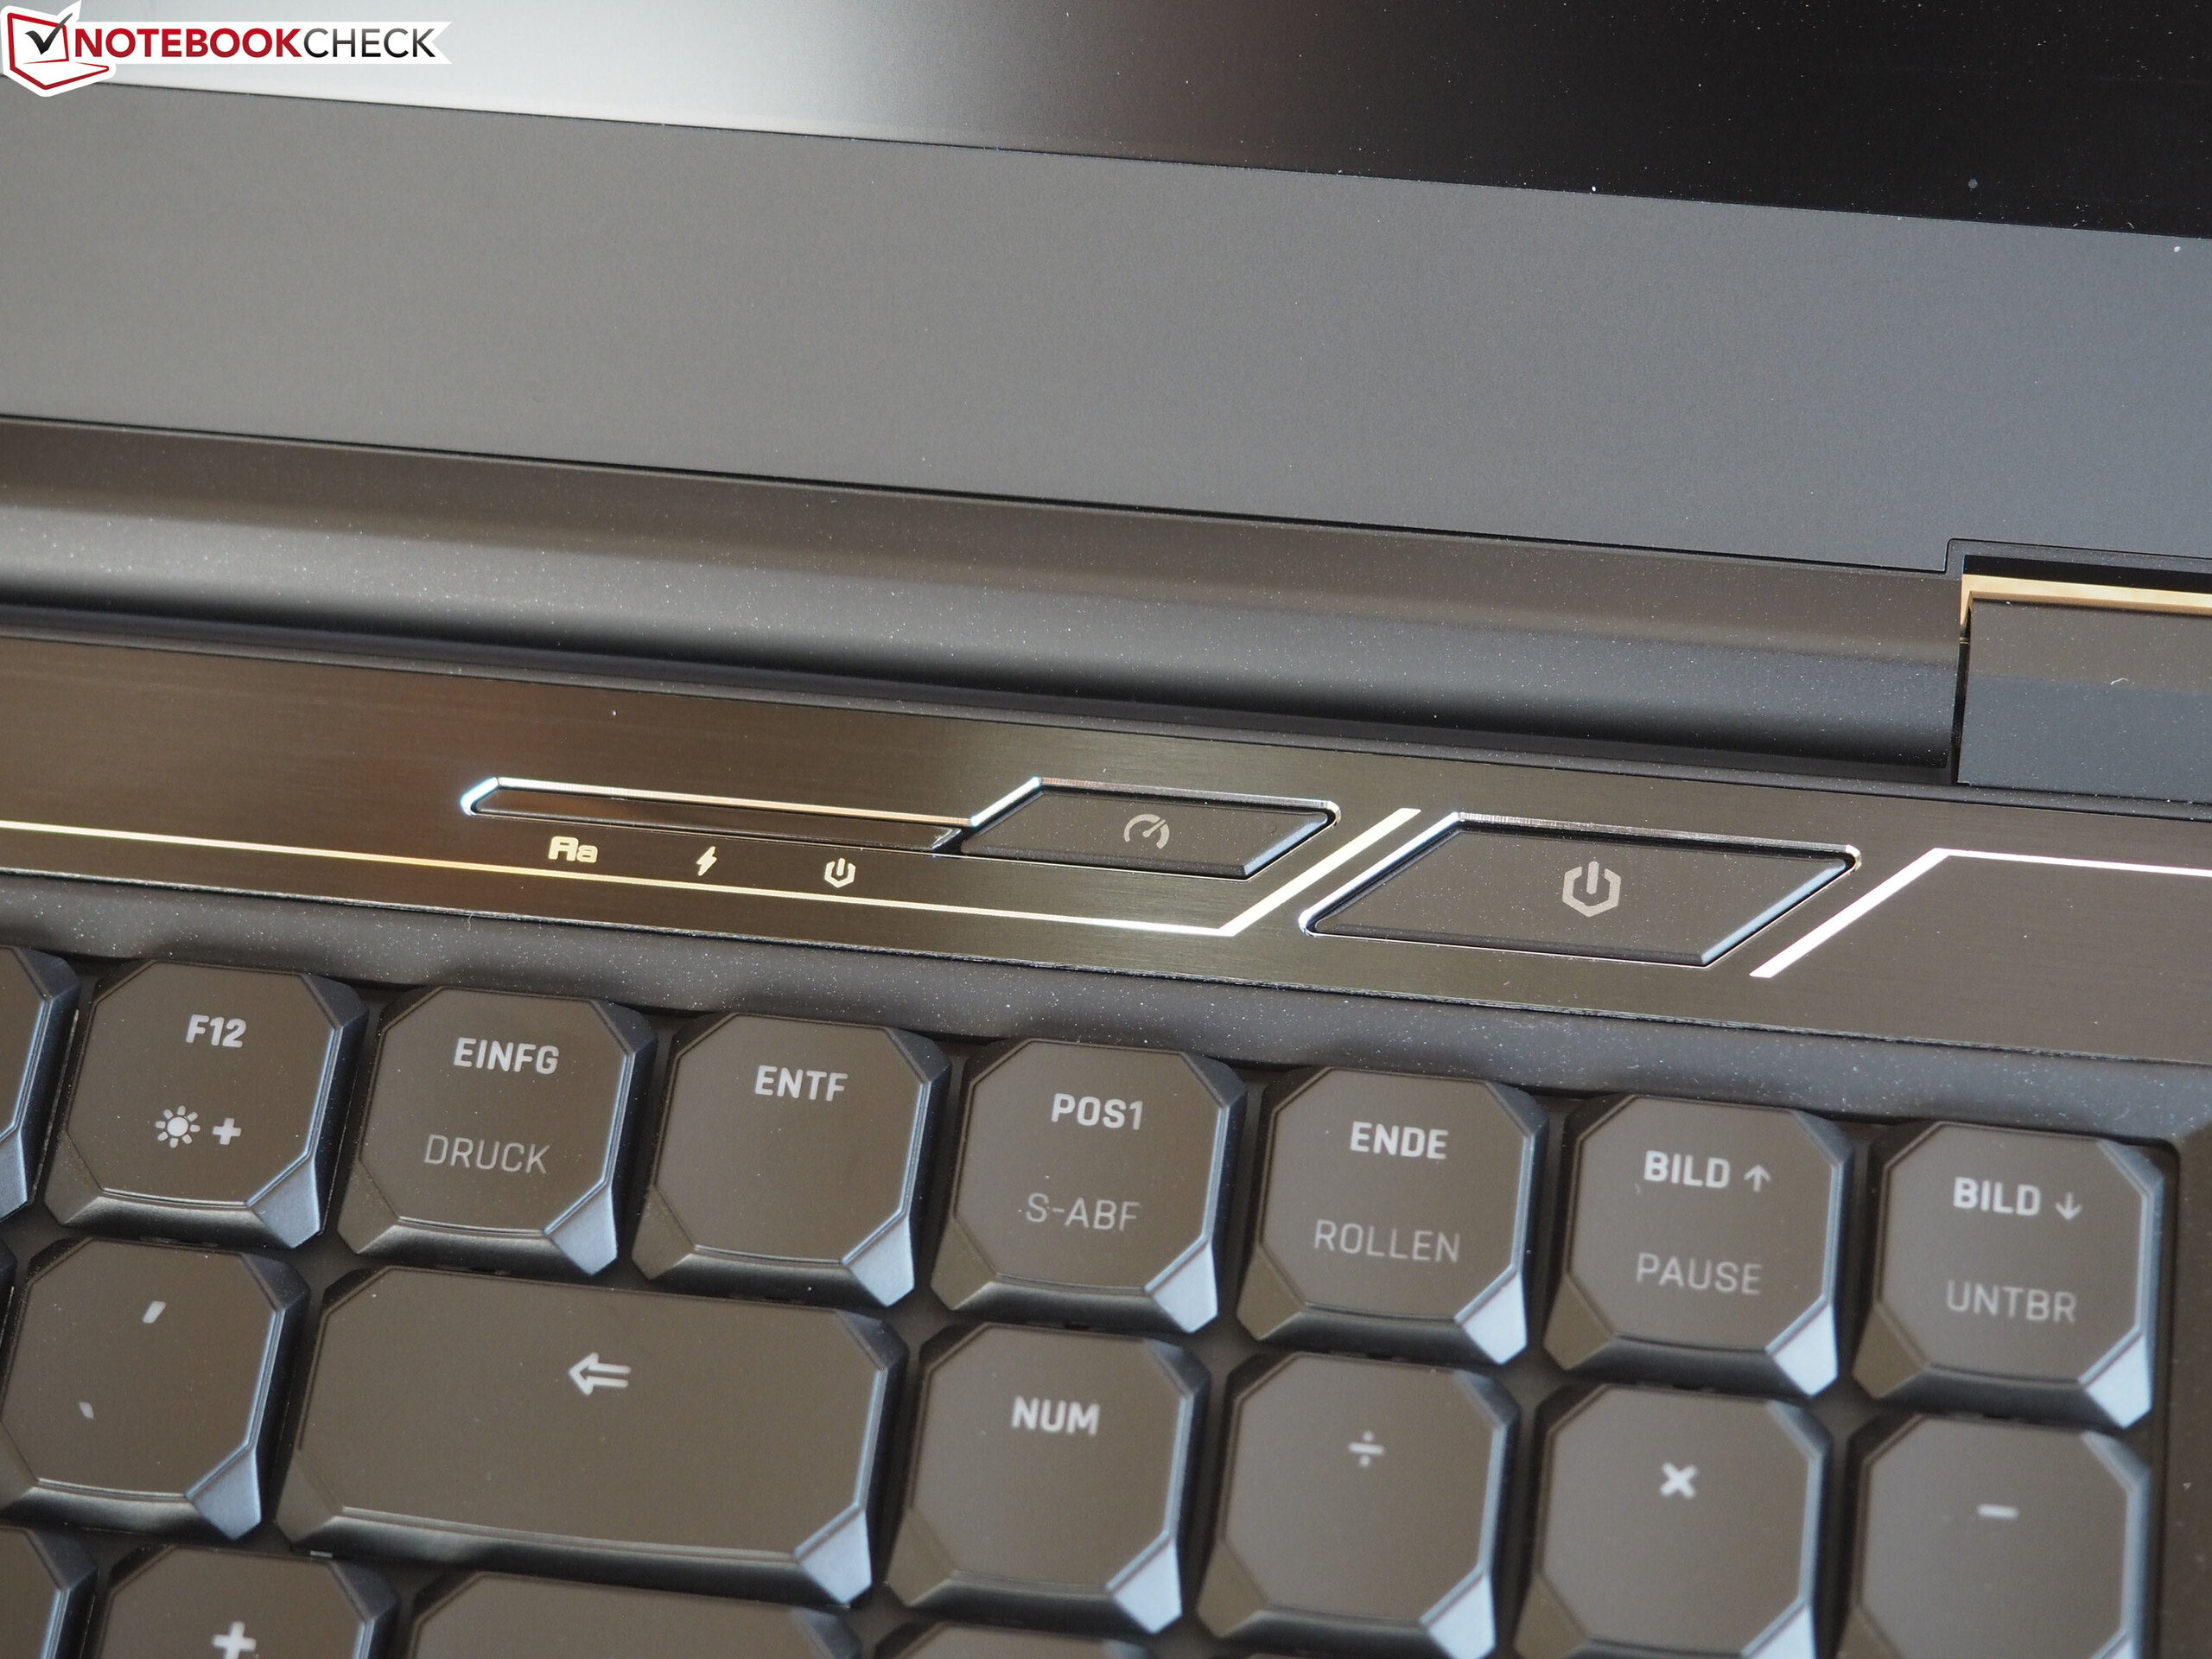
La tastiera meccanica (con illuminazione RGB) ha lasciato una buona impressione e rappresenterà un importante punto di acquisto per molti potenziali acquirenti. La connessione Thunderbolt 3 che è stata aggiunta rispetto al predecessore permette di collegare una soluzione di docking estesa o una GPU esterna.
Schenker XMG Neo 17 Comet Lake
- 11/27/2020 v7 (old)
Sascha Mölck
Price comparison
