Recensione del Laptop MSI GT76 Titan DT 10SGS: Late Game Exotic Gear

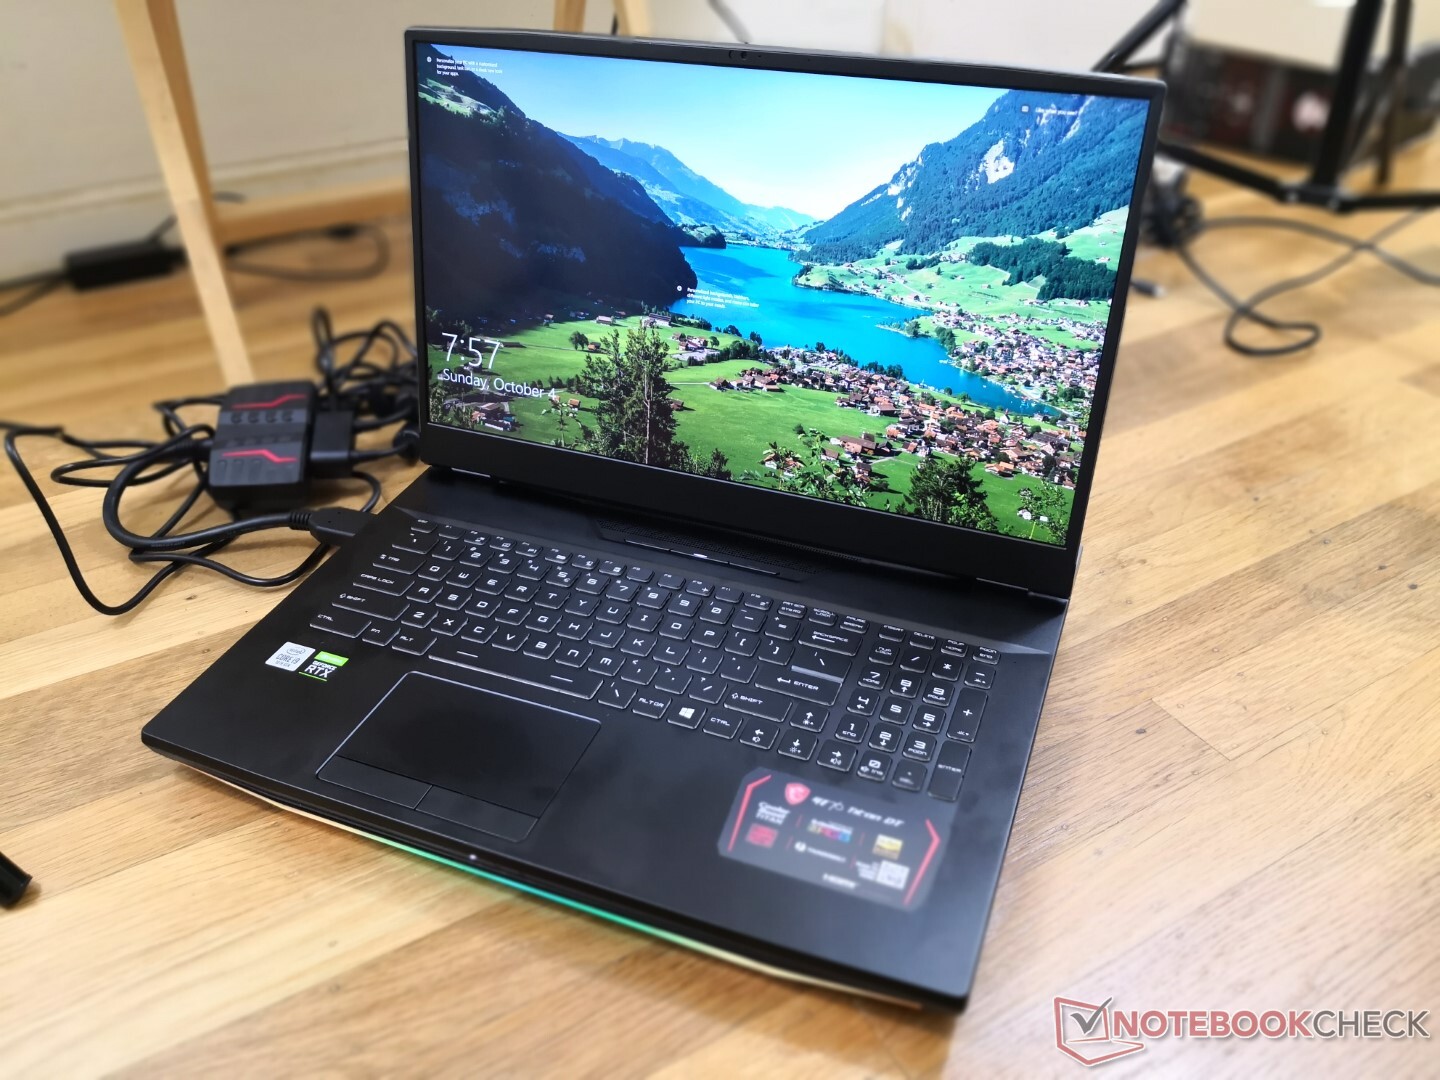
Se l'MSI GS75 fosse la vostra categoria di cacciatori furtivi e veloci, allora l'MSI GT76 sarebbe la vostra classe di carri armati ingombranti. La CPU GT76 Titan e la GPU più veloce che si possa trovare in uno chassis per laptop progettato per sostituire un PC tradizionale.
Abbiamo controllato per la prima volta il GT76 quando è stato lanciato l'anno scorso con il display Core i9-9900K della 9a generazione, GeForce RTX 2080 e FHD. Questo aggiornamento 2020 viene fornito con il 10° generazione Core i9-10900K, GeForce RTX 2080 Super e display UHD a 120 Hz 4K. Le caratteristiche fisiche rimangono identiche e quindi la maggior parte dei nostri commenti precedenti su telaio, tastiera, altoparlanti e interni valgono anche qui.
I concorrenti diretti del GT76 includono altri DTR da 17,3 pollici come Dell Alienware Area-51m, Asus ROG G703 Chimera, Eurocom Sky X7C, o Schenker XMG Ultra 17.
Altre recensioni MSI:
Punteggio | Data | Modello | Peso | Altezza | Dimensione | Risoluzione | Prezzo |
|---|---|---|---|---|---|---|---|
| 87.4 % v7 (old) | 10/2020 | MSI GT76 Titan DT 10SGS i9-10900K, GeForce RTX 2080 Super Mobile | 4.2 kg | 42 mm | 17.30" | 3840x2160 | |
| 85.8 % v7 (old) | 10/2019 | Asus ROG G703GXR i7-9750H, GeForce RTX 2080 Mobile | 4.7 kg | 48 mm | 17.30" | 1920x1080 | |
| 85.8 % v7 (old) | 03/2019 | Alienware Area-51m i9-9900K RTX 2080 i9-9900K, GeForce RTX 2080 Mobile | 3.9 kg | 42 mm | 17.30" | 1920x1080 | |
| 82.7 % v7 (old) | 07/2020 | Asus Strix Scar 17 G732LXS i9-10980HK, GeForce RTX 2080 Super Mobile | 2.9 kg | 26.5 mm | 17.30" | 1920x1080 | |
| 83.2 % v7 (old) | 02/2020 | Schenker XMG Pro 17 PB71RD-G i7-9750H, GeForce RTX 2060 Mobile | 2.8 kg | 30 mm | 17.30" | 1920x1080 |
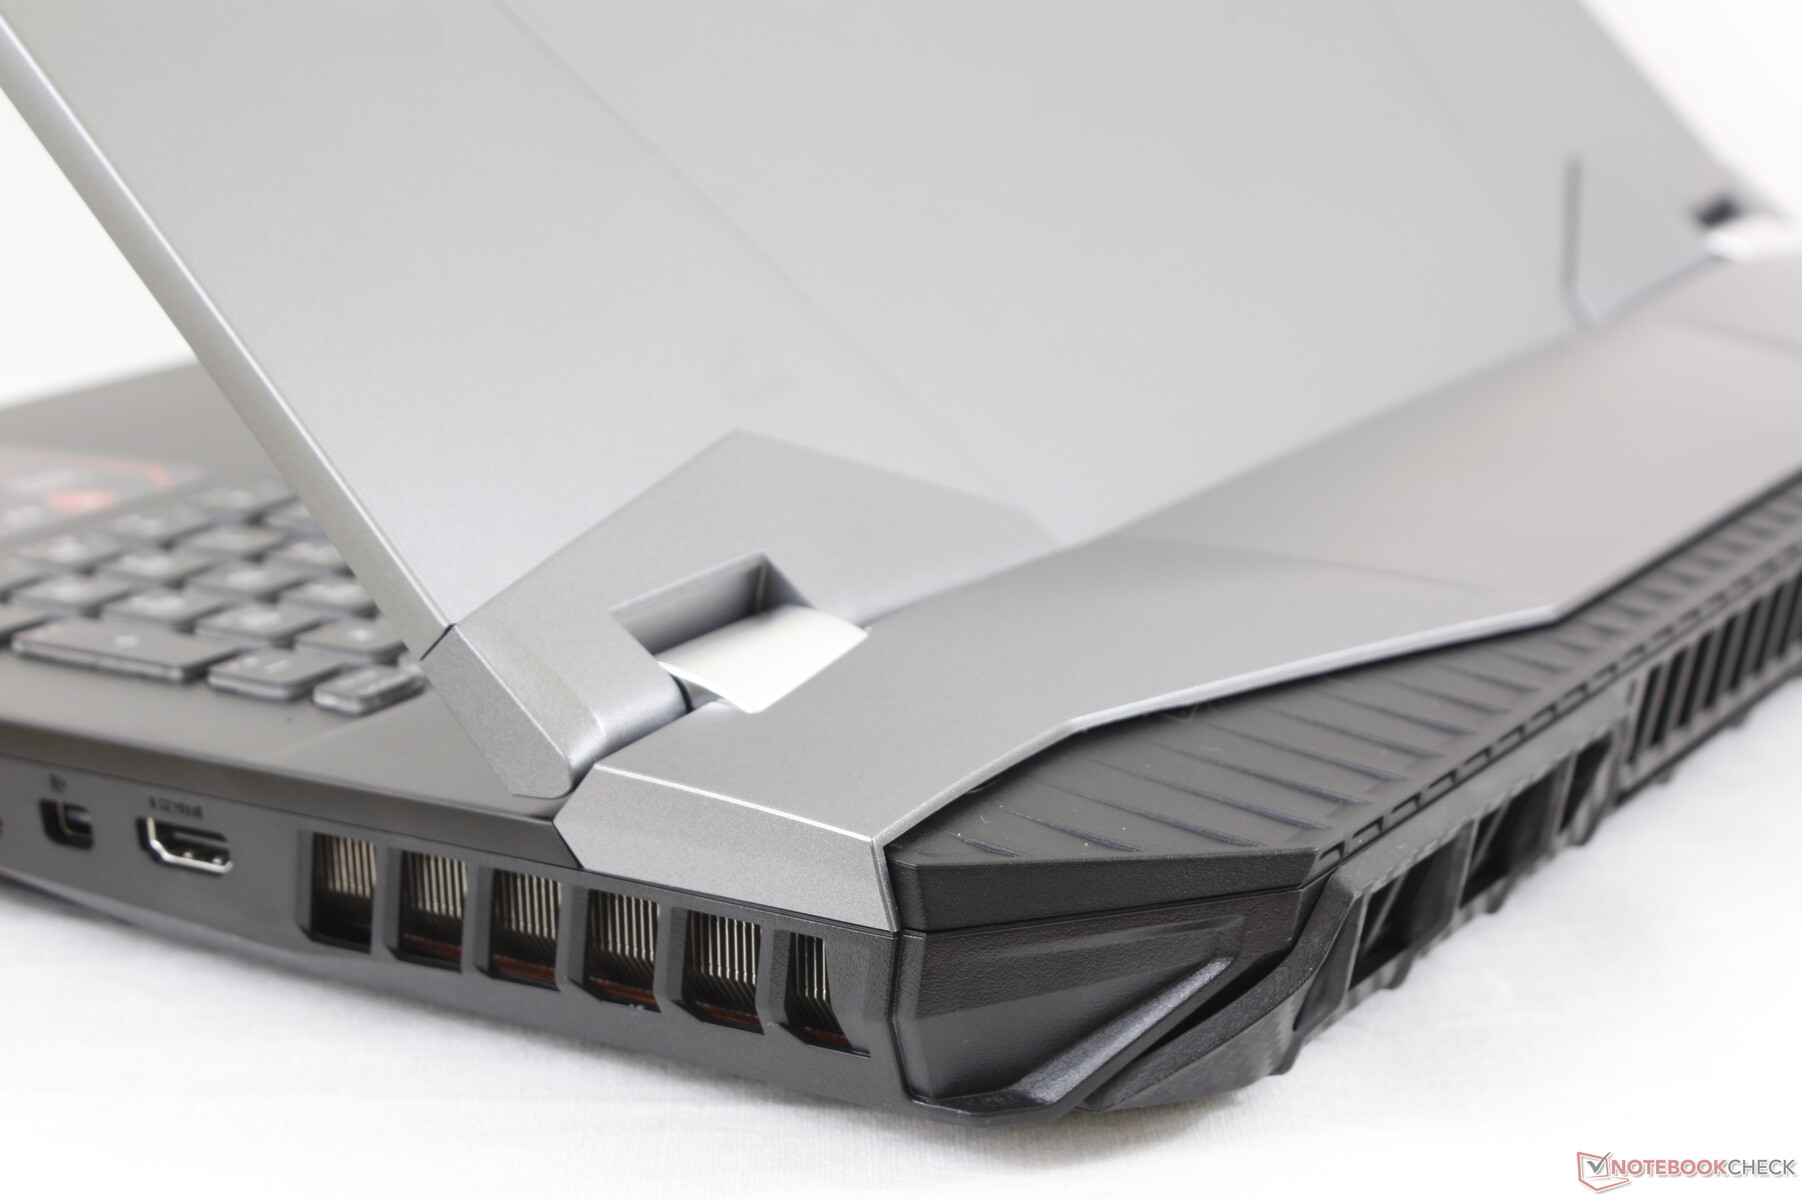
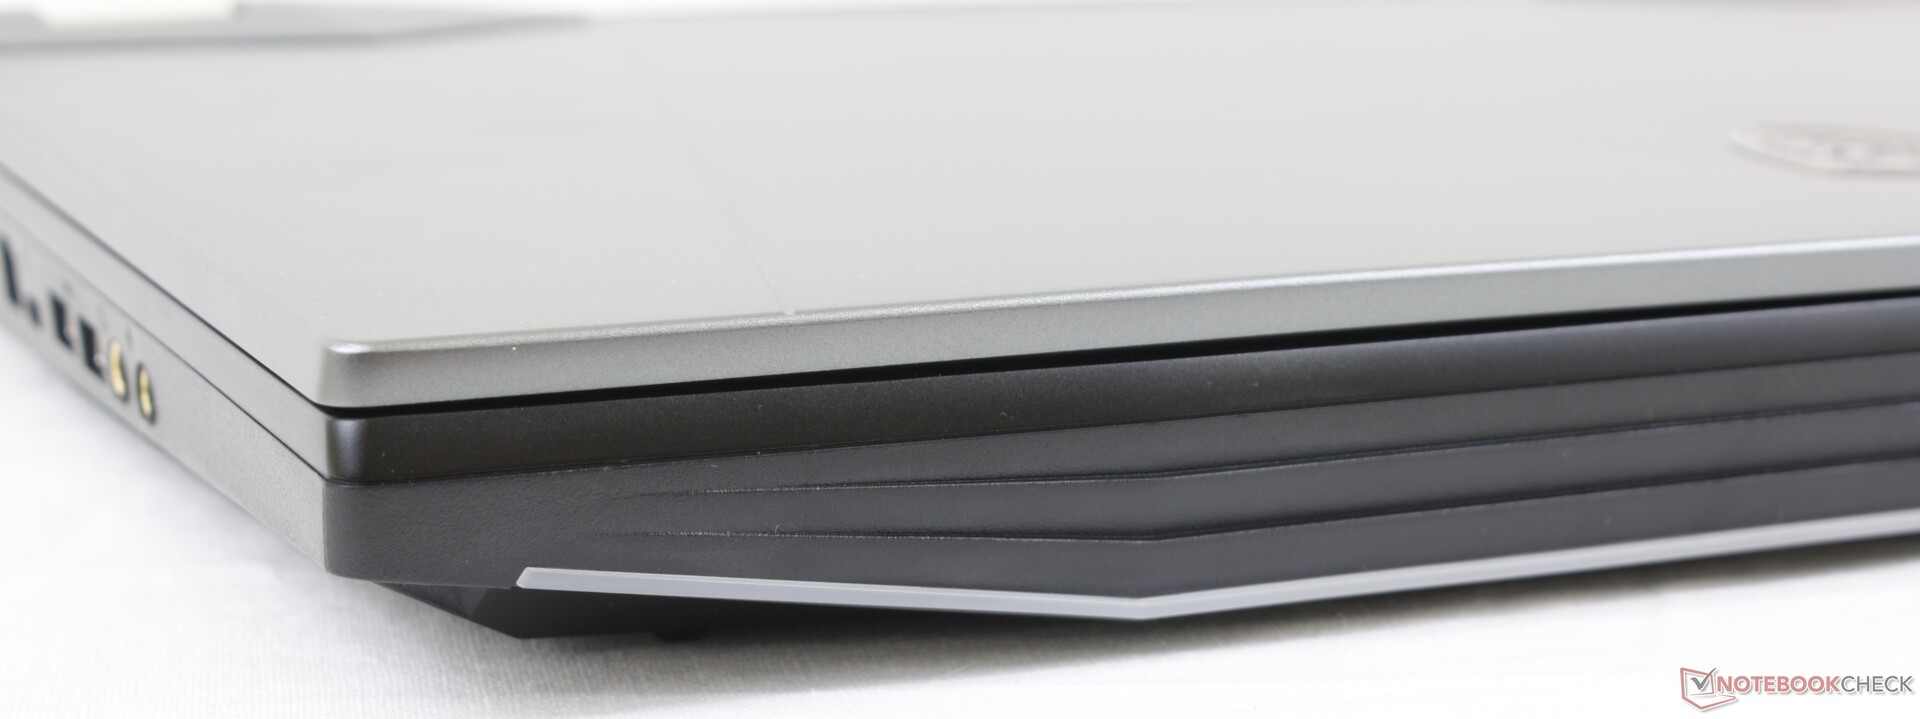
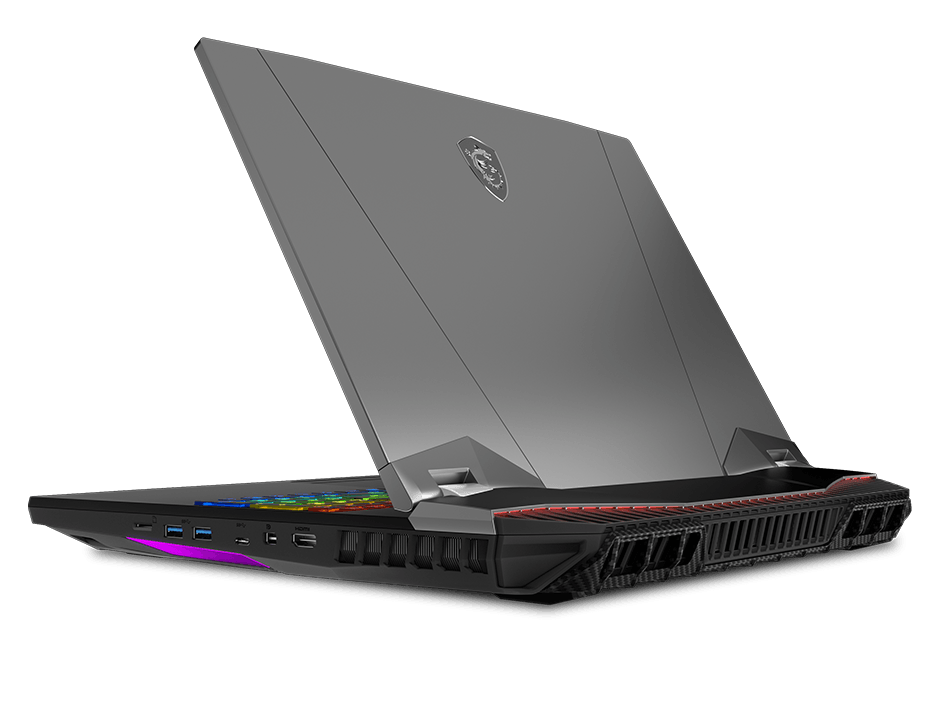
Case
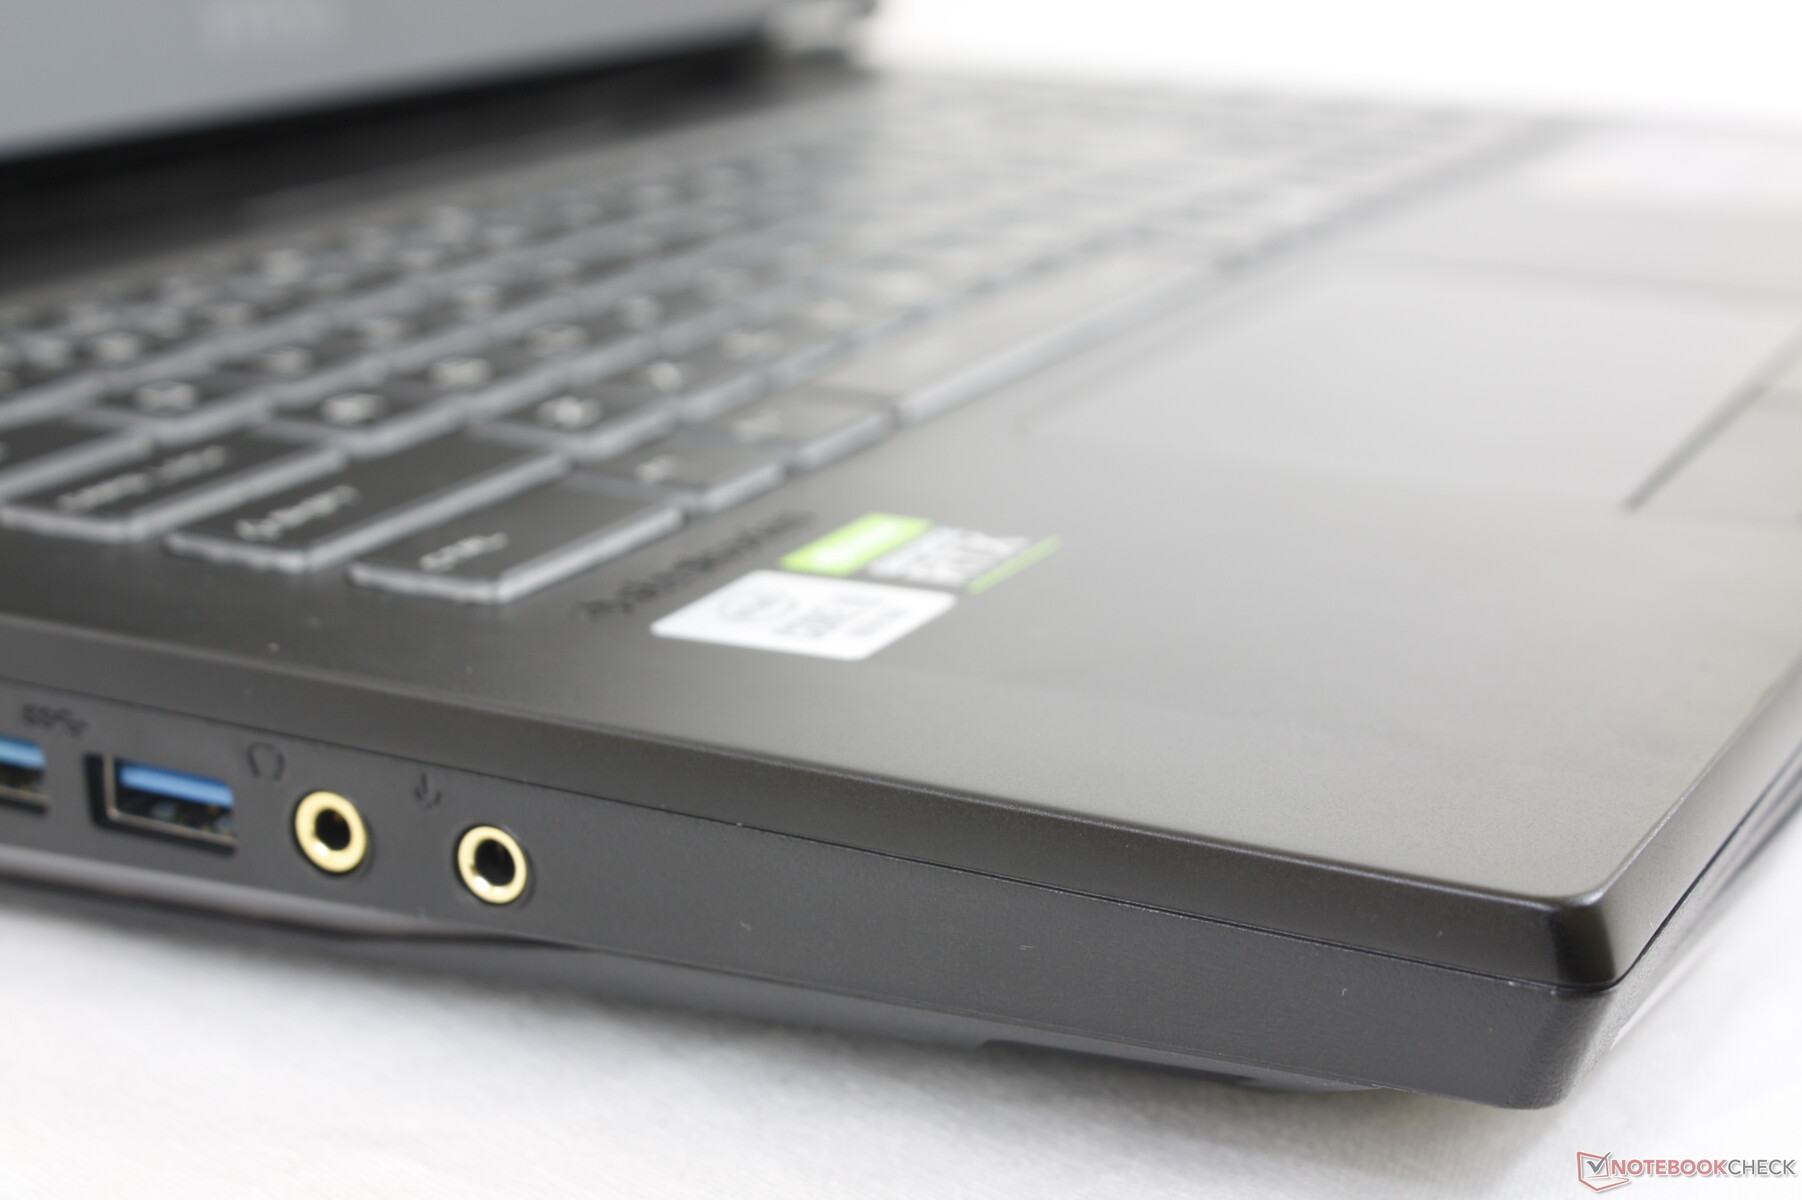
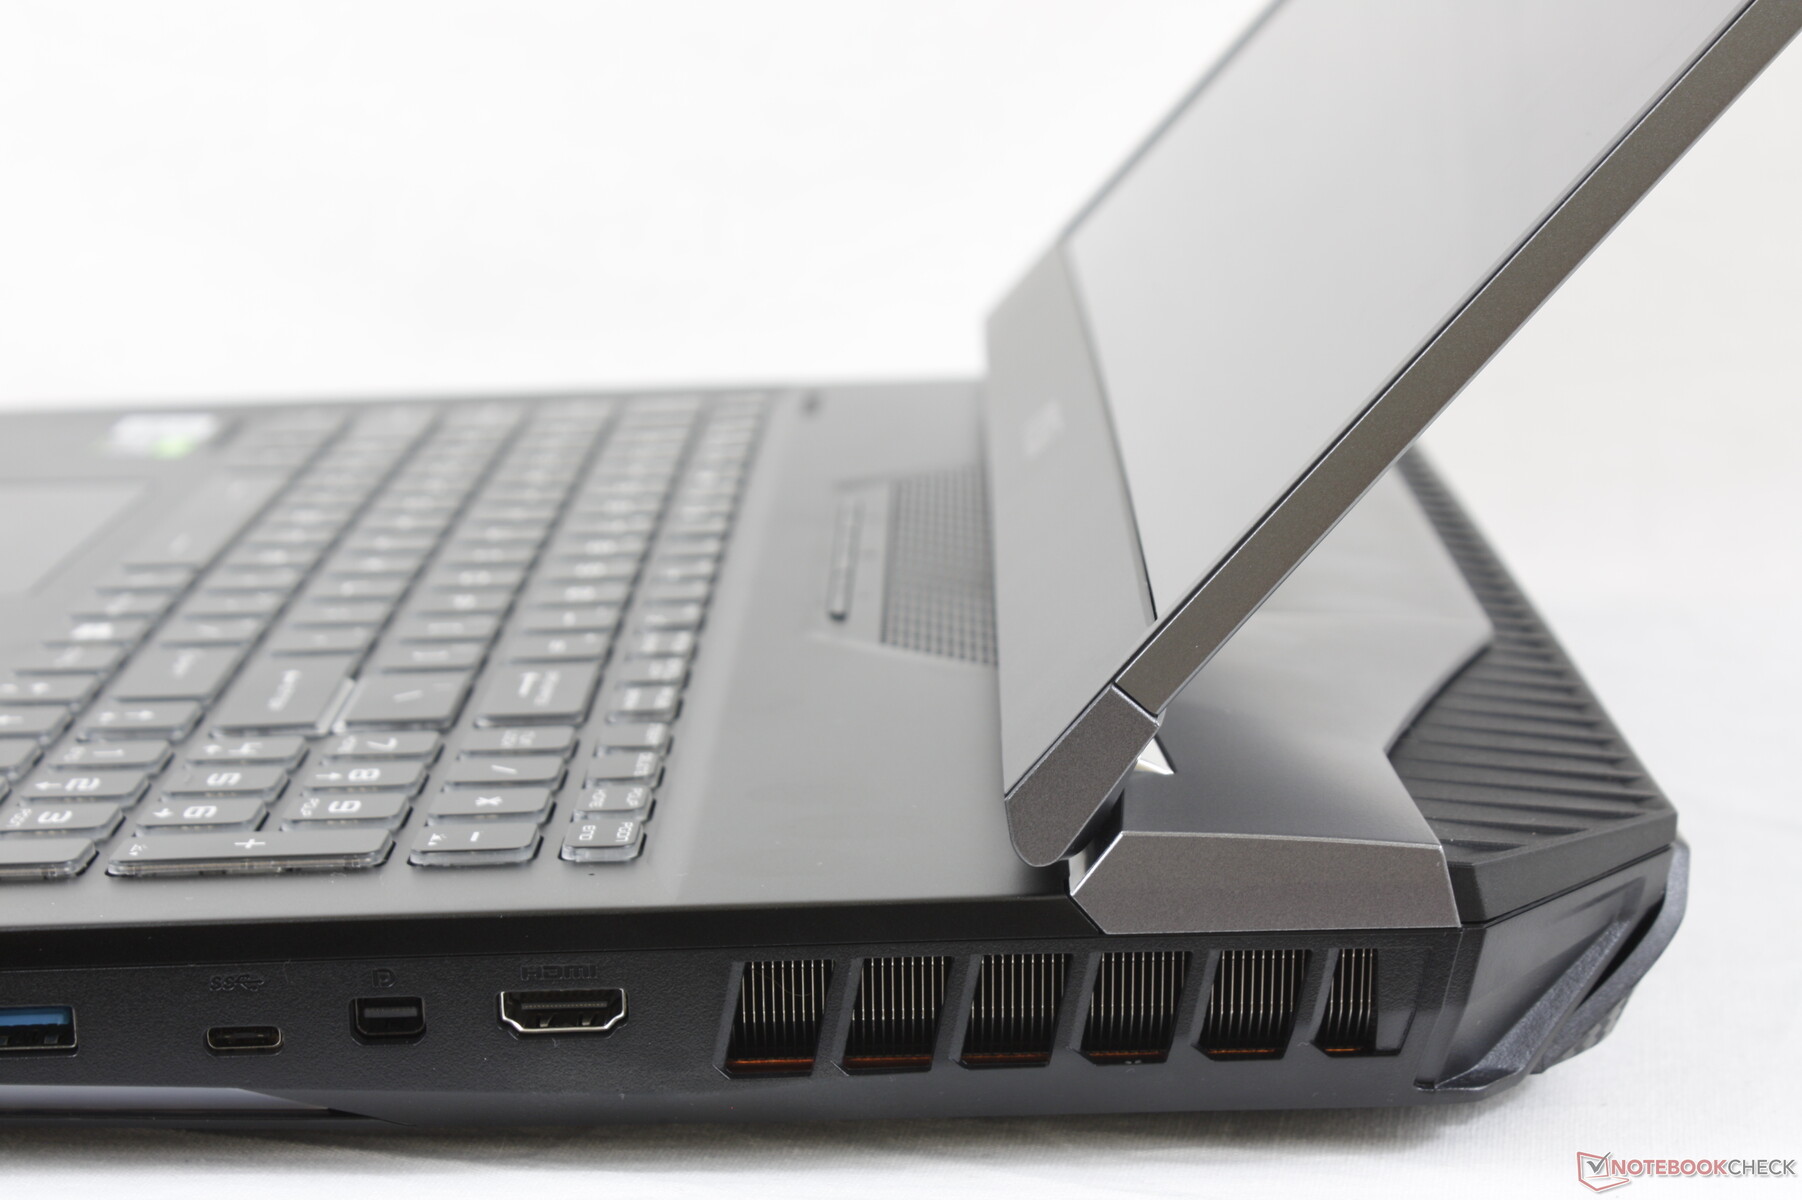
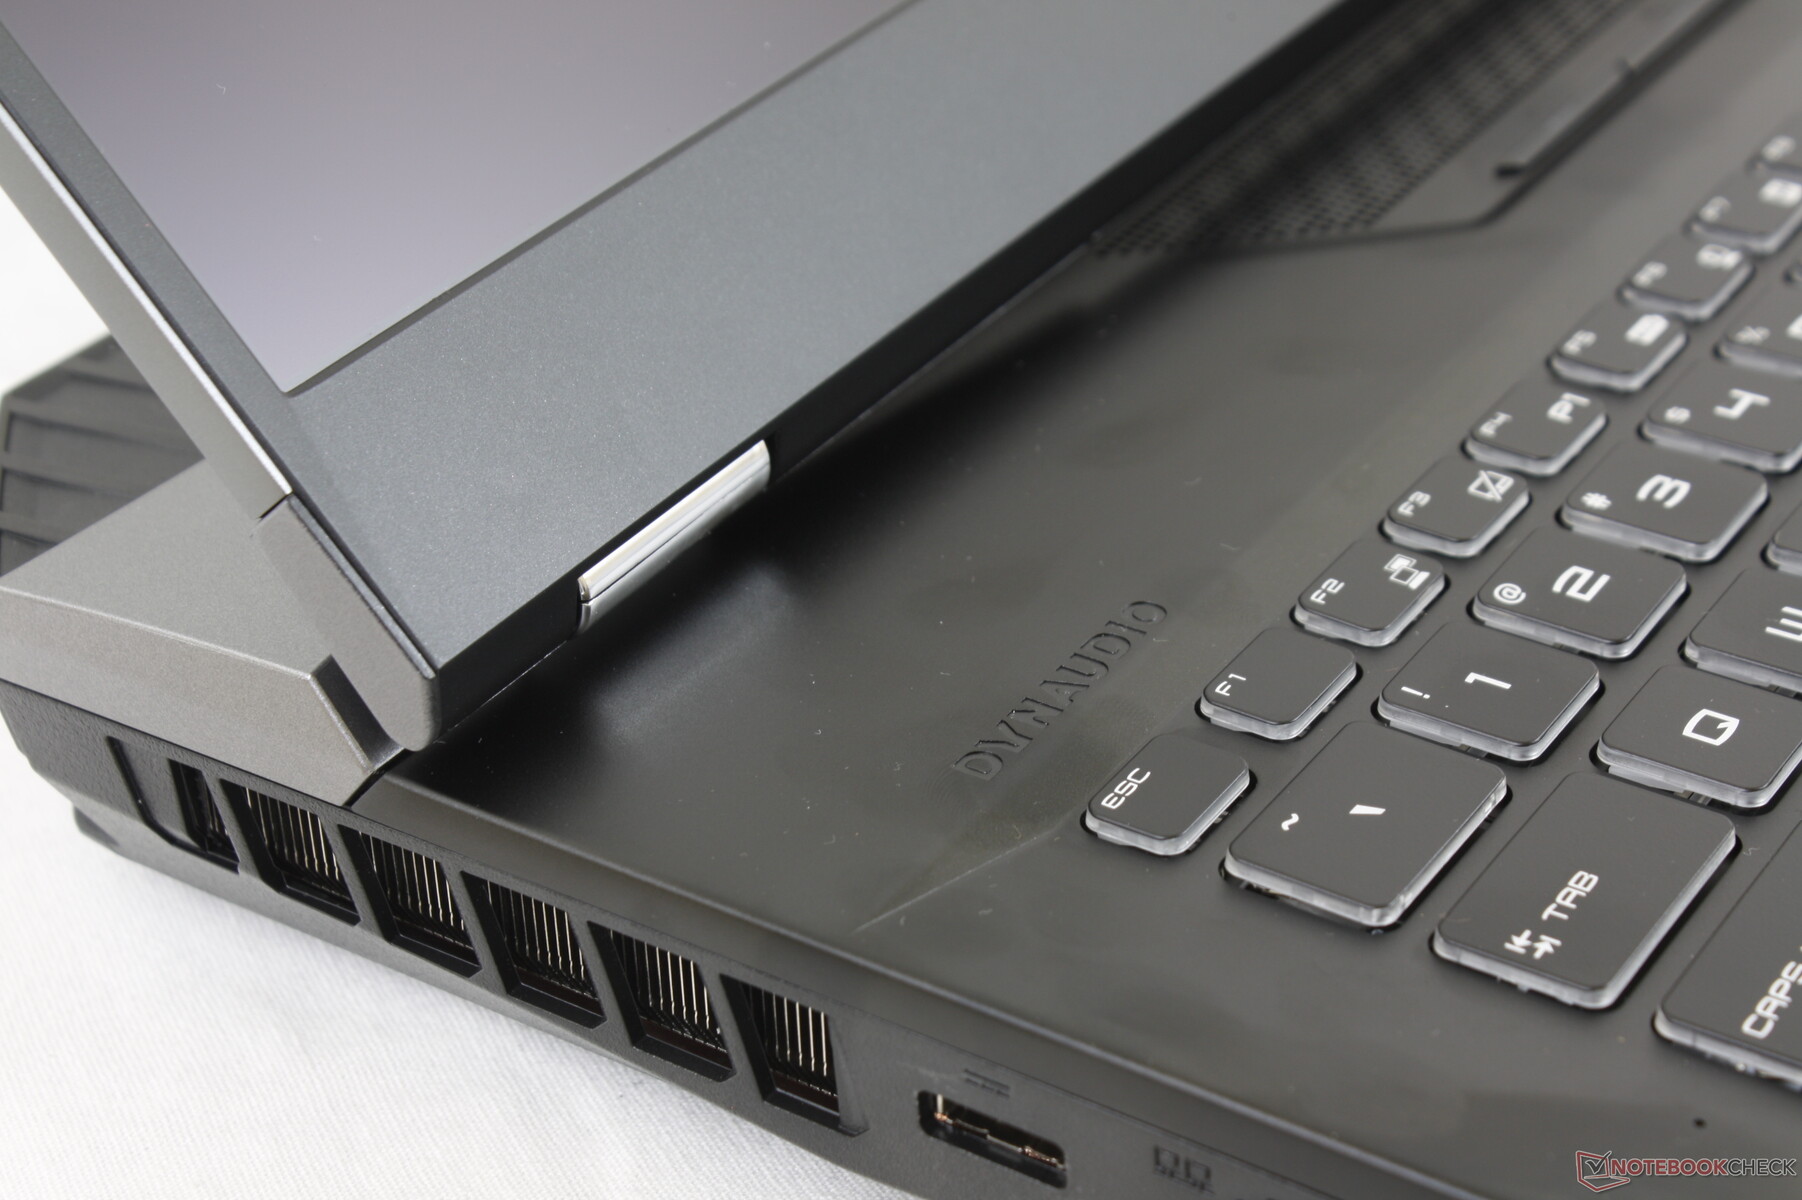
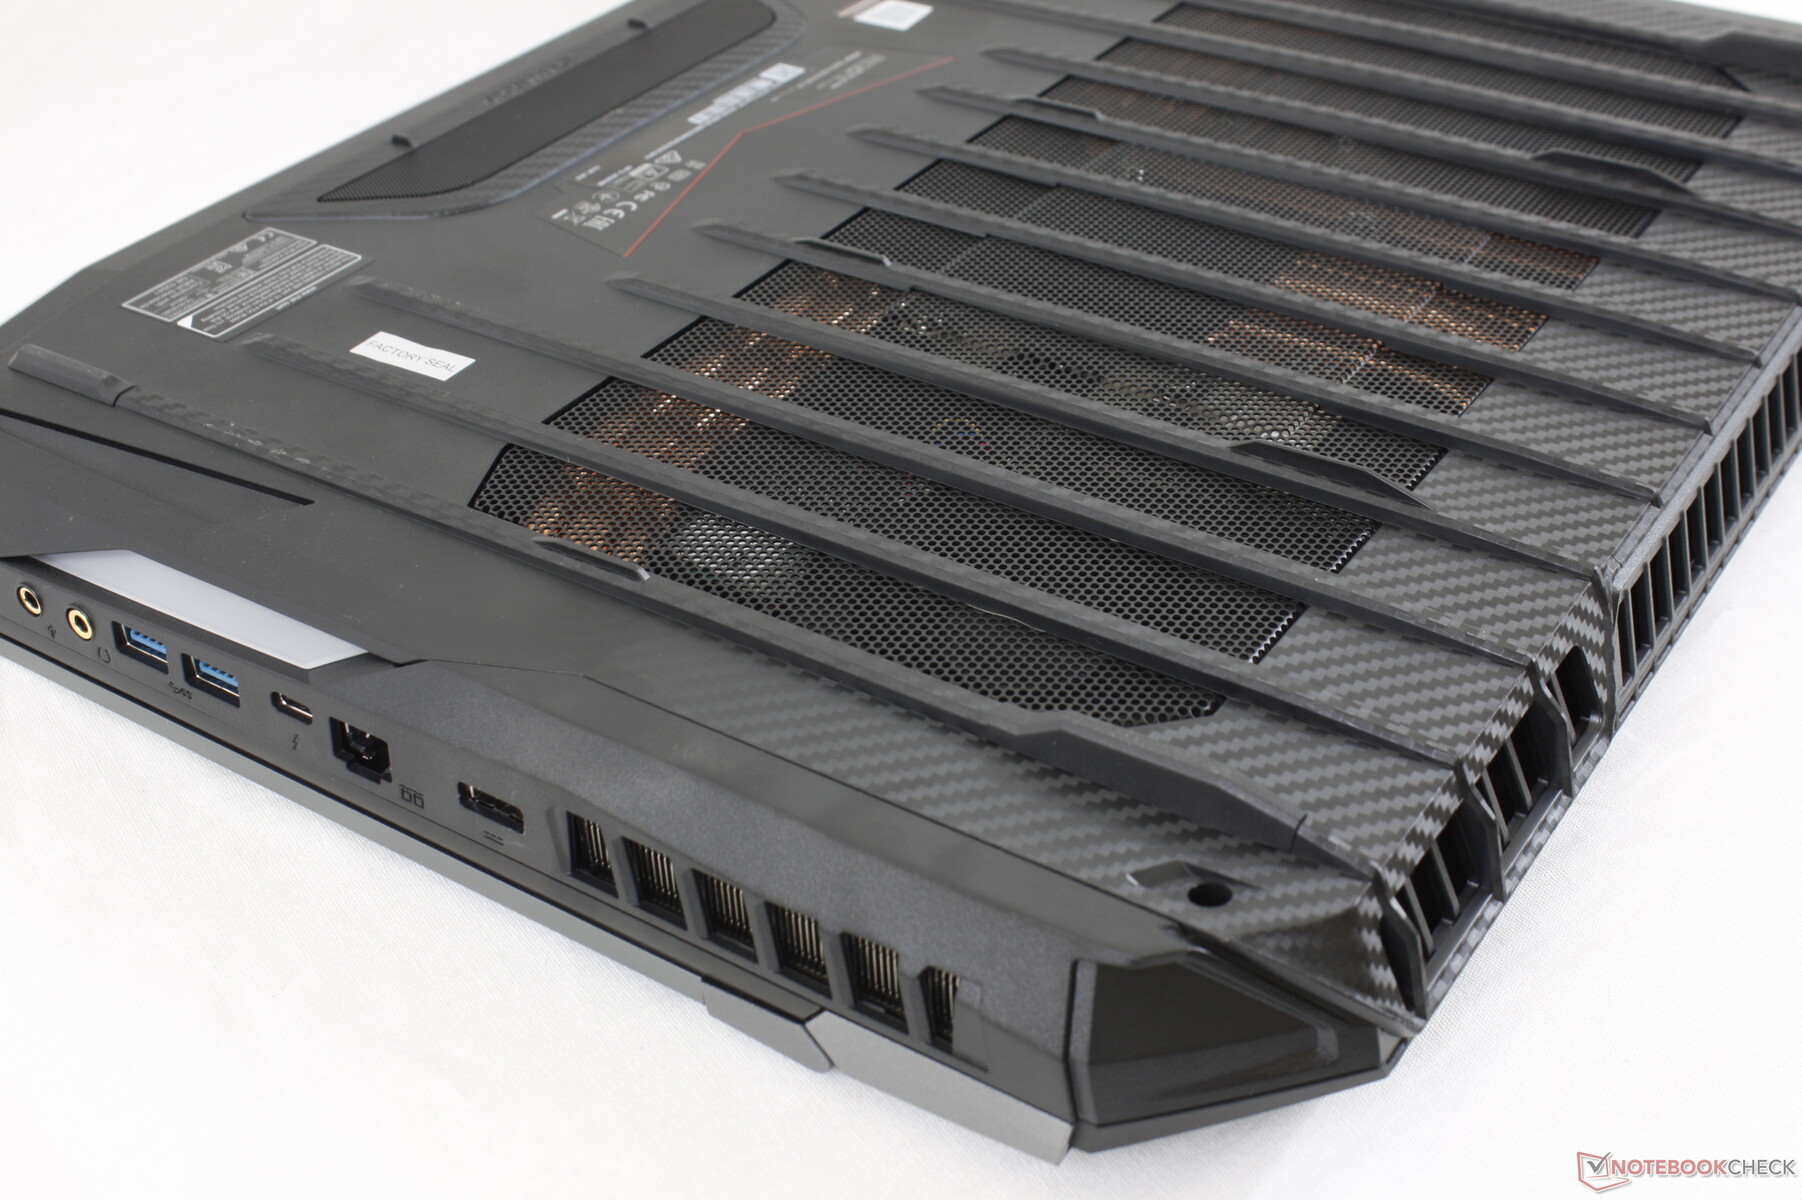
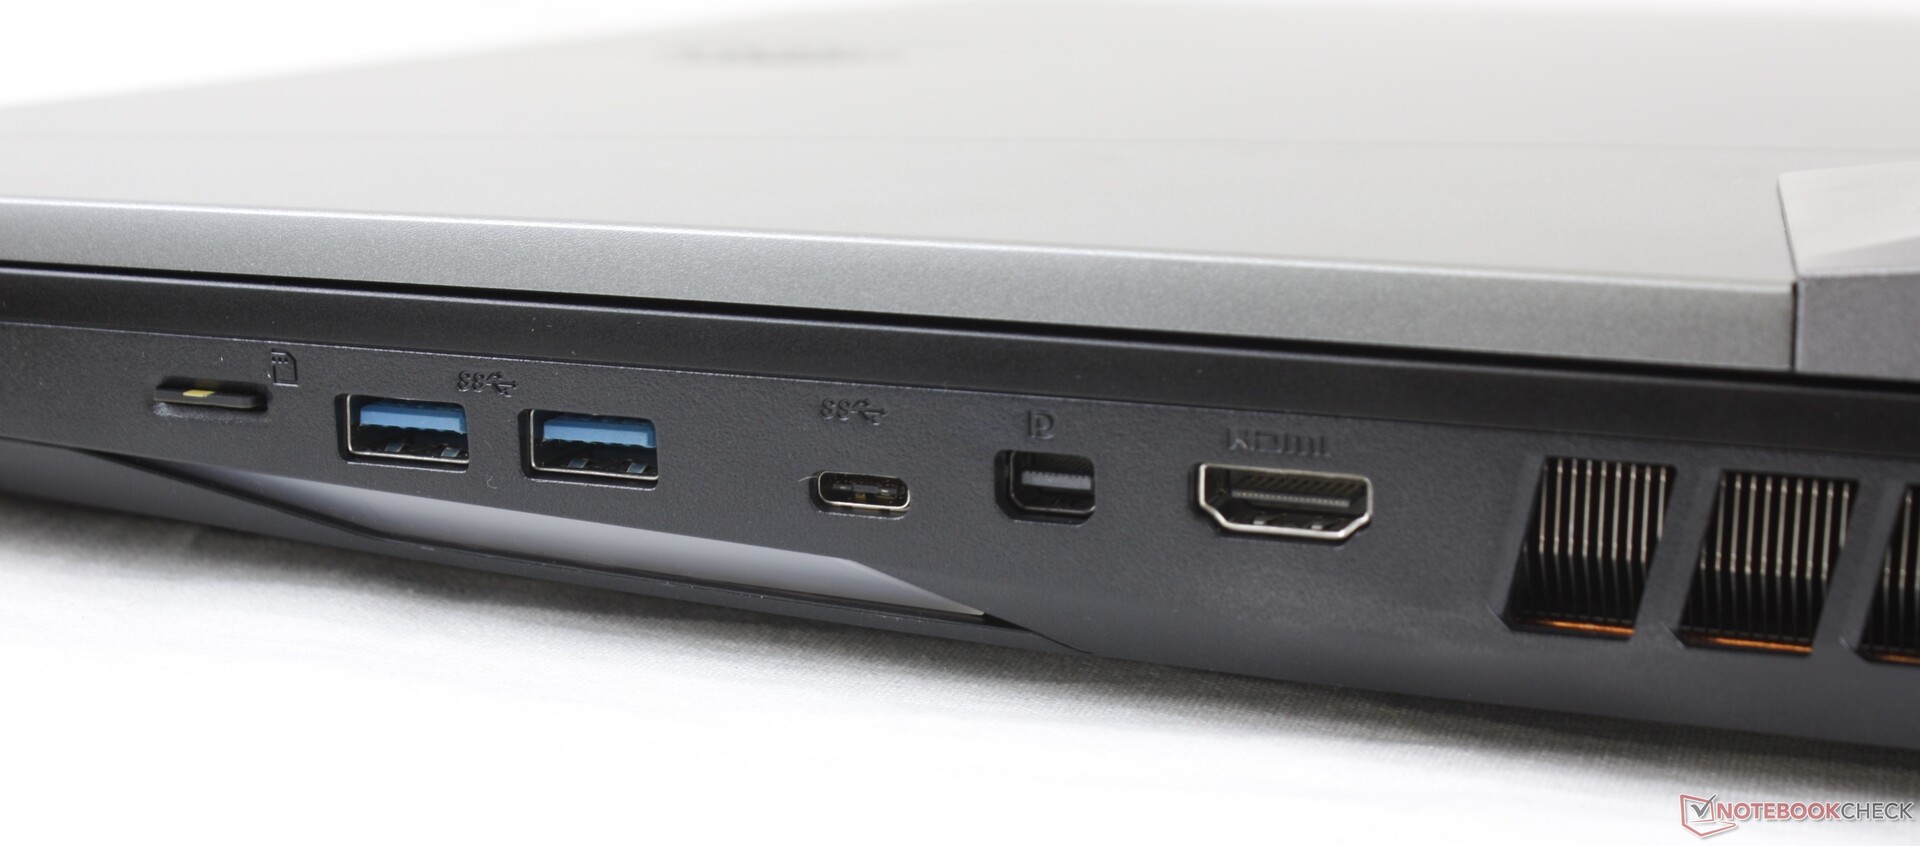
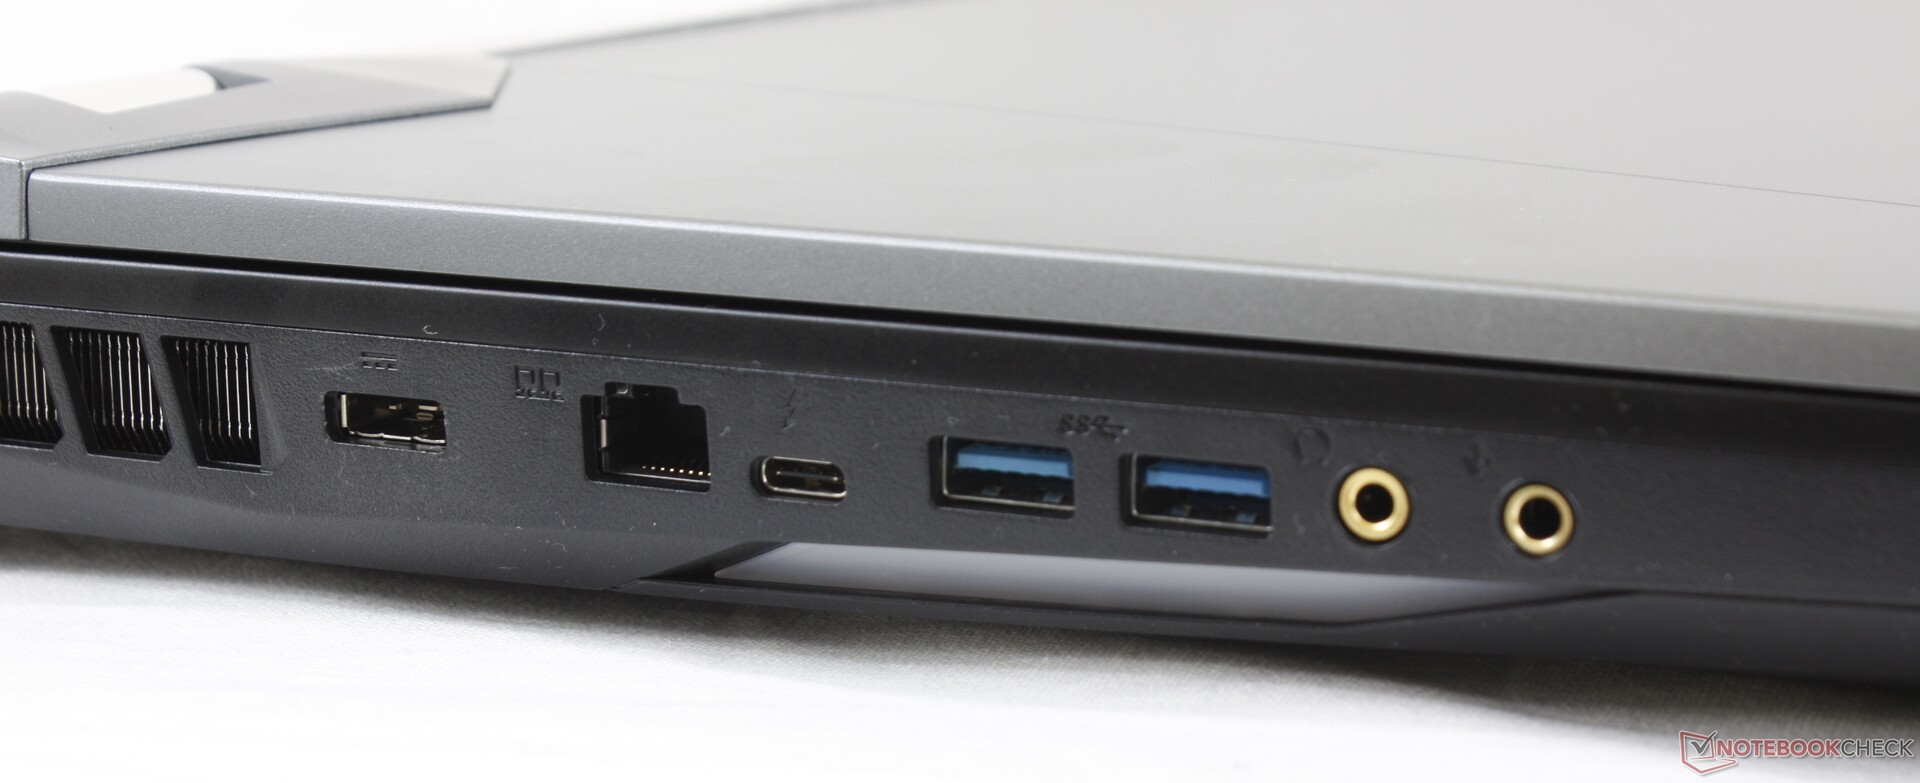
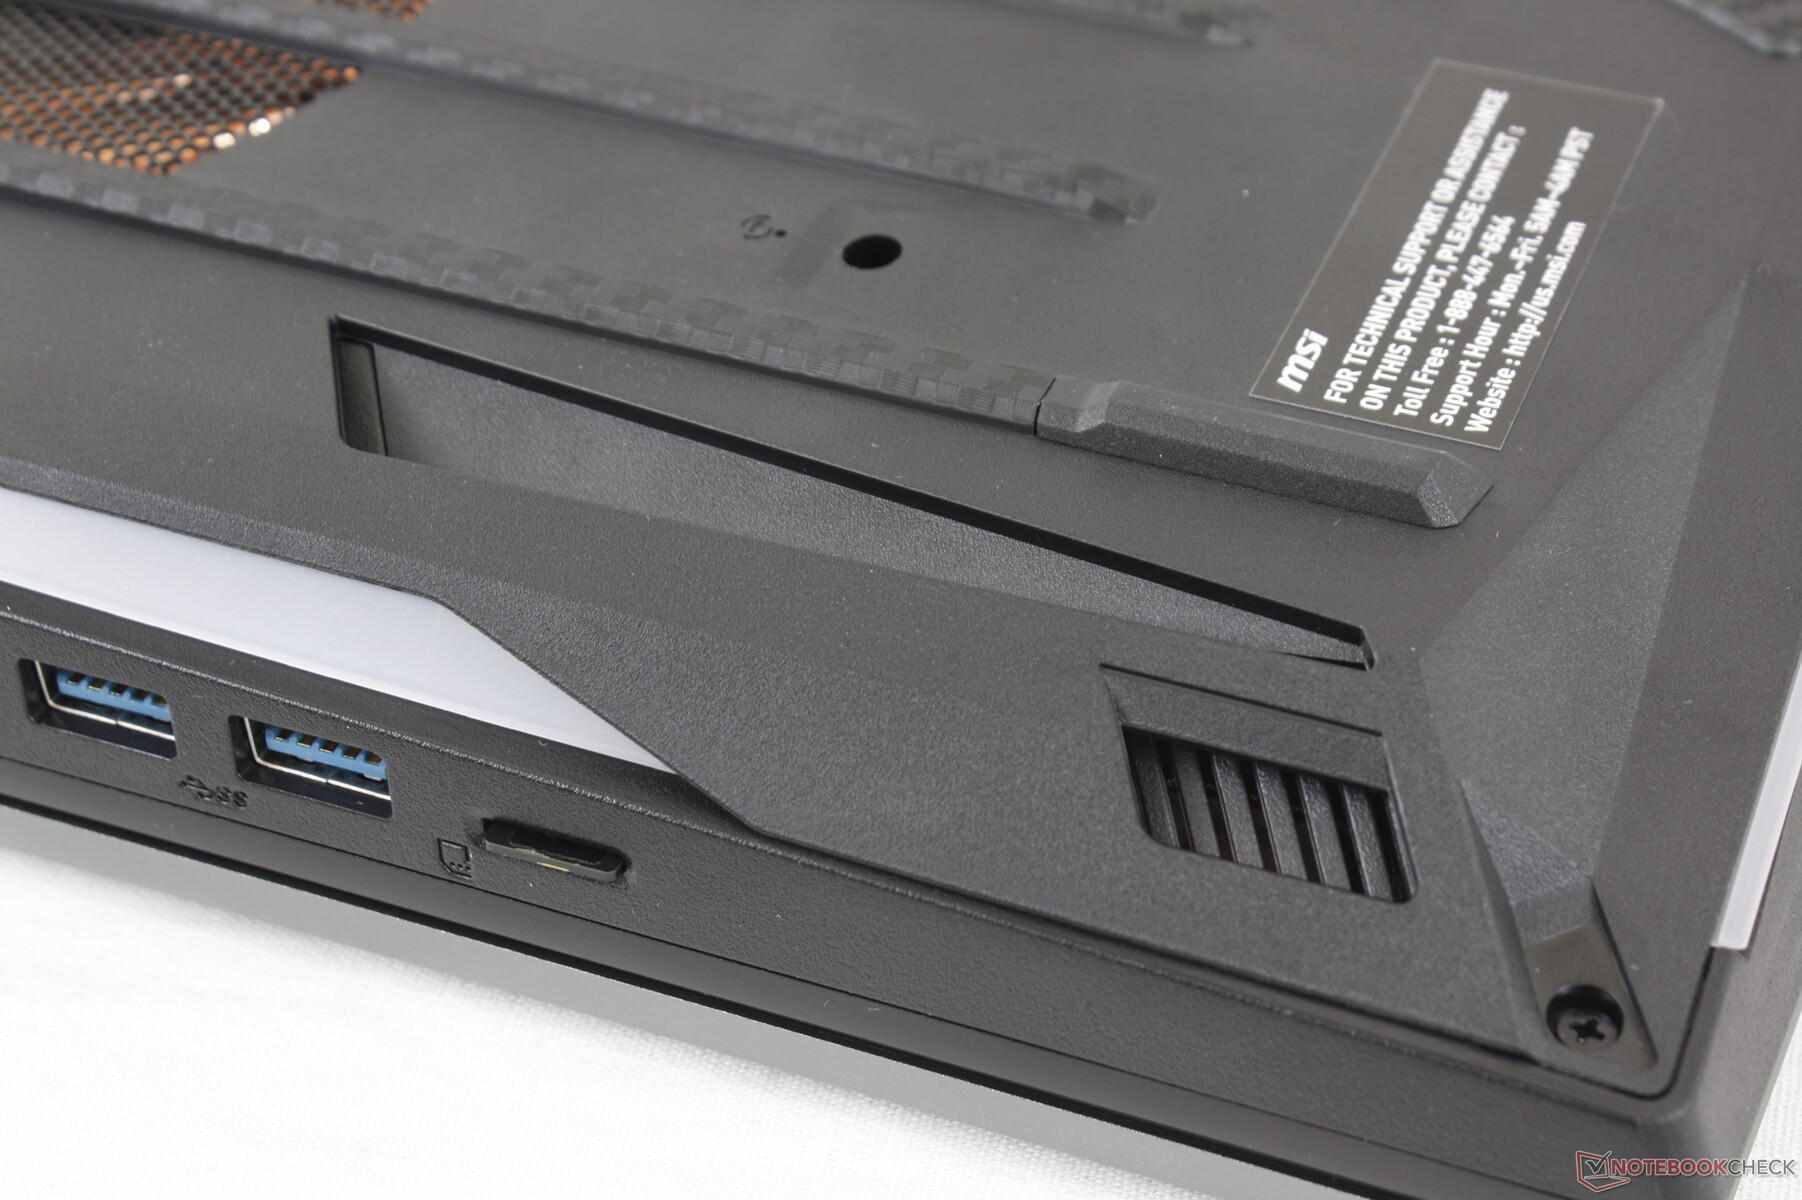
Connessioni
Lettore schede SD
| SD Card Reader | |
| average JPG Copy Test (av. of 3 runs) | |
| Schenker XMG Pro 17 PB71RD-G (Toshiba Exceria Pro SDXC 64 GB UHS-II) | |
| Asus ROG G703GXR (Toshiba Exceria Pro SDXC 64 GB UHS-II) | |
| MSI GT76 Titan DT 10SGS (Toshiba Exceria Pro M501 UHS-II) | |
| MSI GE75 9SG (Toshiba Exceria Pro SDXC 64 GB UHS-II) | |
| maximum AS SSD Seq Read Test (1GB) | |
| Asus ROG G703GXR (Toshiba Exceria Pro SDXC 64 GB UHS-II) | |
| Schenker XMG Pro 17 PB71RD-G (Toshiba Exceria Pro SDXC 64 GB UHS-II) | |
| MSI GT76 Titan DT 10SGS (Toshiba Exceria Pro M501 UHS-II) | |
| MSI GE75 9SG (Toshiba Exceria Pro SDXC 64 GB UHS-II) | |
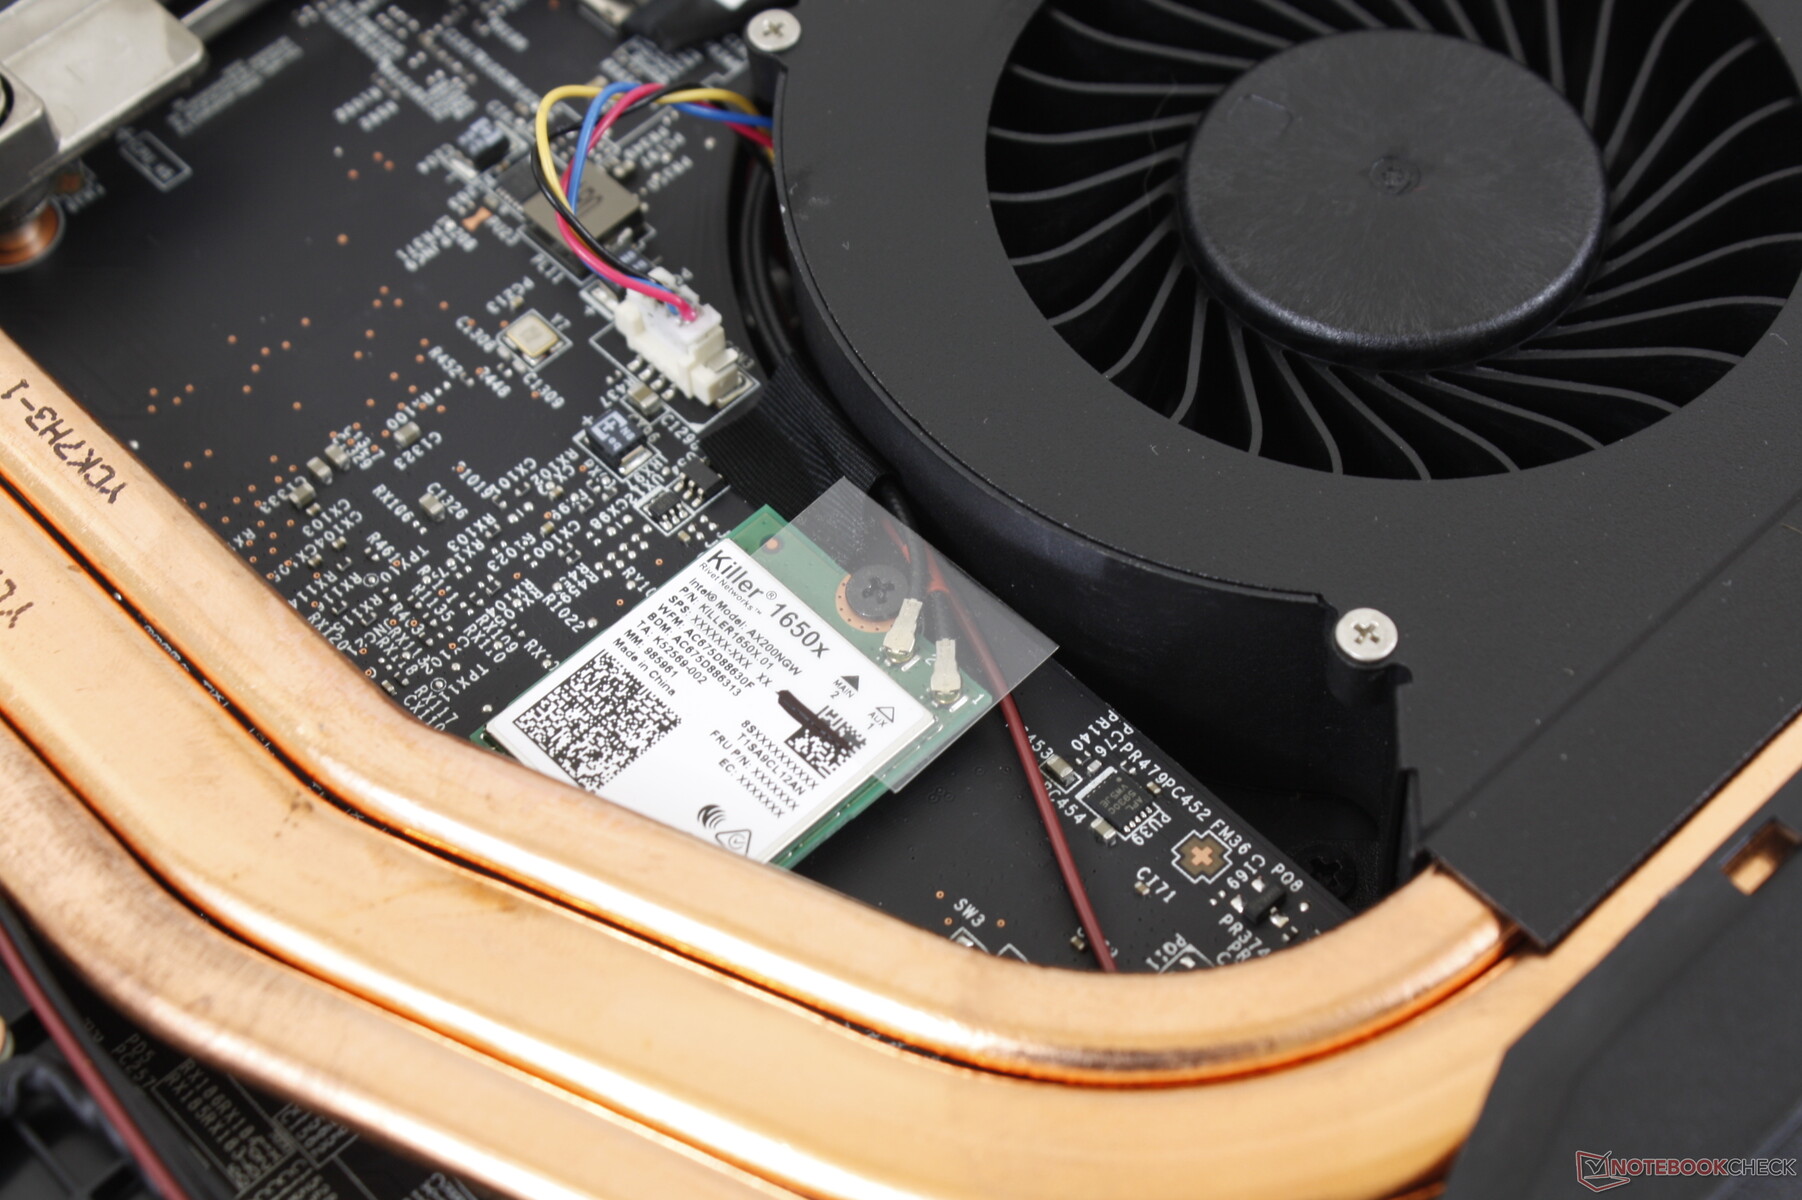
Comunicazioni
Webcam

")
")
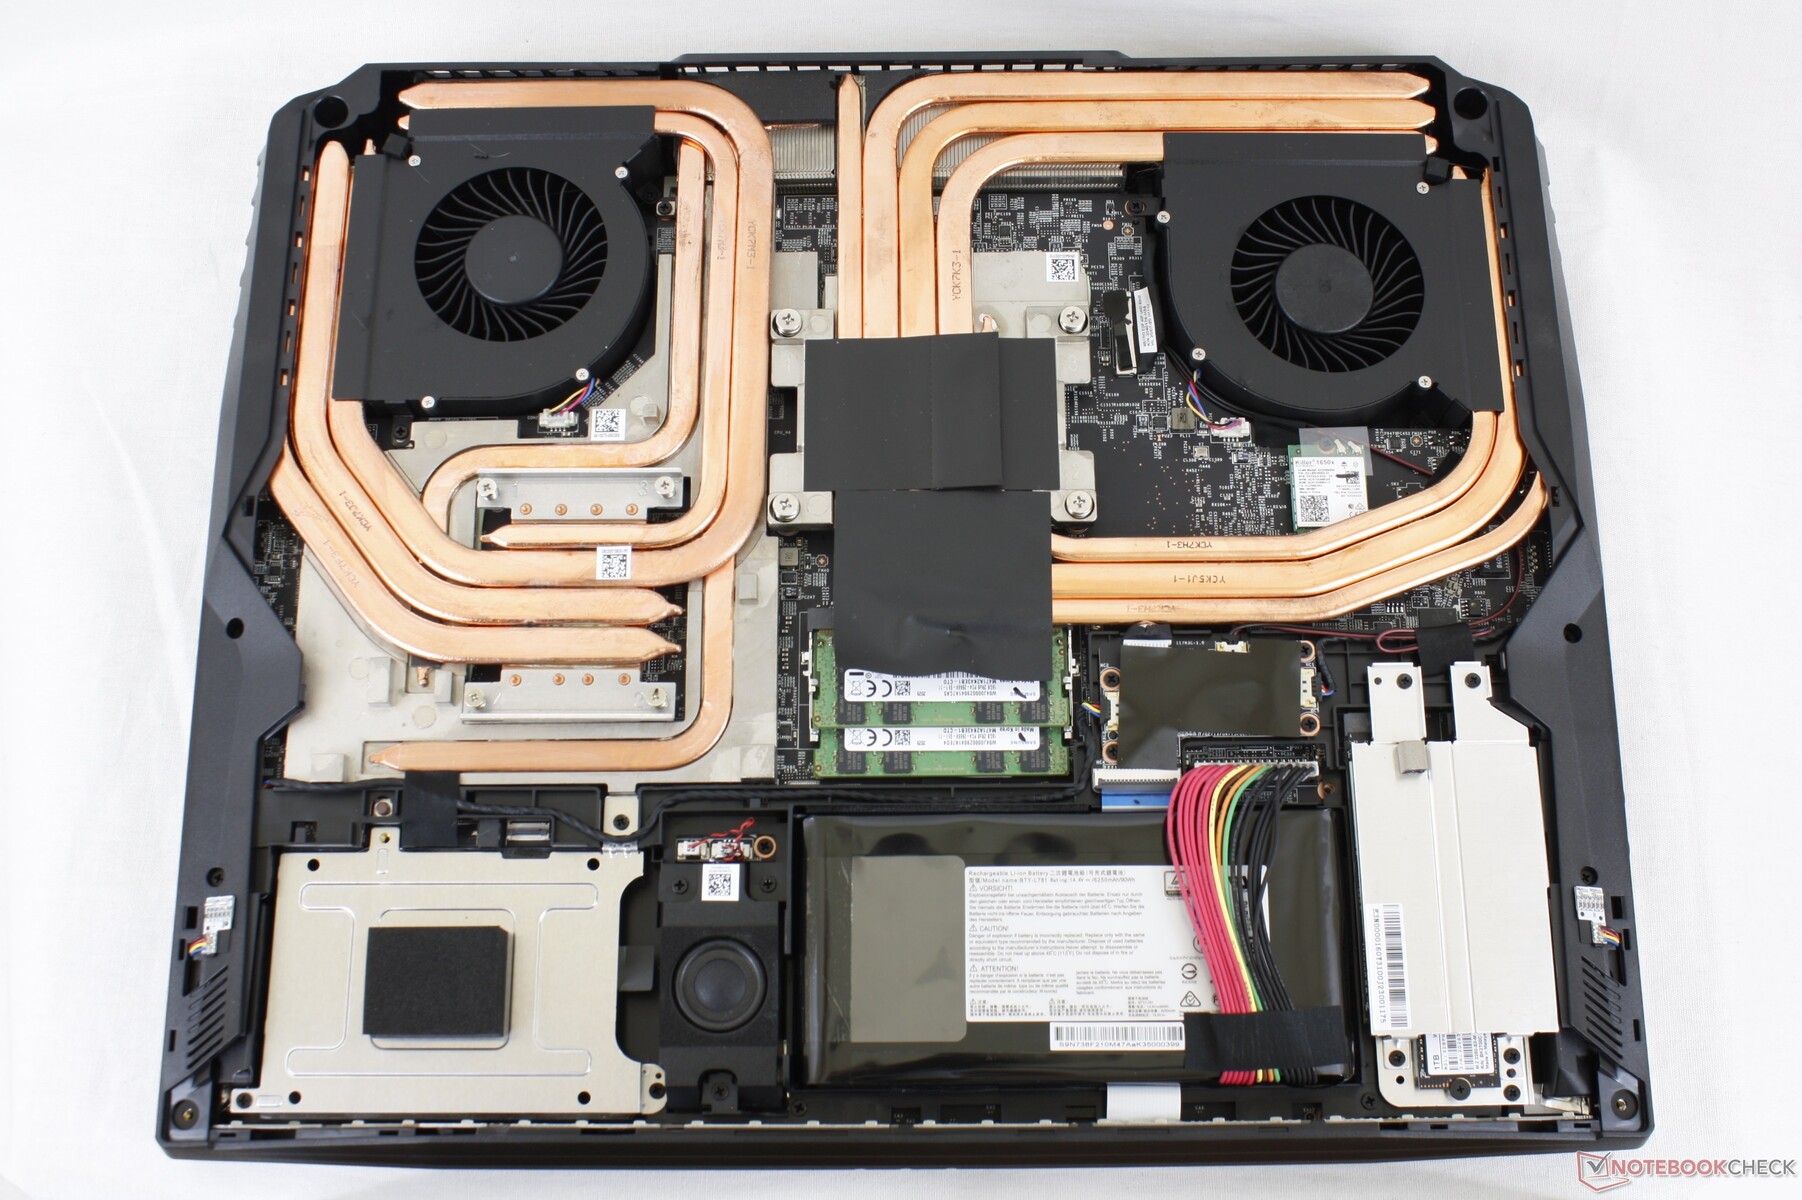
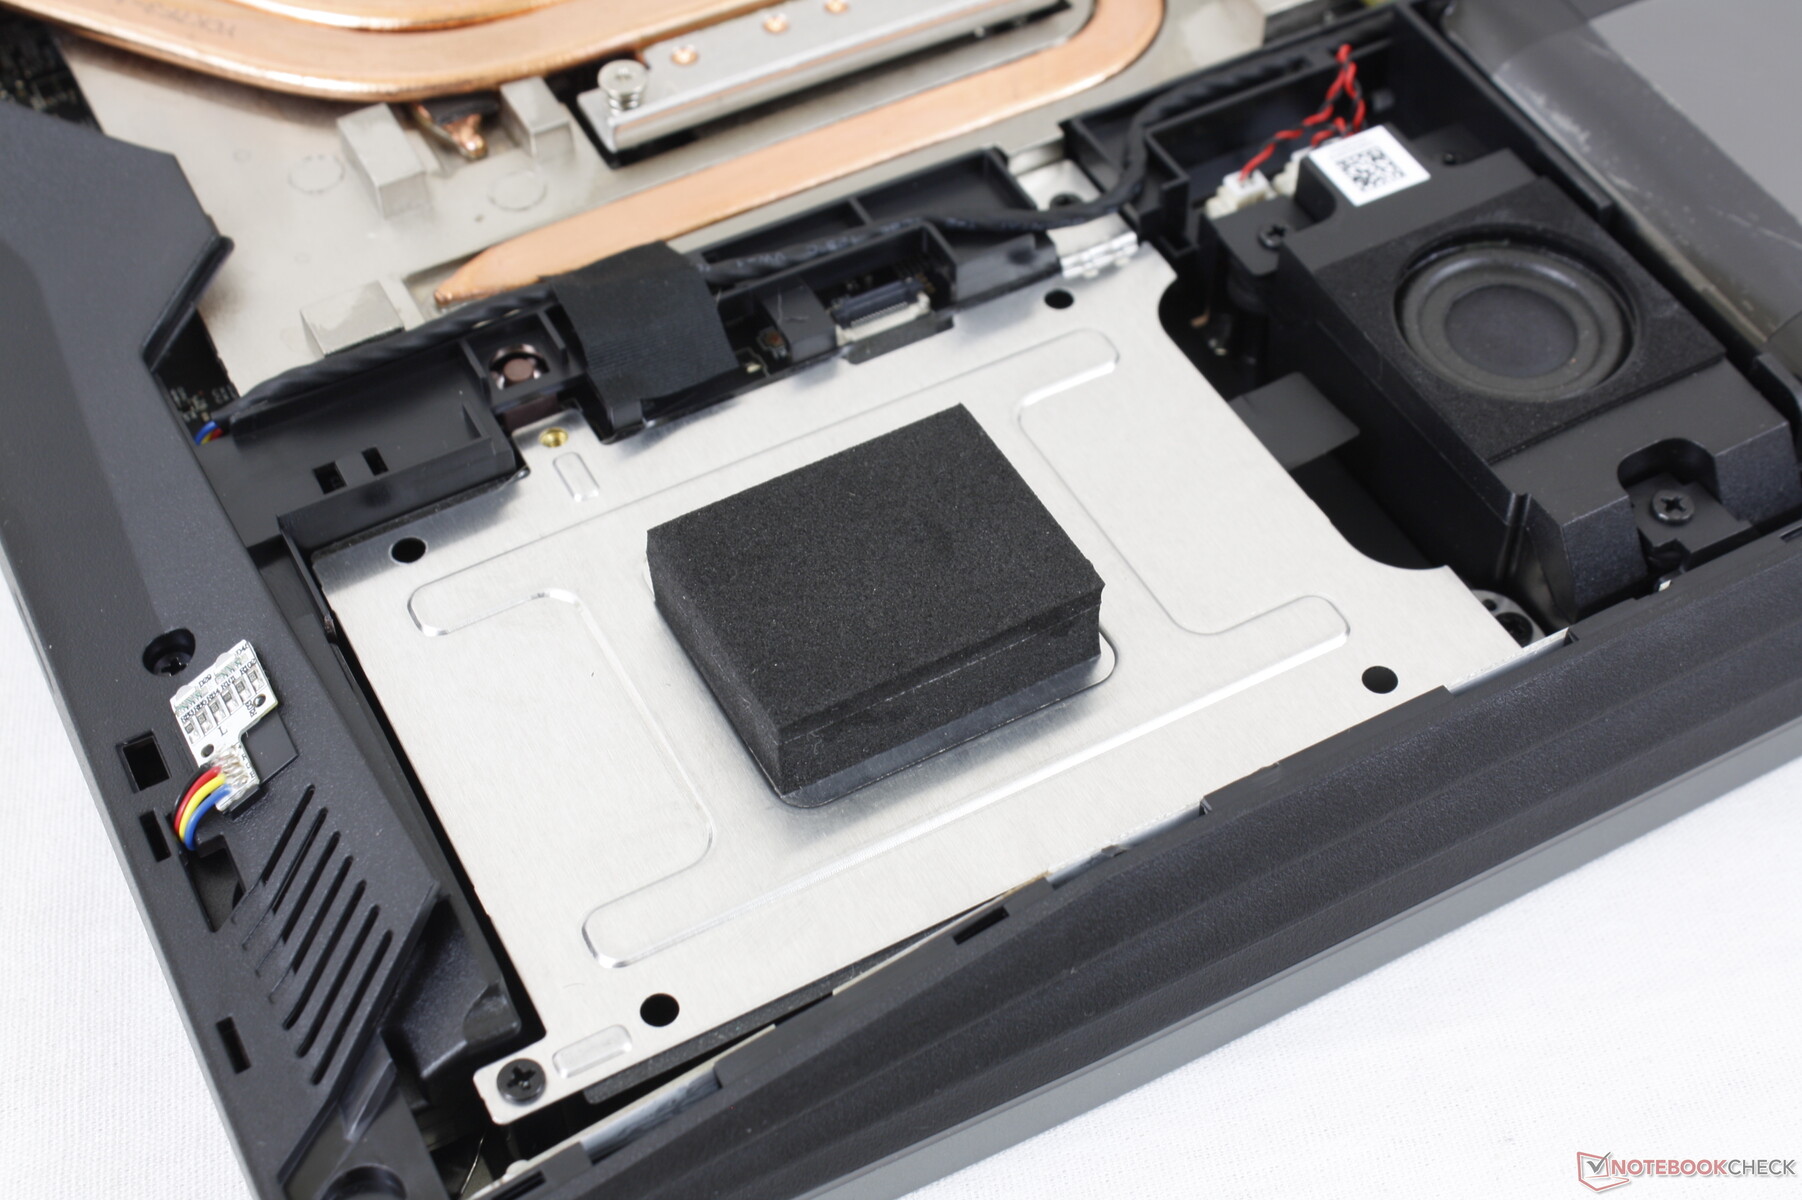
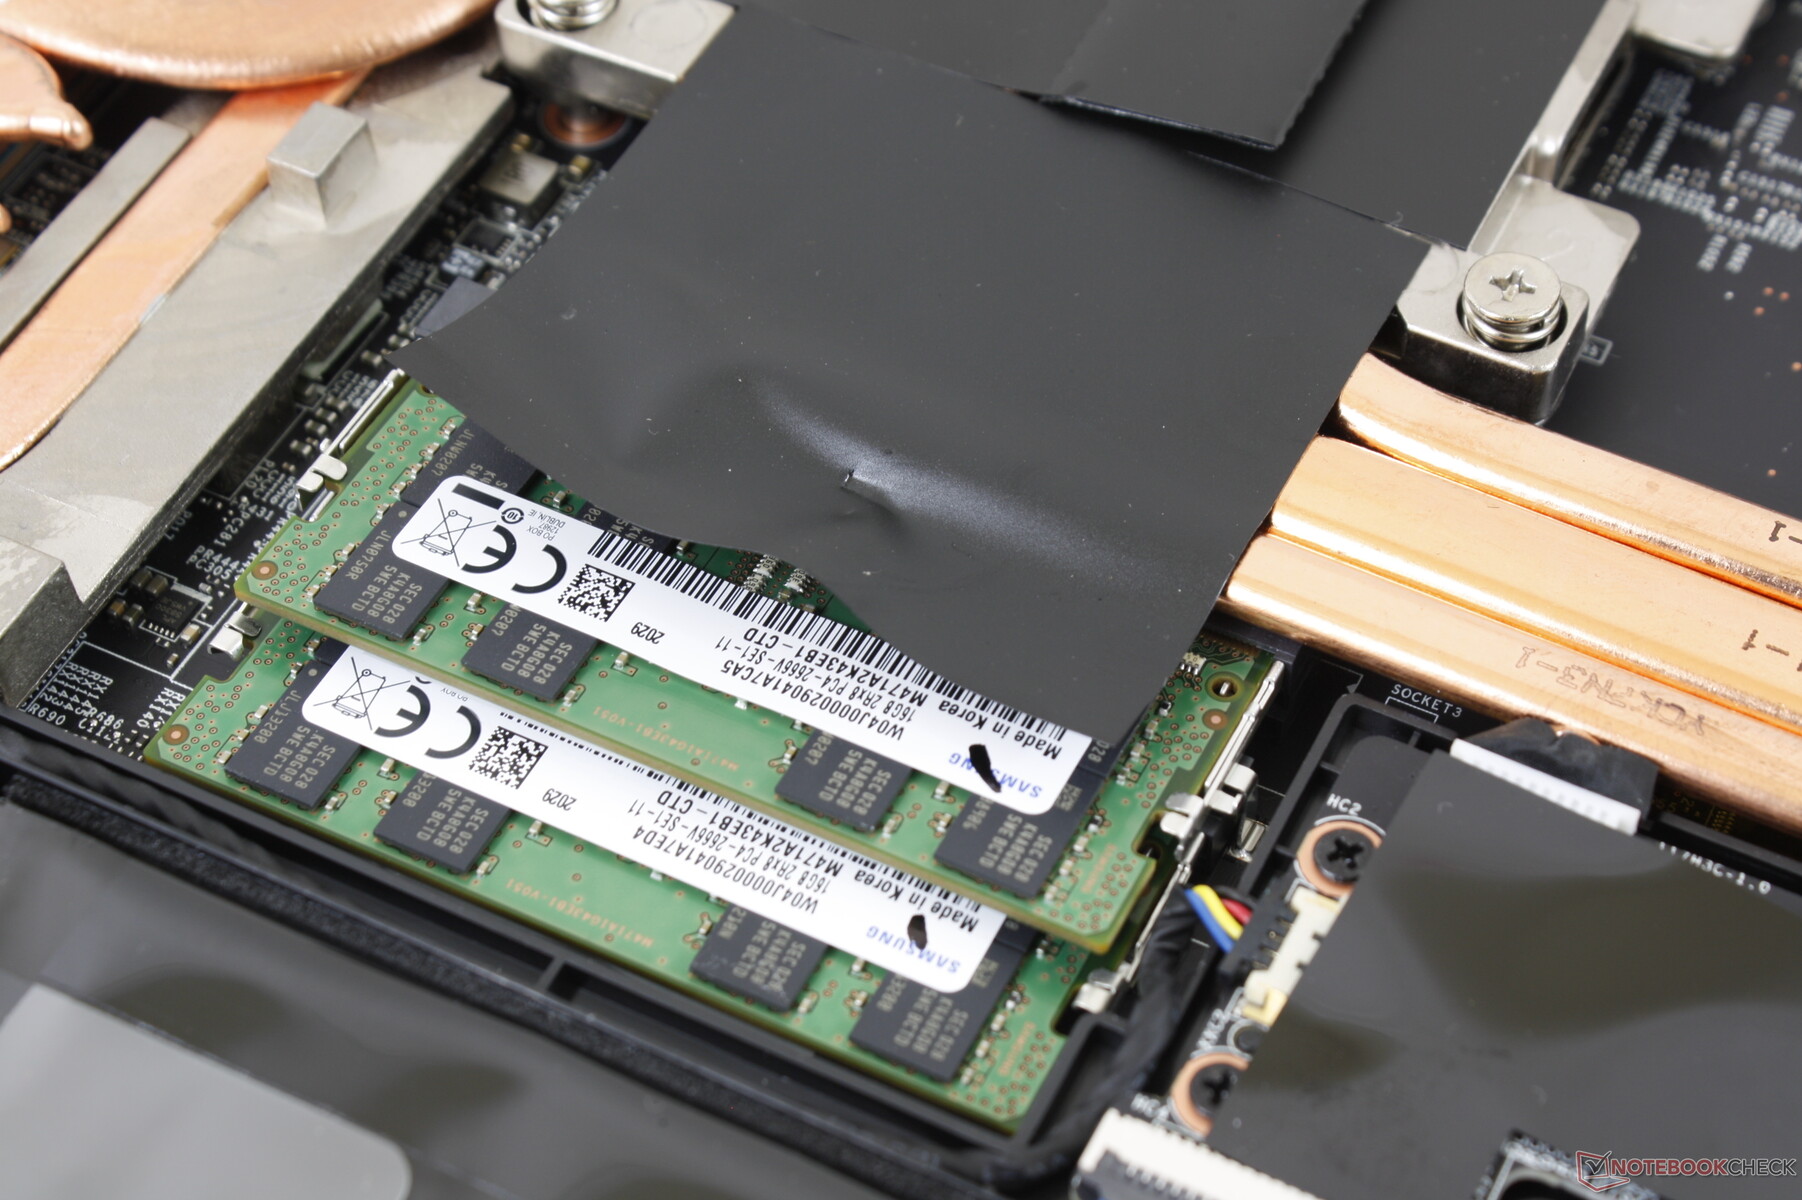
Manutenzione
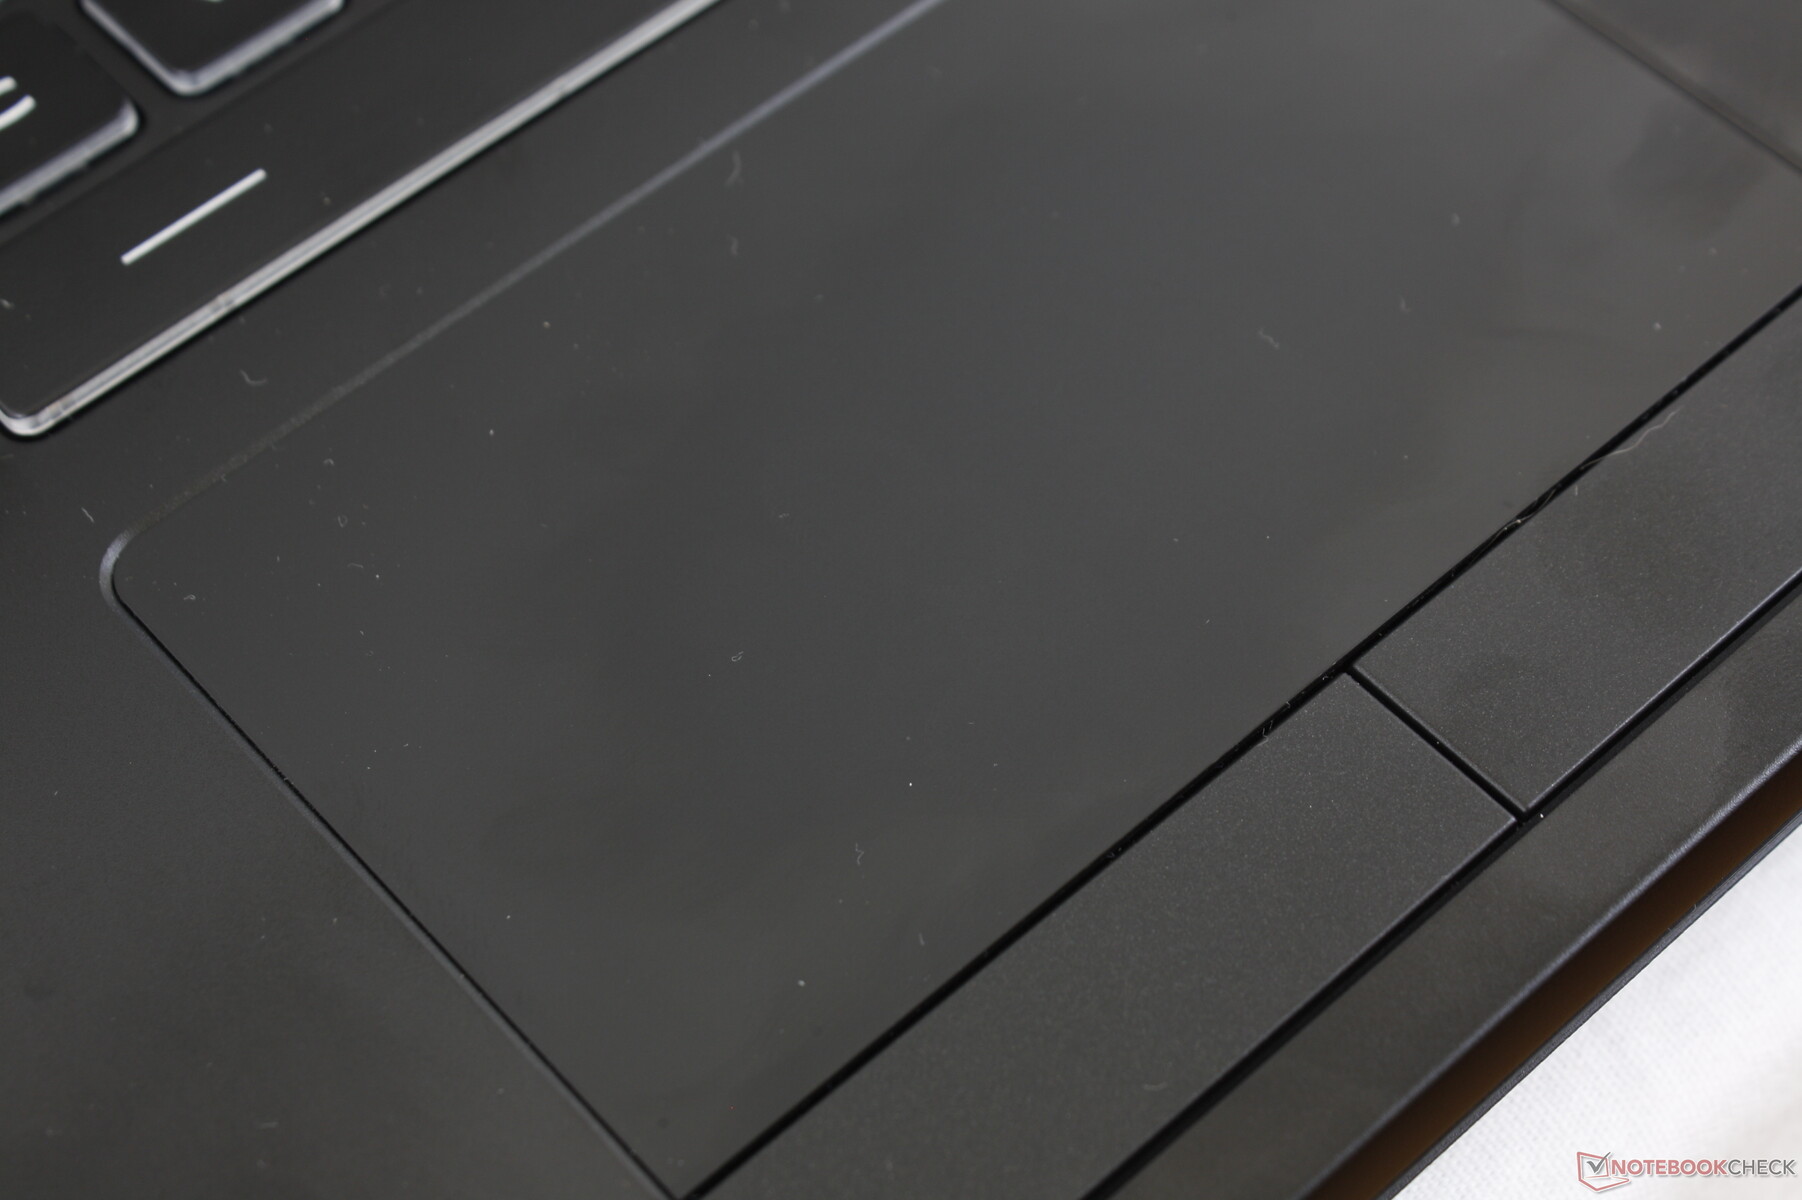
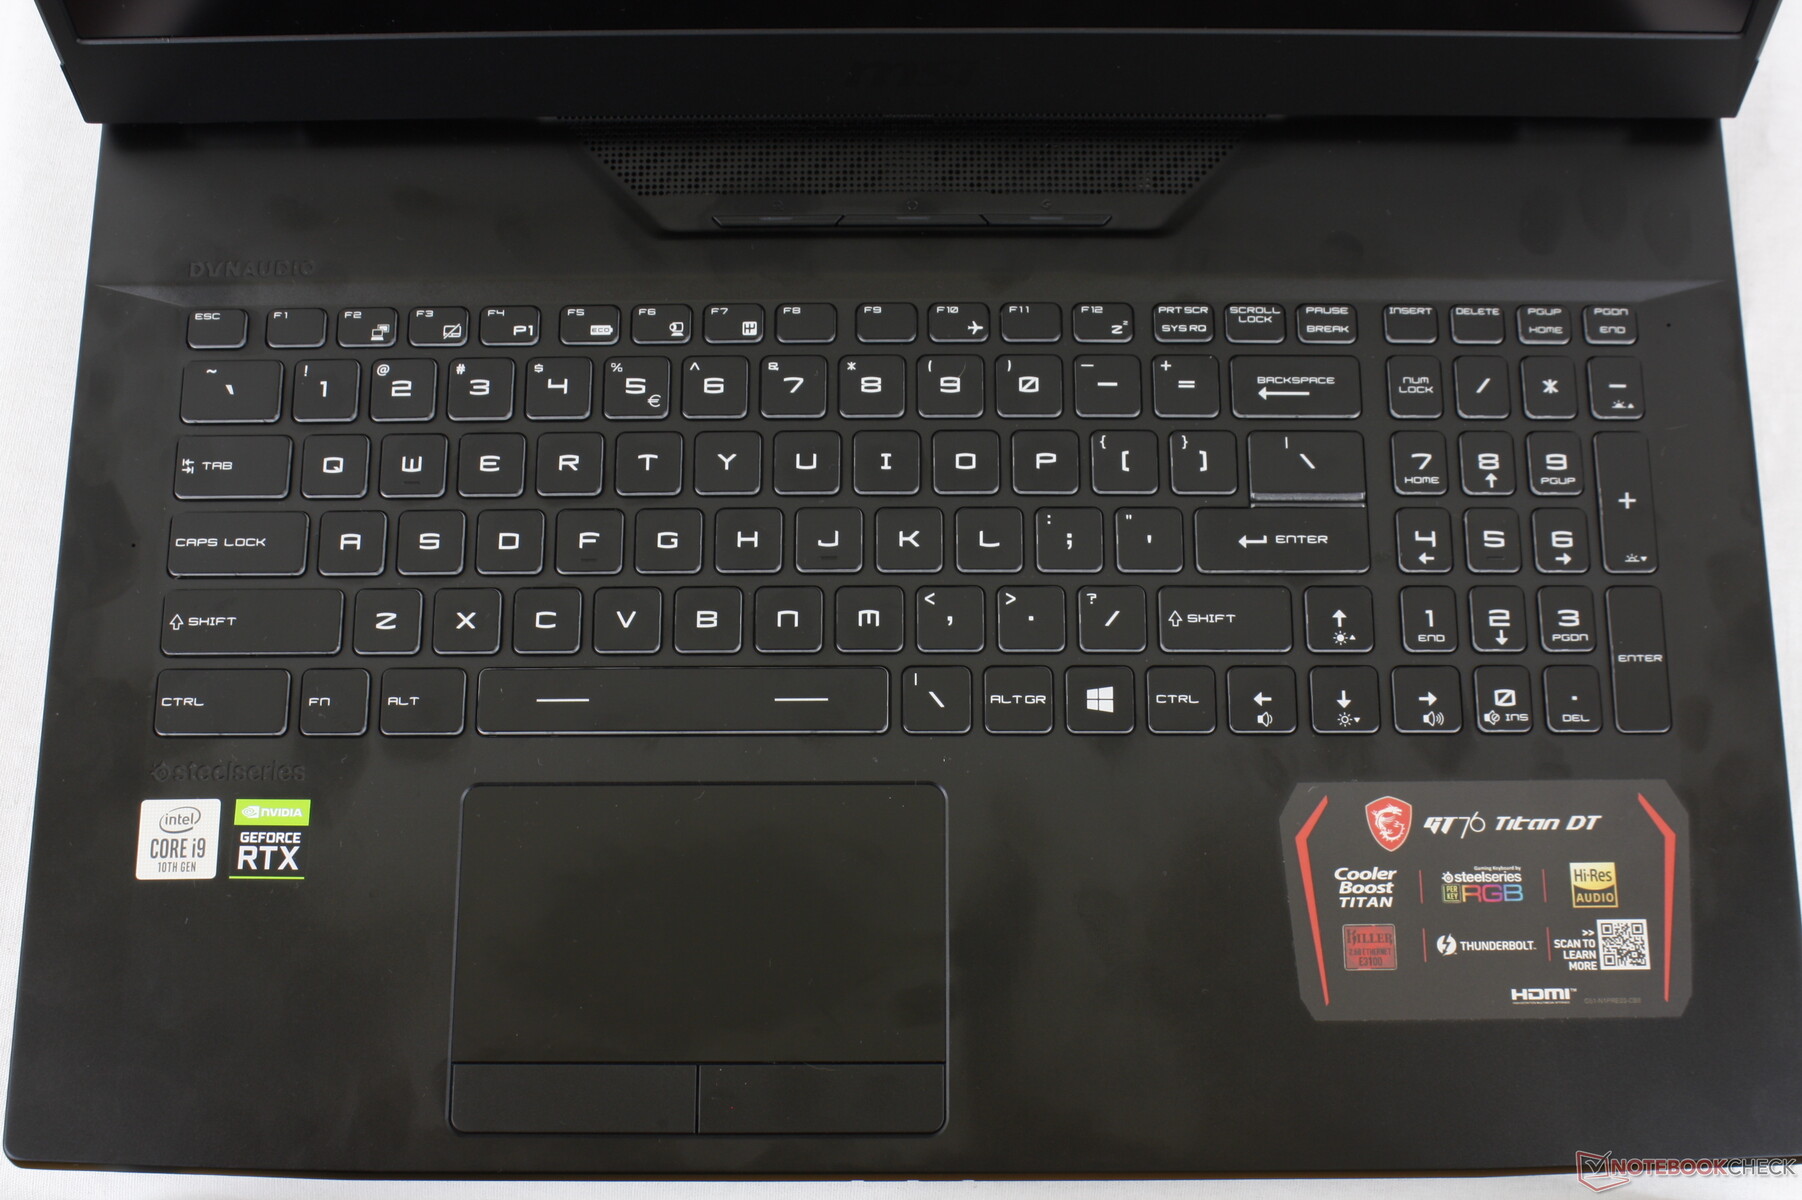
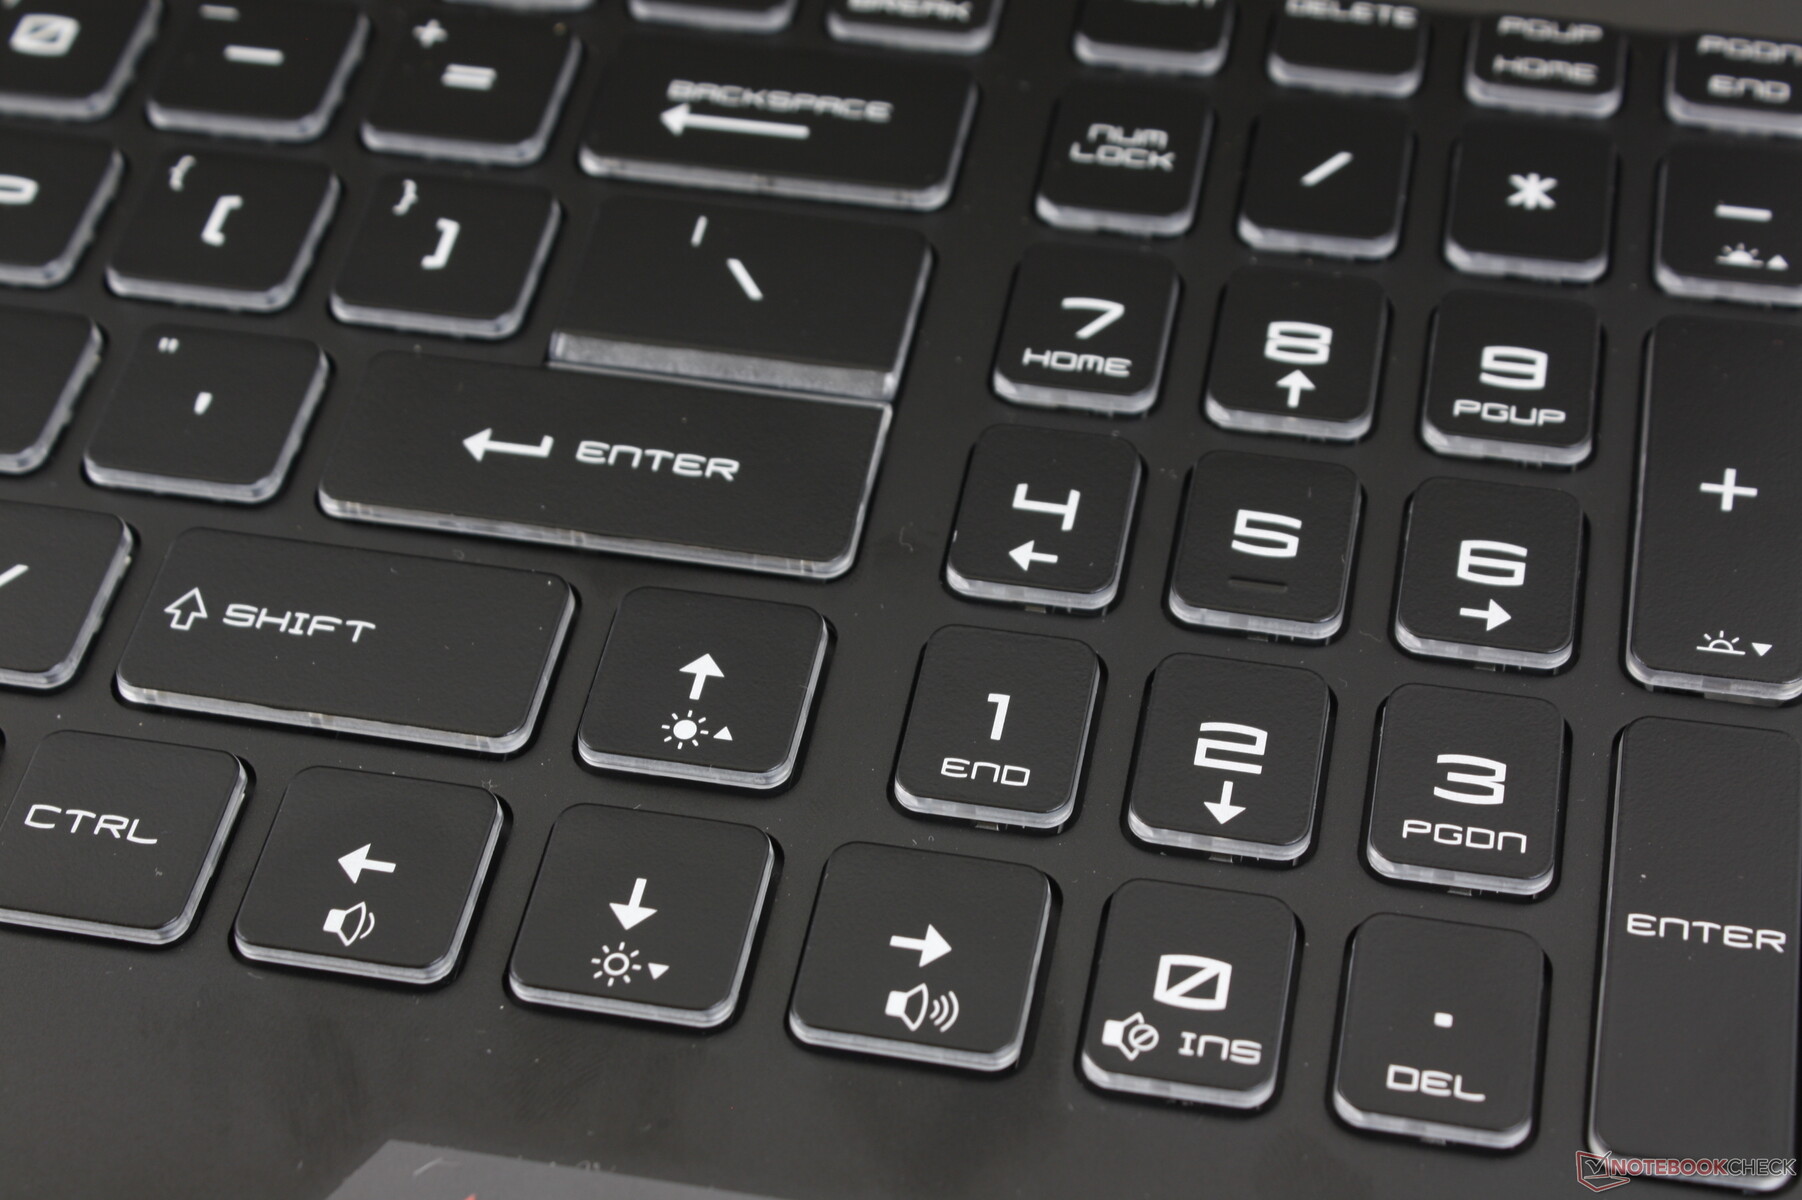
Dispositivi di Input

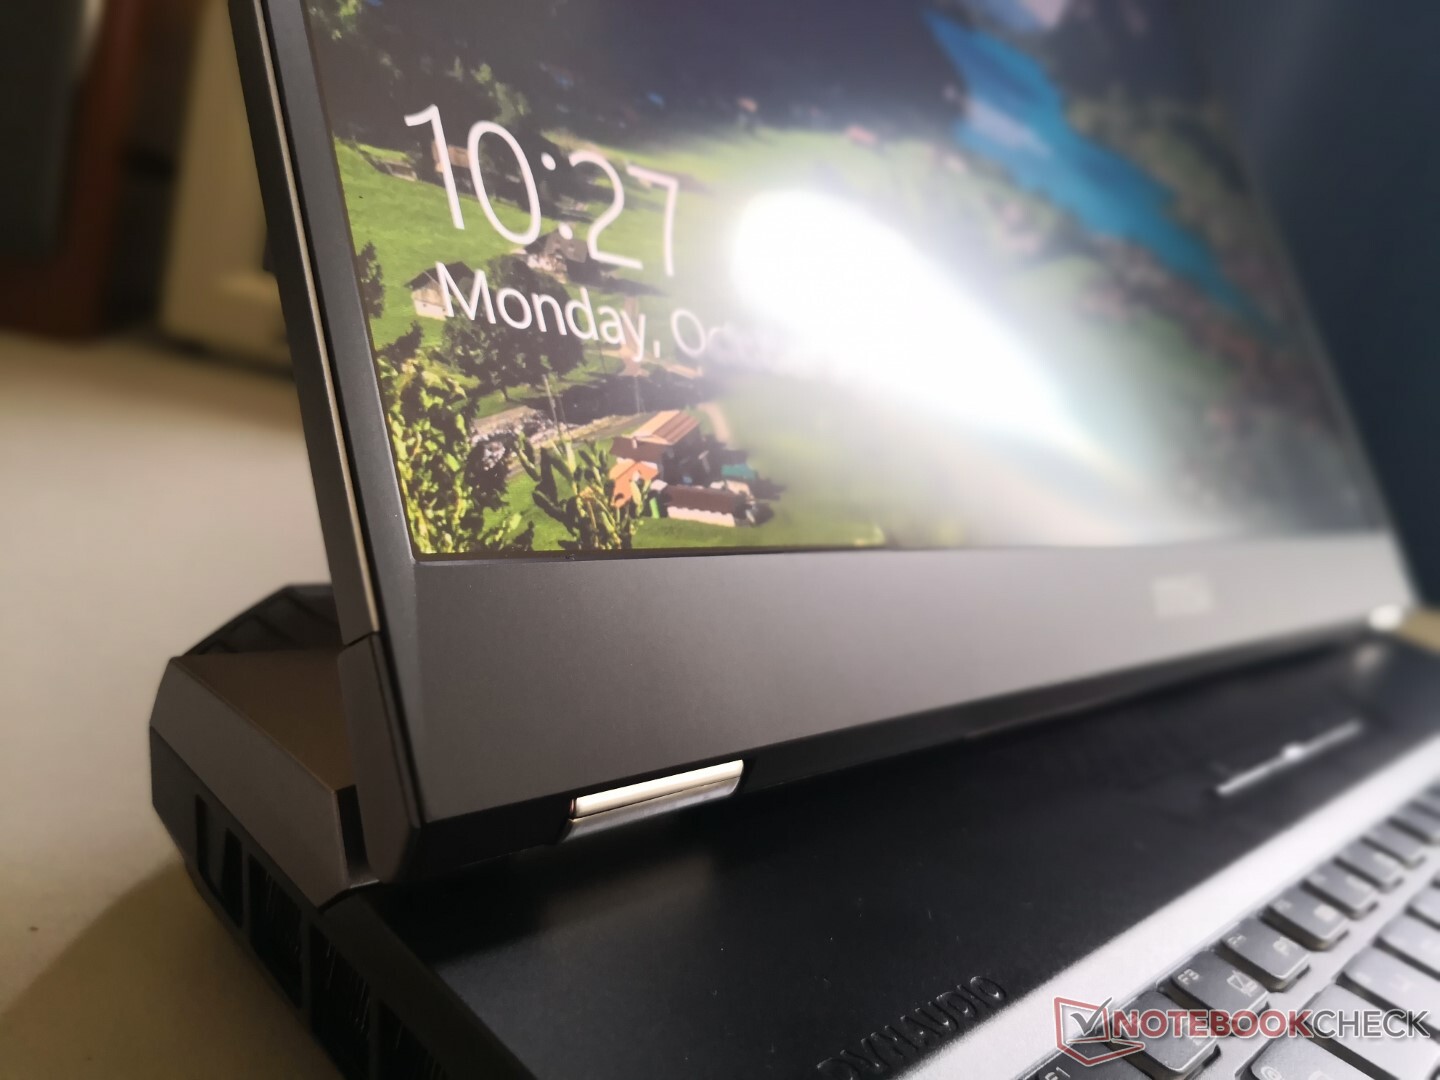
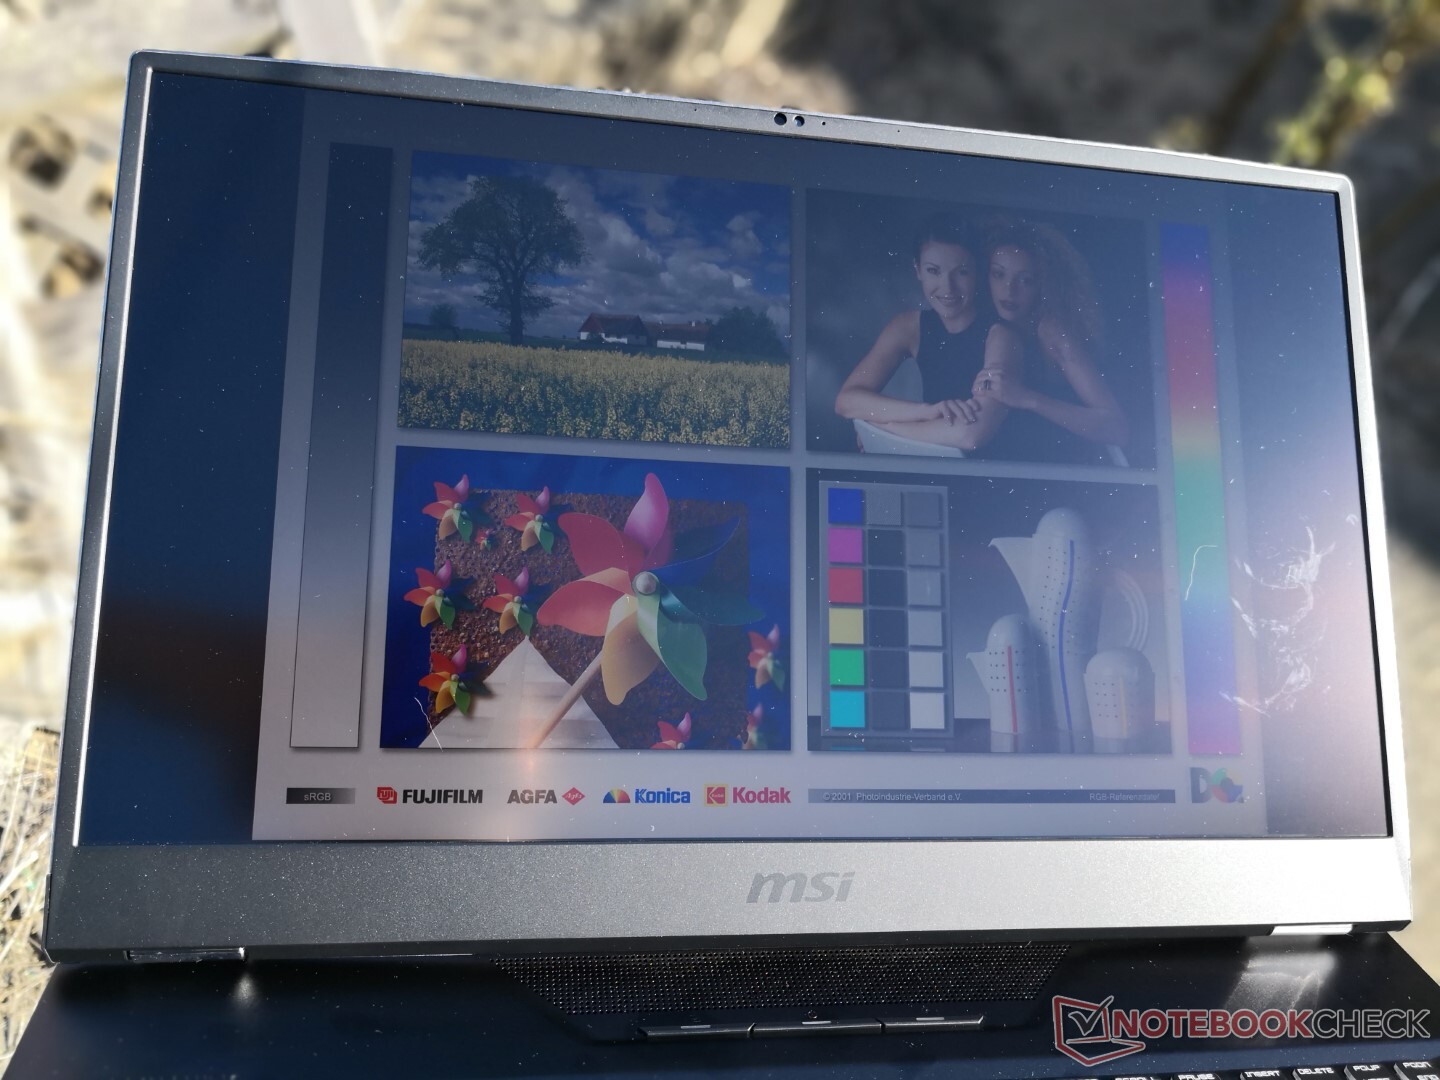
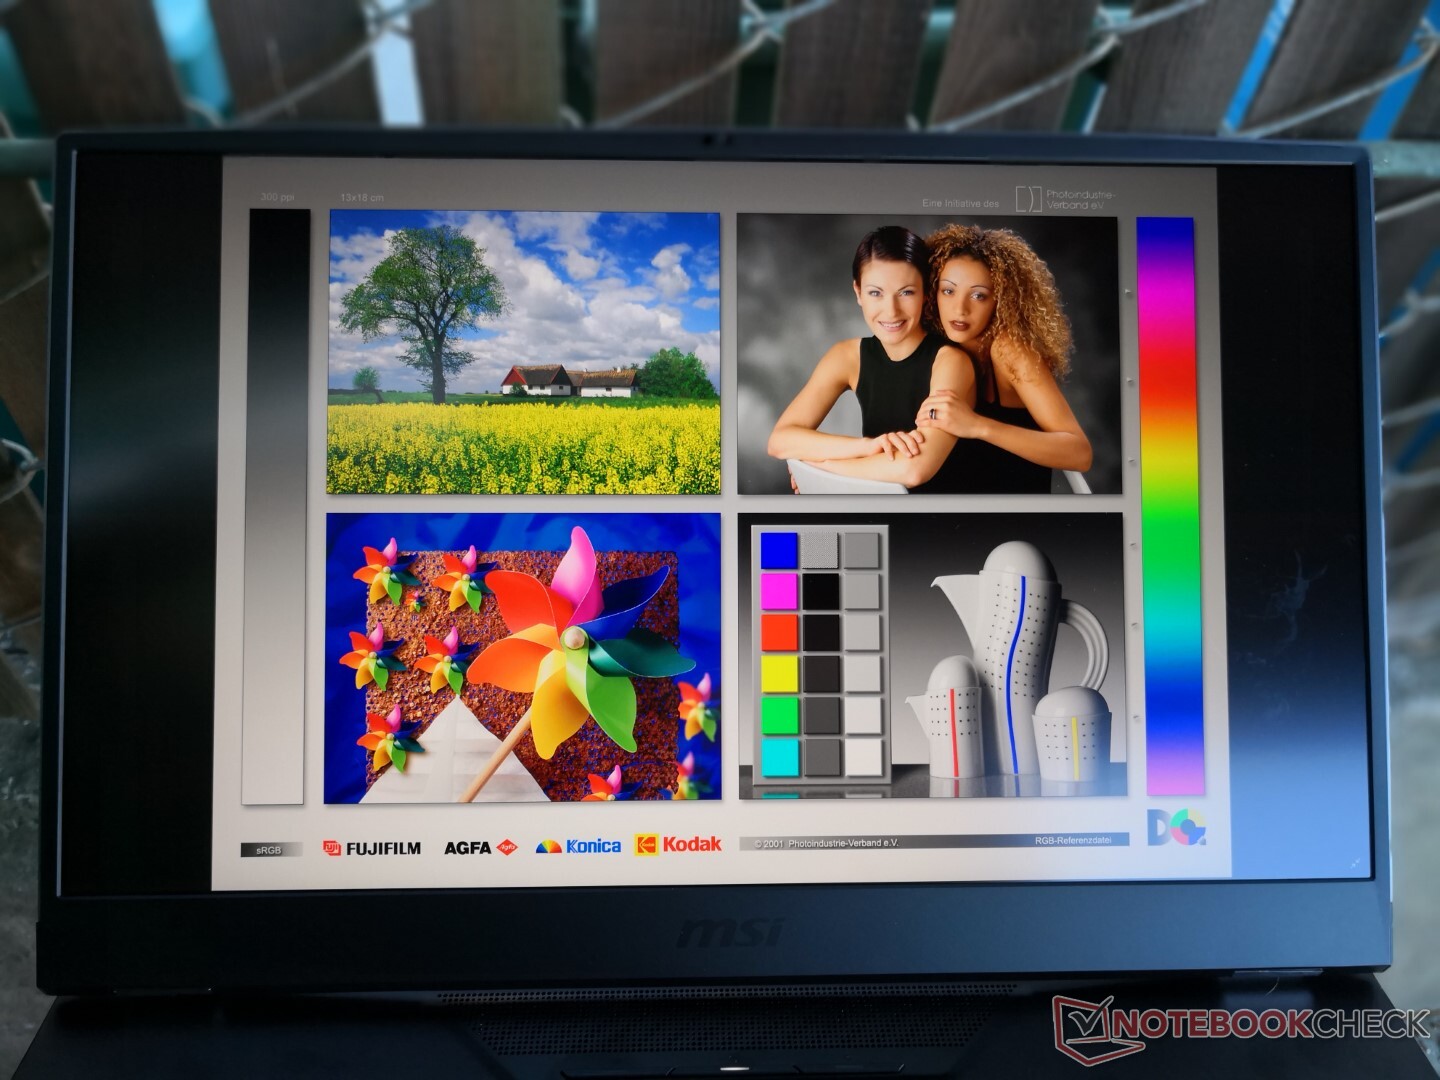
Display
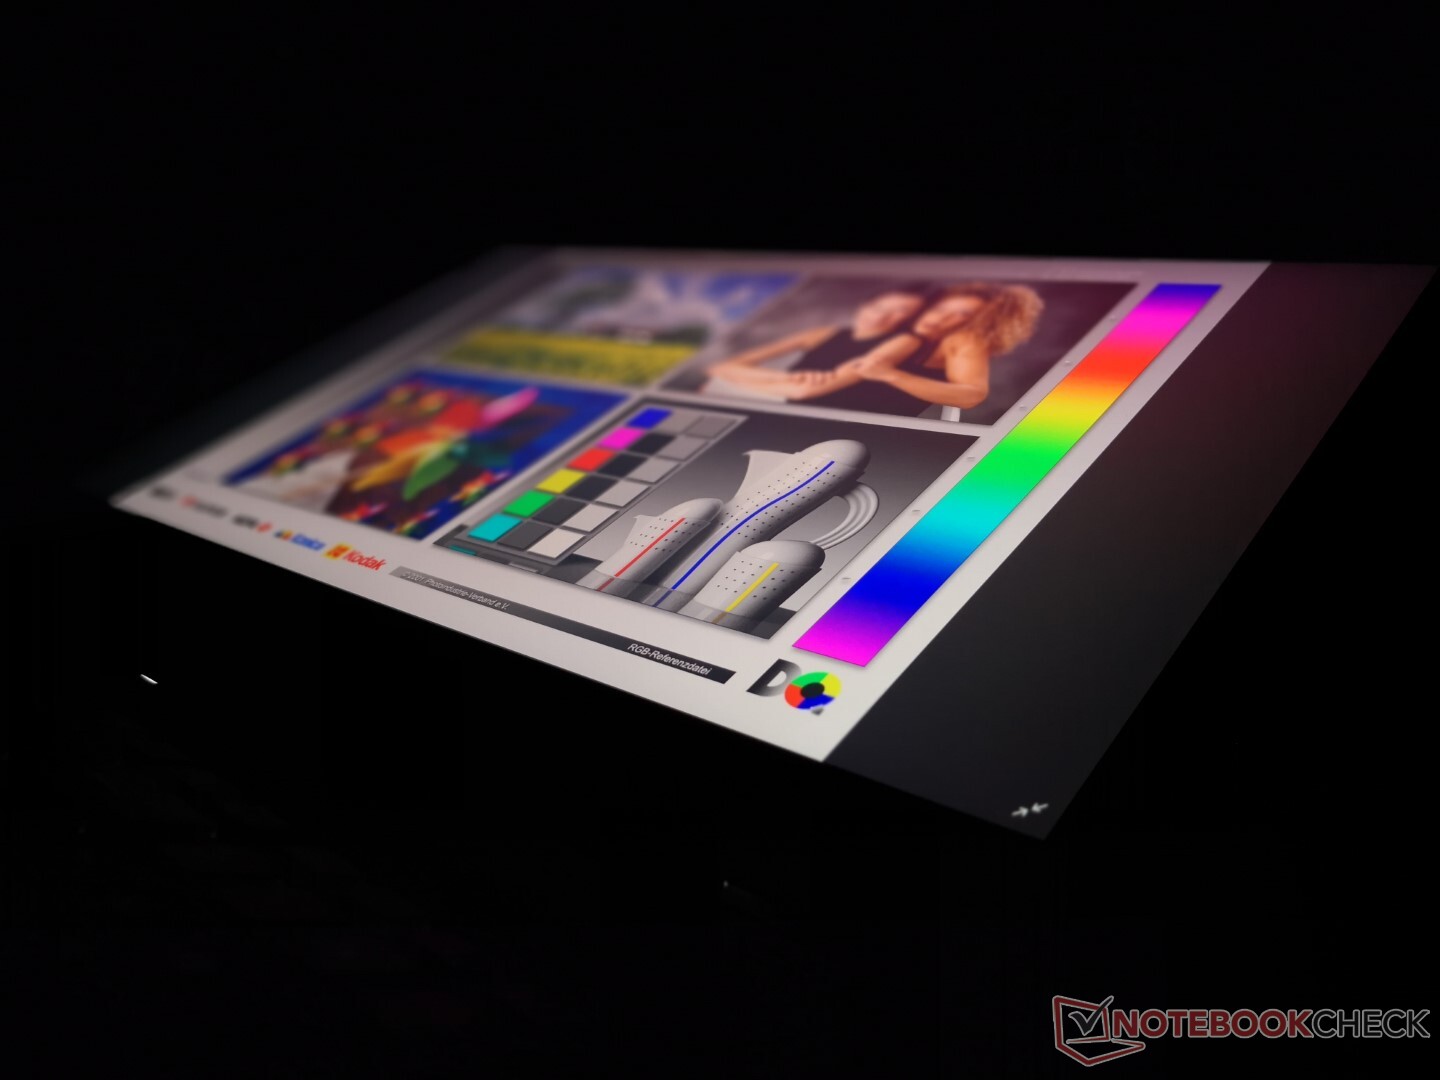
Il nostro pannello AU Optronics B173ZAN03.3 4K UHD si trova qui anche sull'ultimo Razer Blade Pro 17. Questo particolare pannello si distingue per la sua frequenza di aggiornamento nativa di 120 Hz e i tempi di risposta rapidi rispetto alla maggior parte degli altri pannelli 4K UHD che sono limitati a soli 60 Hz. I pannelli 1080p hanno ancora il vantaggio in termini di refresh rate e tempi di risposta ed è per questi motivi che il GT76 può essere configurato anche con pannelli 1080p a 300 Hz, se lo si desidera.

| |||||||||||||||||||||||||
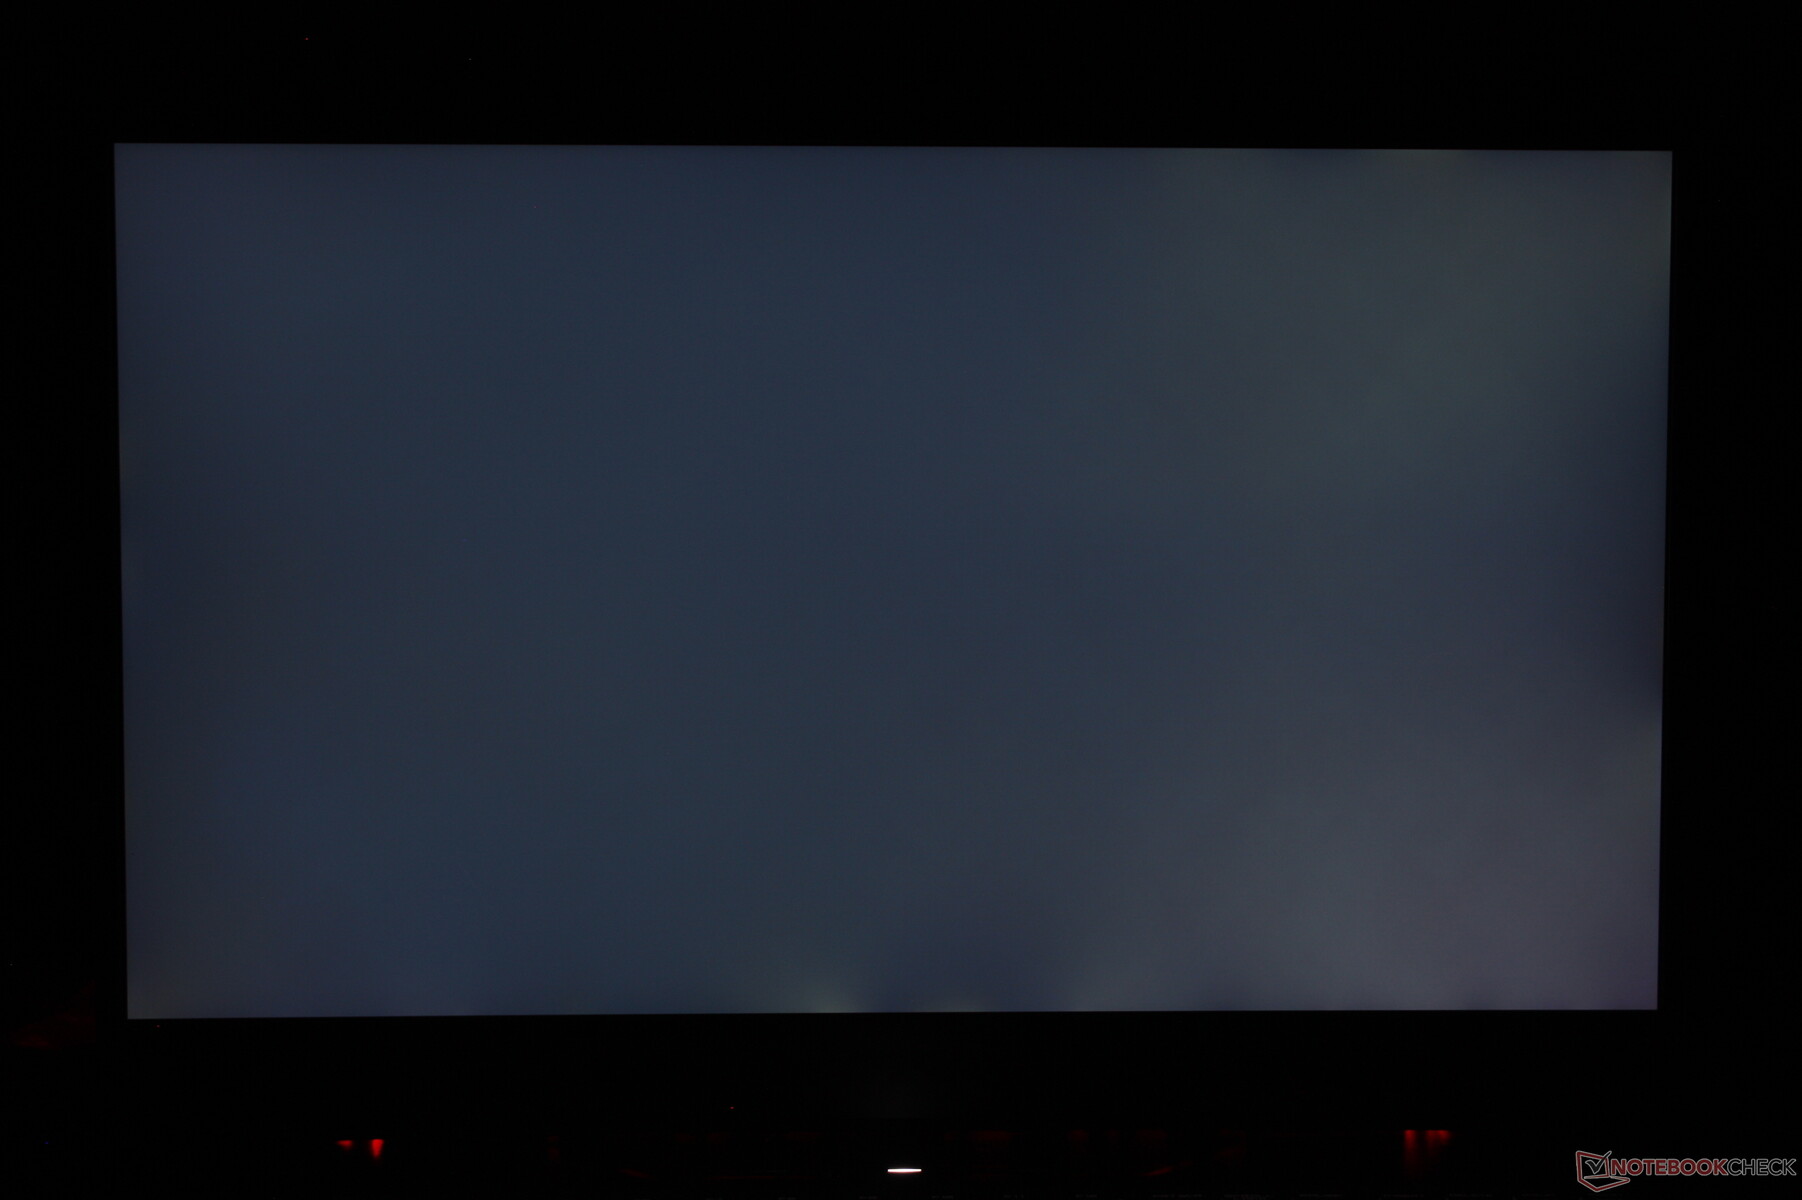
Distribuzione della luminosità: 93 %
Al centro con la batteria: 419.5 cd/m²
Contrasto: 1049:1 (Nero: 0.4 cd/m²)
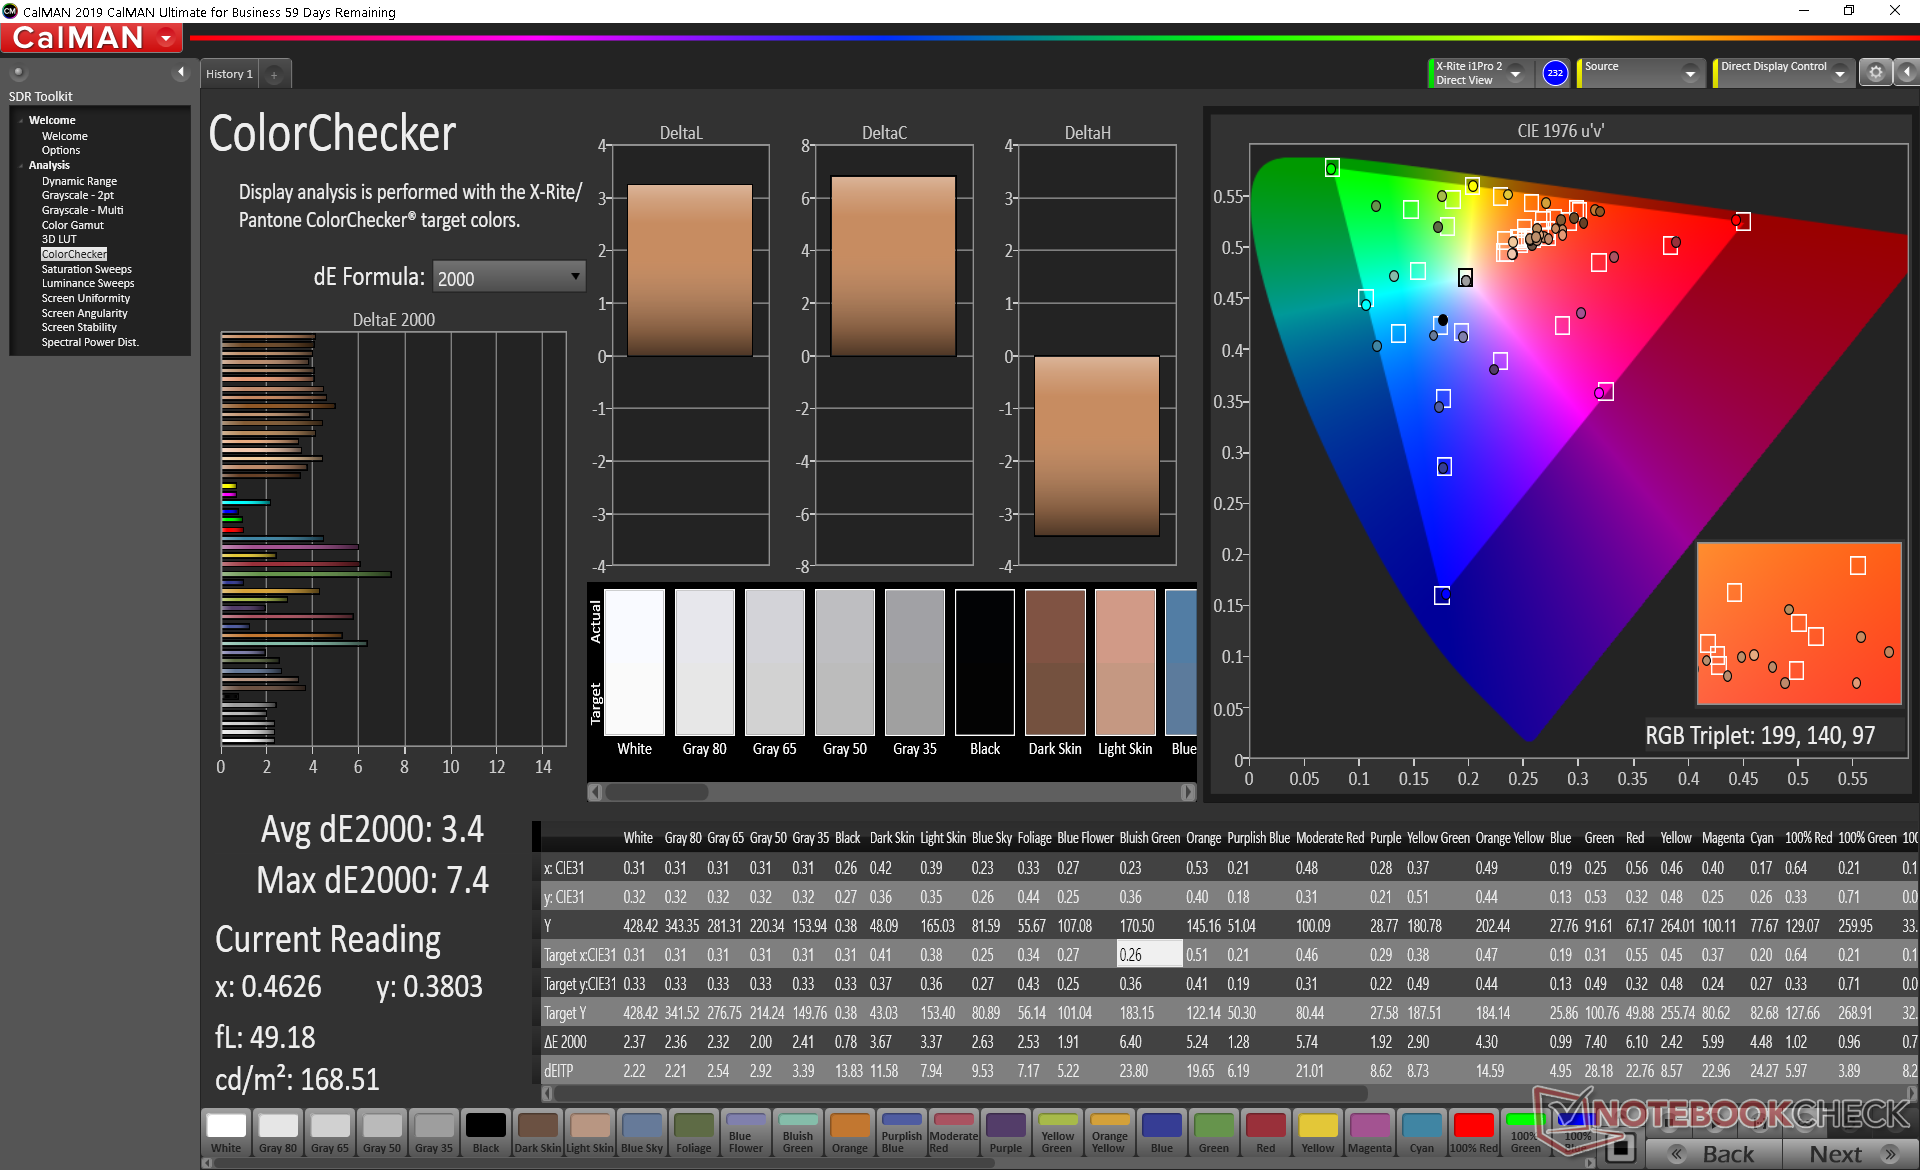
ΔE ColorChecker Calman: 3.4 | ∀{0.5-29.43 Ø4.71}
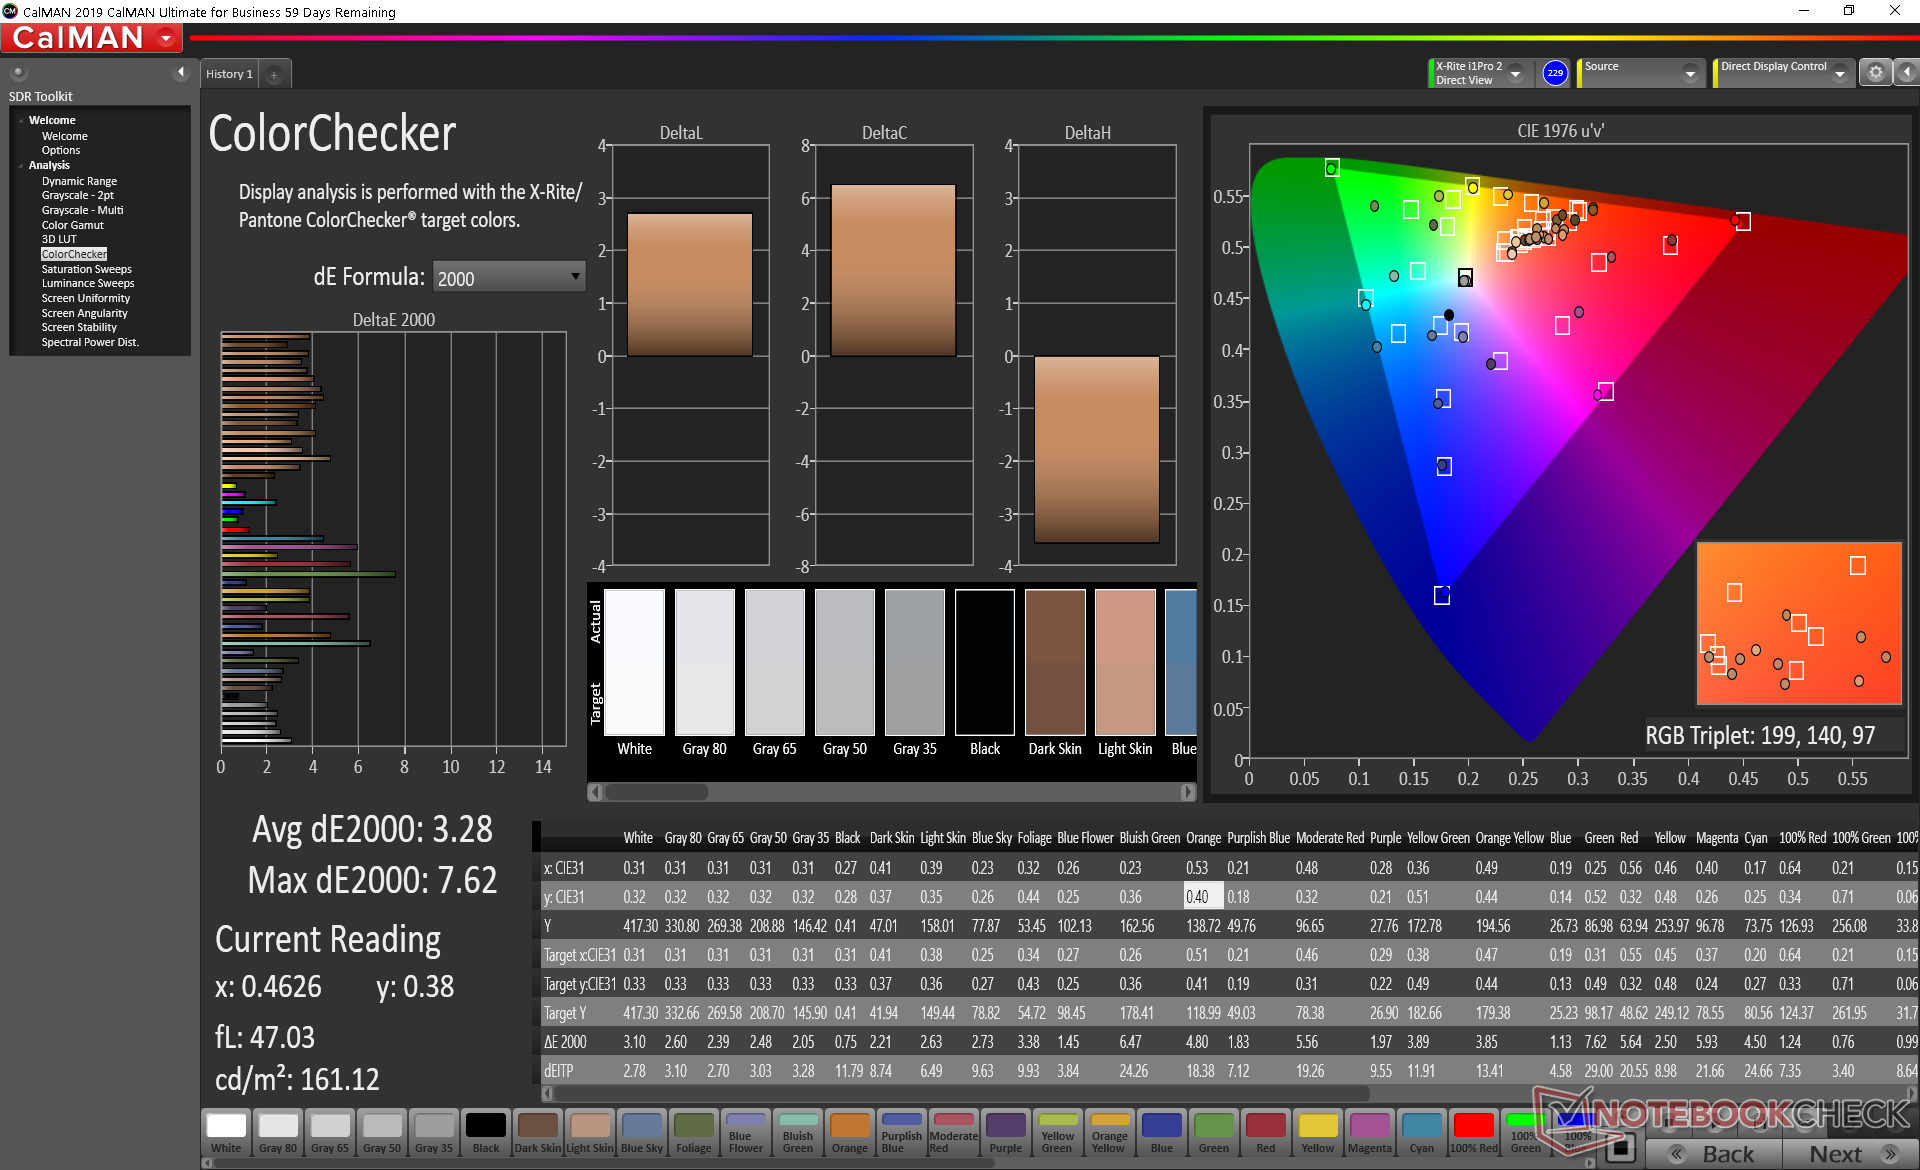
calibrated: 3.28
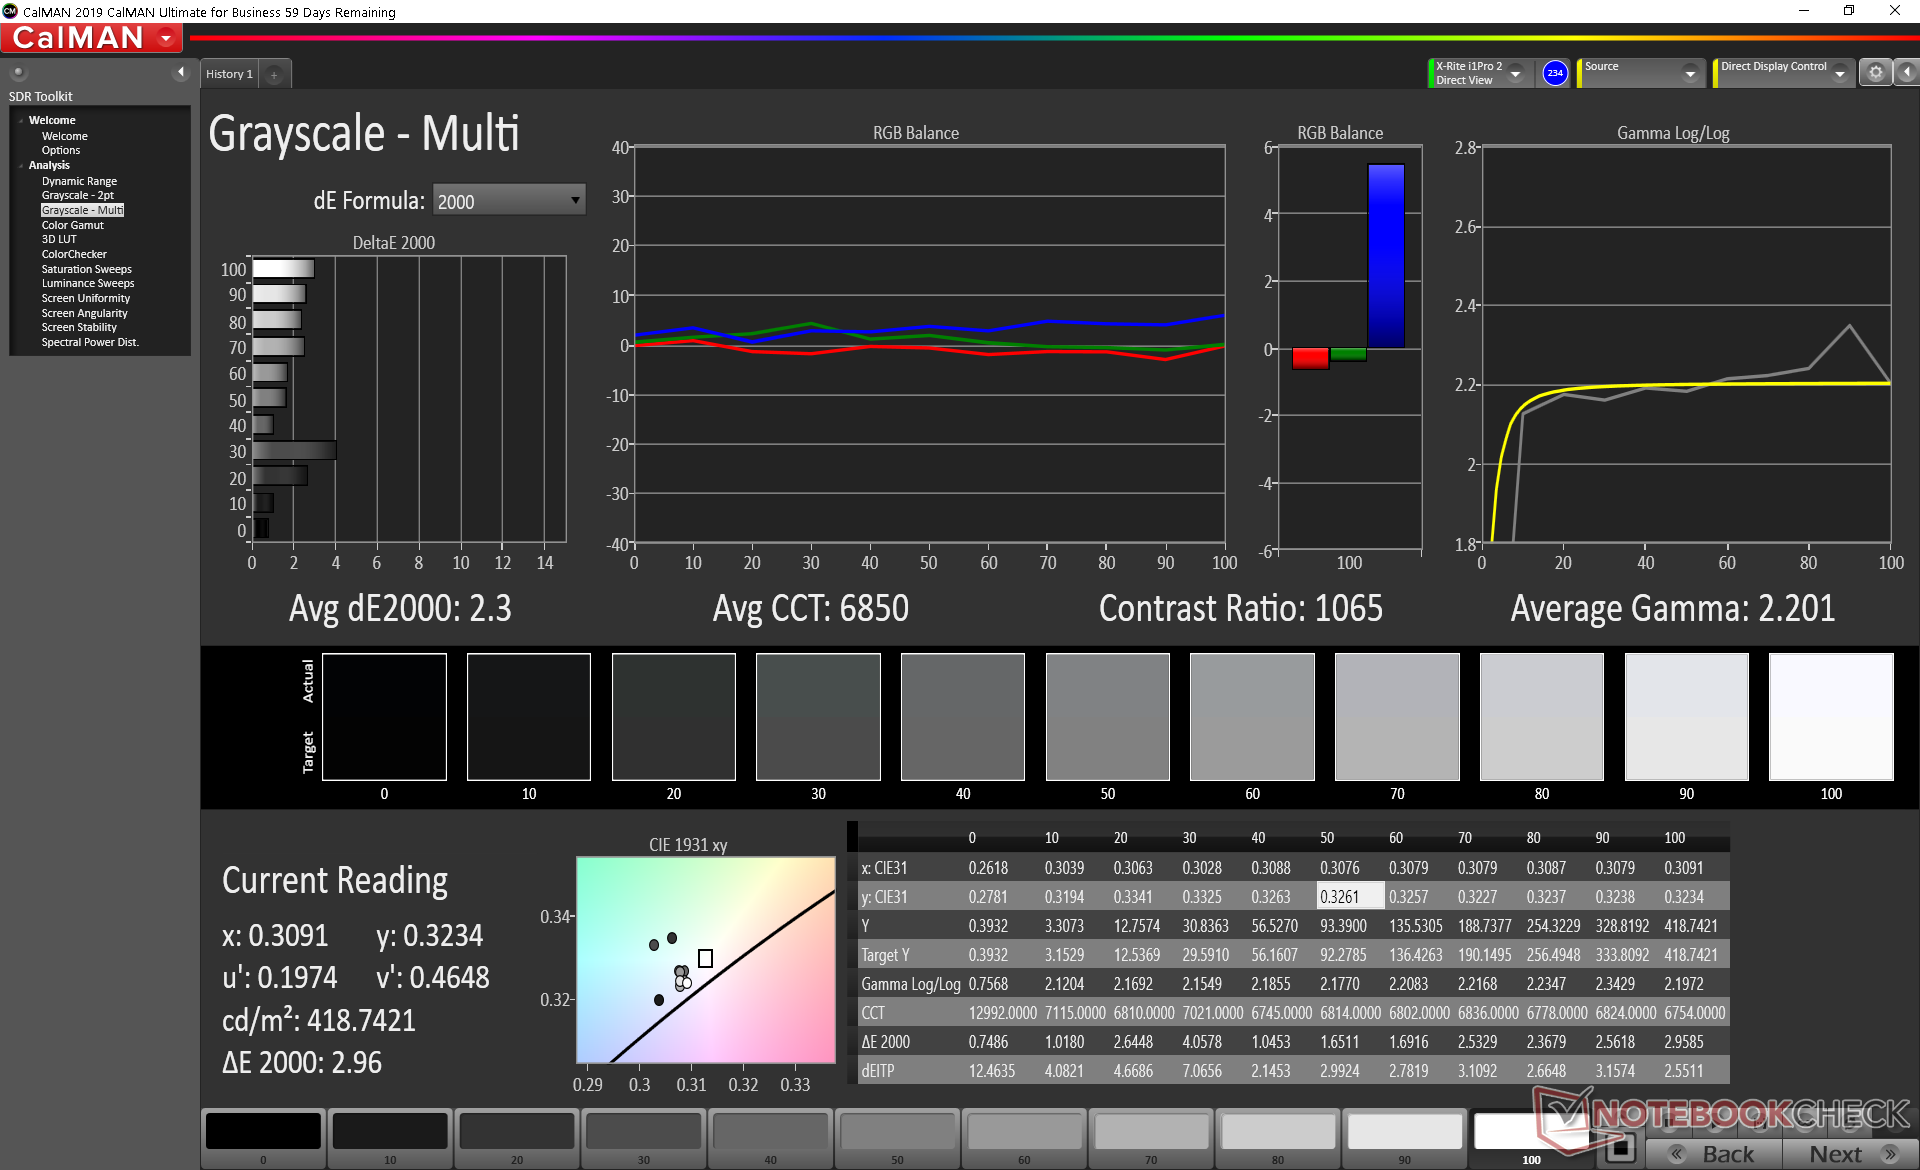
ΔE Greyscale Calman: 2 | ∀{0.09-98 Ø4.96}
97.9% sRGB (Argyll 1.6.3 3D)
84.6% AdobeRGB 1998 (Argyll 1.6.3 3D)
96.6% AdobeRGB 1998 (Argyll 3D)
98% sRGB (Argyll 3D)
82.5% Display P3 (Argyll 3D)
Gamma: 2.14
CCT: 6858 K
| MSI GT76 Titan DT 10SGS AU Optronics B173ZAN03.3, IPS, 17.3", 3840x2160 | Asus ROG G703GXR AU Optronics B173HAN04.0 (AUO409D), IPS, 17.3", 1920x1080 | Alienware Area-51m i9-9900K RTX 2080 LG Philips 173WFG, IPS, 17.3", 1920x1080 | Asus Strix Scar 17 G732LXS LQ173M1JW03 (SHP14DC), IPS, 17.3", 1920x1080 | Schenker XMG Pro 17 PB71RD-G AU Optronics B173HAN04.0 (AUO409D), IPS, 17.3", 1920x1080 | MSI GE75 9SG Chi Mei N173HCE-G33, AHVA, 17.3", 1920x1080 | MSI GT76 Titan DT 9SG Chi Mei N173HCE-G33 (CMN175C), IPS, 17.3", 1920x1080 | |
|---|---|---|---|---|---|---|---|
| Display | -21% | -17% | -13% | -22% | -22% | -21% | |
| Display P3 Coverage (%) | 82.5 | 63.2 -23% | 66.3 -20% | 71 -14% | 62.8 -24% | 61.5 -25% | 62.3 -24% |
| sRGB Coverage (%) | 98 | 92 -6% | 96.9 -1% | 99 1% | 89.8 -8% | 92 -6% | 93.4 -5% |
| AdobeRGB 1998 Coverage (%) | 96.6 | 64.7 -33% | 66.5 -31% | 71.6 -26% | 64.2 -34% | 63.5 -34% | 64.3 -33% |
| Response Times | 31% | 25% | 52% | 13% | 56% | 40% | |
| Response Time Grey 50% / Grey 80% * (ms) | 23.2 ? | 6.4 ? 72% | 13.2 ? 43% | 5.8 ? 75% | 16.8 ? 28% | 7.2 ? 69% | 8 ? 66% |
| Response Time Black / White * (ms) | 11.6 ? | 12.8 ? -10% | 10.8 ? 7% | 8.4 ? 28% | 12 ? -3% | 6.6 ? 43% | 10 ? 14% |
| PWM Frequency (Hz) | 26040 ? | 26040 ? | |||||
| Screen | -19% | -14% | -13% | -21% | 16% | 9% | |
| Brightness middle (cd/m²) | 419.5 | 290 -31% | 335.2 -20% | 310 -26% | 274 -35% | 400.7 -4% | 396 -6% |
| Brightness (cd/m²) | 413 | 281 -32% | 297 -28% | 311 -25% | 273 -34% | 372 -10% | 373 -10% |
| Brightness Distribution (%) | 93 | 91 -2% | 82 -12% | 82 -12% | 95 2% | 89 -4% | 89 -4% |
| Black Level * (cd/m²) | 0.4 | 0.2 50% | 0.66 -65% | 0.41 -2% | 0.26 35% | 0.34 15% | 0.33 17% |
| Contrast (:1) | 1049 | 1450 38% | 508 -52% | 756 -28% | 1054 0% | 1179 12% | 1200 14% |
| Colorchecker dE 2000 * | 3.4 | 4.77 -40% | 2.02 41% | 2.41 29% | 4.62 -36% | 1.33 61% | 2.04 40% |
| Colorchecker dE 2000 max. * | 7.4 | 9.08 -23% | 7.23 2% | 8.59 -16% | 7.66 -4% | 3.51 53% | 3.85 48% |
| Colorchecker dE 2000 calibrated * | 3.28 | 1.46 55% | 1.17 64% | 1.13 66% | 1.93 41% | 1.39 58% | 0.82 75% |
| Greyscale dE 2000 * | 2 | 5.83 -192% | 3.2 -60% | 4.3 -115% | 5.3 -165% | 1.3 35% | 2.83 -42% |
| Gamma | 2.14 103% | 2.47 89% | 2.16 102% | 2.149 102% | 2.34 94% | 2.24 98% | 2.49 88% |
| CCT | 6858 95% | 8076 80% | 6746 96% | 7059 92% | 7619 85% | 6735 97% | 7113 91% |
| Color Space (Percent of AdobeRGB 1998) (%) | 84.6 | 59 -30% | 61.3 -28% | 72 -15% | 58 -31% | 58.2 -31% | 59 -30% |
| Color Space (Percent of sRGB) (%) | 97.9 | 92 -6% | 96.9 -1% | 94 -4% | 90 -8% | 92.1 -6% | 94 -4% |
| Media totale (Programma / Settaggio) | -3% /
-13% | -2% /
-10% | 9% /
-5% | -10% /
-17% | 17% /
14% | 9% /
7% |
* ... Meglio usare valori piccoli
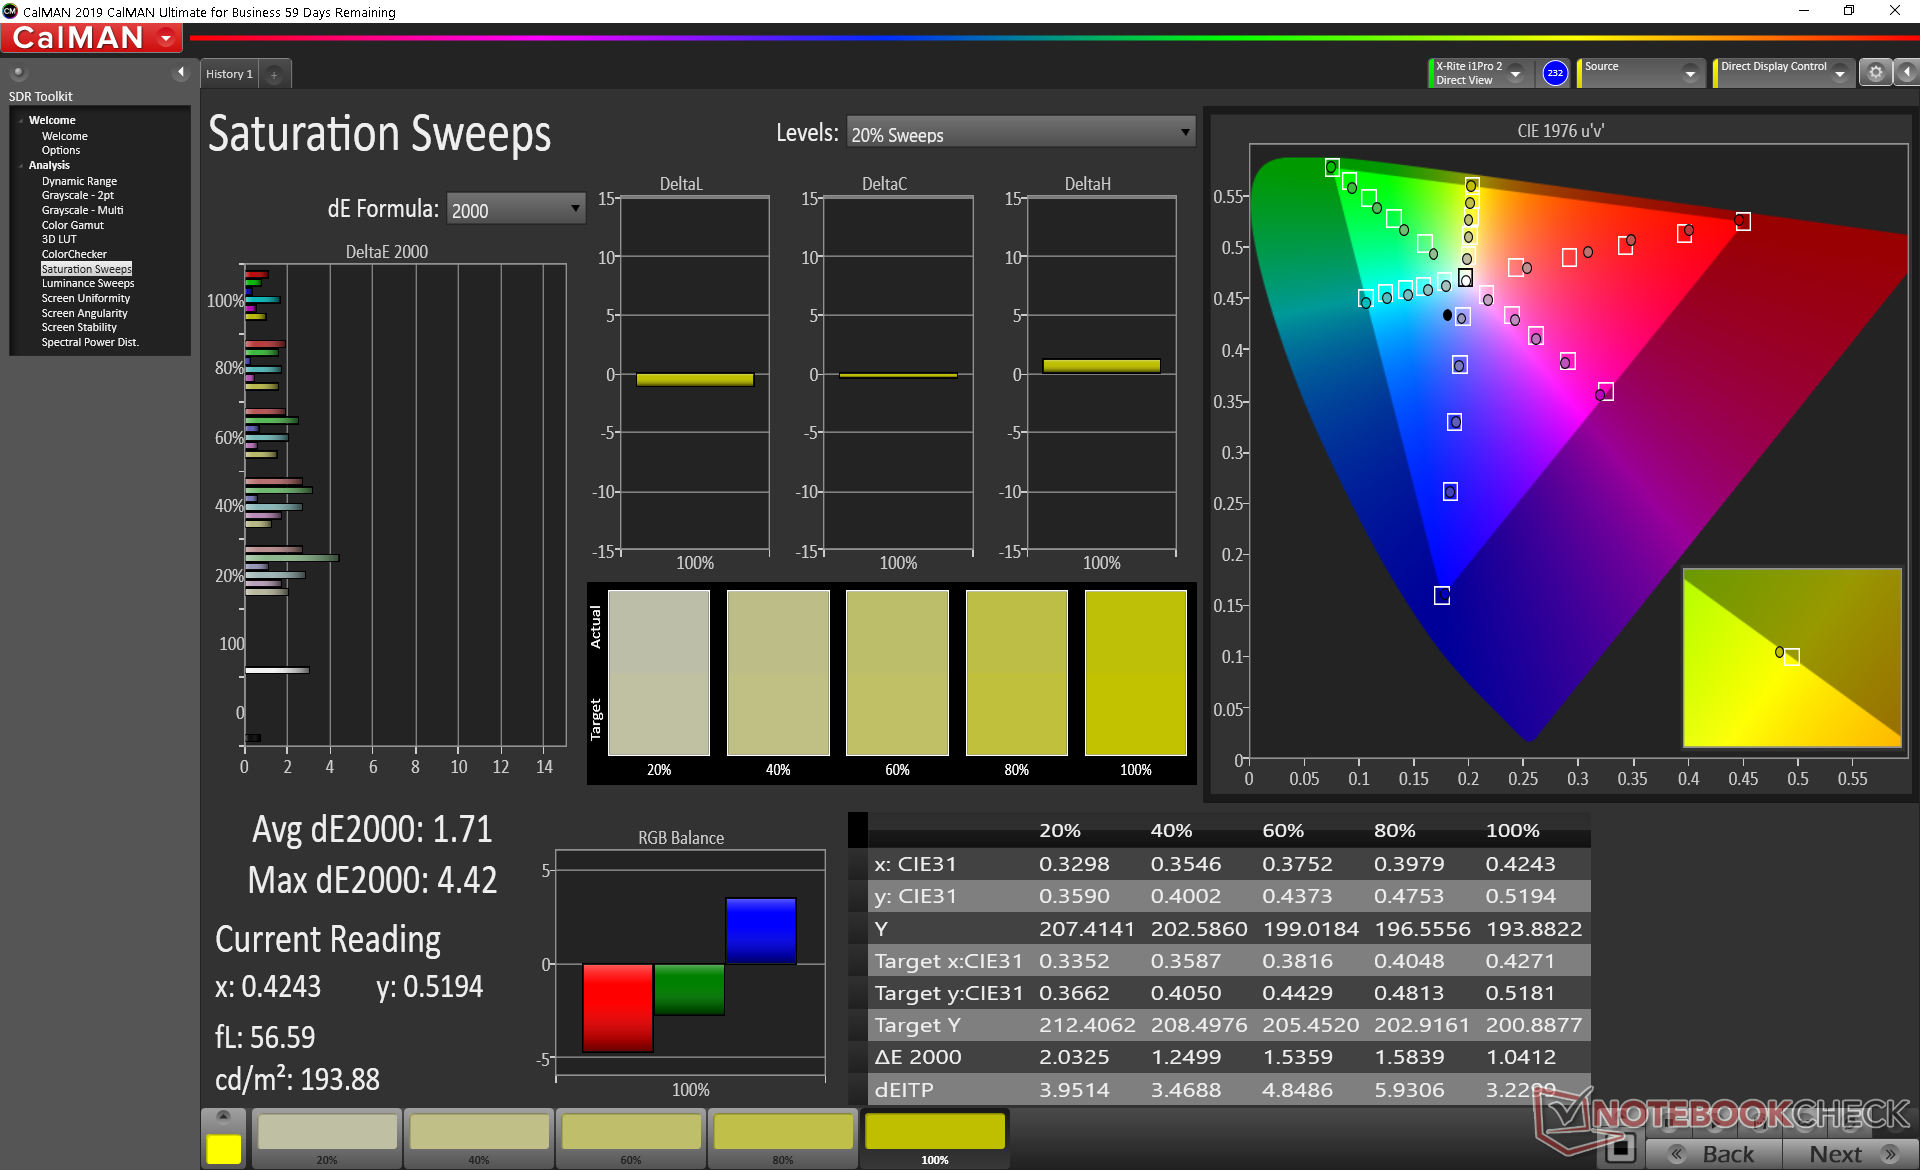
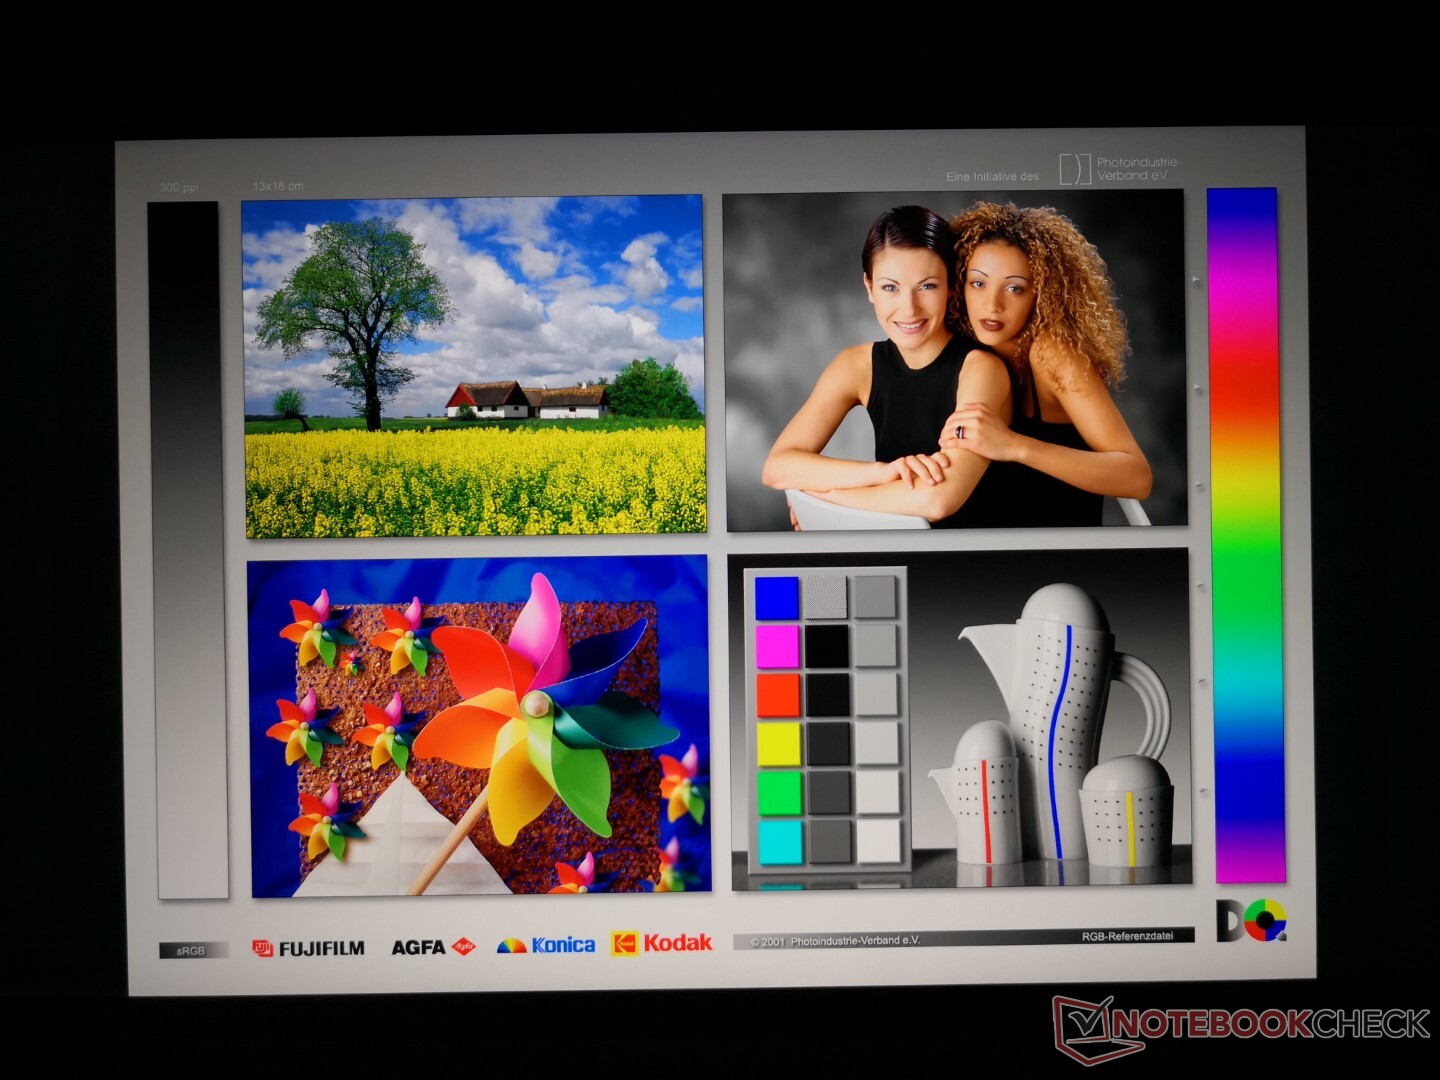
Lo spazio colore è ampio a circa l'85% dello standard 3D AdobeRGB rispetto al 59% dell'opzione 1080p dello scorso anno. MSI True Color consente di regolare i colori e i profili in modo semplice e veloce.
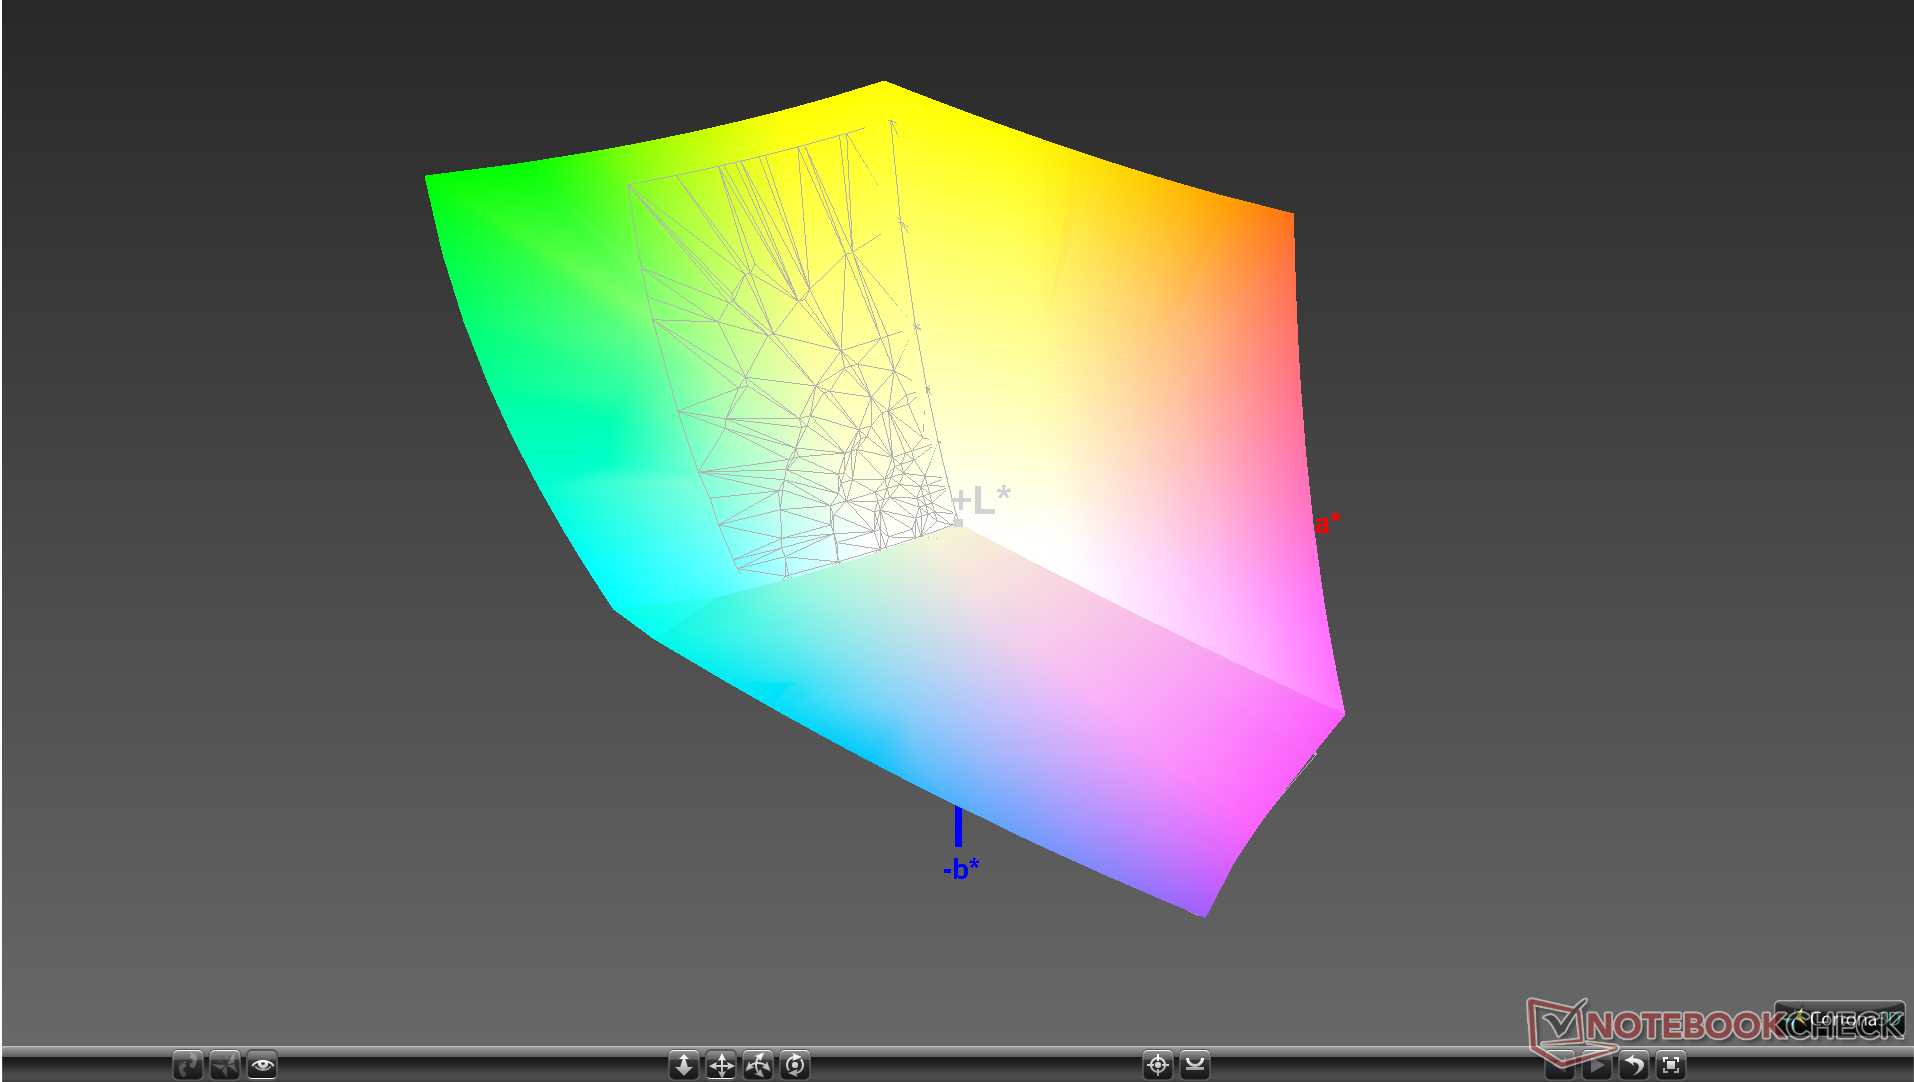
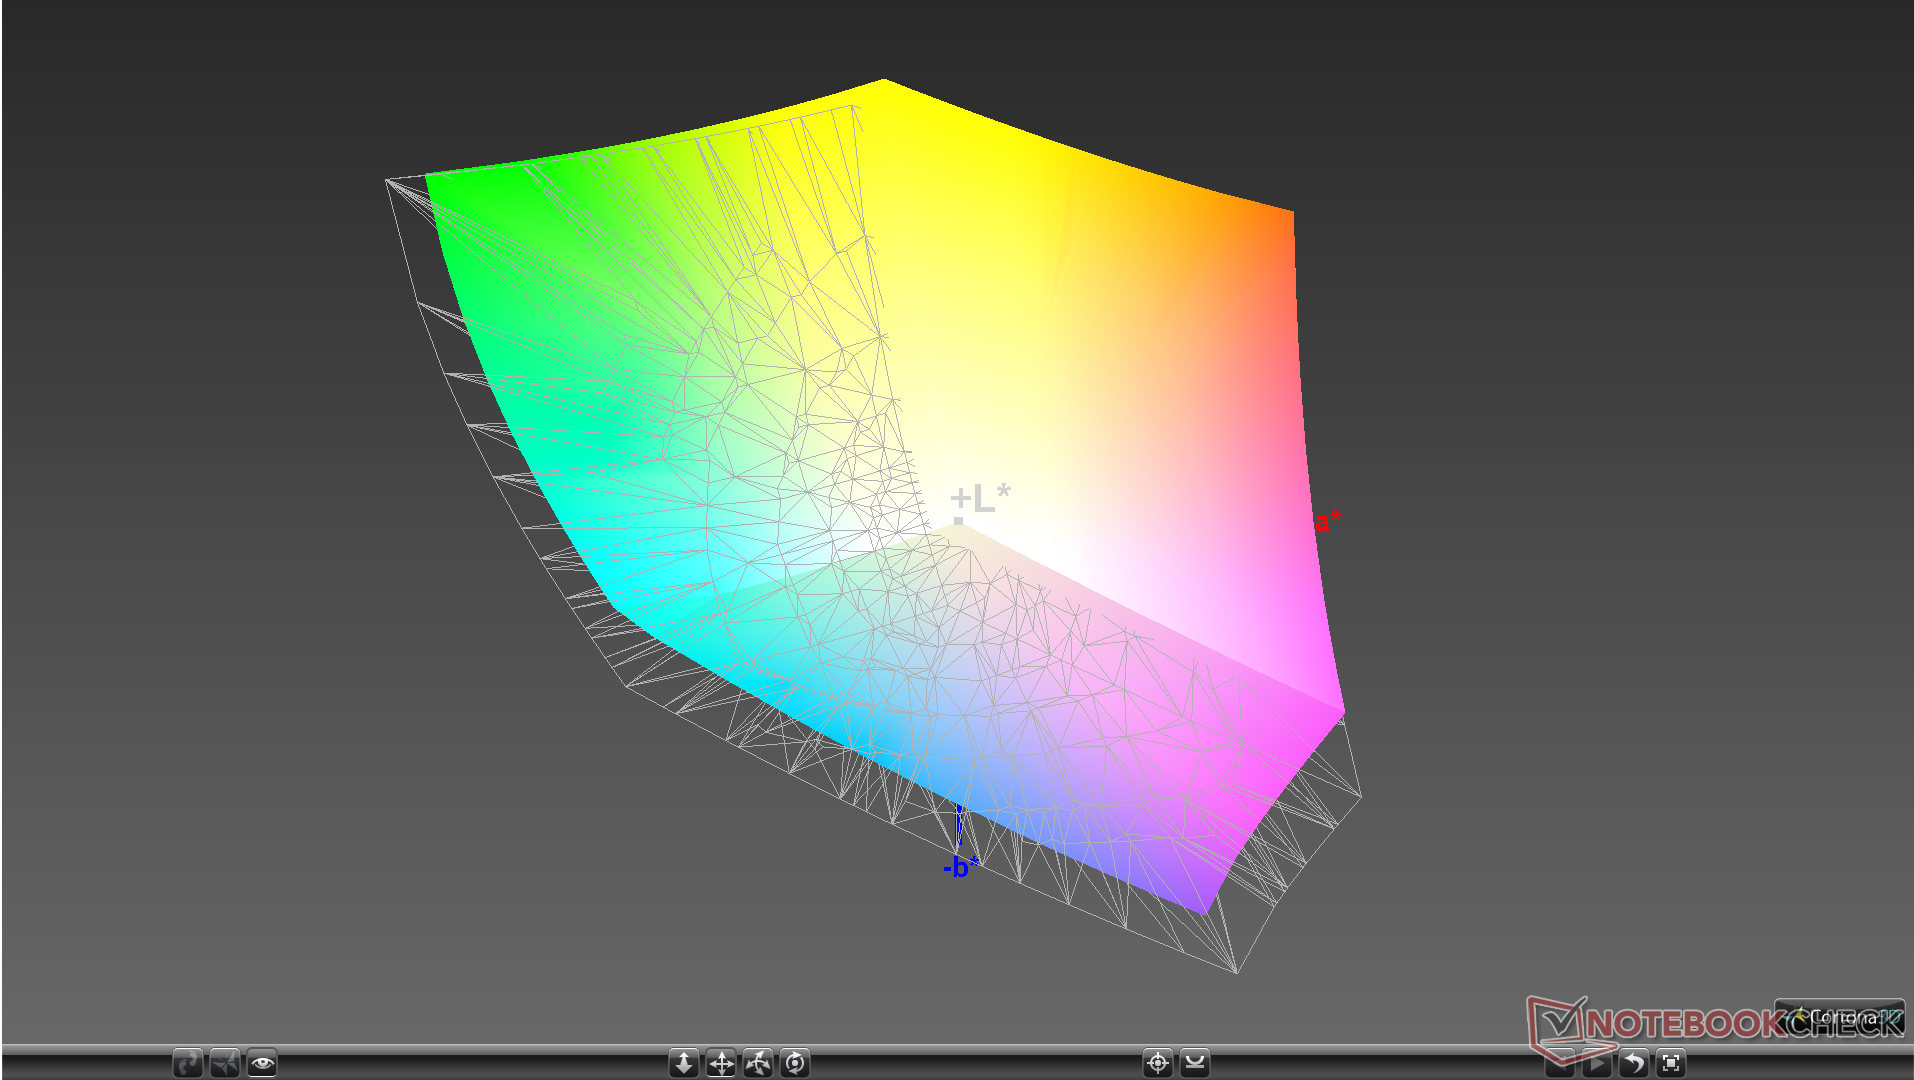
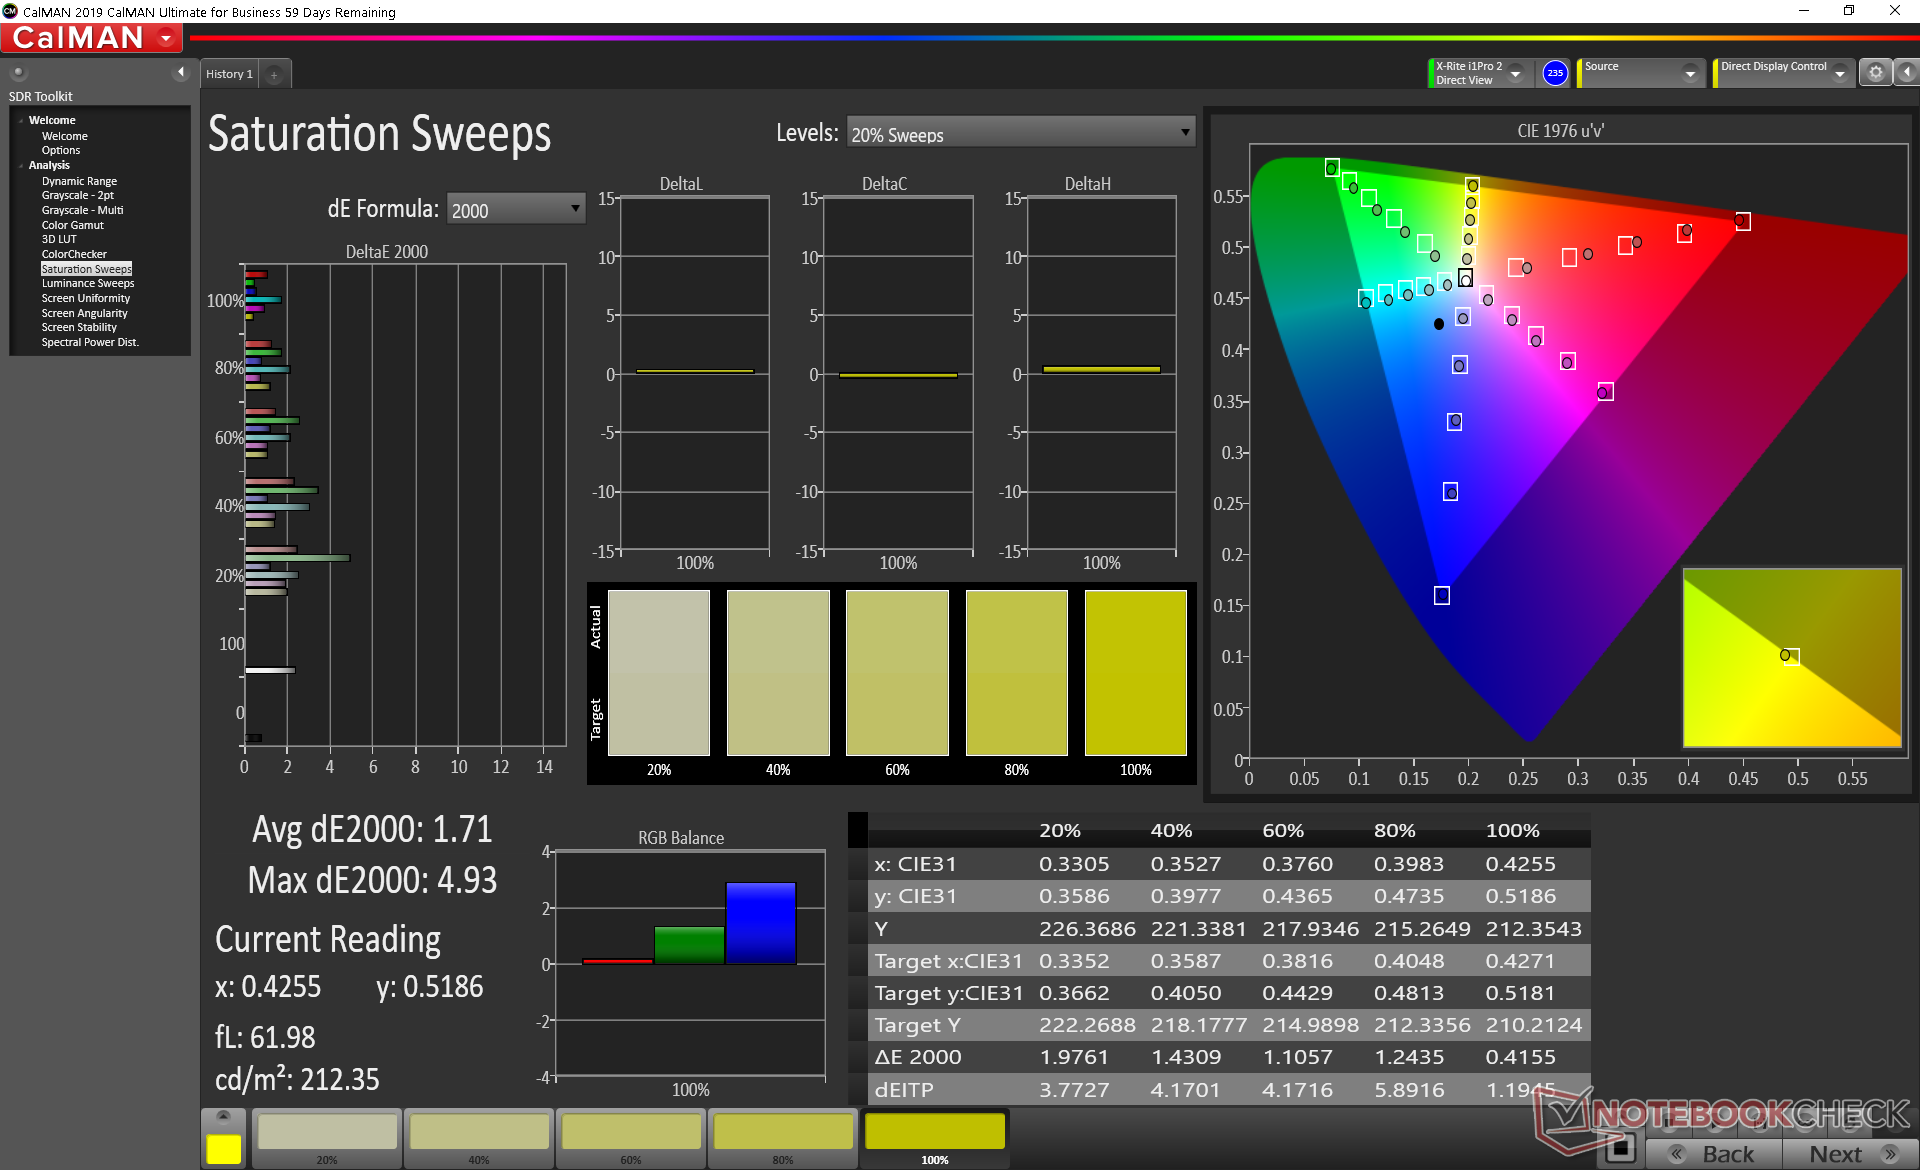
Le misurazioni dei colorimetri X-Rite rivelano un display ben calibrato con valori medi di scala di grigi e deltaE di colore di soli 2 e 3,2, rispettivamente. Calibrando ulteriormente il pannello non si otterrebbe alcun miglioramento notevole.

Tempi di risposta del Display
| ↔ Tempi di risposta dal Nero al Bianco | ||
|---|---|---|
| 11.6 ms ... aumenta ↗ e diminuisce ↘ combinato | ↗ 6.4 ms Incremento | 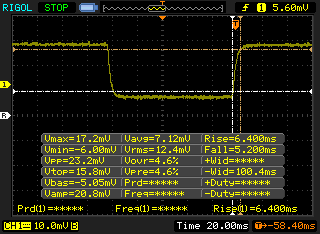 |
| ↘ 5.2 ms Calo | ||
| Lo schermo mostra buoni tempi di risposta durante i nostri tests, ma potrebbe essere troppo lento per i gamers competitivi. In confronto, tutti i dispositivi di test variano da 0.1 (minimo) a 240 (massimo) ms. » 31 % di tutti i dispositivi è migliore. Questo significa che i tempi di risposta rilevati sono migliori rispettto alla media di tutti i dispositivi testati (19.8 ms). | ||
| ↔ Tempo di risposta dal 50% Grigio all'80% Grigio | ||
| 23.2 ms ... aumenta ↗ e diminuisce ↘ combinato | ↗ 12.4 ms Incremento | 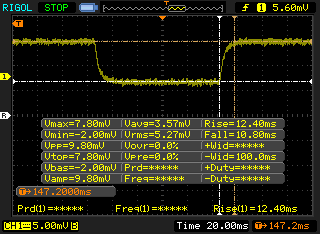 |
| ↘ 10.8 ms Calo | ||
| Lo schermo mostra buoni tempi di risposta durante i nostri tests, ma potrebbe essere troppo lento per i gamers competitivi. In confronto, tutti i dispositivi di test variano da 0.165 (minimo) a 636 (massimo) ms. » 34 % di tutti i dispositivi è migliore. Questo significa che i tempi di risposta rilevati sono migliori rispettto alla media di tutti i dispositivi testati (30.9 ms). | ||
Sfarfallio dello schermo / PWM (Pulse-Width Modulation)
| flickering dello schermo / PWM non rilevato | 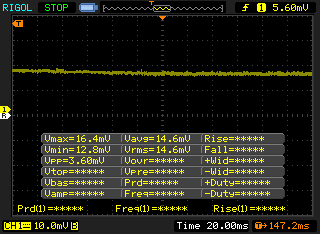 | ||
In confronto: 52 % di tutti i dispositivi testati non utilizza PWM per ridurre la luminosita' del display. Se è rilevato PWM, una media di 7748 (minimo: 5 - massimo: 343500) Hz è stata rilevata. | |||
Prestazioni
Processore
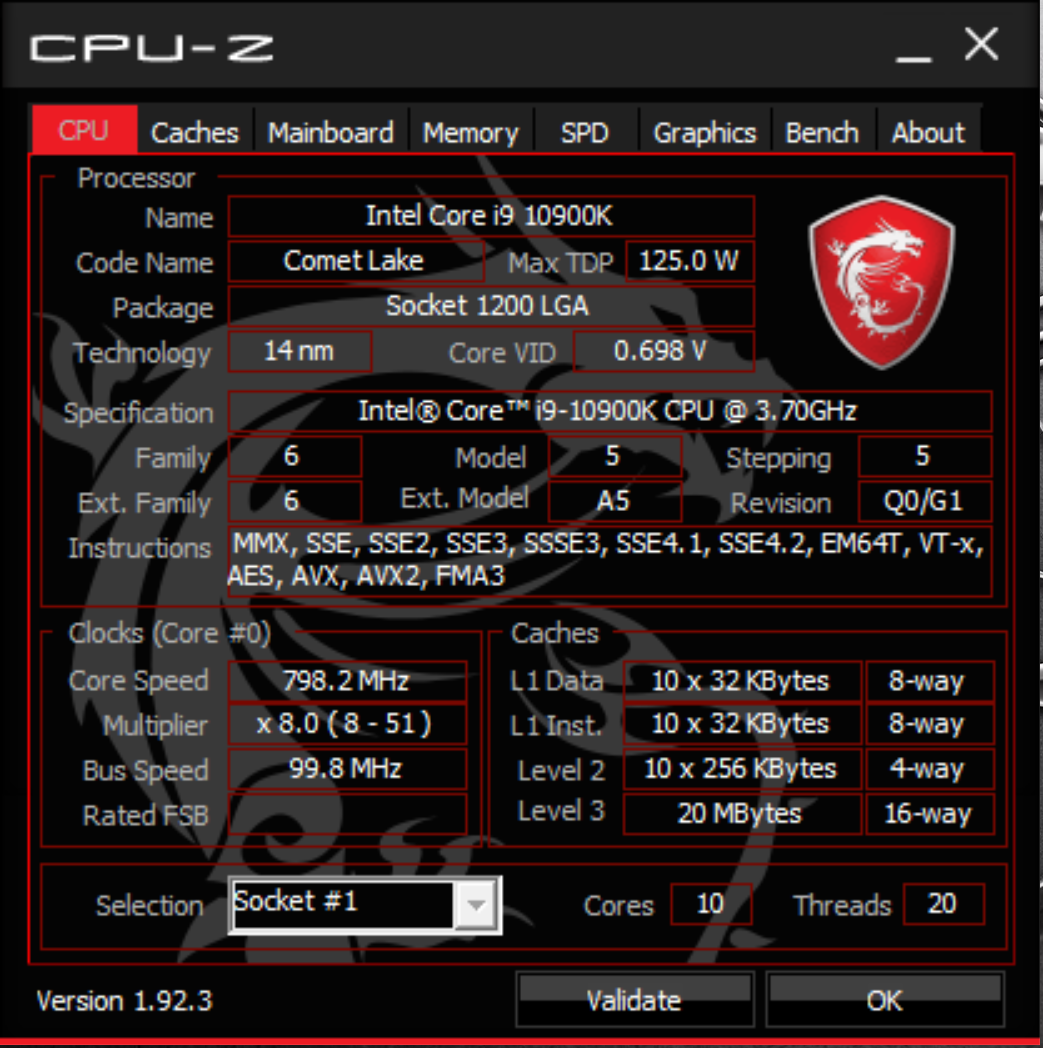
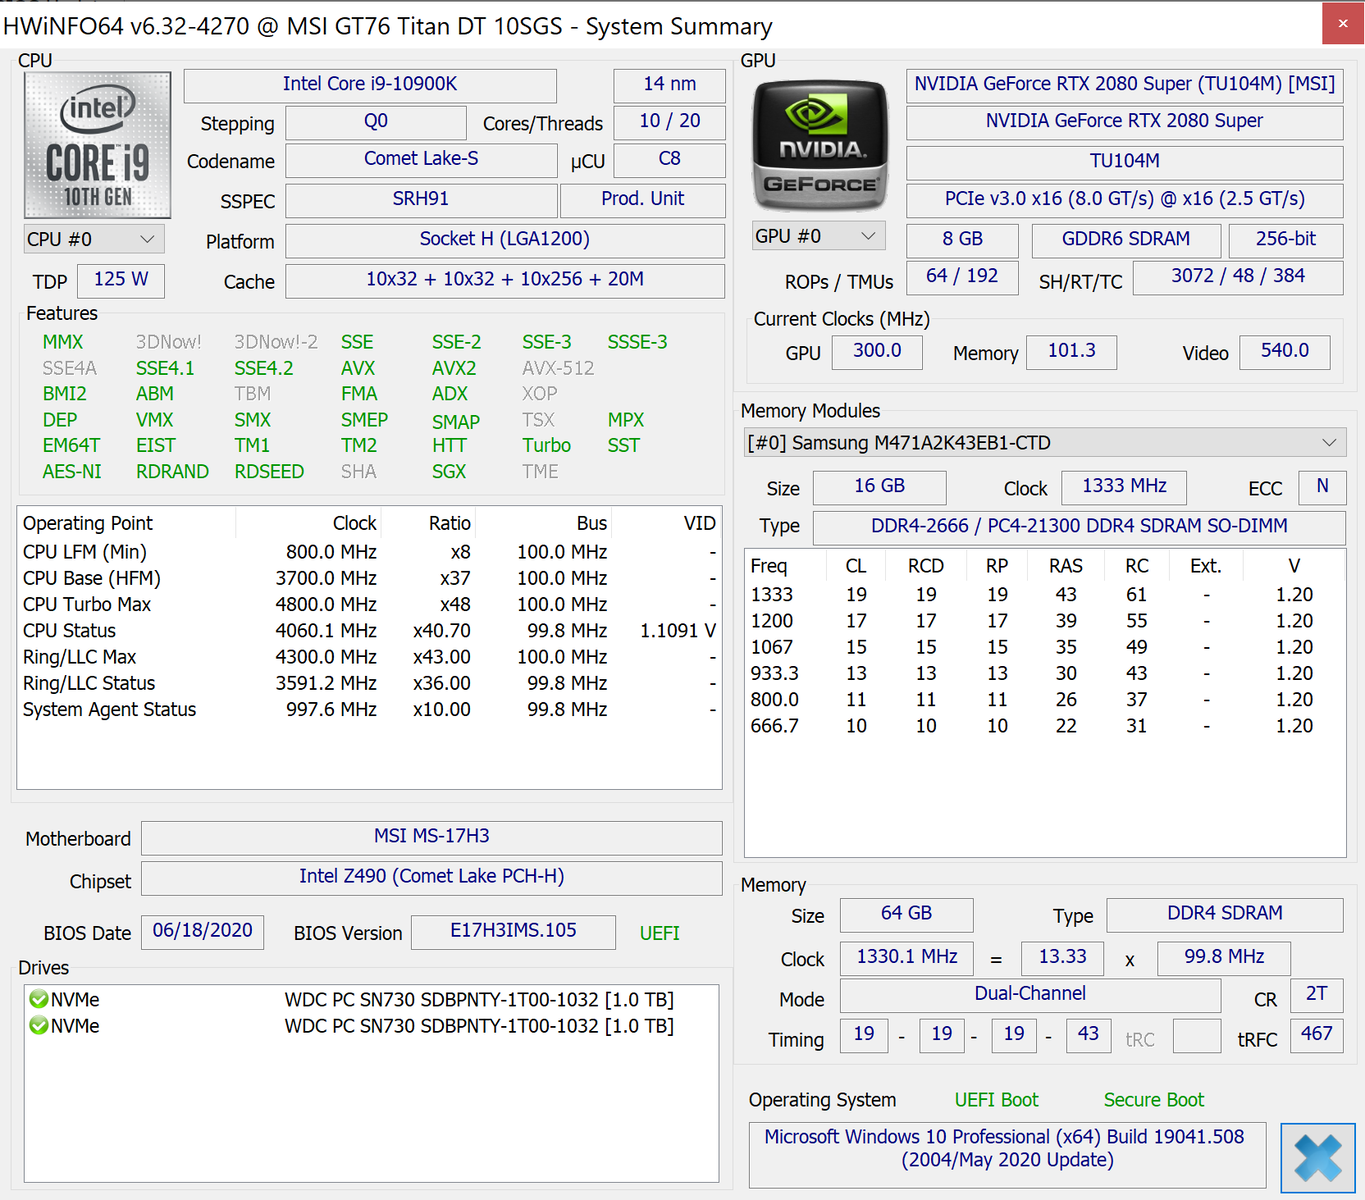
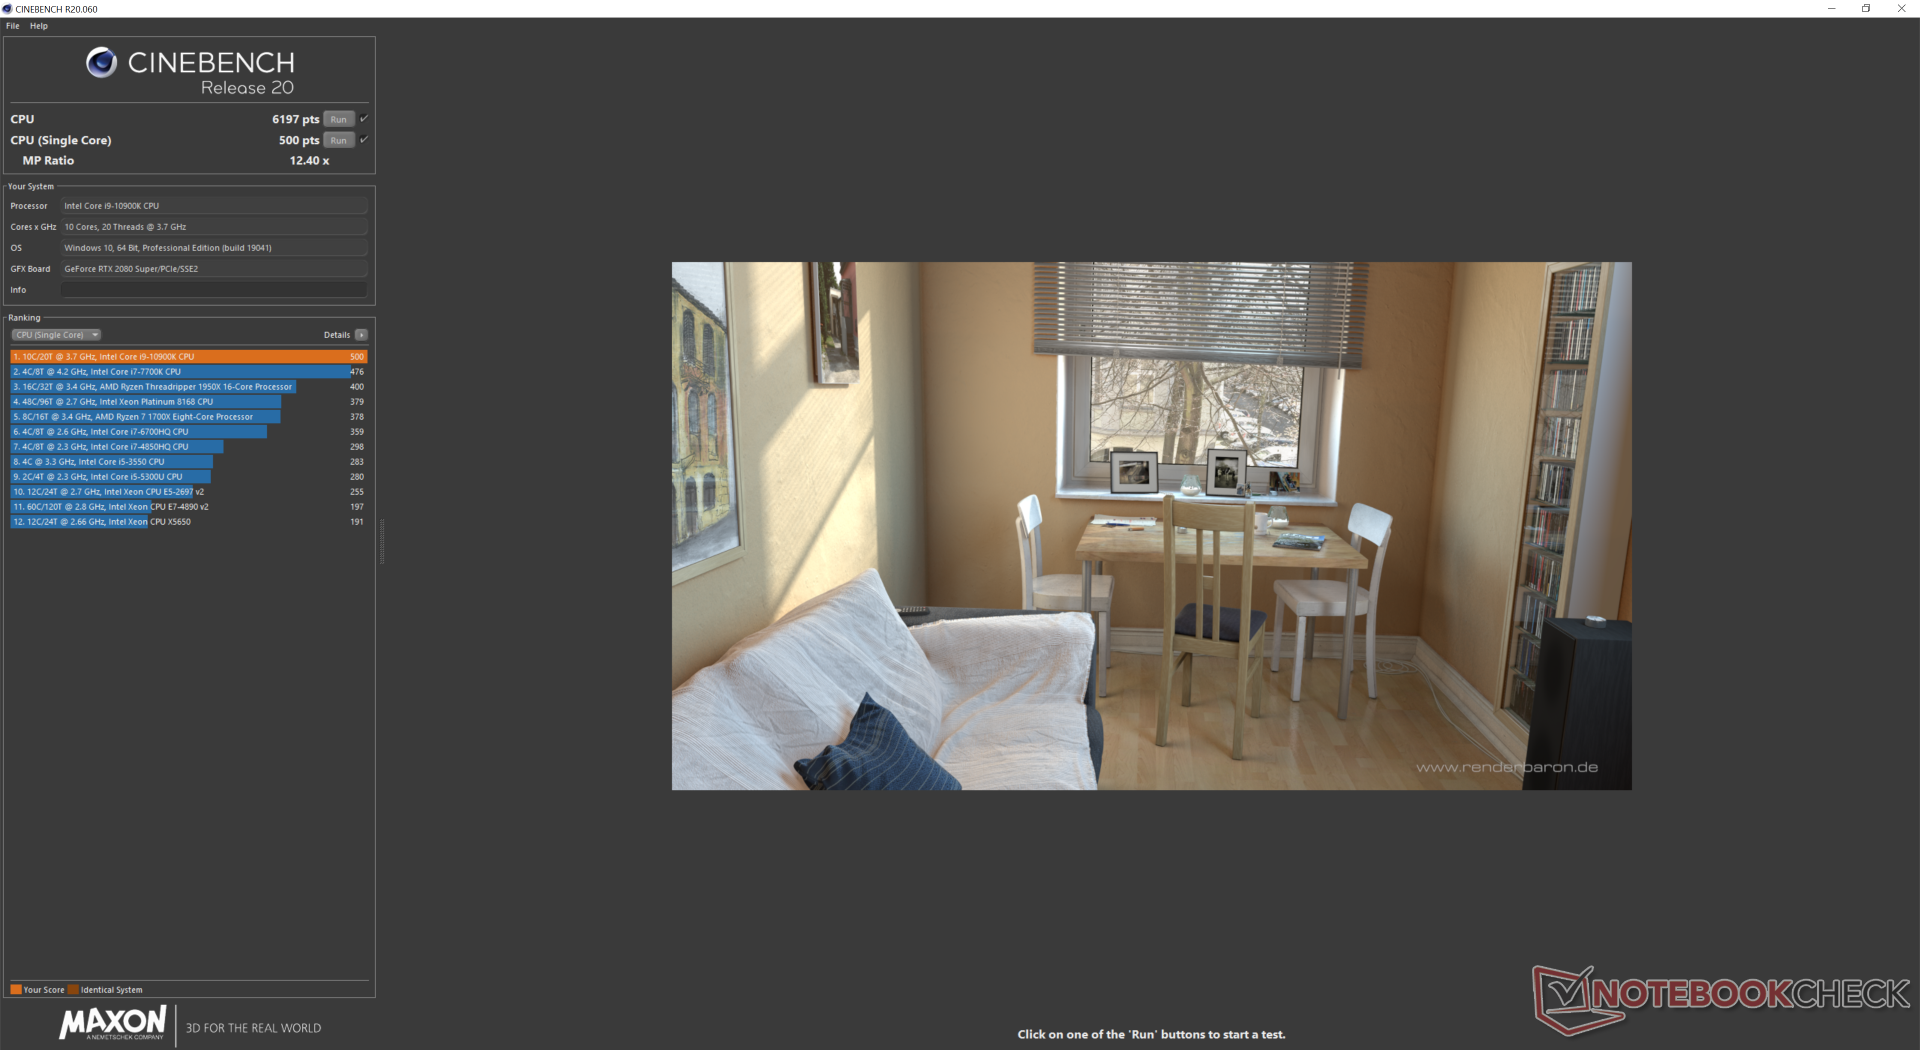
Rispetto al nostro desktop Core i9-10900K di riferimento, le prestazioni della CPU nel GT76 sono solo circa il 5-6% più lente. I cores fisici aggiuntivi (10 contro 8) garantiscono prestazioni multithread più veloci di circa il 25% rispetto al Core i9-9900K del GT76 dell'anno scorso, mentre le prestazioni single-core rimangono più o meno le stesse. La sostenibilità delle prestazioni è eccellente, senza grandi cali di prestazioni nel tempo.
Consultate la nostra pagina dedicata al Core i9-10900K per ulteriori informazioni tecniche e benchmarks. Gli utenti possono sostituire la CPU del GT76 in quanto utilizza un socket FCLGA1200 standard, ma è necessario rimuovere prima l'intera soluzione di raffreddamento.
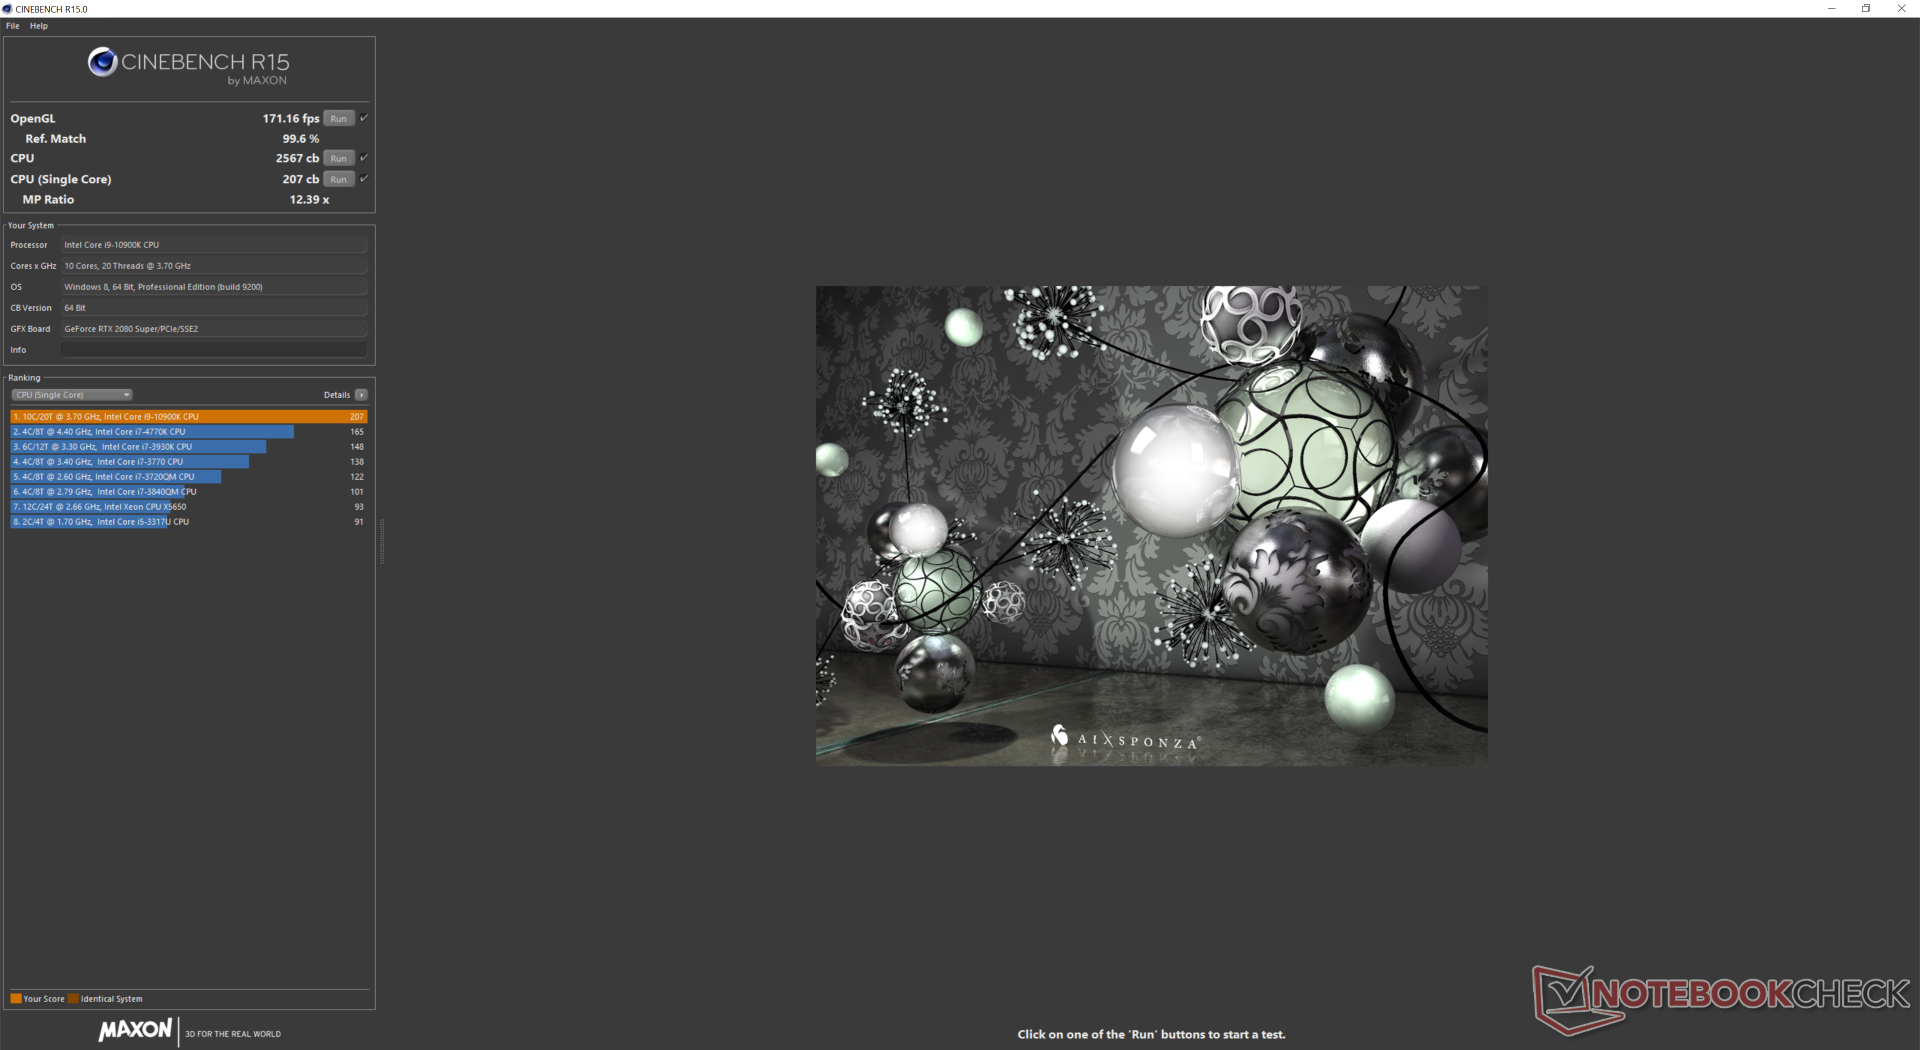
Cinebench R15: CPU Multi 64Bit | CPU Single 64Bit
Blender: v2.79 BMW27 CPU
7-Zip 18.03: 7z b 4 -mmt1 | 7z b 4
Geekbench 5.5: Single-Core | Multi-Core
HWBOT x265 Benchmark v2.2: 4k Preset
LibreOffice : 20 Documents To PDF
R Benchmark 2.5: Overall mean
| Cinebench R20 / CPU (Single Core) | |
| Media Intel Core i9-10900K (493 - 532, n=3) | |
| MSI GT76 Titan DT 9SG | |
| Eurocom Sky X4C i9-9900KS | |
| KFA2 GeForce GTX 1650 EX One Click Plus | |
| Asus Zephyrus G14 GA401IV | |
| MSI GT76 Titan DT 10SGS | |
| Eluktronics RP-17 | |
| Alienware m17 R2 P41E | |
| MSI GE65 Raider 9SF-049US | |
| Alienware m17 R3 P45E | |
| Gigabyte Aero 15-Y9 | |
| Blender / v2.79 BMW27 CPU | |
| Asus Zephyrus G14 GA401IV | |
| Eluktronics RP-17 | |
| Eurocom Sky X4C i9-9900KS | |
| Alienware m17 R3 P45E | |
| MSI GT76 Titan DT 10SGS | |
| Media Intel Core i9-10900K (167.3 - 190, n=3) | |
| KFA2 GeForce GTX 1650 EX One Click Plus | |
| 7-Zip 18.03 / 7z b 4 -mmt1 | |
| Media Intel Core i9-10900K (5349 - 5954, n=3) | |
| Eurocom Sky X4C i9-9900KS | |
| Alienware m17 R3 P45E | |
| MSI GT76 Titan DT 10SGS | |
| KFA2 GeForce GTX 1650 EX One Click Plus | |
| Asus Zephyrus G14 GA401IV | |
| Eluktronics RP-17 | |
| 7-Zip 18.03 / 7z b 4 | |
| KFA2 GeForce GTX 1650 EX One Click Plus | |
| Media Intel Core i9-10900K (67252 - 70968, n=3) | |
| MSI GT76 Titan DT 10SGS | |
| Eurocom Sky X4C i9-9900KS | |
| Eluktronics RP-17 | |
| Asus Zephyrus G14 GA401IV | |
| Alienware m17 R3 P45E | |
| Geekbench 5.5 / Single-Core | |
| Media Intel Core i9-10900K (1336 - 1449, n=3) | |
| Eurocom Sky X4C i9-9900KS | |
| Alienware m17 R3 P45E | |
| MSI GT76 Titan DT 10SGS | |
| MSI GT76 Titan DT 9SG | |
| KFA2 GeForce GTX 1650 EX One Click Plus | |
| KFA2 GeForce GTX 1650 EX One Click Plus | |
| Asus Zephyrus G14 GA401IV | |
| Eluktronics RP-17 | |
| HWBOT x265 Benchmark v2.2 / 4k Preset | |
| KFA2 GeForce GTX 1650 EX One Click Plus | |
| MSI GT76 Titan DT 10SGS | |
| Media Intel Core i9-10900K (18.2 - 21, n=3) | |
| Eurocom Sky X4C i9-9900KS | |
| Alienware m17 R3 P45E | |
| Eluktronics RP-17 | |
| Asus Zephyrus G14 GA401IV | |
| LibreOffice / 20 Documents To PDF | |
| Eluktronics RP-17 | |
| KFA2 GeForce GTX 1650 EX One Click Plus | |
| Media Intel Core i9-10900K (46.2 - 76, n=3) | |
| Alienware m17 R3 P45E | |
| MSI GT76 Titan DT 10SGS | |
| R Benchmark 2.5 / Overall mean | |
| Eluktronics RP-17 | |
| MSI GT76 Titan DT 10SGS | |
| Alienware m17 R3 P45E | |
| Media Intel Core i9-10900K (0.528 - 0.567, n=3) | |
| KFA2 GeForce GTX 1650 EX One Click Plus | |
* ... Meglio usare valori piccoli
Prestazioni di sistema
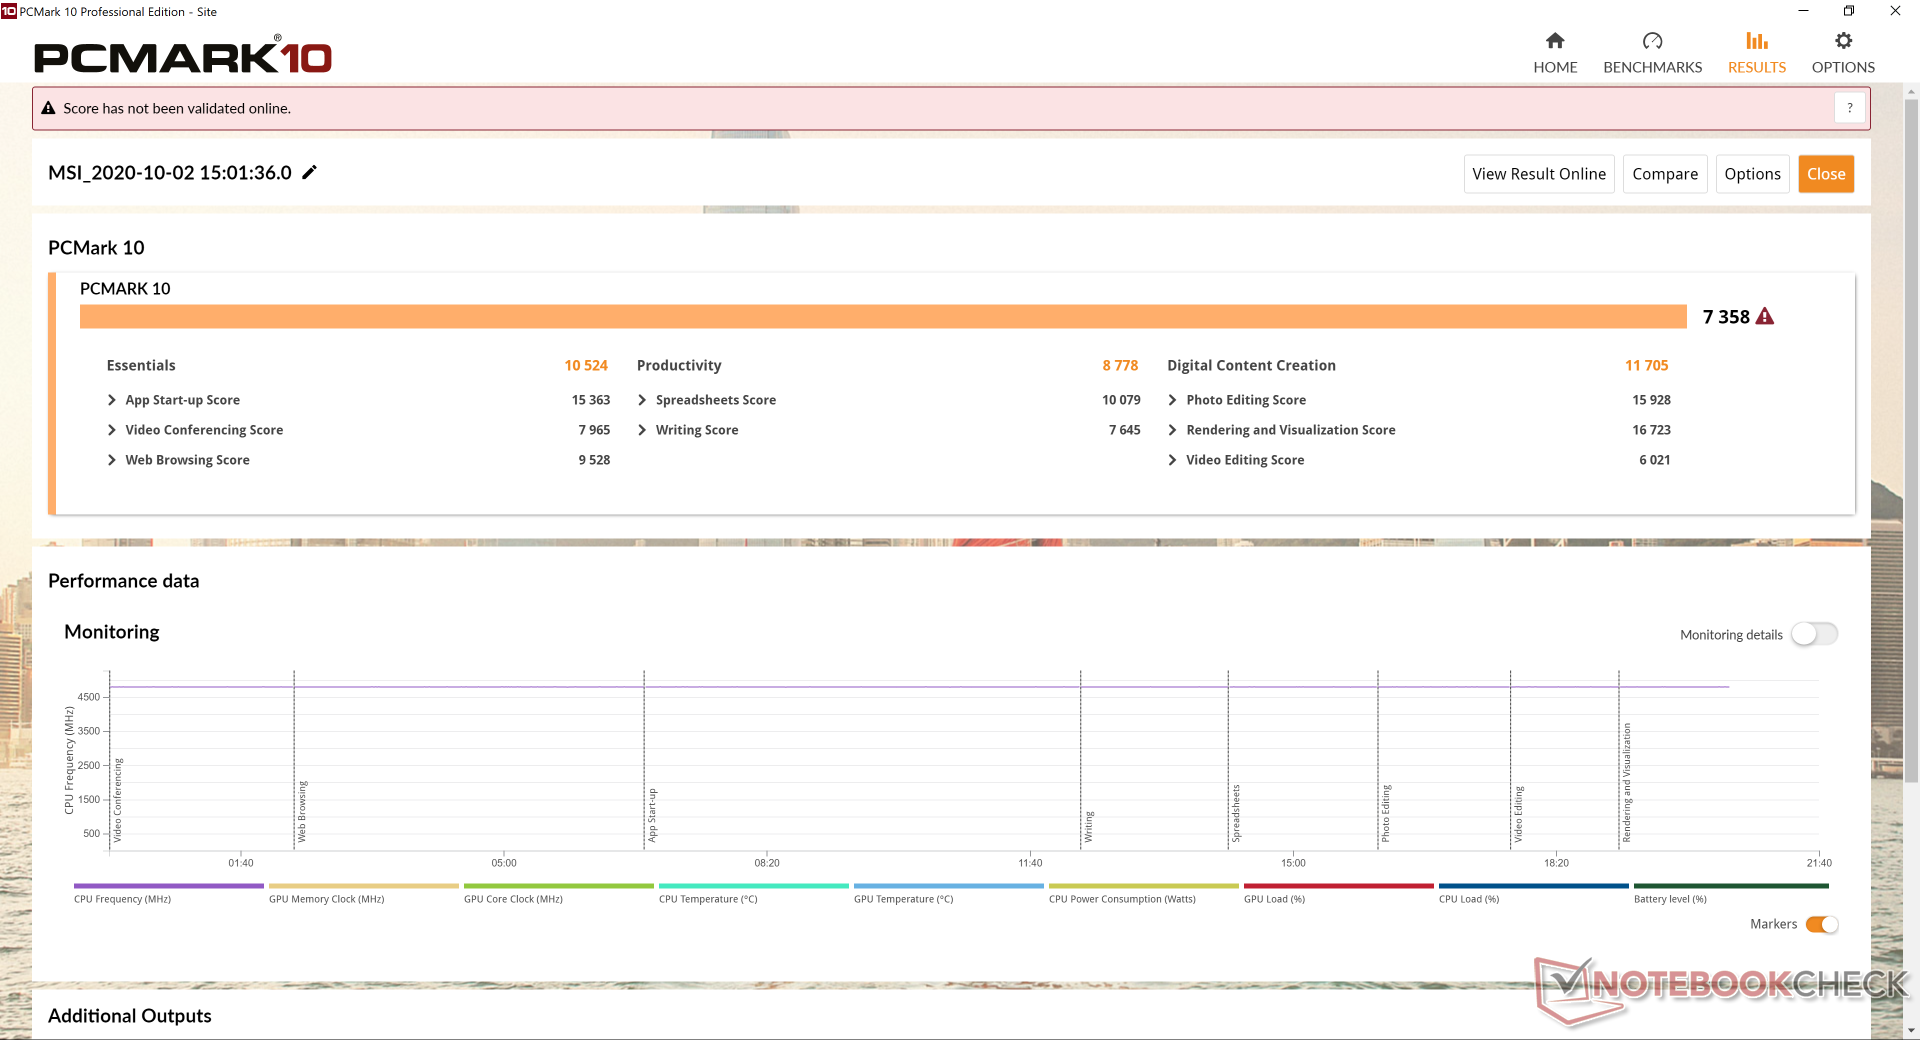
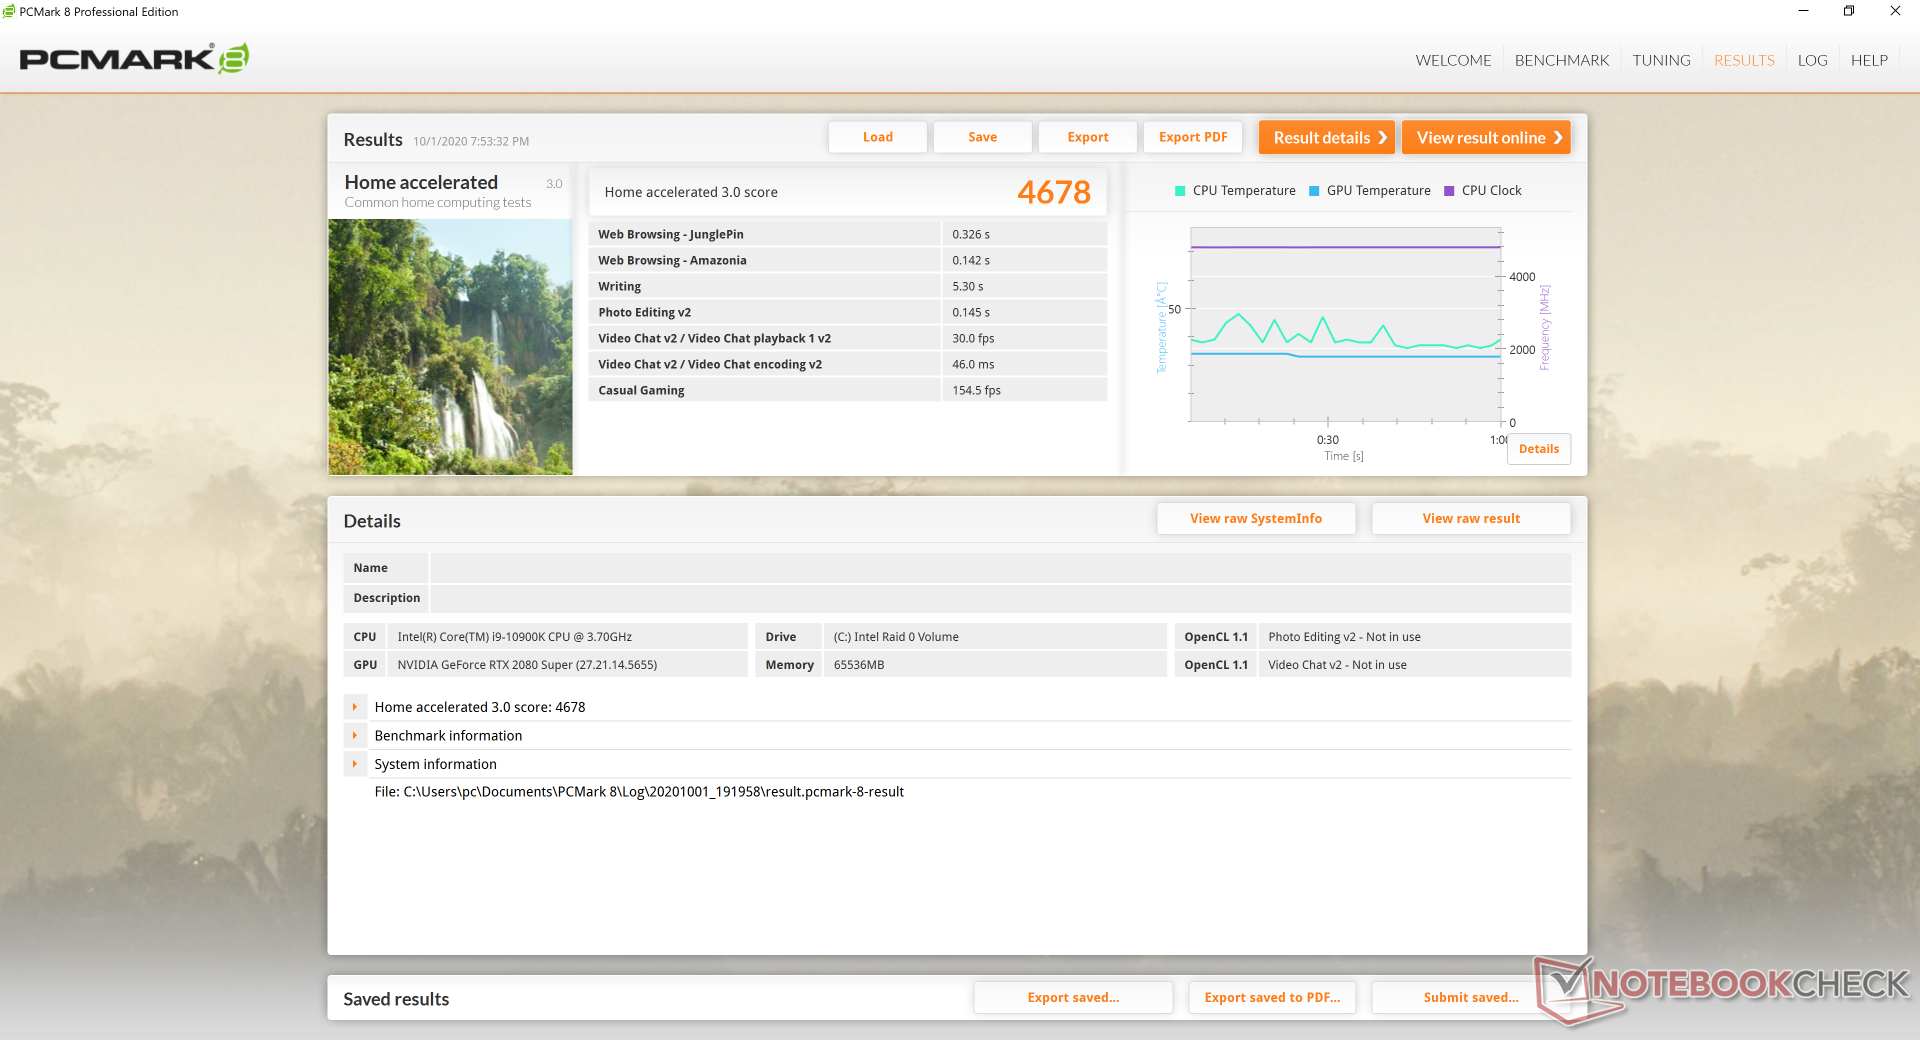
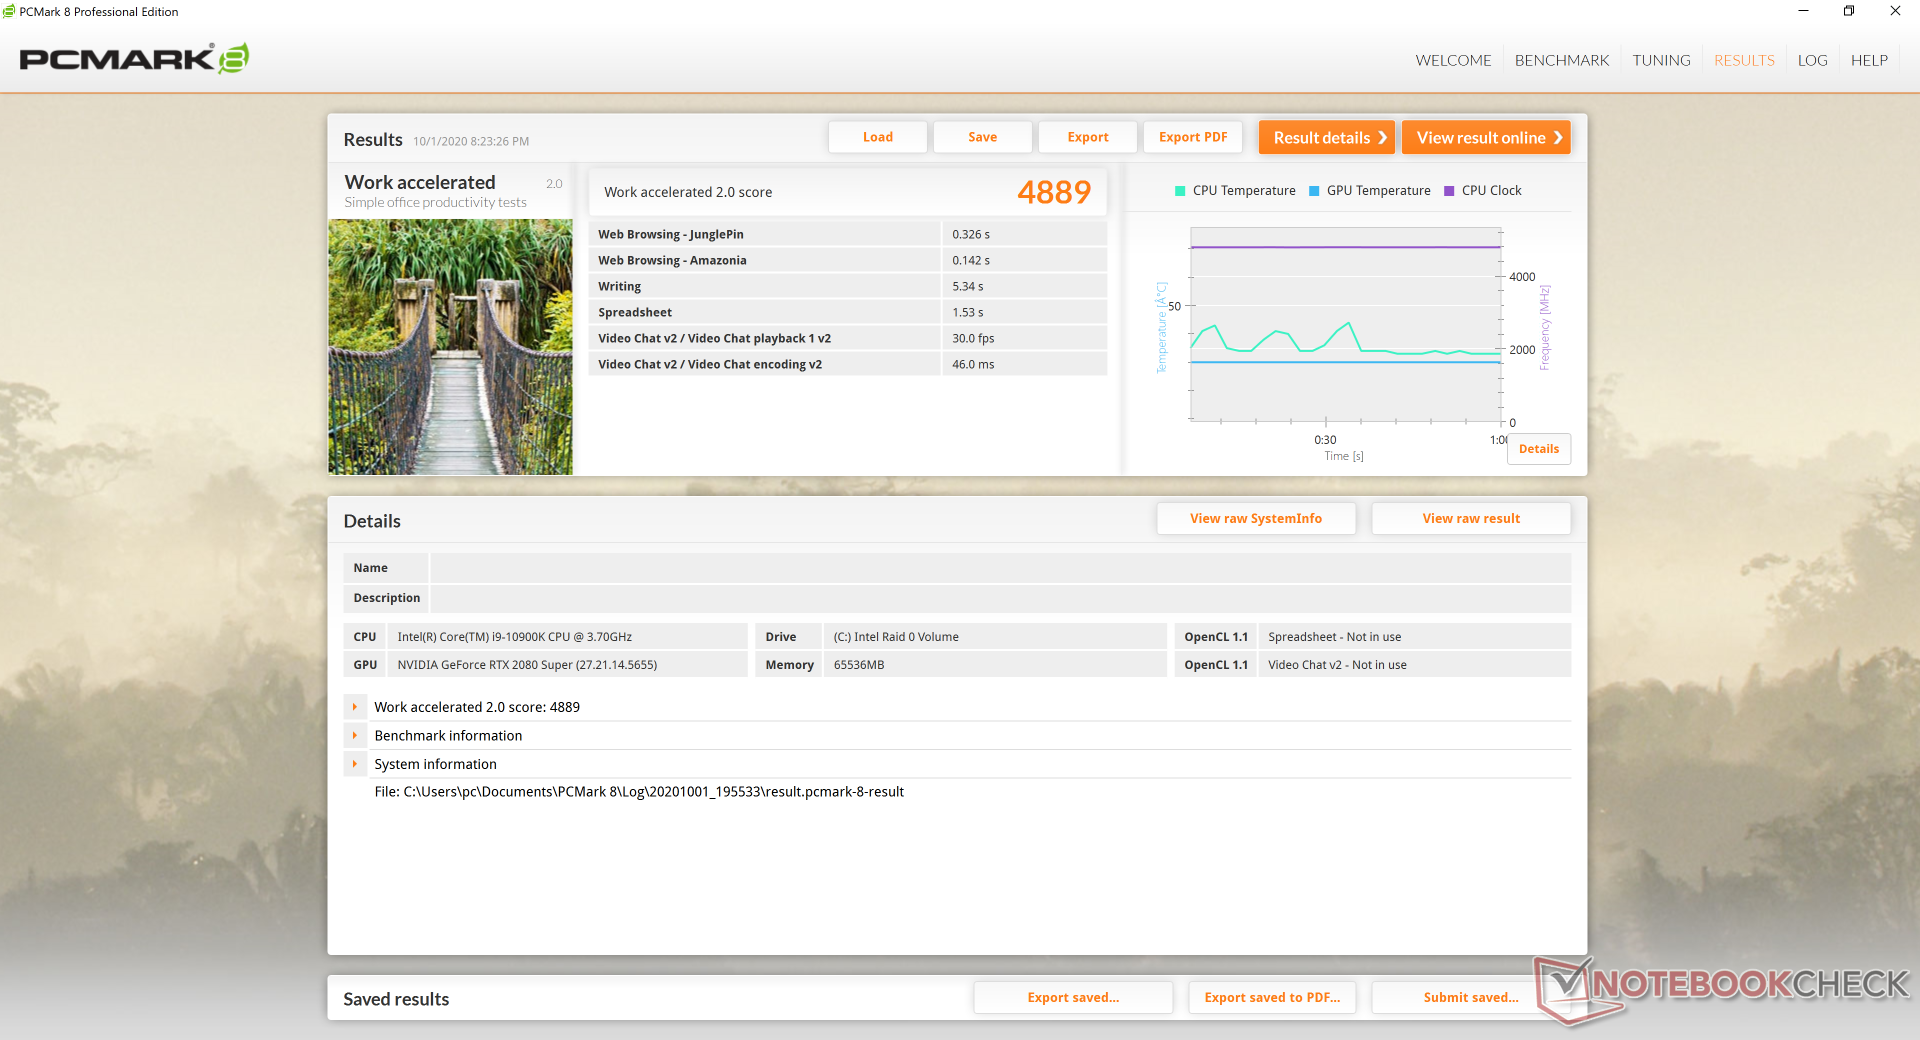
I risultati di PCMark sono tra i più alti che abbiamo registrato su qualsiasi portatile da gioco con punteggi costantemente superiori sia al GT76 9SG che all'Alienware Area-51m. Tuttavia, le differenze sono per lo più marginali.
| PCMark 8 | |
| Home Score Accelerated v2 | |
| Alienware Area-51m i9-9900K RTX 2080 | |
| Media della classe Gaming (n=1ultimi 2 anni) | |
| MSI GT76 Titan DT 10SGS | |
| MSI GE75 9SG | |
| Work Score Accelerated v2 | |
| Alienware Area-51m i9-9900K RTX 2080 | |
| MSI GE75 9SG | |
| MSI GT76 Titan DT 10SGS | |
| Media della classe Gaming (n=1ultimi 2 anni) | |
| PCMark 8 Home Score Accelerated v2 | 4678 punti | |
| PCMark 8 Work Score Accelerated v2 | 4889 punti | |
| PCMark 10 Score | 7358 punti | |
Aiuto | ||
Latenza DPC
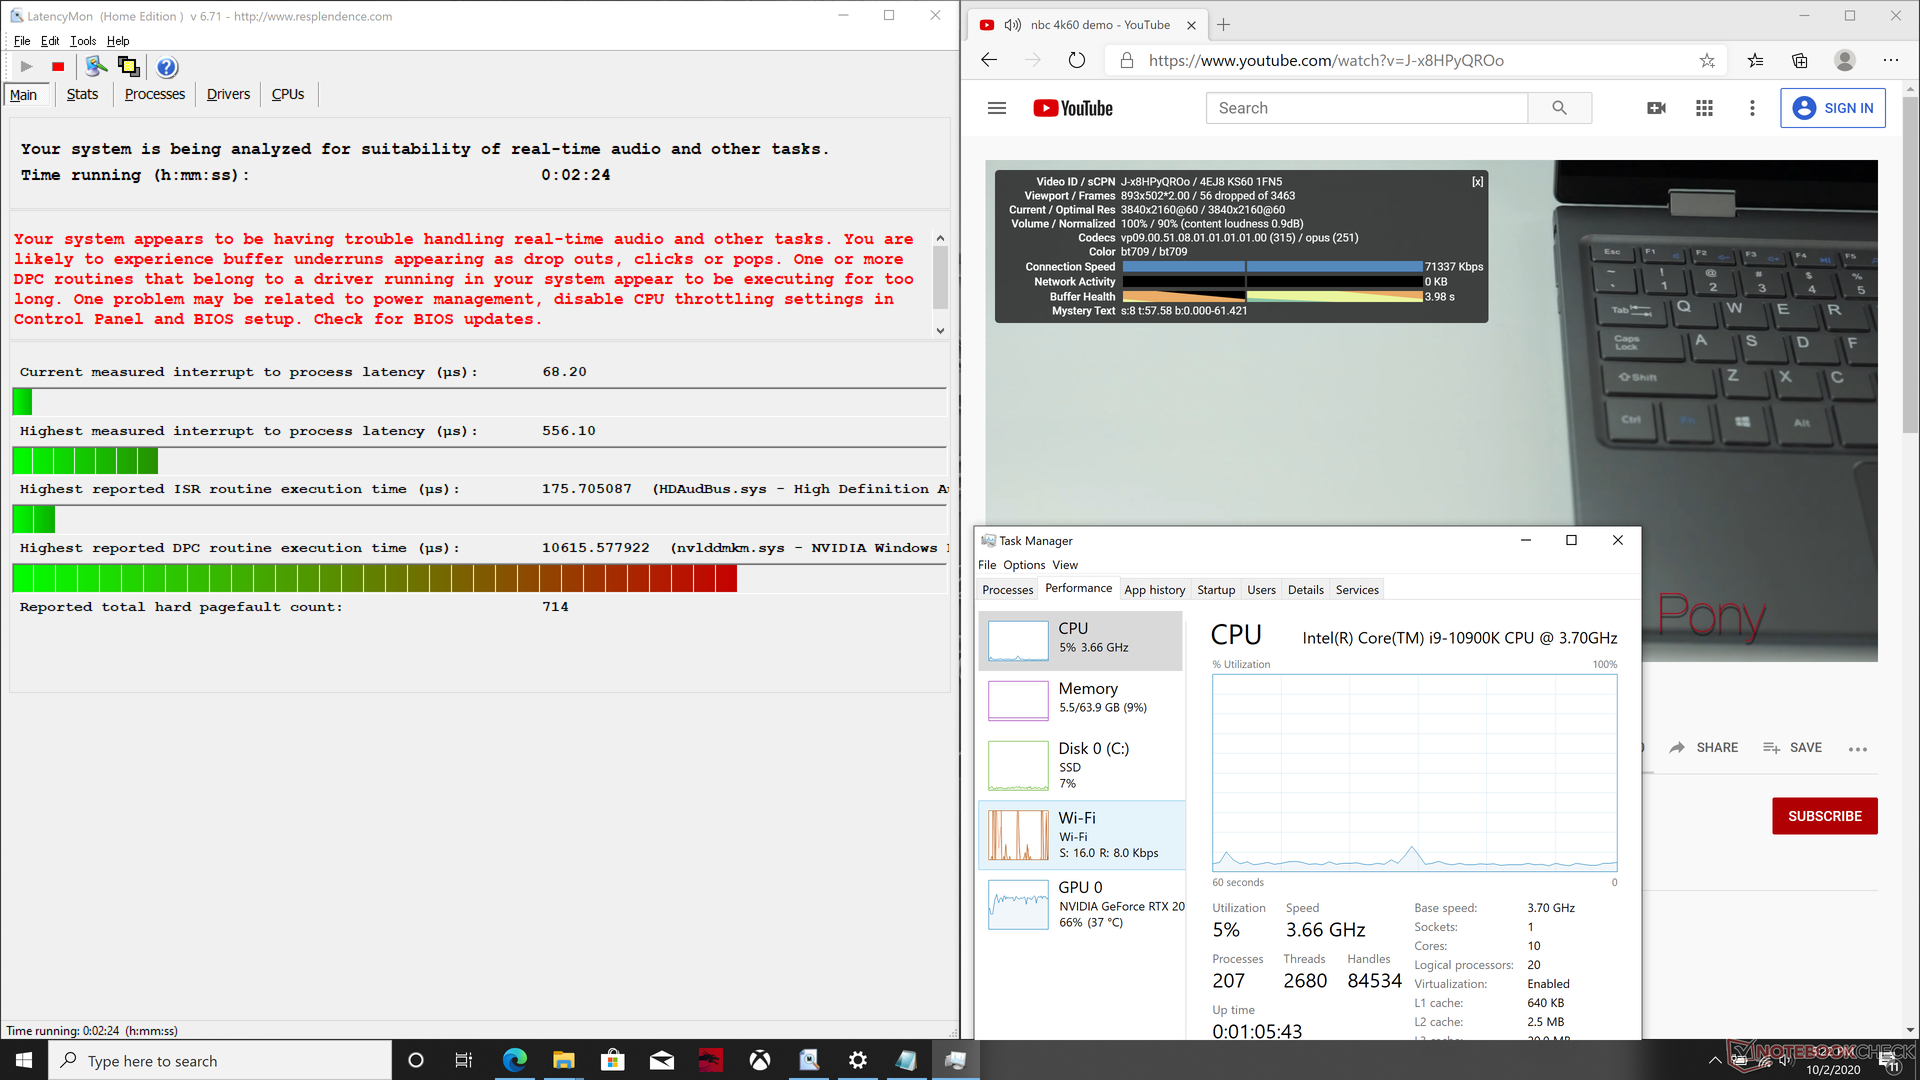
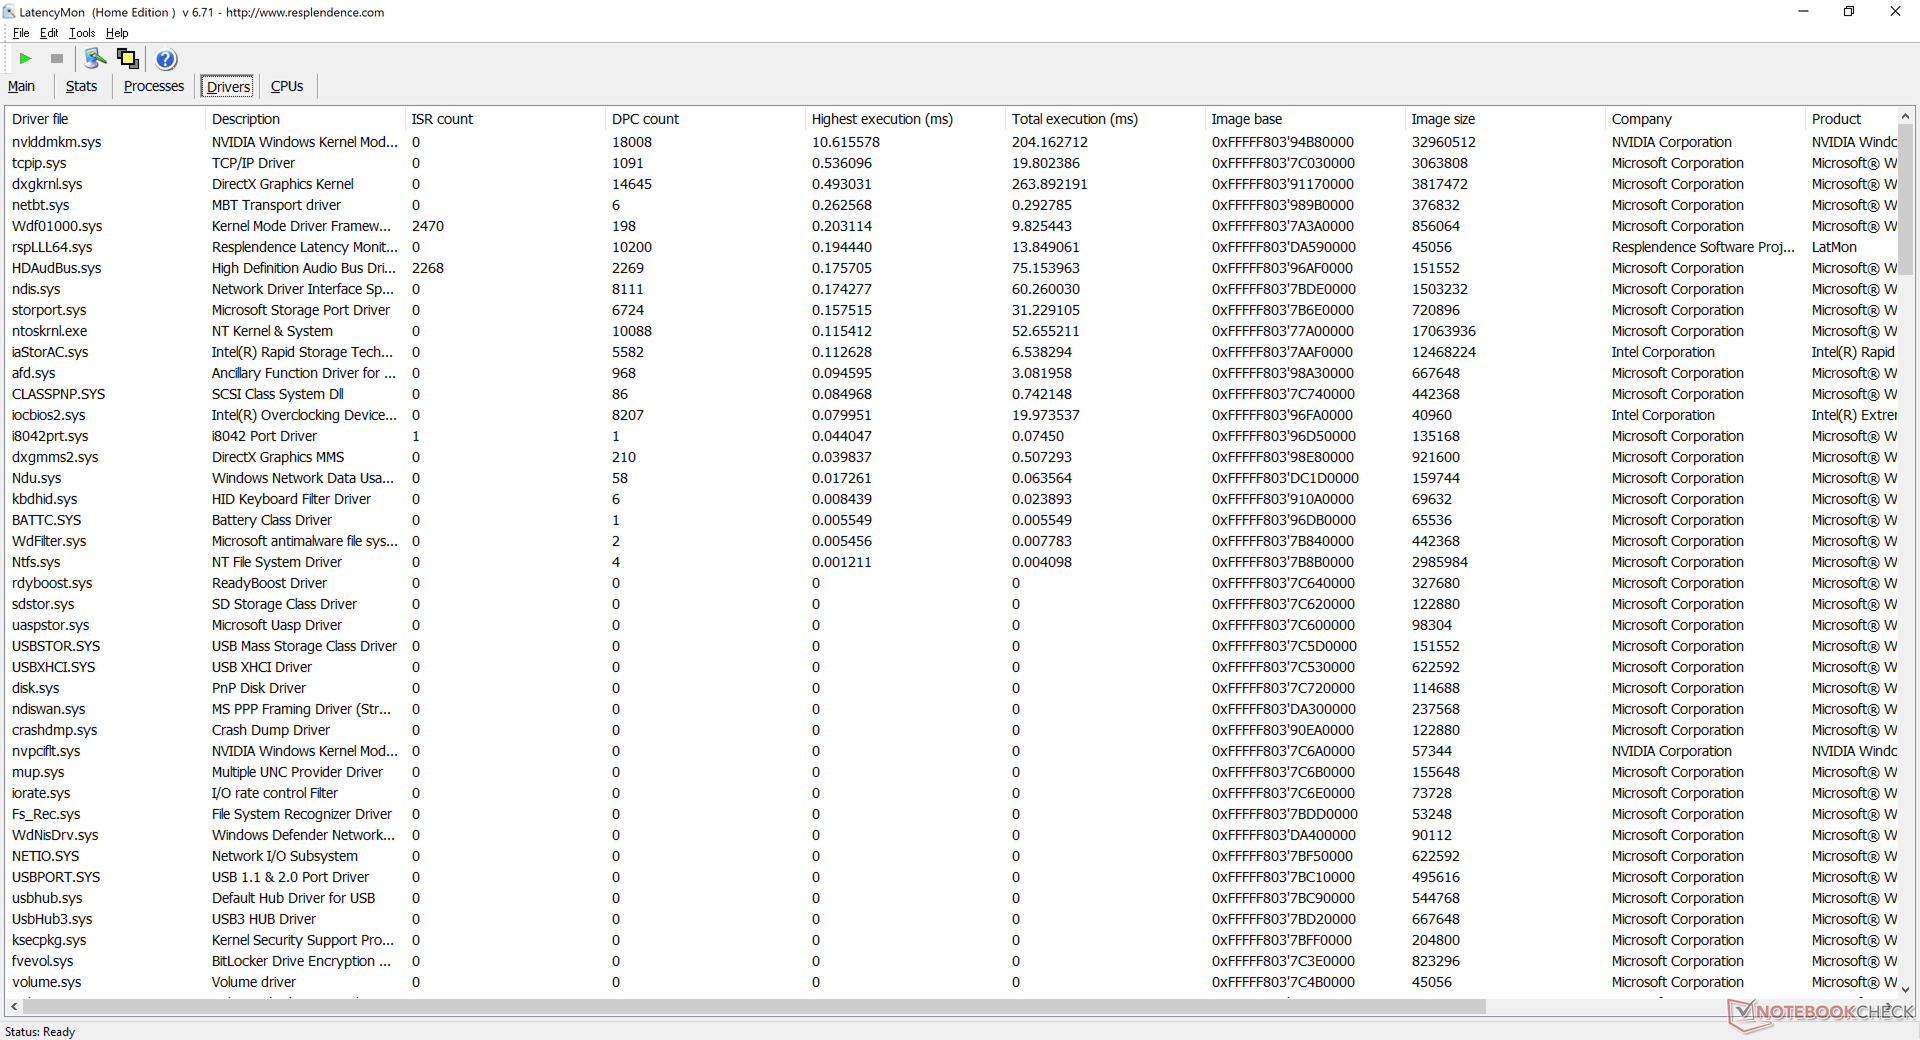
LatencyMon mostra i problemi di latenza del DPC relativi a nvlddmkm.sys quando si aprono più schede sulla nostra homepage. La riproduzione di video 4K UHD a 60 FPS non è perfetta nemmeno con una perdita di 56 fotogrammi durante il nostro minuzioso test su YouTube. Questi risultati sono deludenti considerando l'hardware utilizzato.
| DPC Latencies / LatencyMon - interrupt to process latency (max), Web, Youtube, Prime95 | |
| MSI GT76 Titan DT 10SGS | |
| Asus Strix Scar 17 G732LXS | |
| Asus Zephyrus G14 GA401IV | |
| Eluktronics RP-17 | |
| Alienware m17 R3 P45E | |
* ... Meglio usare valori piccoli
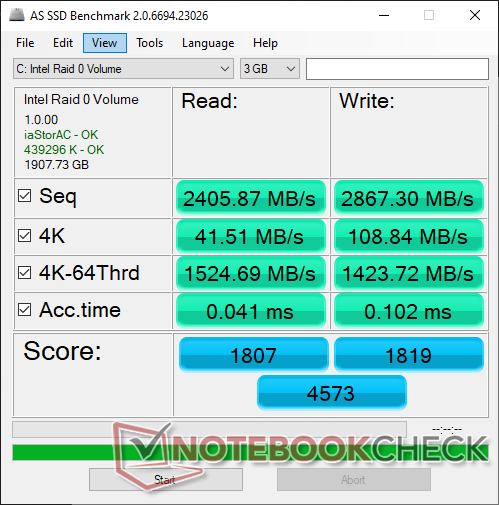
Dispositivi di archiviazione
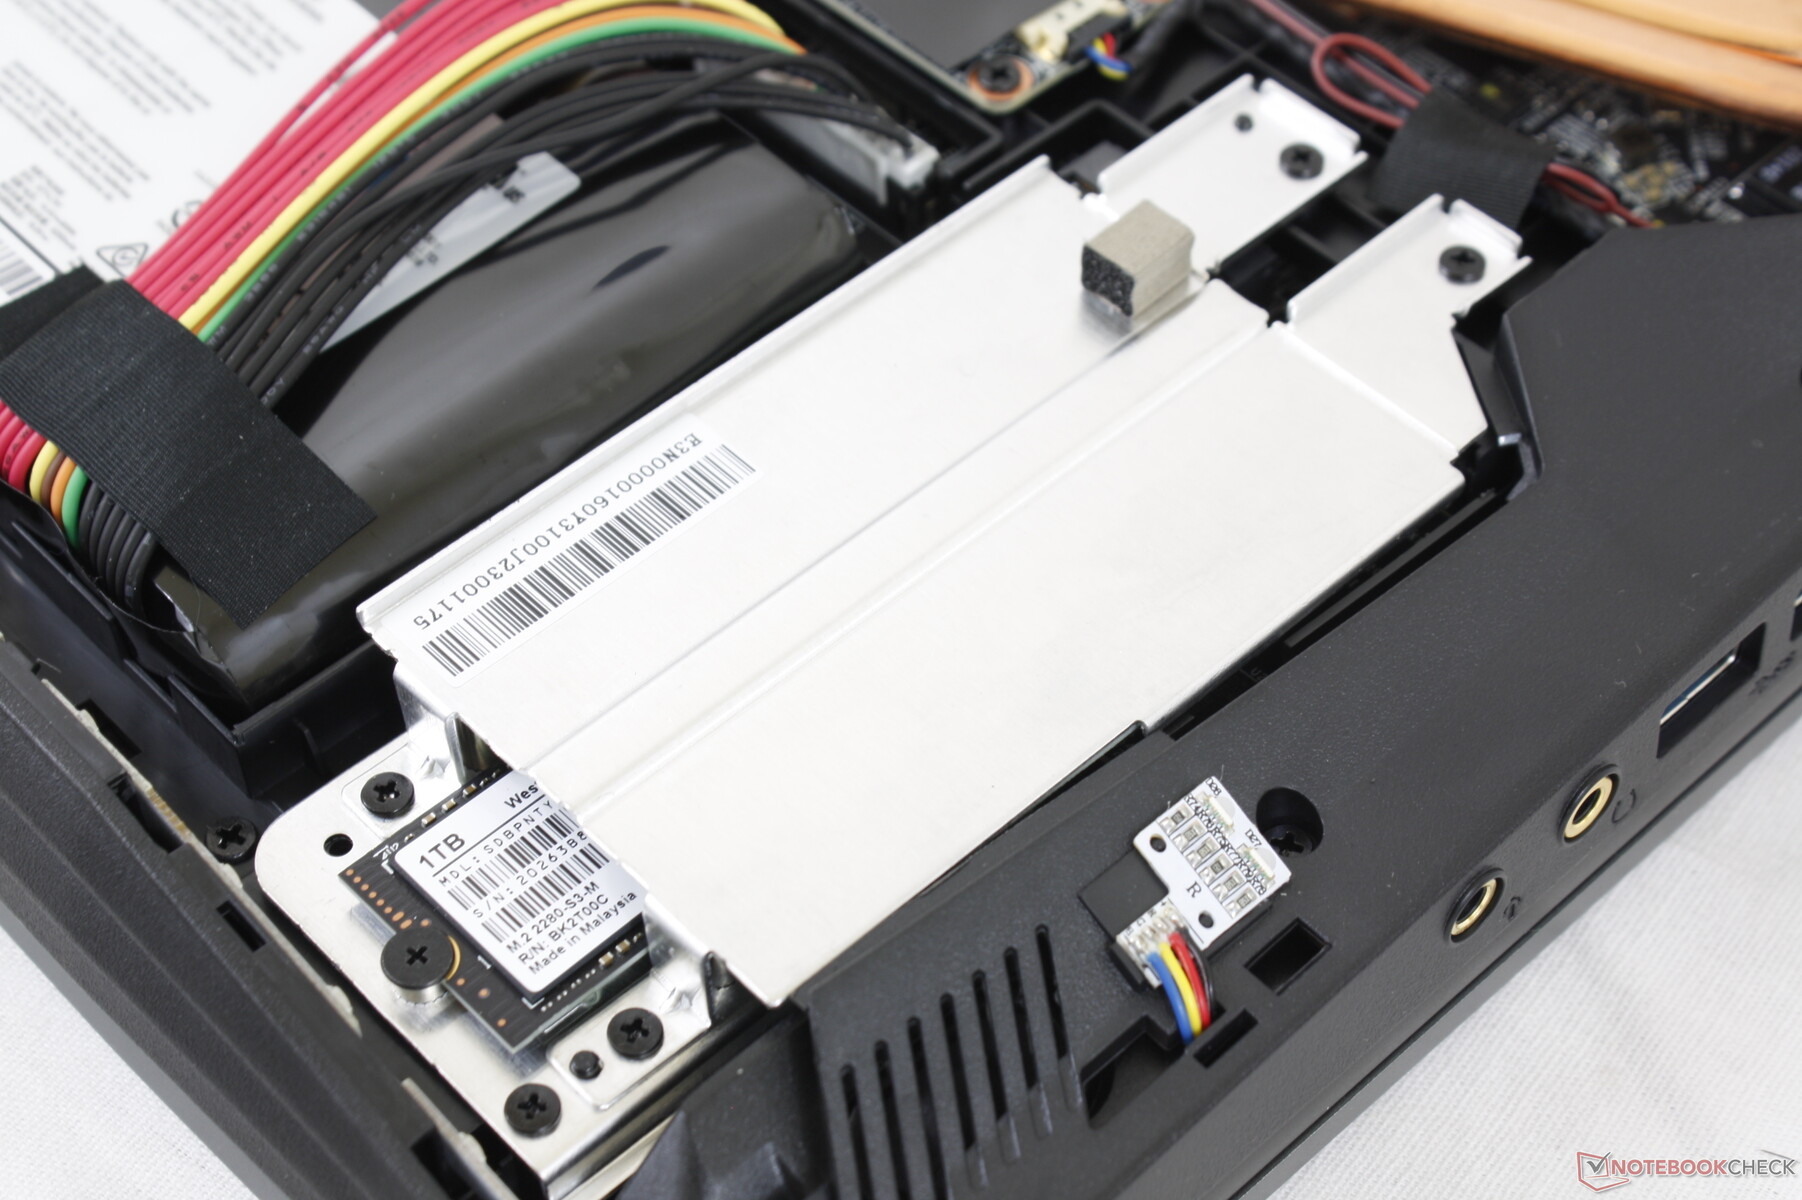
| MSI GT76 Titan DT 10SGS 2x WDC PC SN730 SDBPNTY-1T00 (RAID 0) | Alienware Area-51m i9-9900K RTX 2080 2x SK Hynix PC400 512GB (RAID 0) | Asus Strix Scar 17 G732LXS 2x Intel SSD 660p 1TB SSDPEKNW010T8 (RAID 0) | MSI GE75 9SG Samsung SSD PM981 MZVLB1T0HALR | MSI GT76 Titan DT 9SG 2x Samsung PM961 MZVLW256HEHP (RAID 0) | |
|---|---|---|---|---|---|
| AS SSD | -20% | -29% | -11% | -16% | |
| Seq Read (MB/s) | 2406 | 2082 -13% | 2450 2% | 1358 -44% | 2646 10% |
| Seq Write (MB/s) | 2867 | 2335 -19% | 1436 -50% | 2381 -17% | 2214 -23% |
| 4K Read (MB/s) | 41.51 | 24.14 -42% | 49.48 19% | 27.02 -35% | 30.42 -27% |
| 4K Write (MB/s) | 108.8 | 91.8 -16% | 119.4 10% | 89.2 -18% | 95.9 -12% |
| 4K-64 Read (MB/s) | 1525 | 1561 2% | 1032 -32% | 1642 8% | 1609 6% |
| 4K-64 Write (MB/s) | 1424 | 1350 -5% | 1229 -14% | 1799 26% | 1573 10% |
| Access Time Read * (ms) | 0.041 | 0.121 -195% | 0.145 -254% | 0.067 -63% | 0.128 -212% |
| Access Time Write * (ms) | 0.102 | 0.039 62% | 0.036 65% | 0.05 51% | 0.039 62% |
| Score Read (Points) | 1807 | 1793 -1% | 1327 -27% | 1805 0% | 1904 5% |
| Score Write (Points) | 1819 | 1675 -8% | 1492 -18% | 2127 17% | 1890 4% |
| Score Total (Points) | 4573 | 4390 -4% | 3456 -24% | 4899 7% | 4740 4% |
| Copy ISO MB/s (MB/s) | 2605 | 2175 -17% | 3193 23% | ||
| Copy Program MB/s (MB/s) | 651 | 582 -11% | 198.2 -70% | ||
| Copy Game MB/s (MB/s) | 1709 | 1479 -13% | 1054 -38% | ||
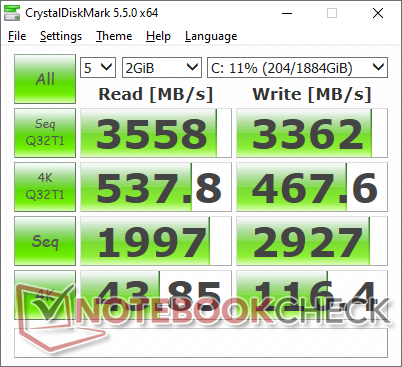
| CrystalDiskMark 5.2 / 6 | 3% | -7% | -16% | -12% | |
| Write 4K (MB/s) | 116.4 | 111.1 -5% | 125.8 8% | 116.1 0% | 101.4 -13% |
| Read 4K (MB/s) | 43.85 | 45.47 4% | 52.9 21% | 44.98 3% | 40.57 -7% |
| Write Seq (MB/s) | 2927 | 2454 -16% | 1795 -39% | 2370 -19% | 2229 -24% |
| Read Seq (MB/s) | 1997 | 2212 11% | 2315 16% | 1465 -27% | 2528 27% |
| Write 4K Q32T1 (MB/s) | 467.6 | 622 33% | 407.1 -13% | 337.5 -28% | 379.6 -19% |
| Read 4K Q32T1 (MB/s) | 538 | 695 29% | 411.9 -23% | 453.6 -16% | 421.9 -22% |
| Write Seq Q32T1 (MB/s) | 3362 | 2675 -20% | 2844 -15% | 2399 -29% | 2439 -27% |
| Read Seq Q32T1 (MB/s) | 3558 | 3184 -11% | 3130 -12% | 3087 -13% | 3199 -10% |
| Media totale (Programma / Settaggio) | -9% /
-12% | -18% /
-20% | -14% /
-13% | -14% /
-14% |
* ... Meglio usare valori piccoli

Throttling Disco: DiskSpd Read Loop, Queue Depth 8
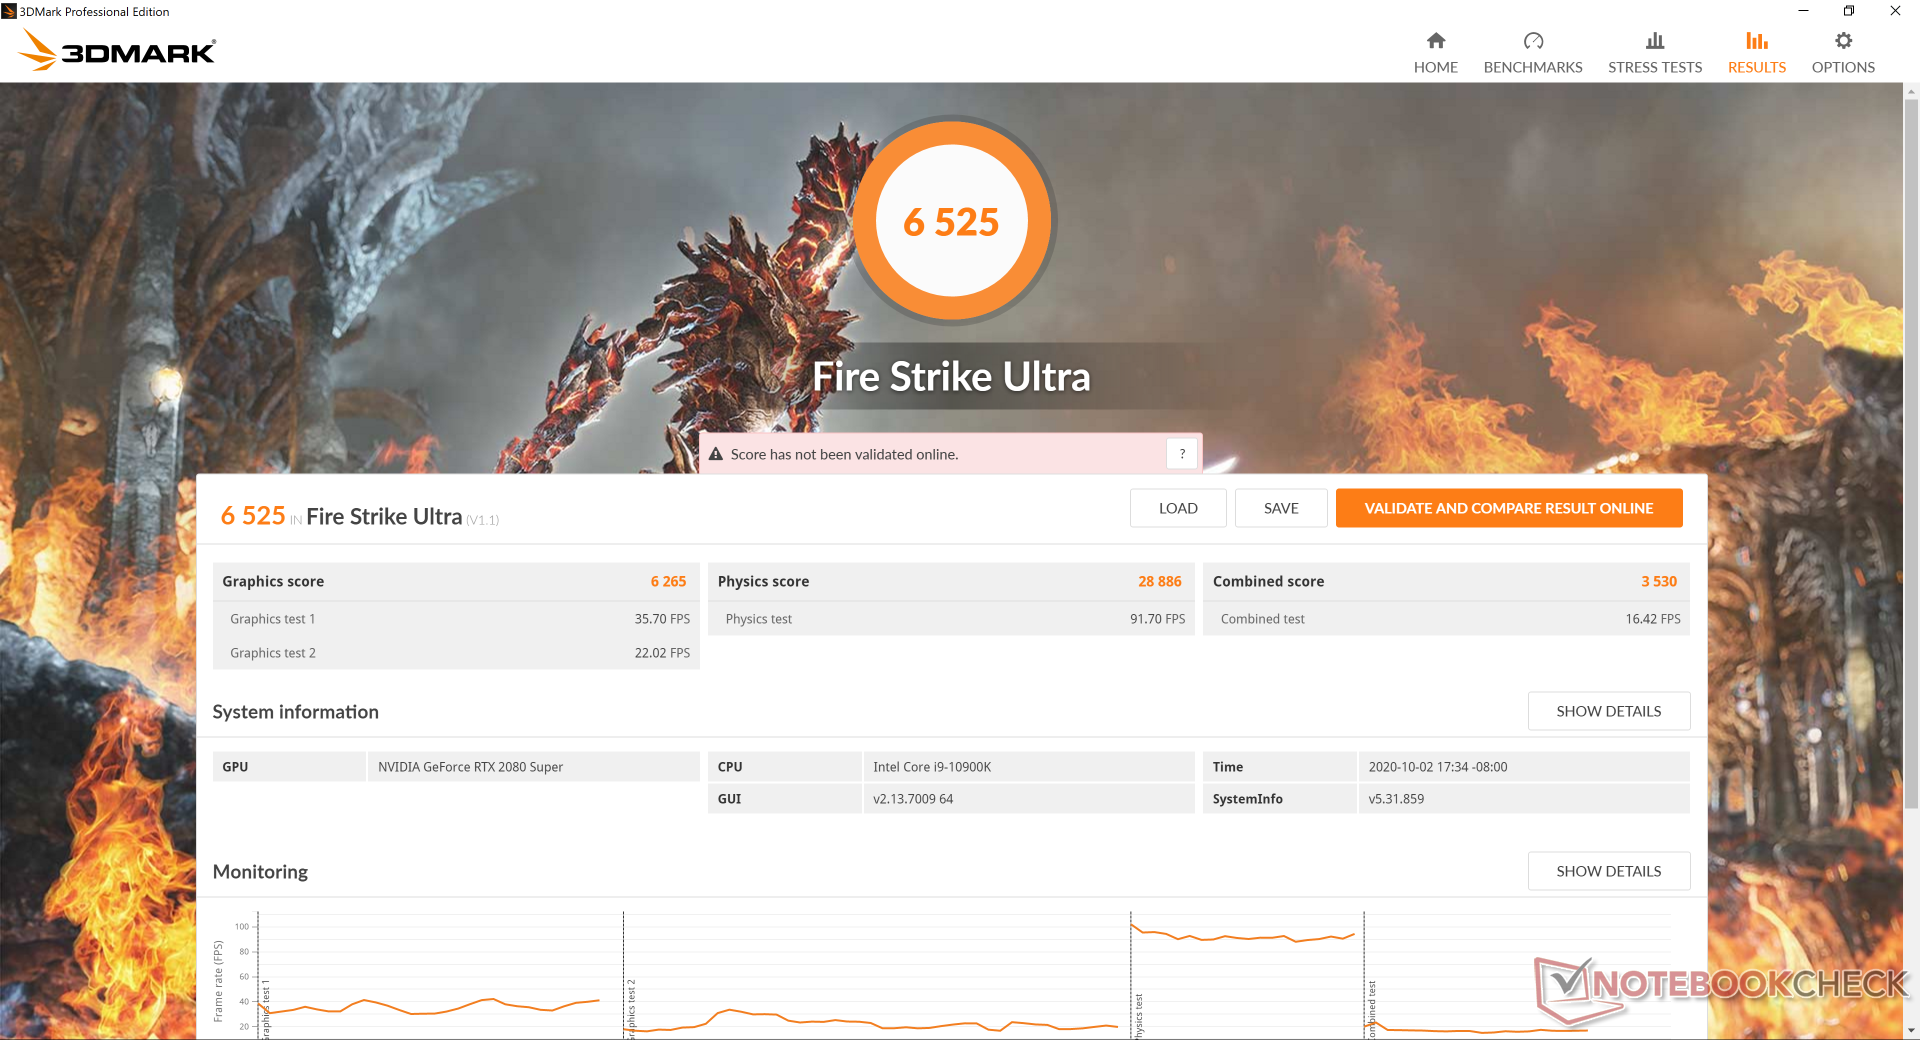
Prestazioni GPU
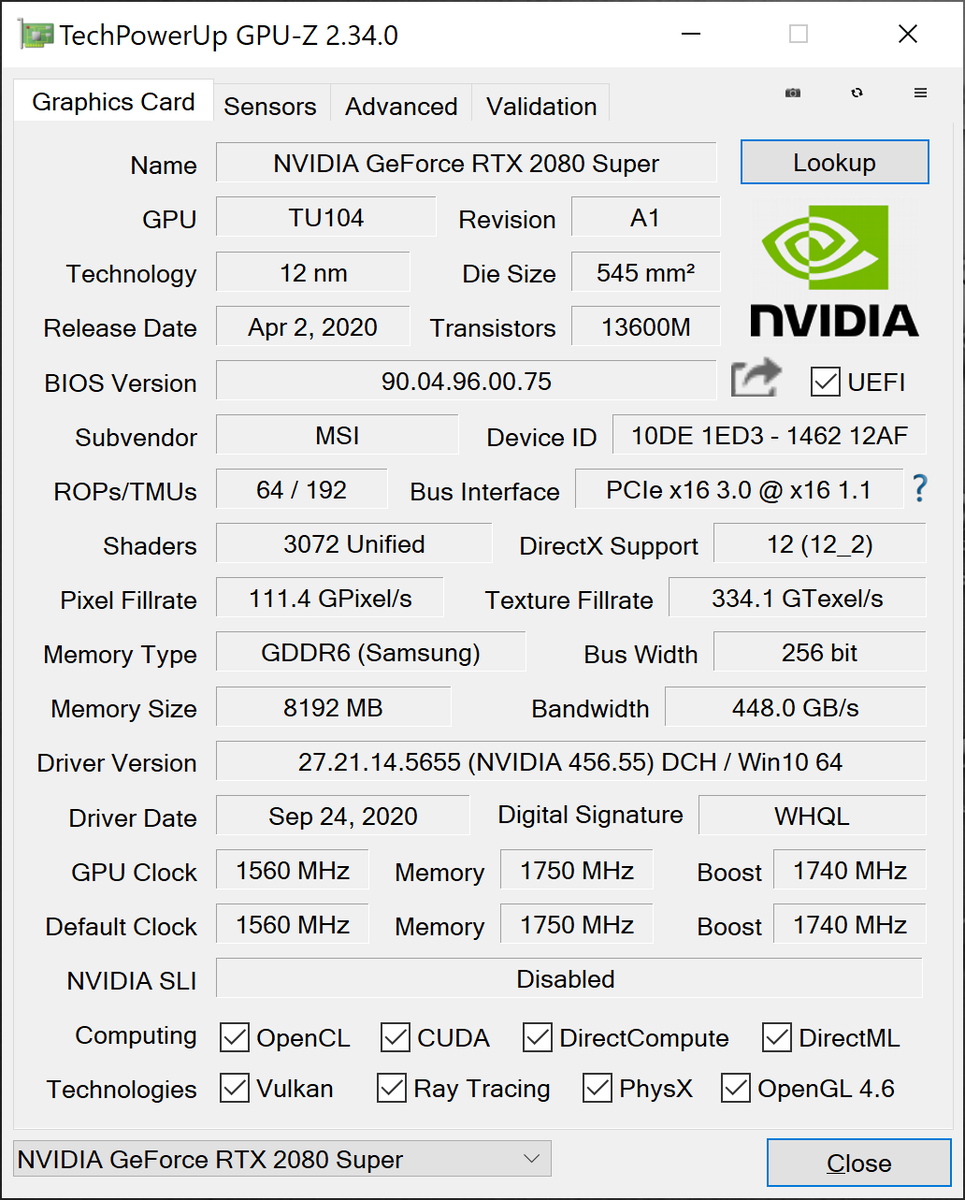
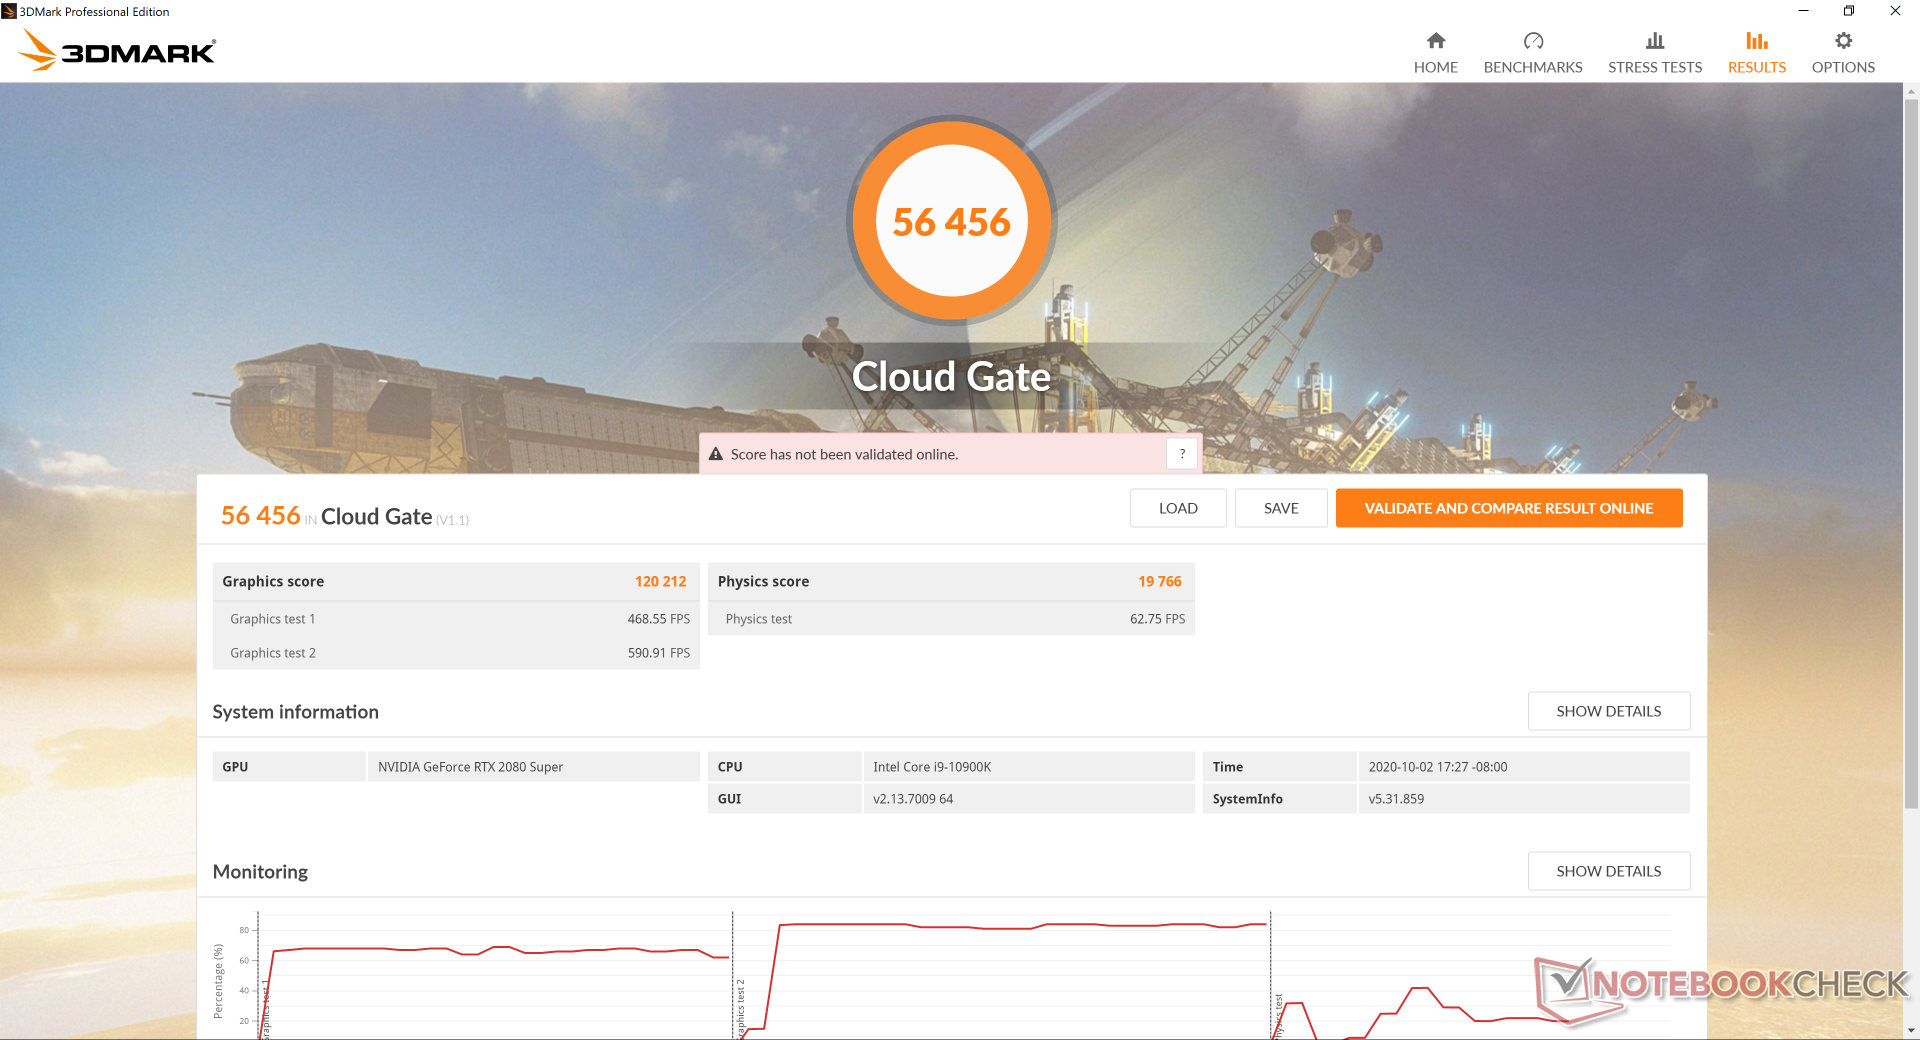
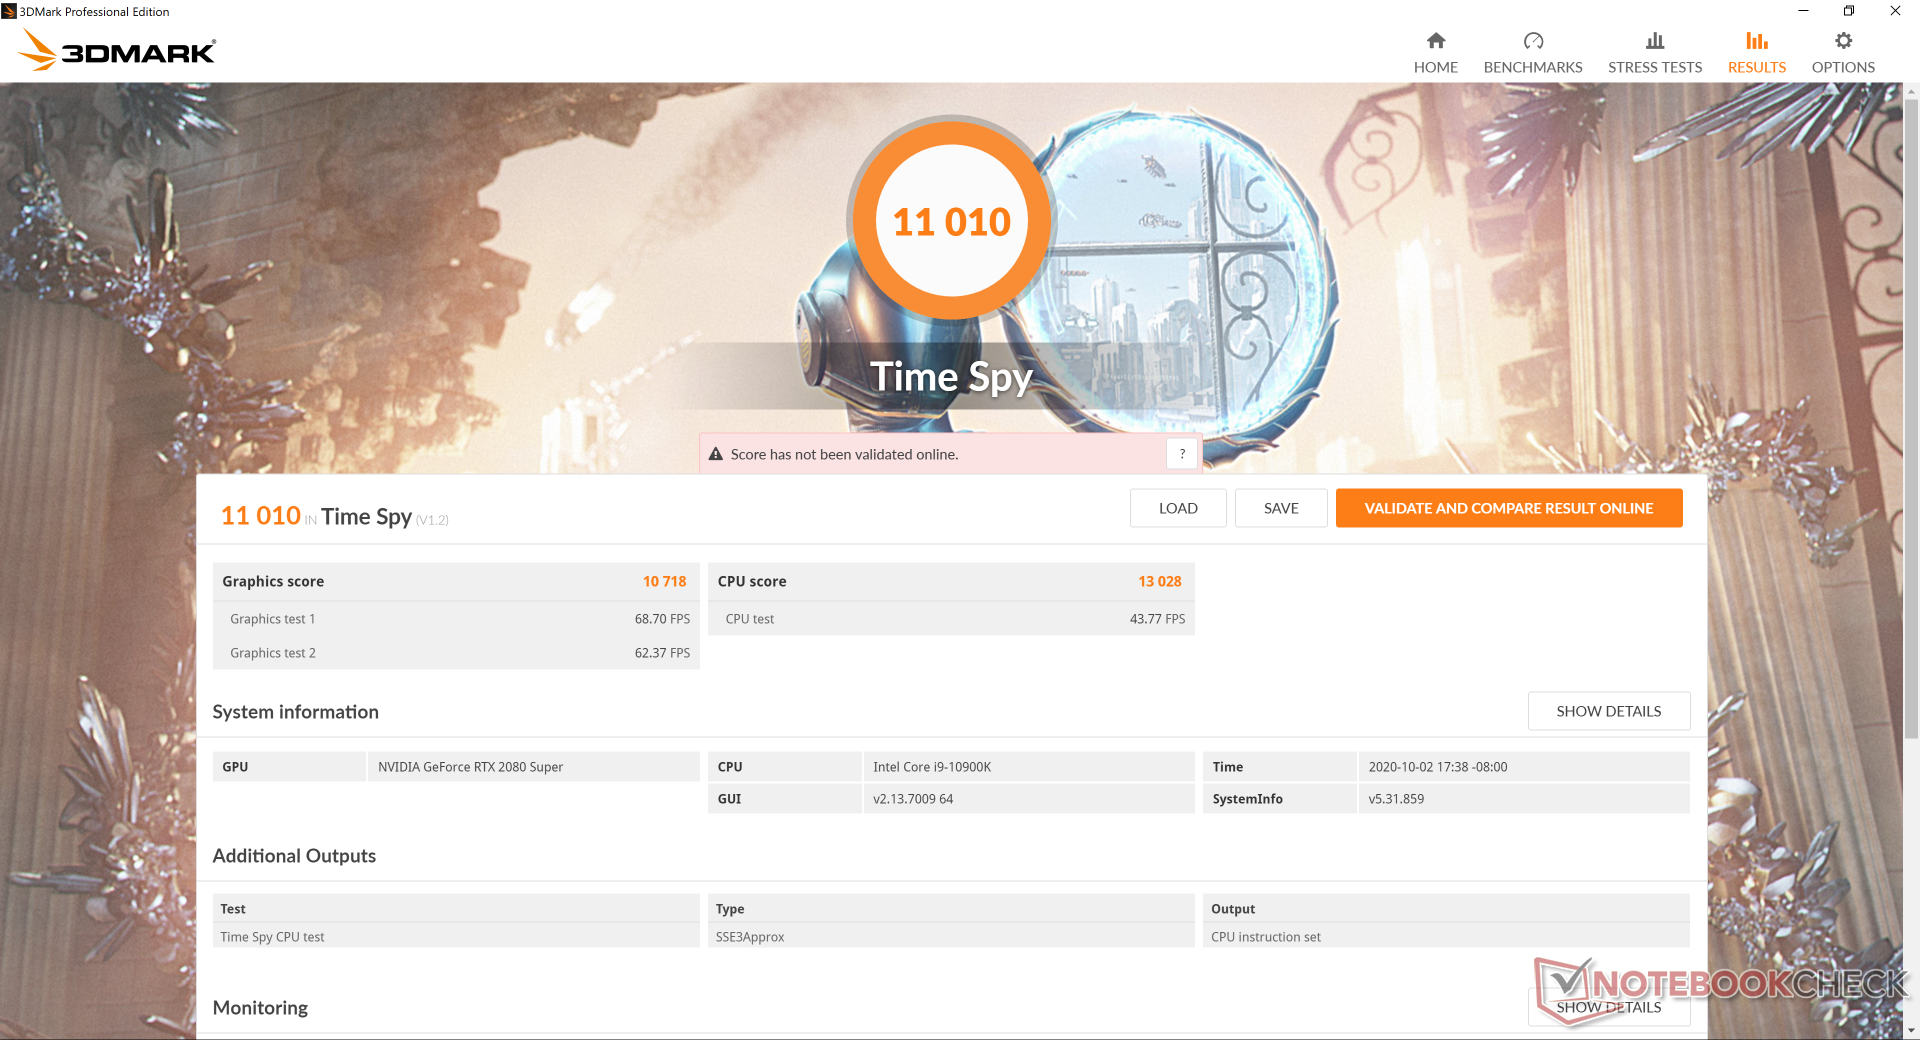
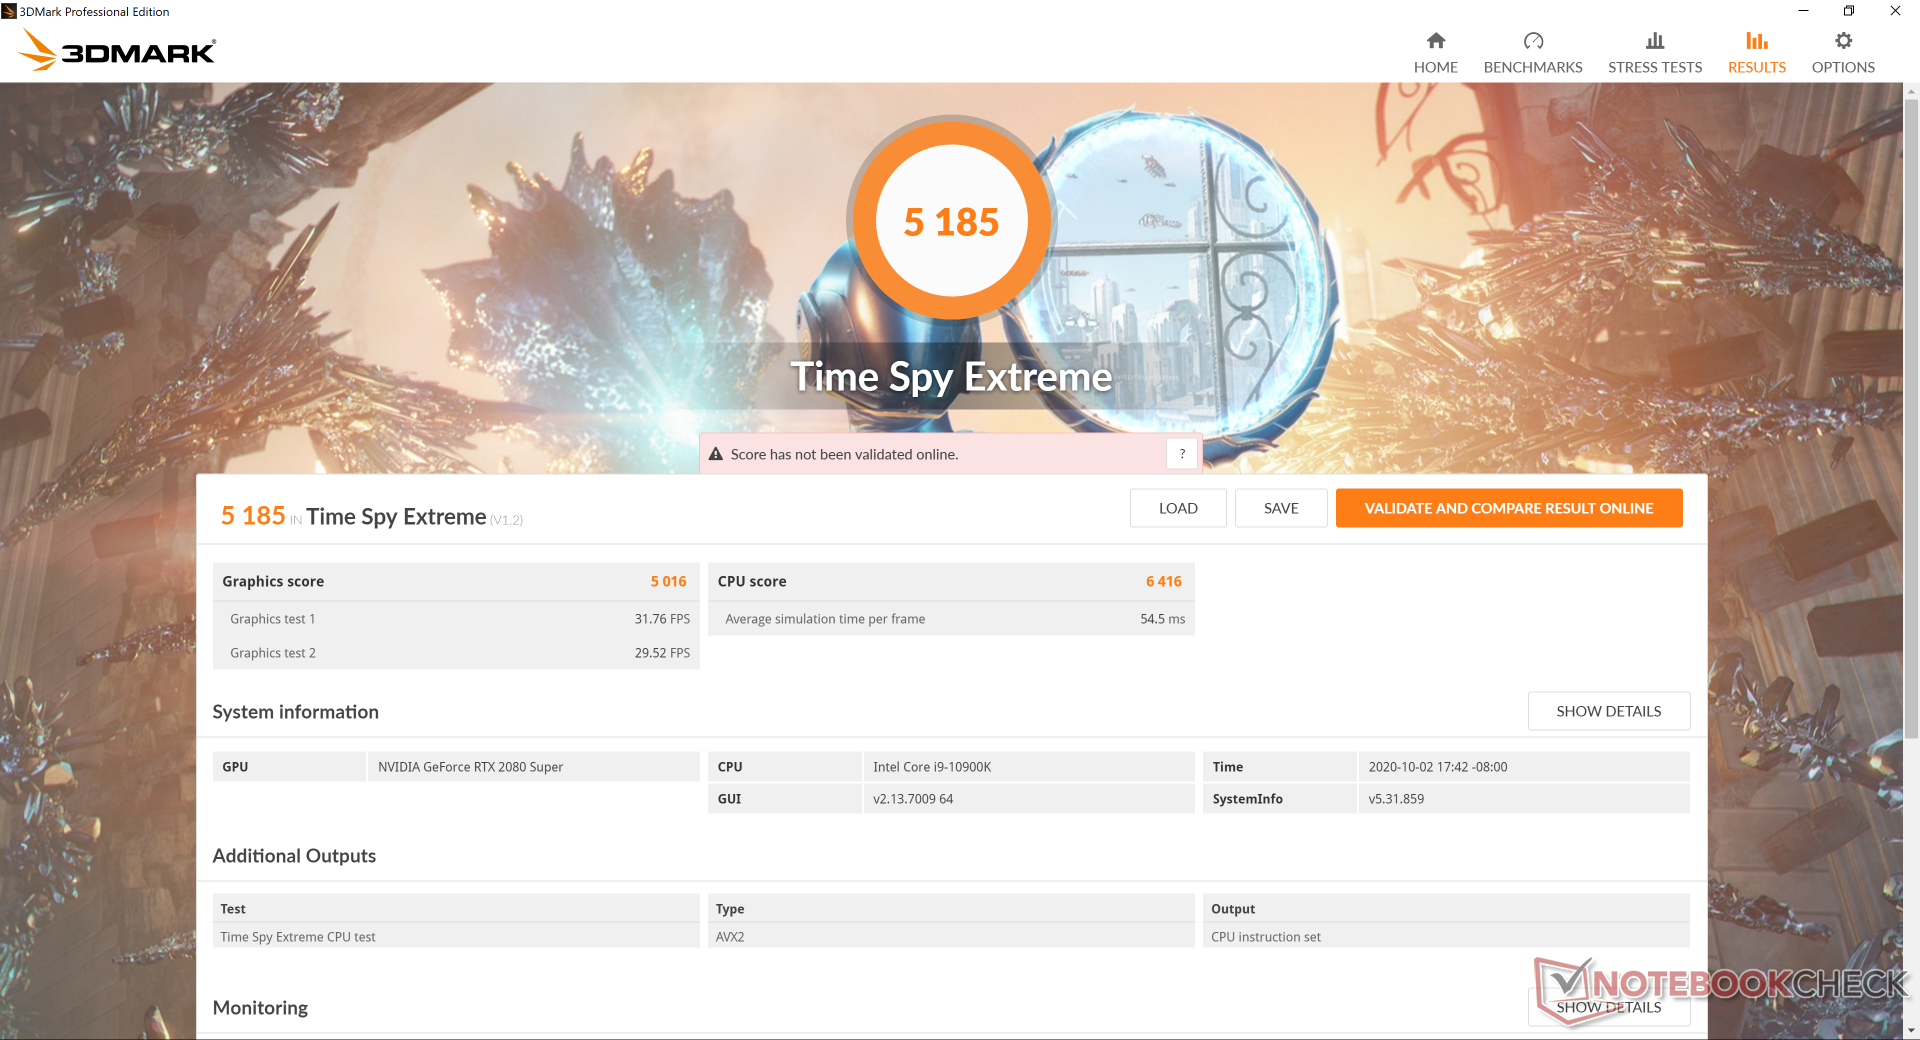
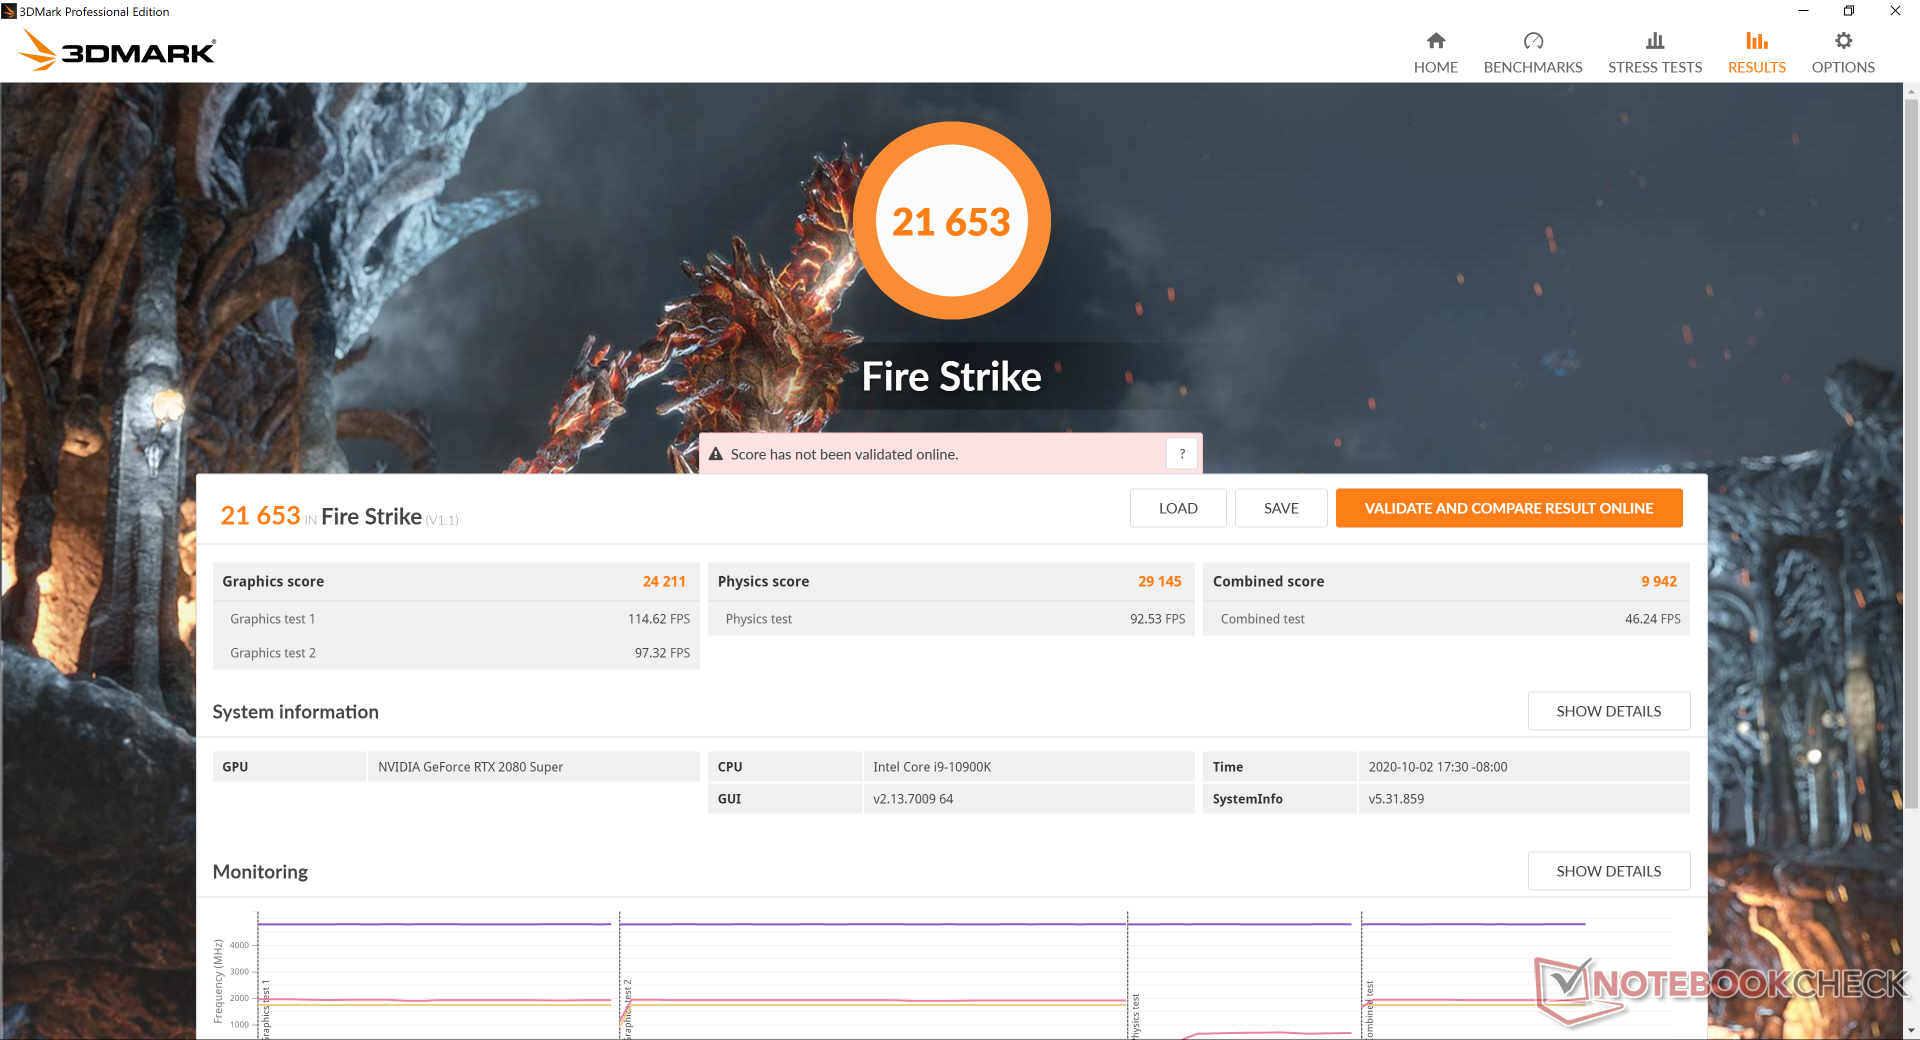
I risultati di 3DMark sono infatti più veloci rispetto al GT76 9SG dello scorso anno, anche se solo di pochi punti percentuali. Le prestazioni grafiche grezze sono appena al di sotto della nostra desktop RTX 2080 Super di riferimento. Consultate la nostra pagina sulla GeForce RTX 2080 Super mobile per maggiori informazioni tecniche e benchmarks.
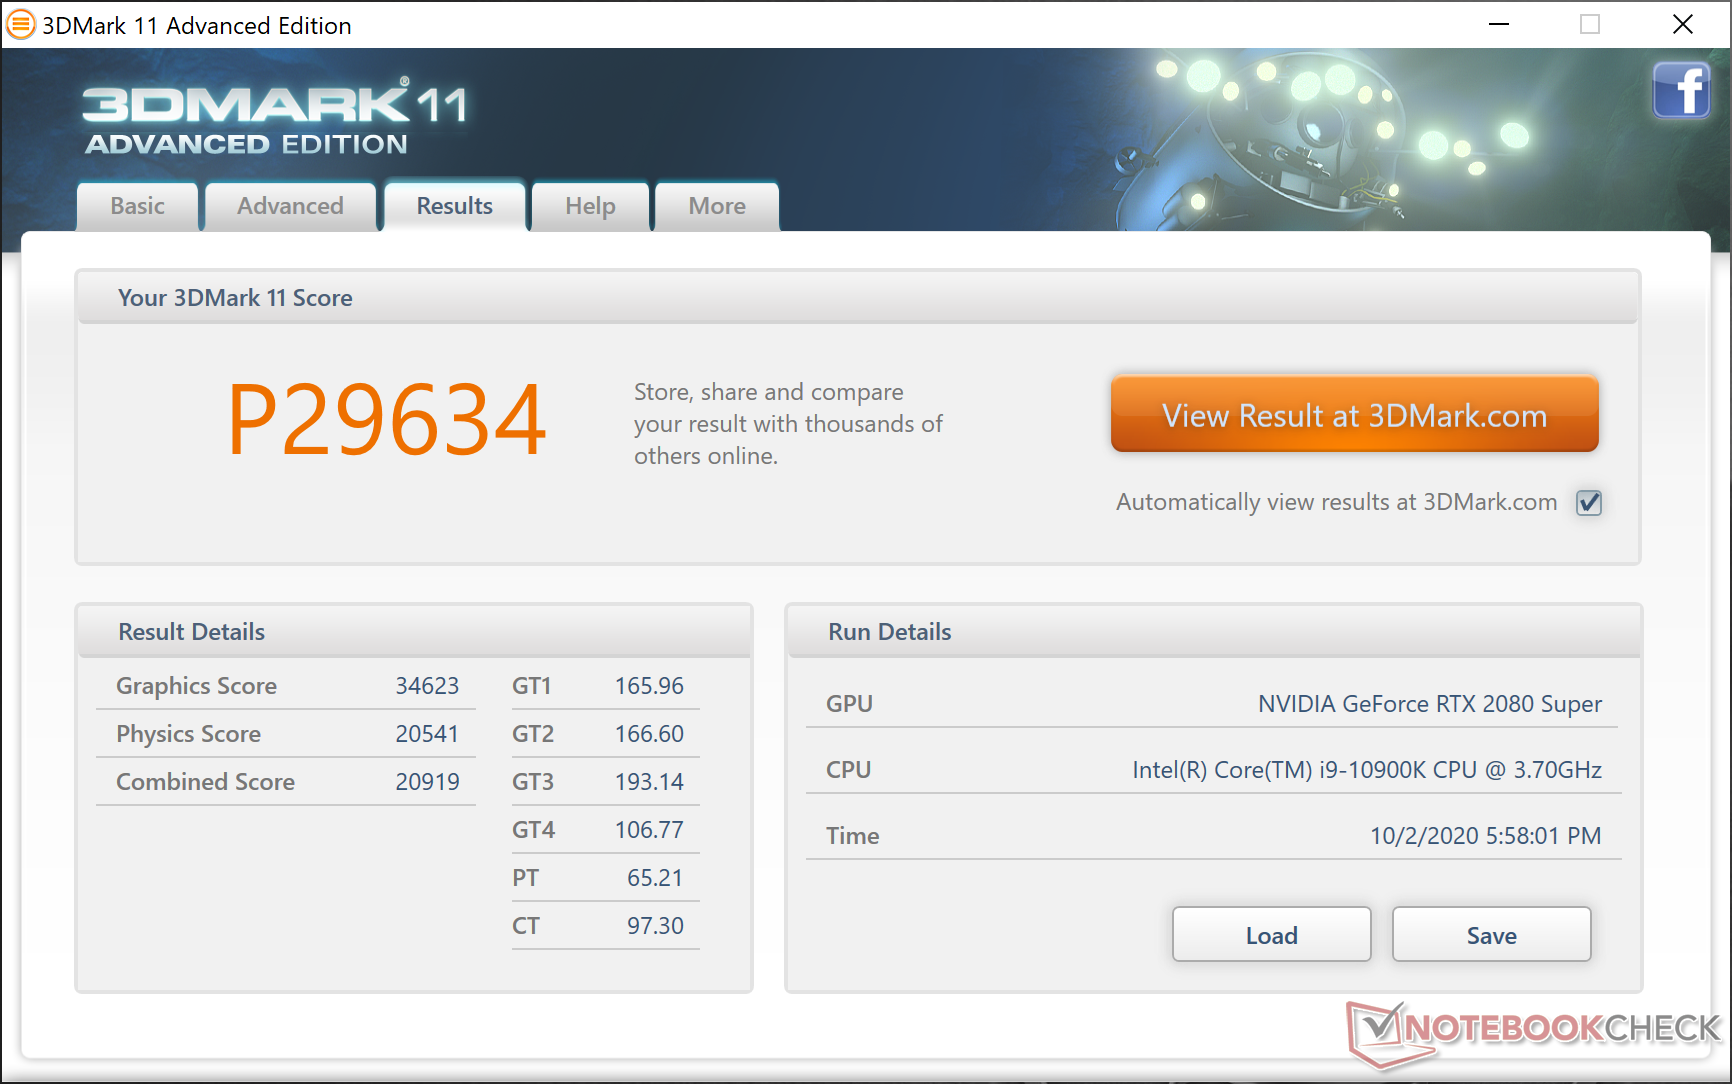
| 3DMark 11 Performance | 29634 punti | |
| 3DMark Cloud Gate Standard Score | 56456 punti | |
| 3DMark Fire Strike Score | 21653 punti | |
| 3DMark Time Spy Score | 11010 punti | |
Aiuto | ||
| GTA V | |
| 1920x1080 Lowest Settings possible | |
| MSI GT76 Titan DT 10SGS | |
| Media NVIDIA GeForce RTX 2080 Super Mobile (182 - 185, n=2) | |
| Asus Strix Scar 17 G732LXS | |
| Aorus 17G XB | |
| 3840x2160 Highest AA:4xMSAA + FX AF:16x | |
| Media NVIDIA GeForce RTX 2080 Super Mobile (47.9 - 49.3, n=3) | |
| MSI GT76 Titan DT 10SGS | |
| 3840x2160 High/On (Advanced Graphics Off) AA:FX AF:8x | |
| KFA2 GeForce RTX 2080 Ti EX | |
| Asus ROG Strix RTX 2080 OC | |
| Nvidia GeForce RTX 2080 Super | |
| Asus ROG Strix RTX 2070 OC | |
| Nvidia GeForce RTX 2070 Super | |
| Media NVIDIA GeForce RTX 2080 Super Mobile (96 - 98.9, n=2) | |
| MSI GT76 Titan DT 10SGS | |
| Gigabyte Aero 15-Y9 | |
| Strange Brigade | |
| 1280x720 lowest AF:1 | |
| MSI GT76 Titan DT 10SGS | |
| Media NVIDIA GeForce RTX 2080 Super Mobile (n=1) | |
| KFA2 GeForce GTX 1650 EX One Click Plus | |
| 1920x1080 high AA:high AF:8 | |
| MSI GT76 Titan DT 10SGS | |
| Media NVIDIA GeForce RTX 2080 Super Mobile (n=1) | |
| KFA2 GeForce GTX 1650 EX One Click Plus | |
| 1920x1080 ultra AA:ultra AF:16 | |
| MSI GT76 Titan DT 10SGS | |
| Media NVIDIA GeForce RTX 2080 Super Mobile (n=1) | |
| KFA2 GeForce GTX 1650 EX One Click Plus | |
| basso | medio | alto | ultra | QHD | 4K | |
|---|---|---|---|---|---|---|
| GTA V (2015) | 185 | 183 | 176 | 101 | 90.2 | 96 |
| The Witcher 3 (2015) | 471.7 | 332 | 223.2 | 113.2 | 80.5 | |
| Dota 2 Reborn (2015) | 179 | 163 | 158 | 148 | 136 | |
| Final Fantasy XV Benchmark (2018) | 196 | 140 | 107 | 80.2 | 47 | |
| X-Plane 11.11 (2018) | 138 | 122 | 98 | 84.2 | ||
| Strange Brigade (2018) | 515 | 265 | 217 | 183 | 137 | 78.4 |
Emissioni
Rumorosità
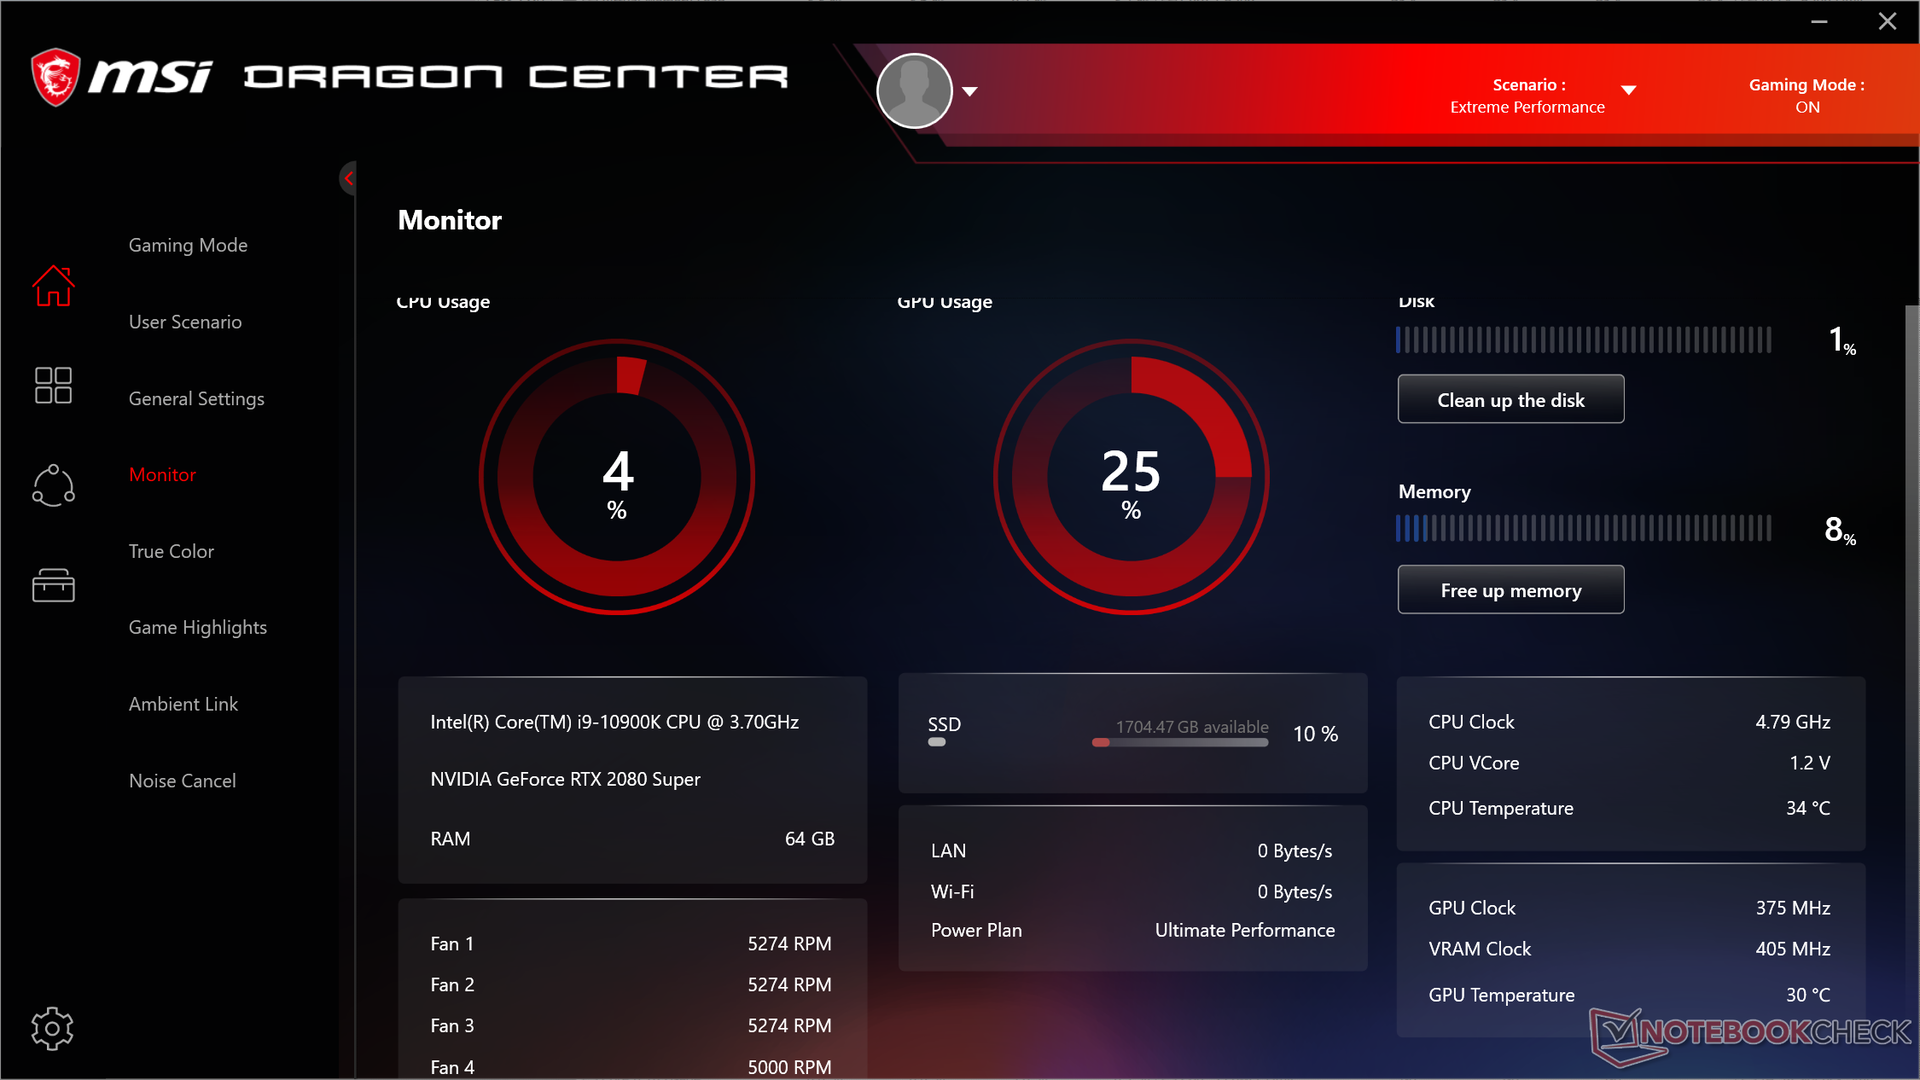
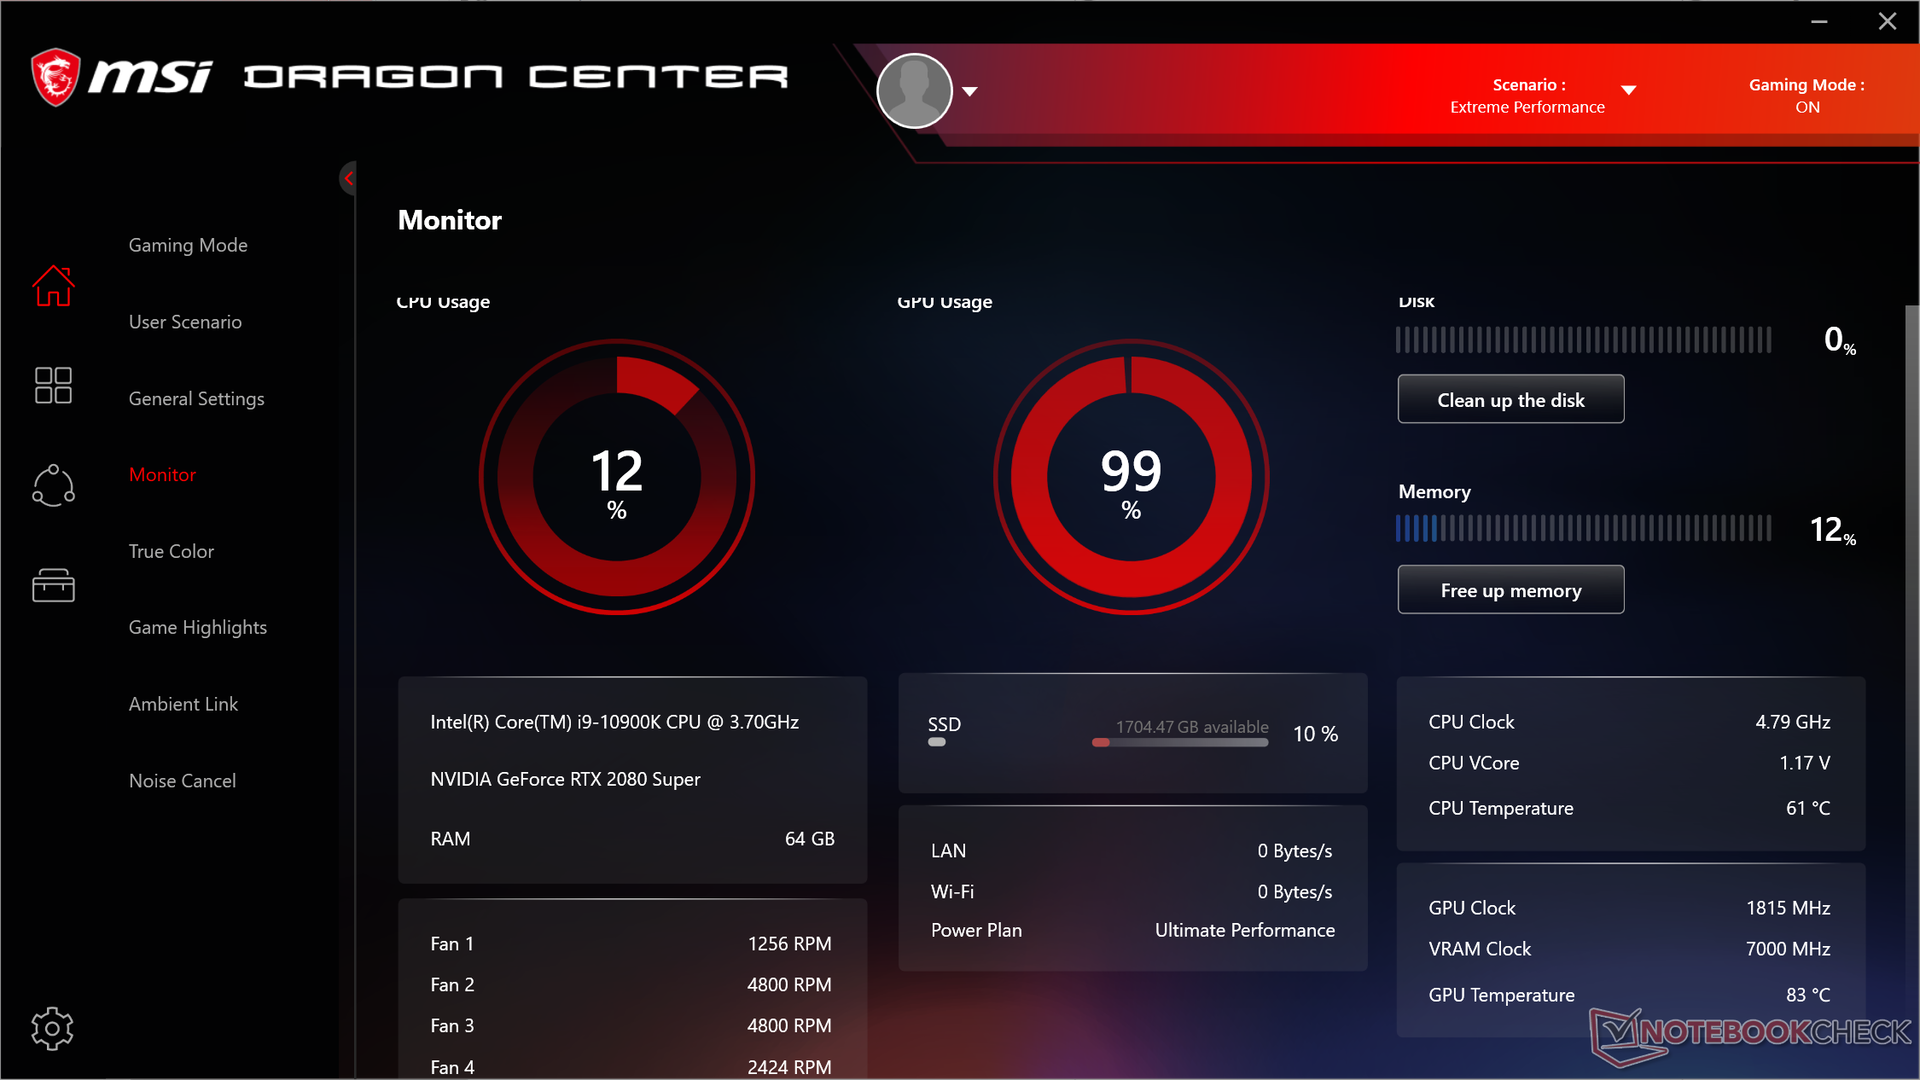
Il rumore della ventola è legato direttamente al software MSI Dragon Center. Quando è impostato in modalità Silenziosa, le ventole vanno da 27,5 a 29,8 dB(A) su un rumore ambientale di 26,5 dB(A). Anche se non è veramente "silenzioso", è comunque silenzioso soprattutto per l'hardware coinvolto. Consigliamo di utilizzare la modalità Silenziosa se si tratta di una semplice navigazione sul web o di uno streaming video dove non sono necessari cavalli di potenza extra.
Il gioco in modalità Extreme Performance porterà il rumore della ventola a circa 60,7 dB(A) risultando significativamente più forte rispetto alla maggior parte degli altri portatili gaming - e questo prima di attivare la funzione Turbo Fan/Cooler Boost. Una volta attivata, il rumore della ventola salterà a 66,6 dB(A) risultando essere uno dei più rumorosi mai registrati su un laptop.

| MSI GT76 Titan DT 10SGS GeForce RTX 2080 Super Mobile, i9-10900K, 2x WDC PC SN730 SDBPNTY-1T00 (RAID 0) | Asus ROG G703GXR GeForce RTX 2080 Mobile, i7-9750H, Samsung SSD PM981 MZVLB512HAJQ | Alienware Area-51m i9-9900K RTX 2080 GeForce RTX 2080 Mobile, i9-9900K, 2x SK Hynix PC400 512GB (RAID 0) | Asus Strix Scar 17 G732LXS GeForce RTX 2080 Super Mobile, i9-10980HK, 2x Intel SSD 660p 1TB SSDPEKNW010T8 (RAID 0) | Schenker XMG Pro 17 PB71RD-G GeForce RTX 2060 Mobile, i7-9750H, Samsung SSD 970 EVO Plus 500GB | MSI GE75 9SG GeForce RTX 2080 Mobile, i9-9880H, Samsung SSD PM981 MZVLB1T0HALR | MSI GT76 Titan DT 9SG GeForce RTX 2080 Mobile, i9-9900K, 2x Samsung PM961 MZVLW256HEHP (RAID 0) | |
|---|---|---|---|---|---|---|---|
| Noise | -9% | -16% | -21% | -15% | -5% | -19% | |
| off /ambiente * (dB) | 26.4 | 30 -14% | 28.1 -6% | 25 5% | 30 -14% | 28.2 -7% | 30 -14% |
| Idle Minimum * (dB) | 27.5 | 33 -20% | 28.1 -2% | 33 -20% | 30 -9% | 30.4 -11% | 33 -20% |
| Idle Average * (dB) | 27.5 | 34 -24% | 28.6 -4% | 38 -38% | 32 -16% | 30.4 -11% | 34 -24% |
| Idle Maximum * (dB) | 29.8 | 35 -17% | 51 -71% | 45 -51% | 39 -31% | 33.4 -12% | 44 -48% |
| Load Average * (dB) | 30.9 | 38 -23% | 51 -65% | 54 -75% | 51 -65% | 37.1 -20% | 47 -52% |
| Witcher 3 ultra * (dB) | 60.7 | 50 18% | 51 16% | 50 18% | 54 11% | 54.2 11% | 53 13% |
| Load Maximum * (dB) | 66.6 | 54 19% | 51 23% | 55 17% | 54 19% | 56.4 15% | 59 11% |
* ... Meglio usare valori piccoli
Rumorosità
| Idle |
| 27.5 / 27.5 / 29.8 dB(A) |
| Sotto carico |
| 30.9 / 66.6 dB(A) |
 | ||
30 dB silenzioso 40 dB(A) udibile 50 dB(A) rumoroso |
||
min: | ||
Temperature
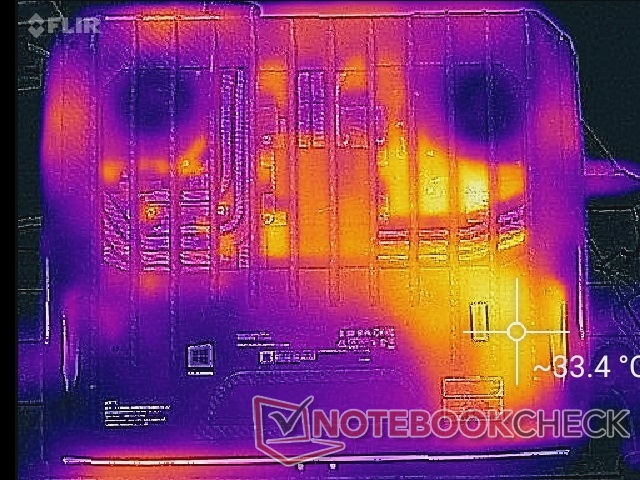
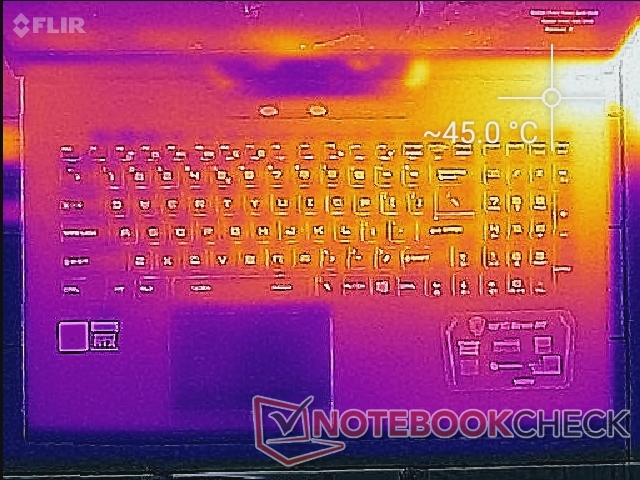
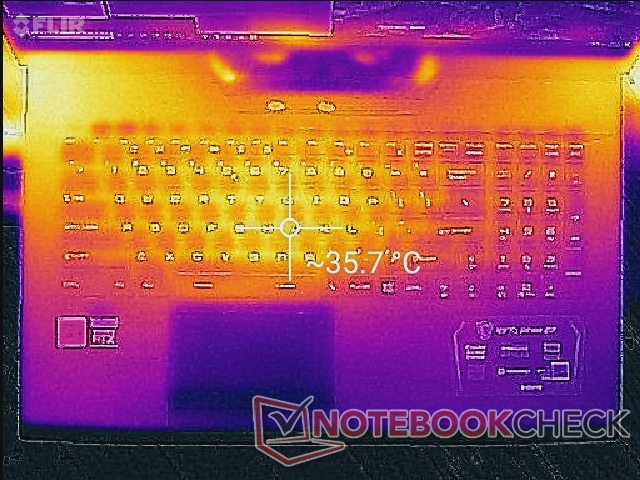
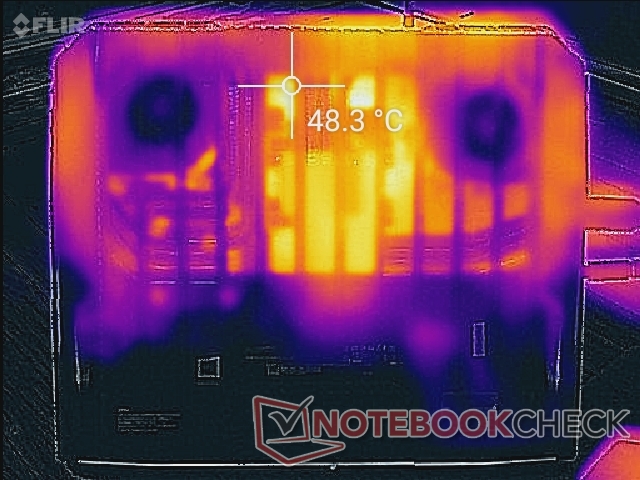
Le temperature di superficie non sono mai troppo calde, anche se abbiamo alcuni dei componenti più veloci all'interno a causa dell'abbondanza di griglie di ventilazione e di una soluzione di raffreddamento efficiente. Quando si gioca, per esempio, il centro della tastiera è di soli 36 °C rispetto ai 42 °C-47 °C dell'ultrasottile MSI GS75. I punti caldi sono i più vicini agli angoli posteriori dove è improbabile che le mani degli utenti si fermino.
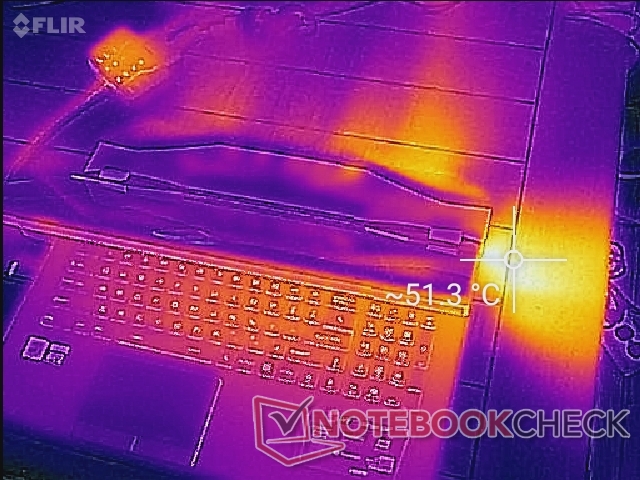
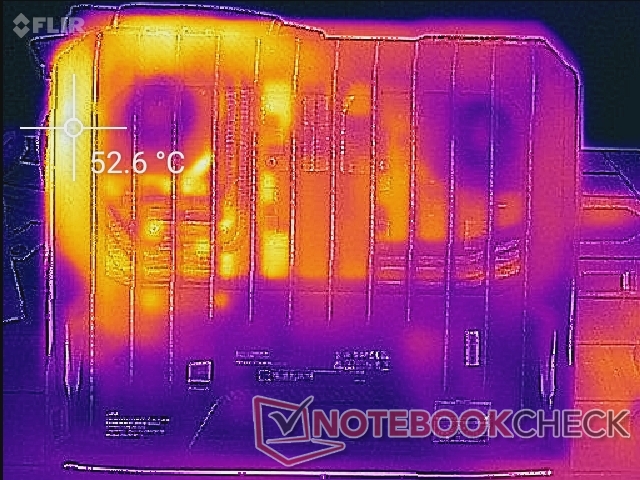
(+) La temperatura massima sul lato superiore è di 36.4 °C / 98 F, rispetto alla media di 40.4 °C / 105 F, che varia da 21.2 a 68.8 °C per questa classe Gaming.
(±) Il lato inferiore si riscalda fino ad un massimo di 43 °C / 109 F, rispetto alla media di 43.2 °C / 110 F
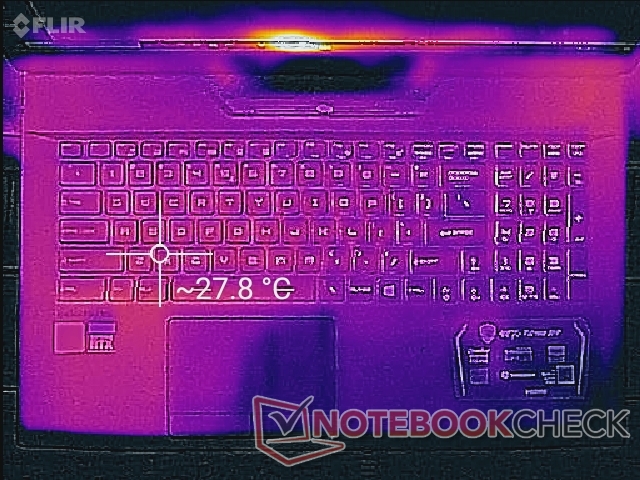
(+) In idle, la temperatura media del lato superiore è di 27.3 °C / 81 F, rispetto alla media deld ispositivo di 33.9 °C / 93 F.
(±) Riproducendo The Witcher 3, la temperatura media per il lato superiore e' di 34.8 °C / 95 F, rispetto alla media del dispositivo di 33.9 °C / 93 F.
(+) I poggiapolsi e il touchpad sono piu' freddi della temperatura della pelle con un massimo di 31.6 °C / 88.9 F e sono quindi freddi al tatto.
(-) La temperatura media della zona del palmo della mano di dispositivi simili e'stata di 28.8 °C / 83.8 F (-2.8 °C / -5.1 F).
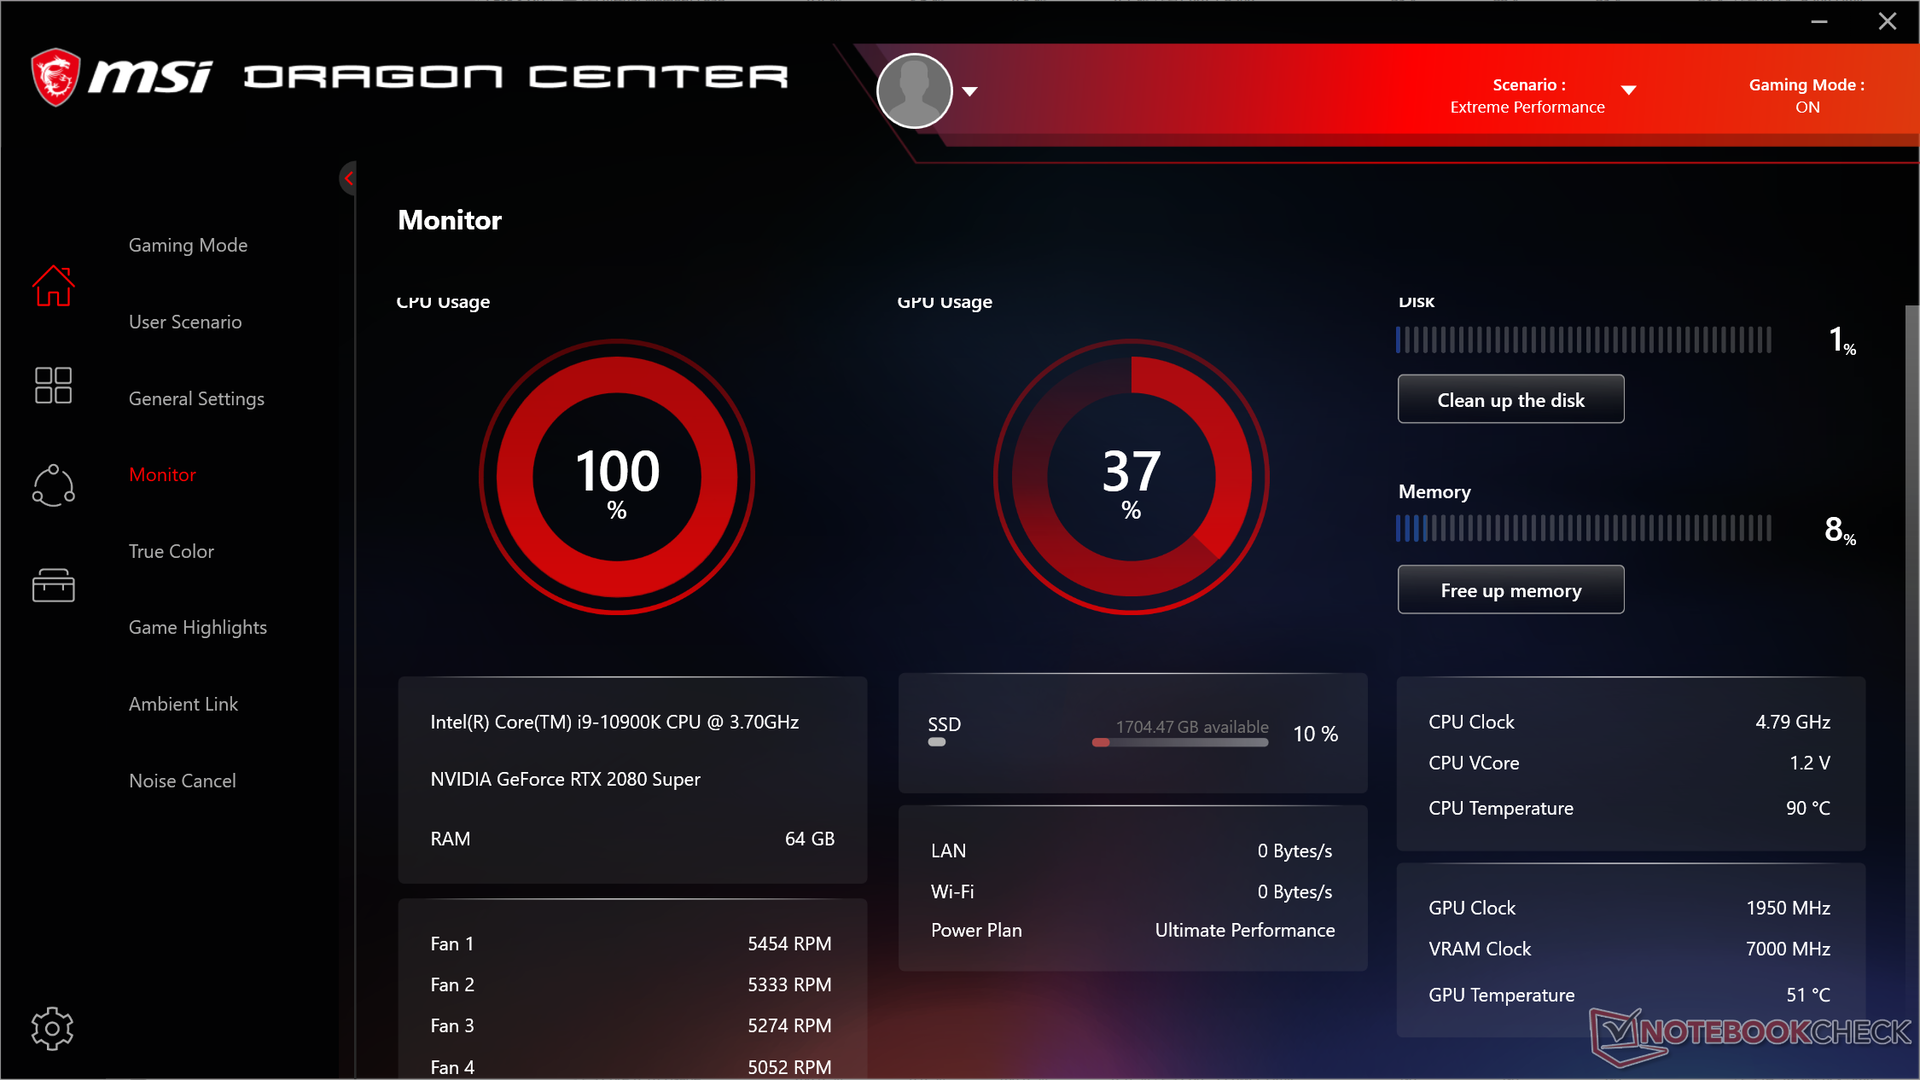
Stress Test
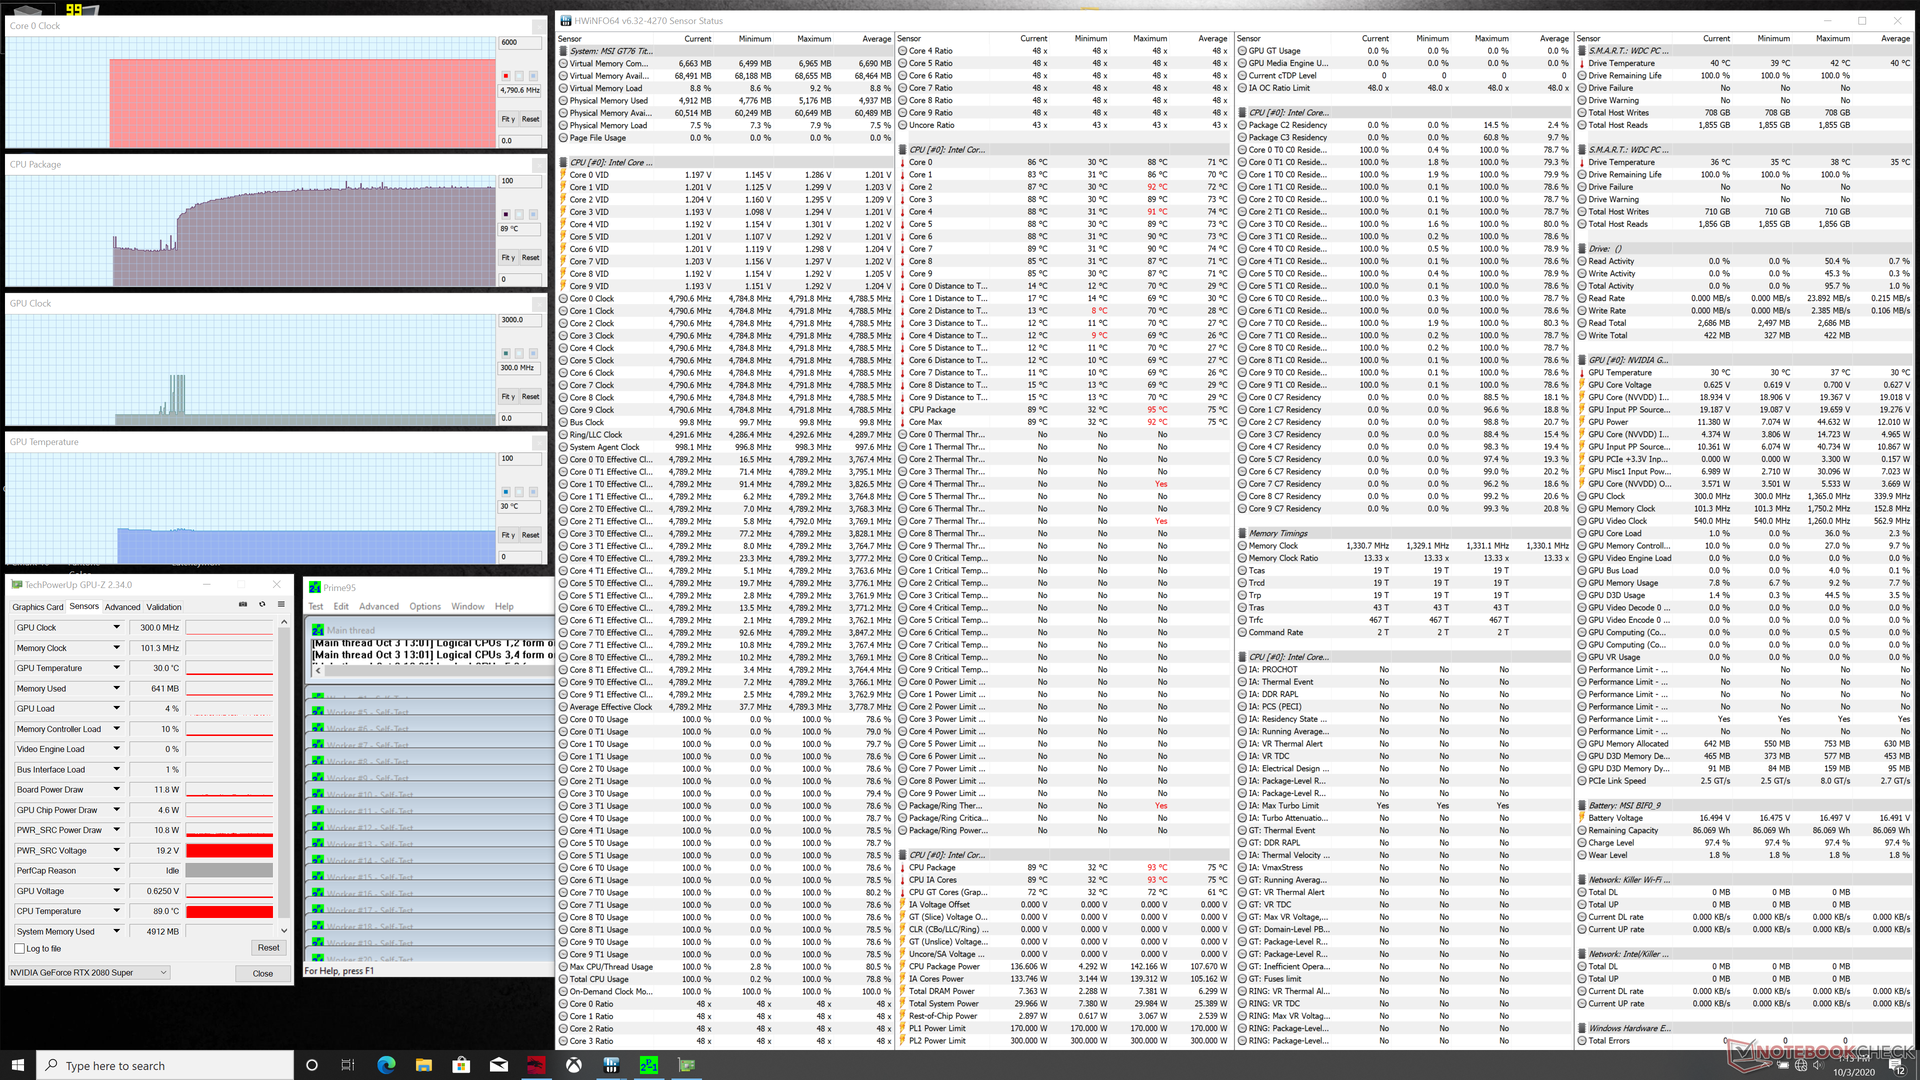
Quando si esegue Prime95 per stressare la CPU in modalità Turbo Fan/Cooler Boost, le frequenze di clock aumentano e si stabilizzano a 4,8 GHz. Intel dichiara per il suo Core i9-10900K per un Turbo Boost massimo di 4,8 GHz, il che significa che il GT76 è in grado di mantenere questo tetto di clock rate - un'impresa impressionante per un portatile che gira su una CPU progettata per i desktops. La temperatura del core si stabilizza però a 89 °C, e quindi non c'è quasi più spazio per l'overclocking dell'utente finale. Le temperature sono comunque migliori di quelle che abbiamo notato sull'Alienware Area-51m.
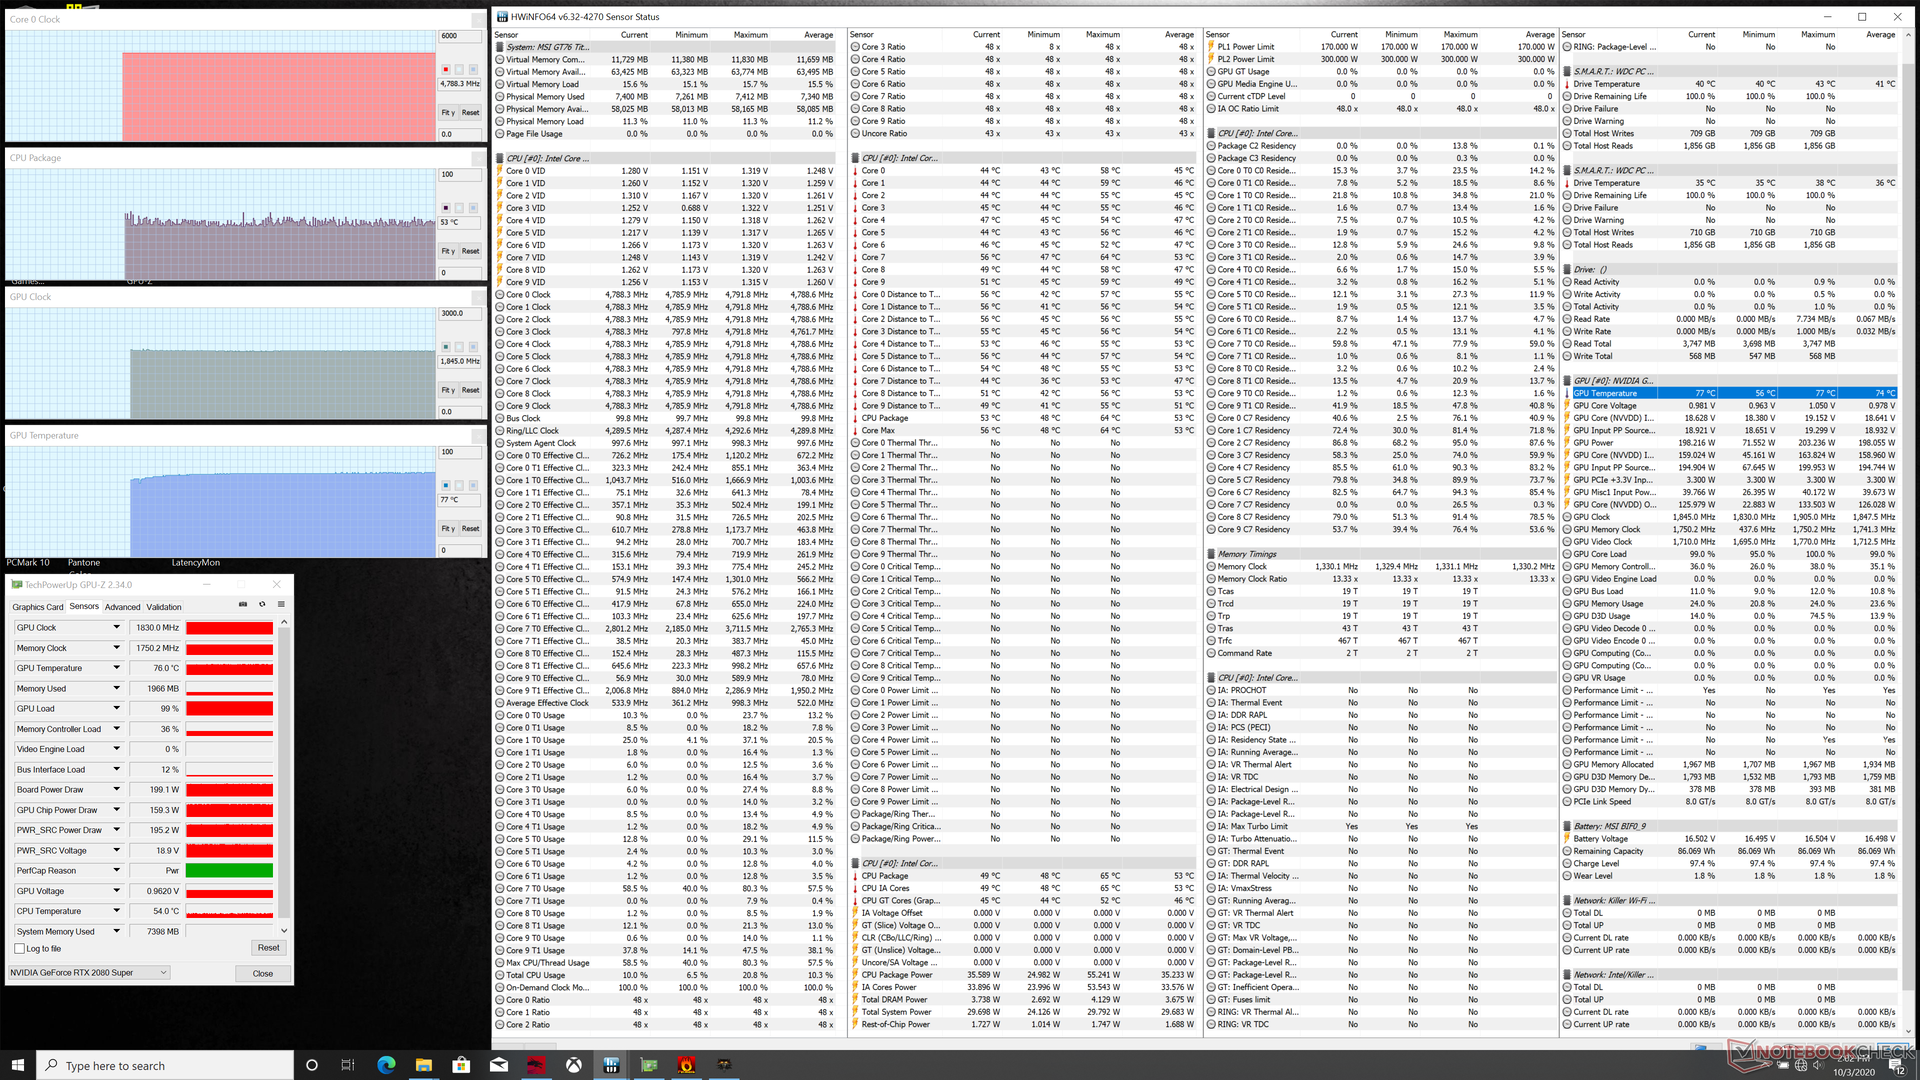
L'esecuzione di The Witcher 3 in modalità Turbo Fan porta a temperature stabili di CPU e GPU di 53 °C e 77 °C. Se Turbo Fan è spento, allora le temperature si stabilizzano a 59 °C e 83 °C, mentre i valori di clock rimangono gli stessi. Quindi, non è necessario giocare in modalità Turbo Fan poiché le prestazioni non saranno influenzate. Invece, la funzione diventa più utile se si eseguono carichi estremi al 100% di utilizzo della CPU o della GPU.
Quando si usa la batteria saranno limitate le prestazioni. Un Fire Strike eseguito con la batteria restituisce punteggi Physics e Graphics di 17234 e 11304 punti, rispettivamente, rispetto a 29145 e 24211 ottenuti con il collegamento alla rete elettrica.
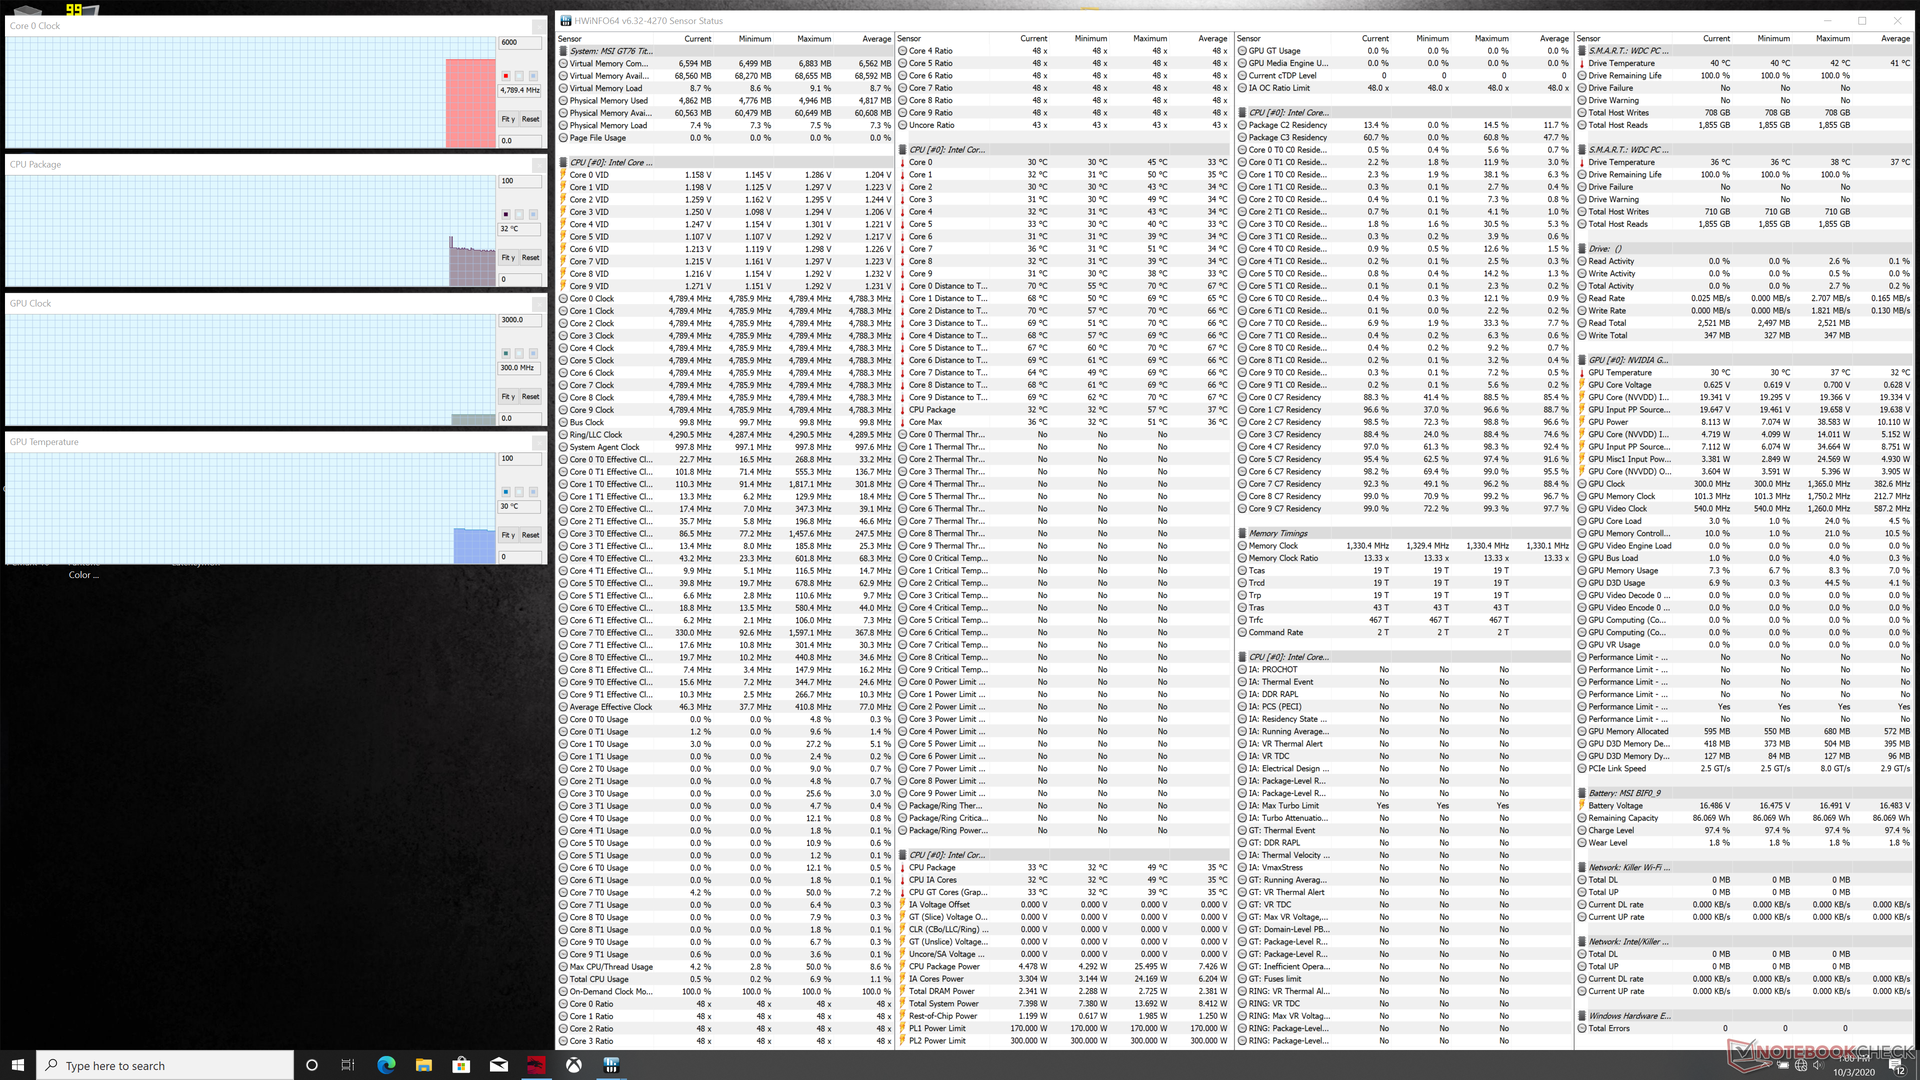
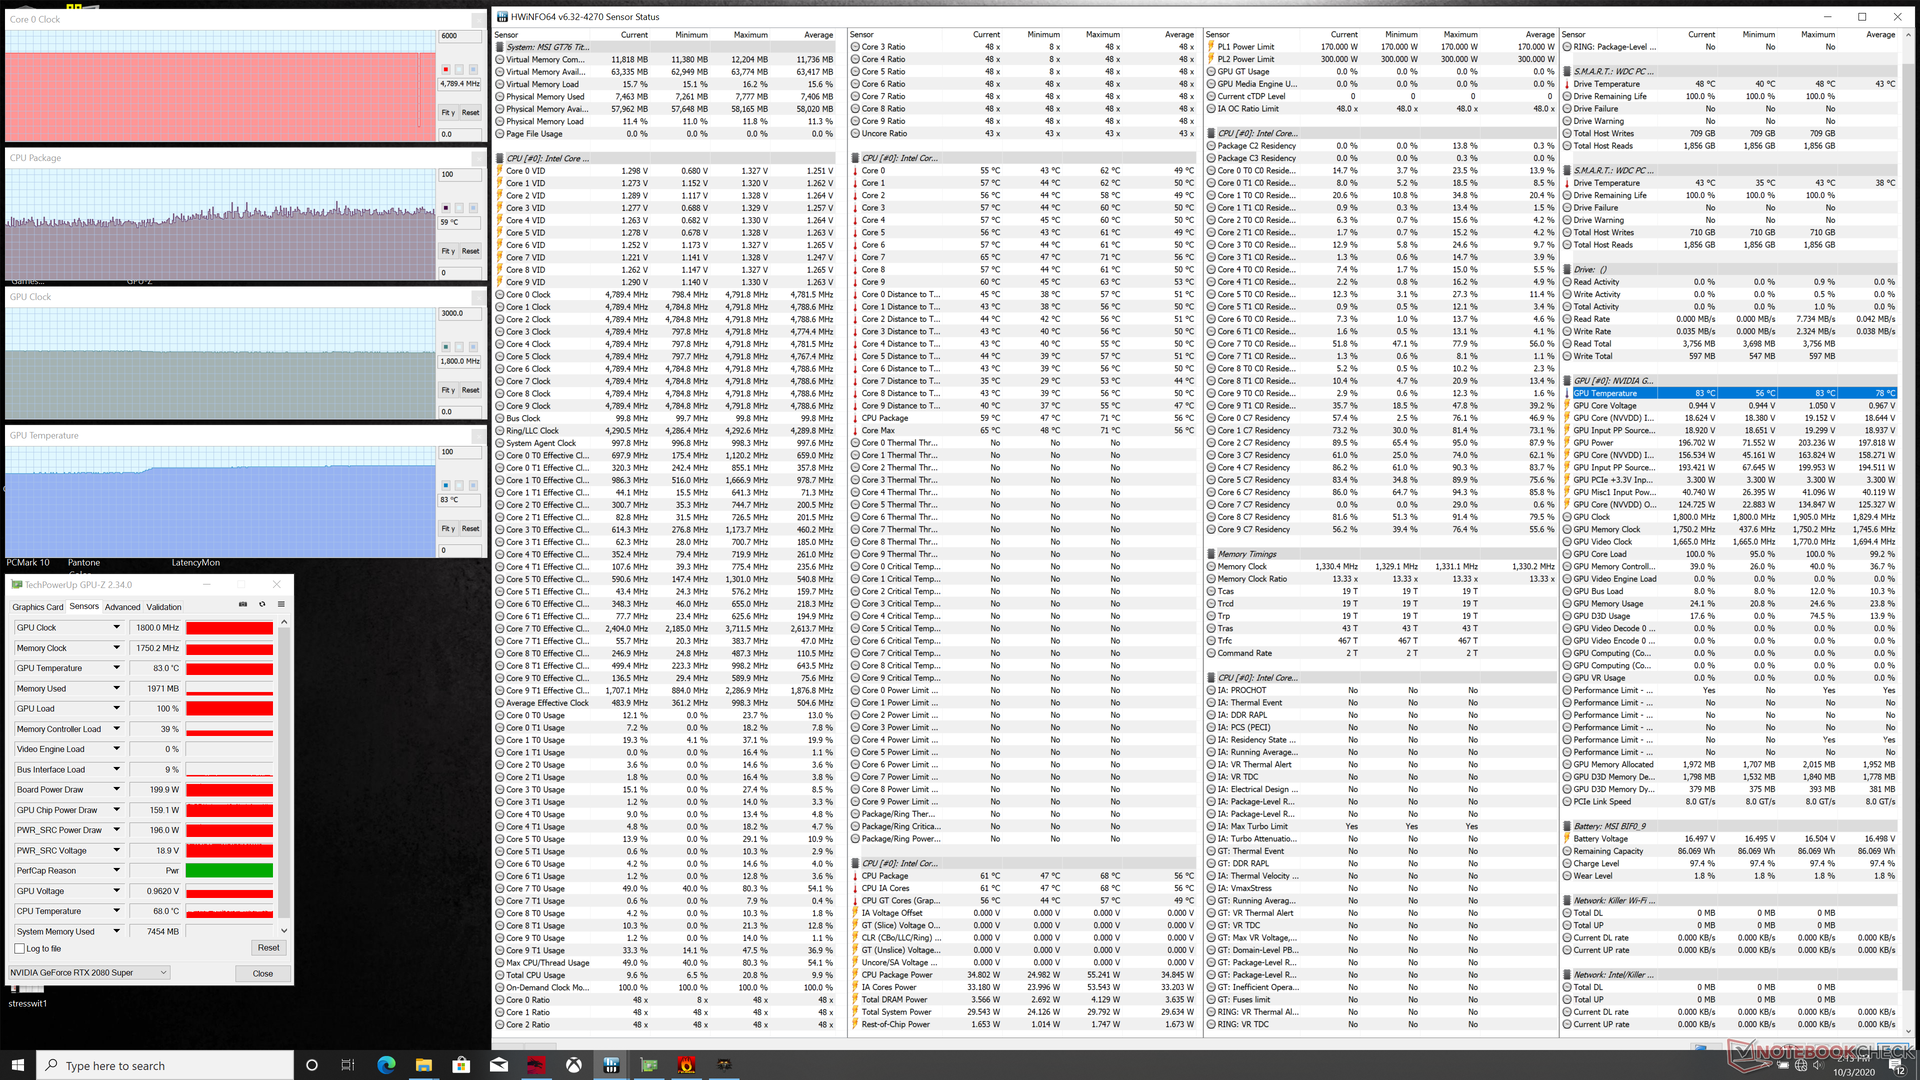
| CPU Clock (GHz) | GPU Clock (MHz) | Average CPU Temperature (°C) | Average GPU Temperature (°C) | |
| System Idle (Turbo Fan on) | -- | -- | 32 | 30 |
| Prime95 Stress (Turbo Fan on) | 4.8 | -- | 89 | 30 |
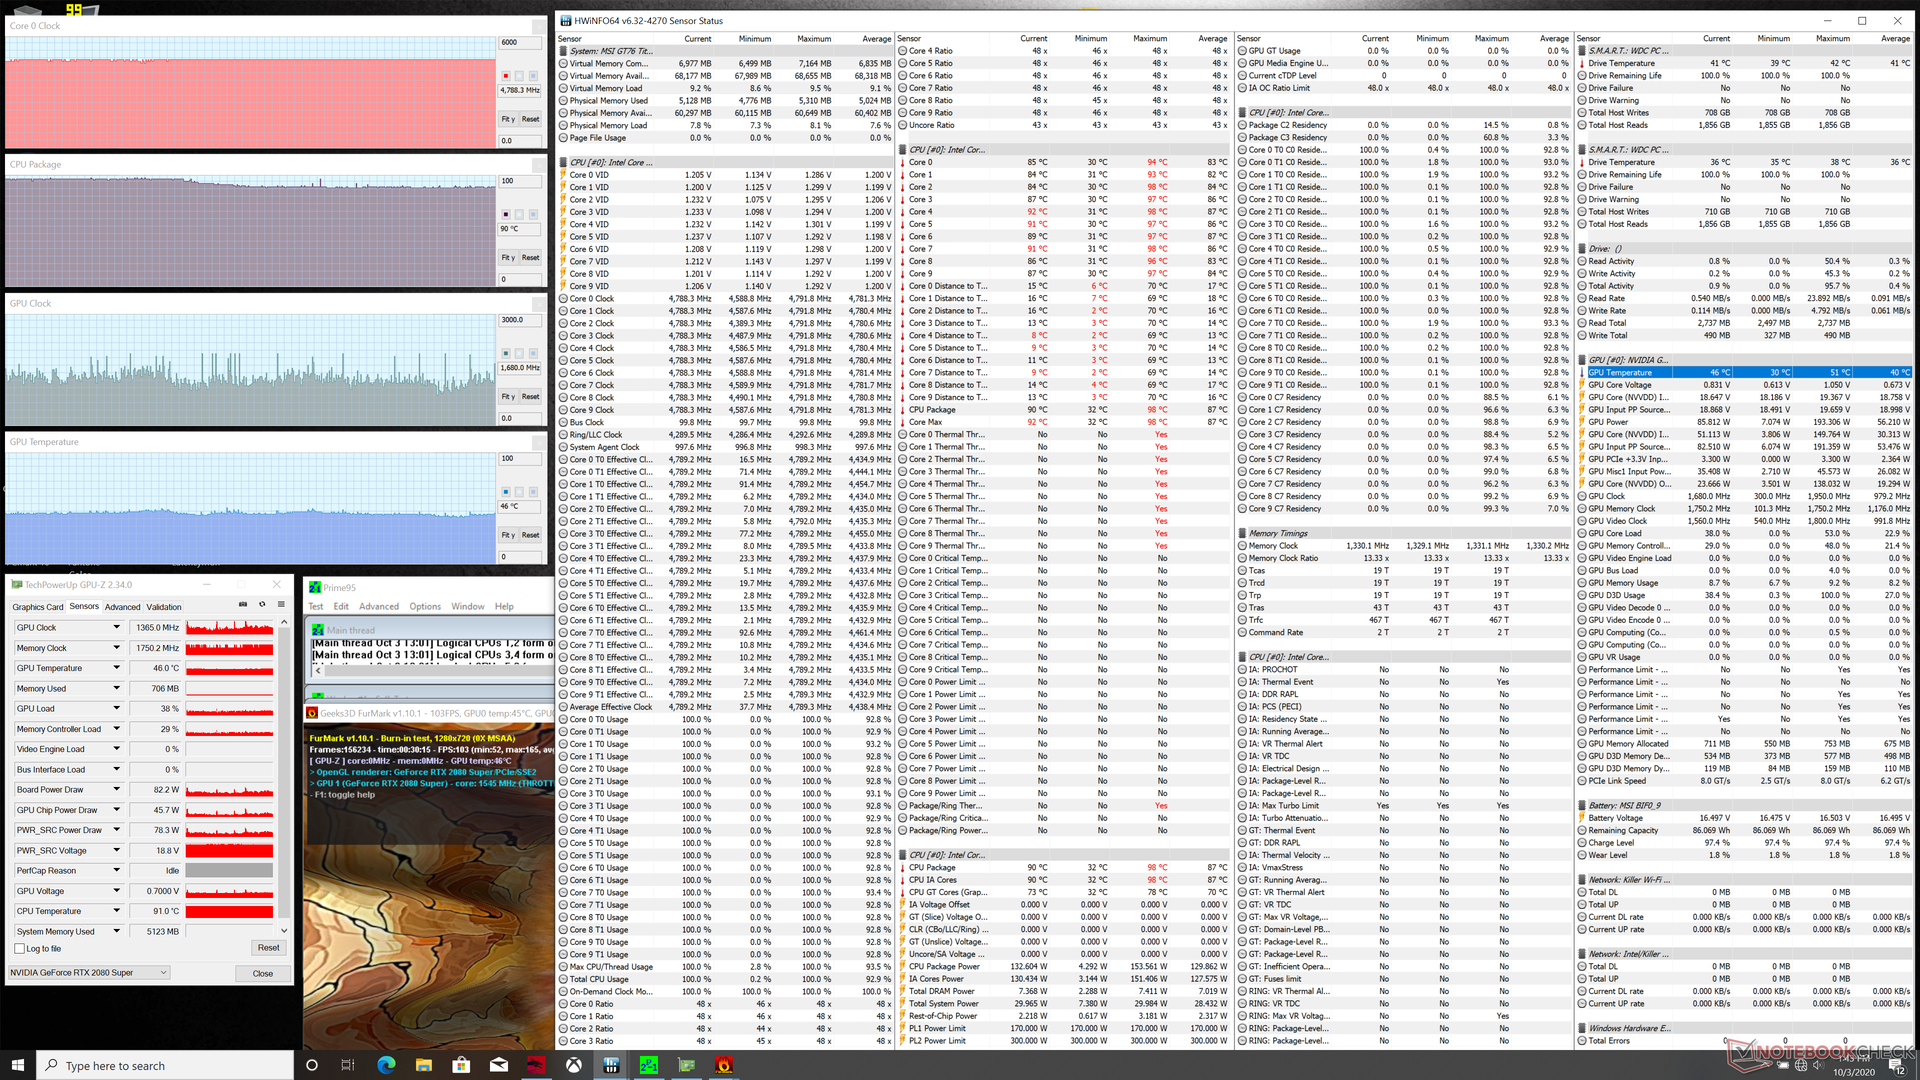
| Prime95 + FurMark Stress (Turbo Fan on) | 4.8 | ~1365 | 90 - 98 | 46 |
| Witcher 3 Stress (Turbo Fan on) | 4.8 | 1830 | ~53 | 77 |
| Witcher 3 Stress (Turbo Fan off) | 4.8 | 1800 | ~59 | 83 |
Altoparlanti


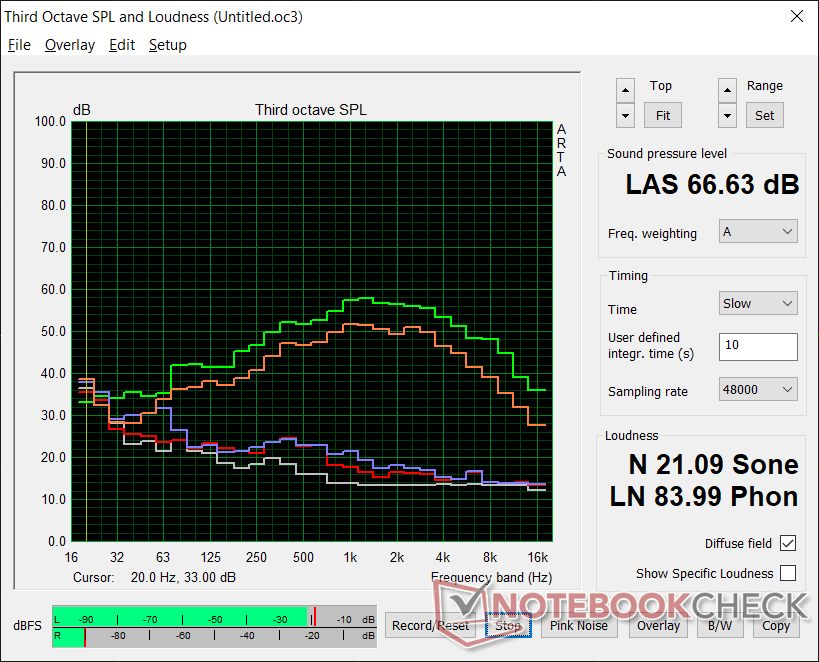
MSI GT76 Titan DT 10SGS analisi audio
(+) | gli altoparlanti sono relativamente potenti (83.2 dB)
Bassi 100 - 315 Hz
(±) | bassi ridotti - in media 8.6% inferiori alla media
(±) | la linearità dei bassi è media (11% delta rispetto alla precedente frequenza)
Medi 400 - 2000 Hz
(+) | medi bilanciati - solo only 3.1% rispetto alla media
(+) | medi lineari (6.9% delta rispetto alla precedente frequenza)
Alti 2 - 16 kHz
(+) | Alti bilanciati - appena 3% dalla media
(+) | alti lineari (5.5% delta rispetto alla precedente frequenza)
Nel complesso 100 - 16.000 Hz
(+) | suono nel complesso lineare (9.9% differenza dalla media)
Rispetto alla stessa classe
» 5% di tutti i dispositivi testati in questa classe è stato migliore, 2% simile, 94% peggiore
» Il migliore ha avuto un delta di 6%, medio di 18%, peggiore di 132%
Rispetto a tutti i dispositivi testati
» 4% di tutti i dispositivi testati in questa classe è stato migliore, 1% similare, 95% peggiore
» Il migliore ha avuto un delta di 4%, medio di 23%, peggiore di 134%
Apple MacBook 12 (Early 2016) 1.1 GHz analisi audio
(+) | gli altoparlanti sono relativamente potenti (83.6 dB)
Bassi 100 - 315 Hz
(±) | bassi ridotti - in media 11.3% inferiori alla media
(±) | la linearità dei bassi è media (14.2% delta rispetto alla precedente frequenza)
Medi 400 - 2000 Hz
(+) | medi bilanciati - solo only 2.4% rispetto alla media
(+) | medi lineari (5.5% delta rispetto alla precedente frequenza)
Alti 2 - 16 kHz
(+) | Alti bilanciati - appena 2% dalla media
(+) | alti lineari (4.5% delta rispetto alla precedente frequenza)
Nel complesso 100 - 16.000 Hz
(+) | suono nel complesso lineare (10.2% differenza dalla media)
Rispetto alla stessa classe
» 7% di tutti i dispositivi testati in questa classe è stato migliore, 2% simile, 90% peggiore
» Il migliore ha avuto un delta di 5%, medio di 18%, peggiore di 53%
Rispetto a tutti i dispositivi testati
» 5% di tutti i dispositivi testati in questa classe è stato migliore, 1% similare, 94% peggiore
» Il migliore ha avuto un delta di 4%, medio di 23%, peggiore di 134%
Gestione Energetica
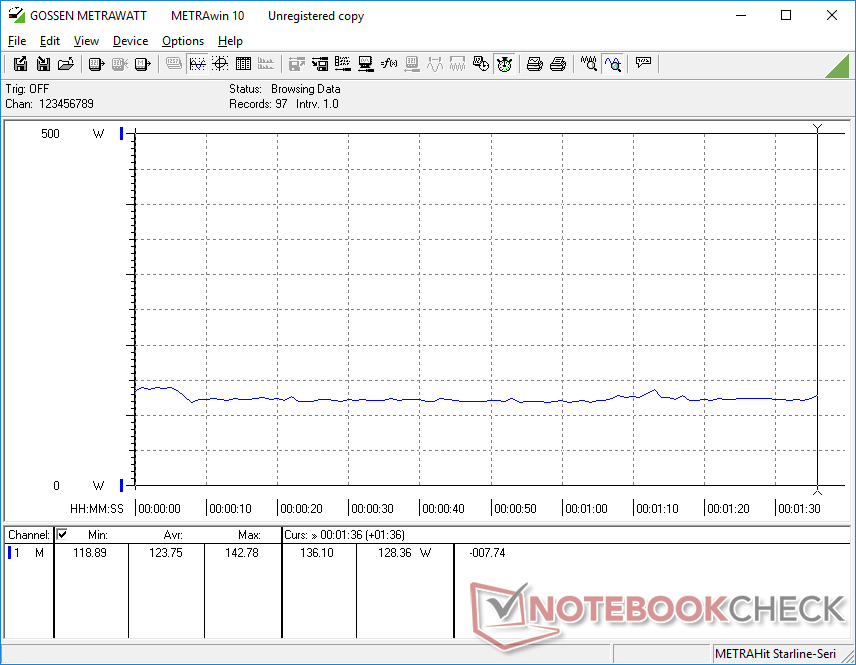
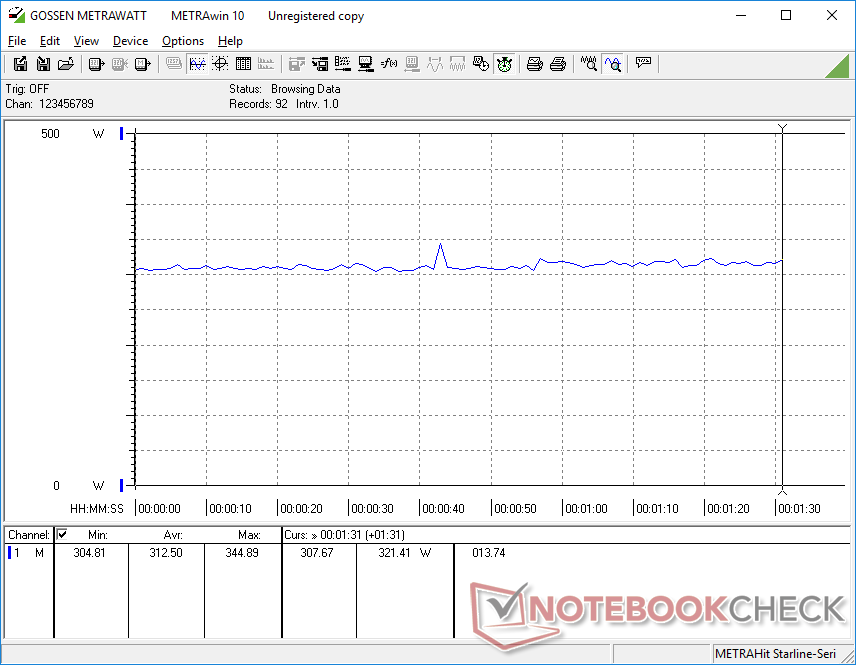
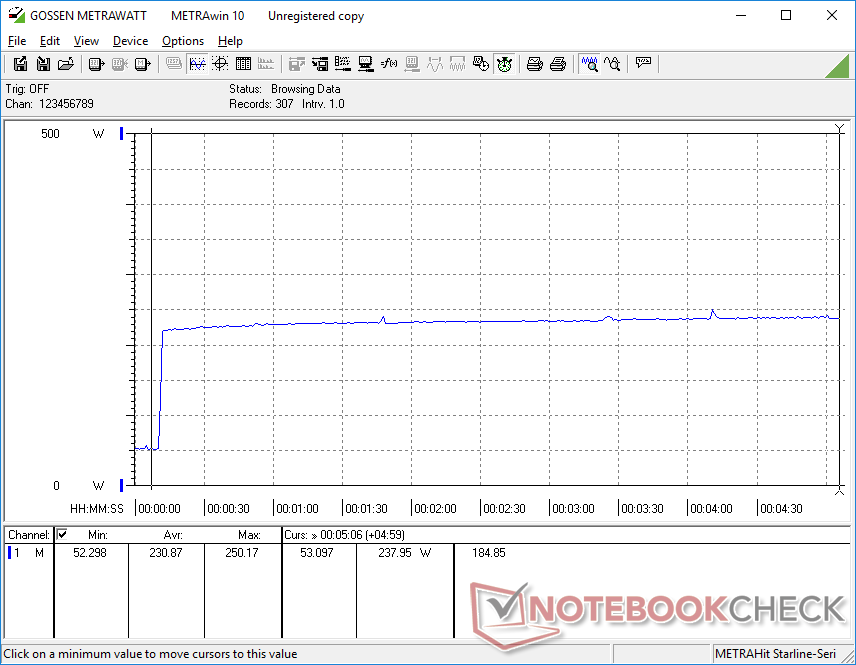
Consumo Energetico
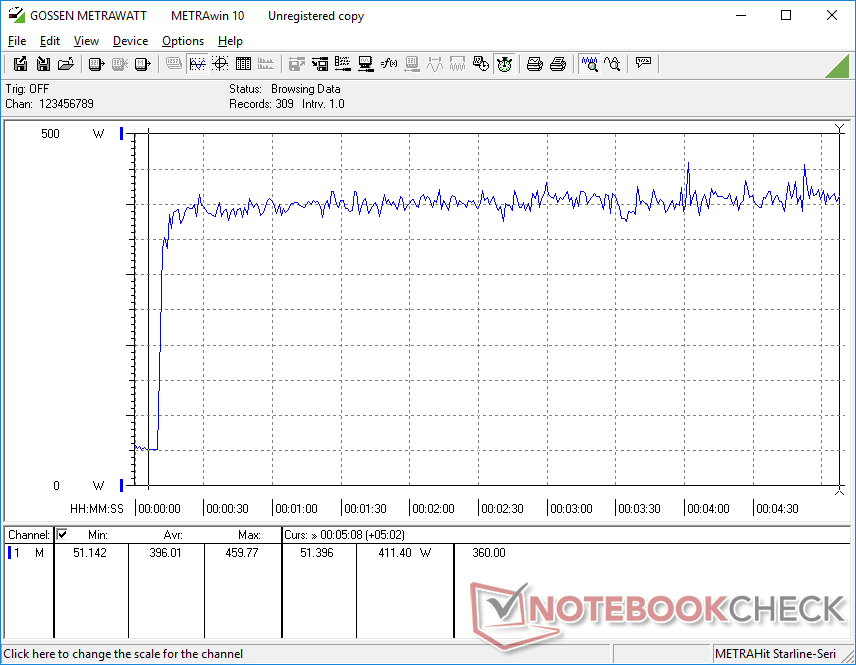
Il consumo energetico è molto elevato e compete con quello dell'Area Alienware-51m. Il consumo al minimo sul desktop arriva a 26 W fino a 54 W quando si è in modalità Ultimate Performance con Turbo Fan attivo. L'esecuzione di The Witcher 3 richiede 313 W o l'11% in più rispetto al GT76 Titan dell'anno scorso con la normale GeForce RTX 2080. Questo aumento è accettabile rispetto al 6% di vantaggio della GPU tra RTX 2080 e RTX 2080 Super e al 25% di vantaggio multithread tra i9-9900K e i9-10900K.
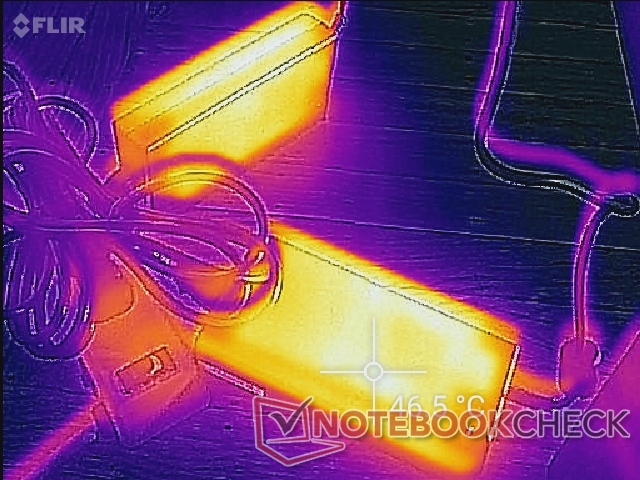
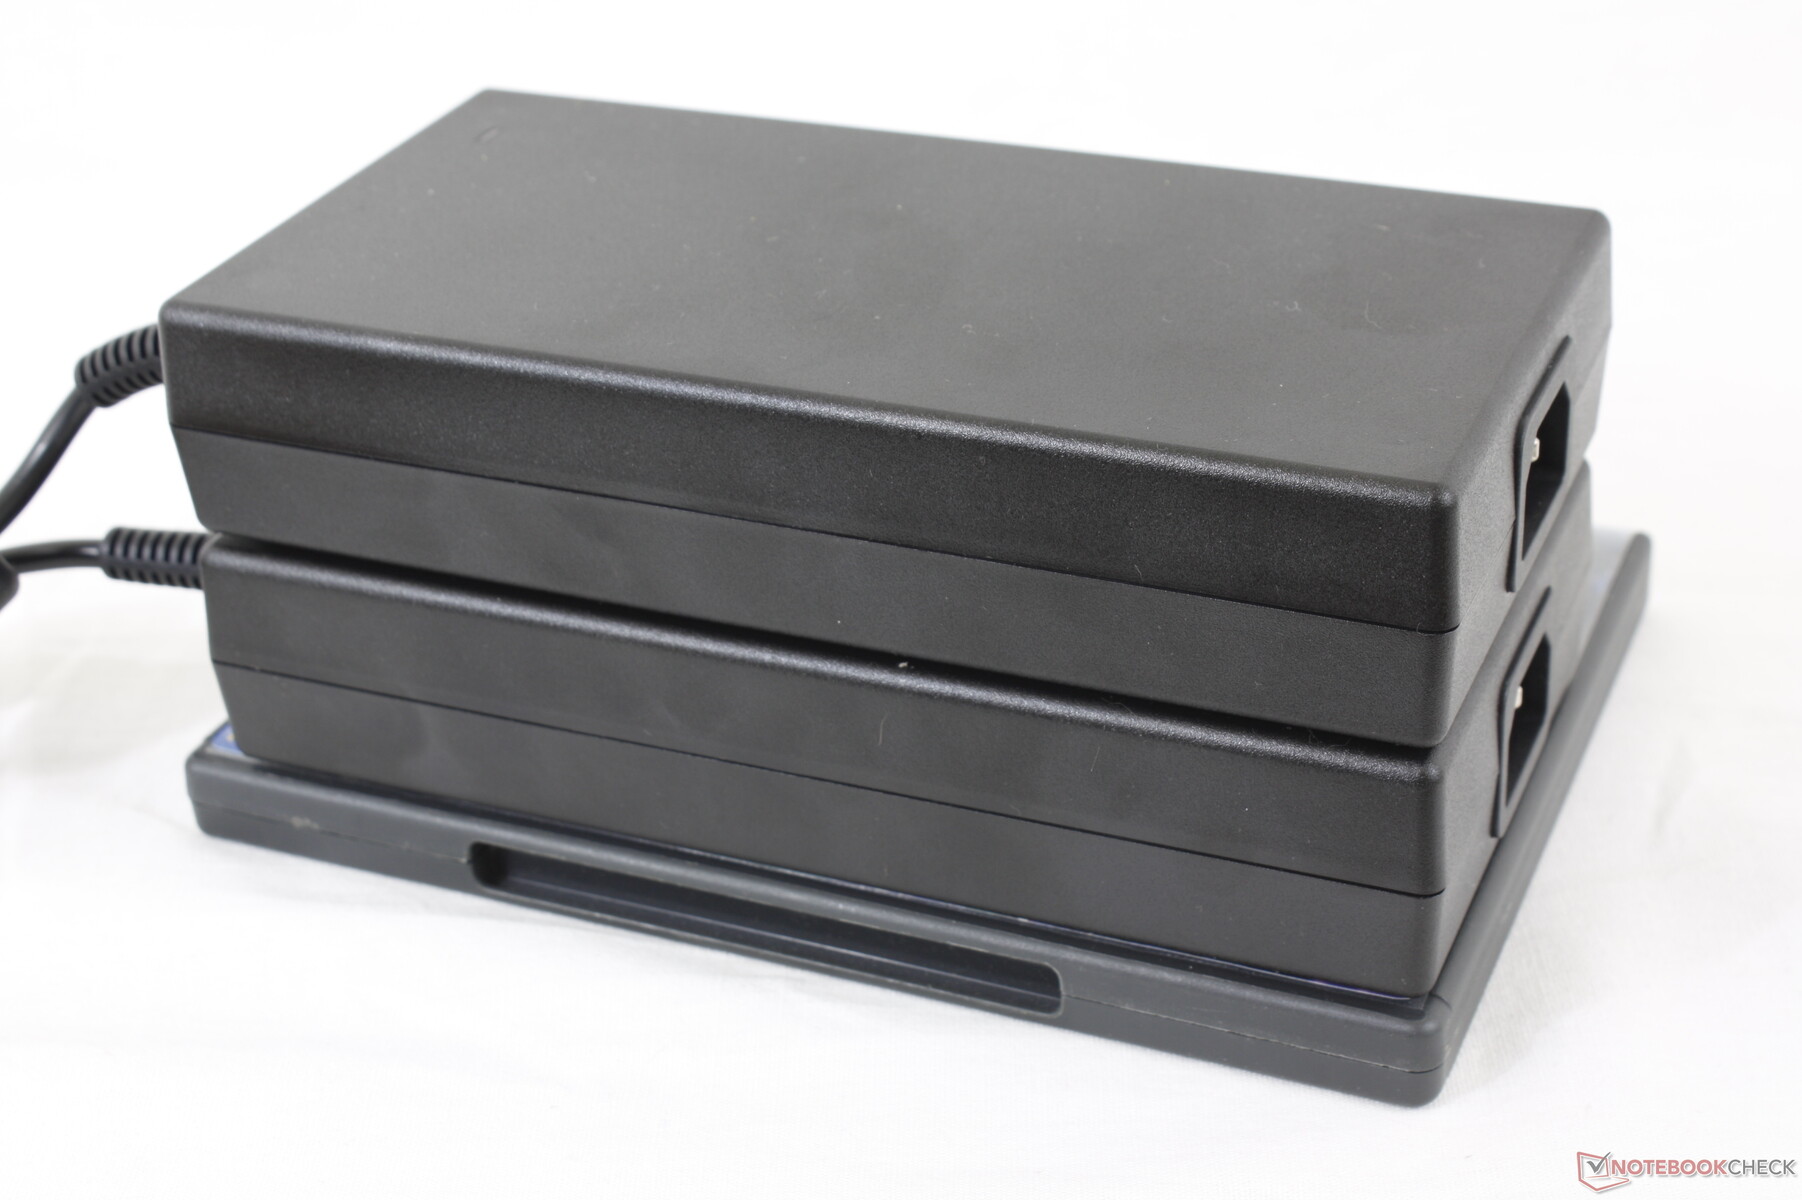
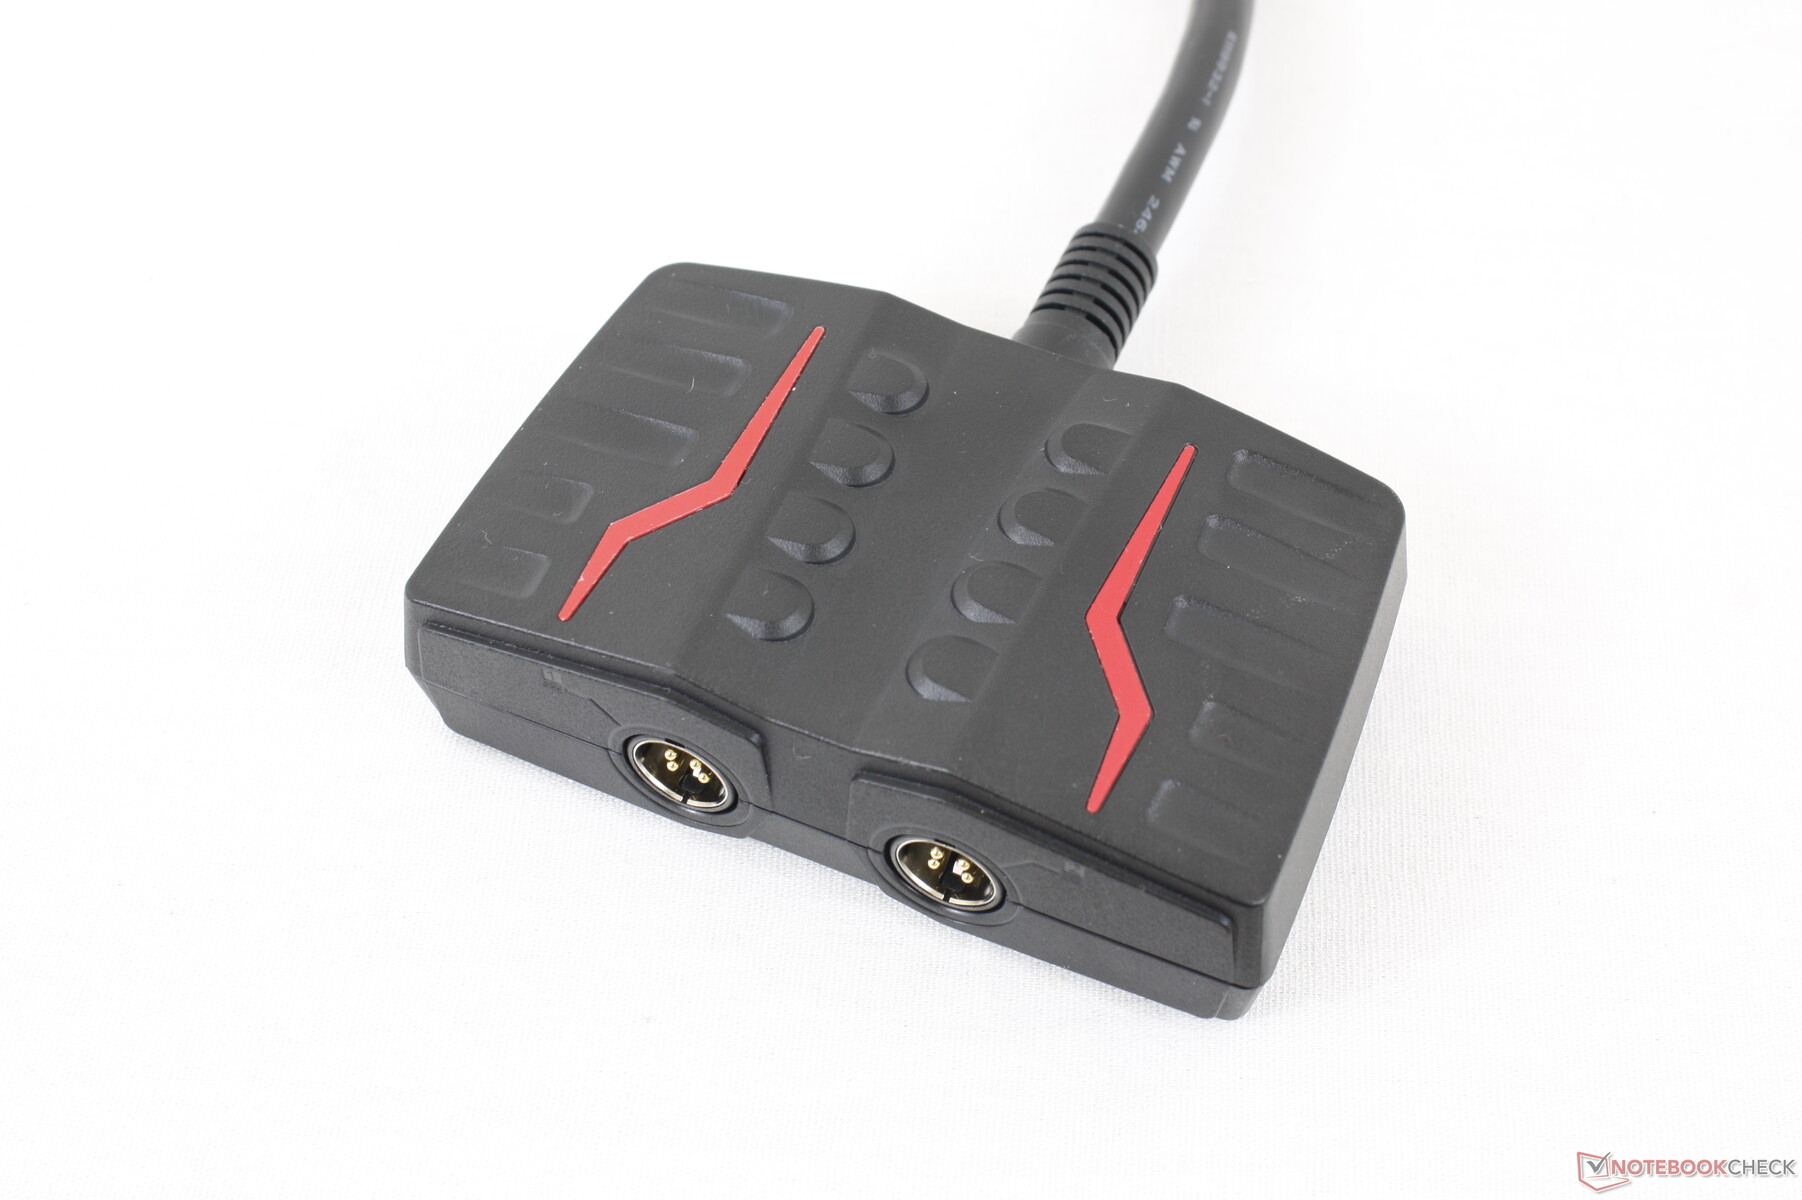
Siamo in grado di registrare un consumo massimo combinato di 459,8 W dai due grandi (2x ~17,8 x 9 x 3,6 cm) alimentatori da 230 W. Questi alimentatori Chicony sono utilizzati su una serie di altri portatili MSI ad alte prestazioni come il GS75. Ogni alimentatore ha un proprio cavo a tre poli che si collega a un adattatore MSI proprietario prima di raggiungere il laptop. Insieme, questi cavi e adattatori necessari pesano poco più di 2,4 kg.
| Off / Standby | |
| Idle | |
| Sotto carico |
|
Leggenda:
min: | |
| MSI GT76 Titan DT 10SGS i9-10900K, GeForce RTX 2080 Super Mobile, 2x WDC PC SN730 SDBPNTY-1T00 (RAID 0), IPS, 3840x2160, 17.3" | Asus ROG G703GXR i7-9750H, GeForce RTX 2080 Mobile, Samsung SSD PM981 MZVLB512HAJQ, IPS, 1920x1080, 17.3" | Alienware Area-51m i9-9900K RTX 2080 i9-9900K, GeForce RTX 2080 Mobile, 2x SK Hynix PC400 512GB (RAID 0), IPS, 1920x1080, 17.3" | Asus Strix Scar 17 G732LXS i9-10980HK, GeForce RTX 2080 Super Mobile, 2x Intel SSD 660p 1TB SSDPEKNW010T8 (RAID 0), IPS, 1920x1080, 17.3" | Schenker XMG Pro 17 PB71RD-G i7-9750H, GeForce RTX 2060 Mobile, Samsung SSD 970 EVO Plus 500GB, IPS, 1920x1080, 17.3" | MSI GE75 9SG i9-9880H, GeForce RTX 2080 Mobile, Samsung SSD PM981 MZVLB1T0HALR, AHVA, 1920x1080, 17.3" | MSI GT76 Titan DT 9SG i9-9900K, GeForce RTX 2080 Mobile, 2x Samsung PM961 MZVLW256HEHP (RAID 0), IPS, 1920x1080, 17.3" | |
|---|---|---|---|---|---|---|---|
| Power Consumption | 13% | 7% | 22% | 48% | 38% | 30% | |
| Idle Minimum * (Watt) | 25.9 | 27 -4% | 23.3 10% | 16 38% | 11 58% | 13.9 46% | 14 46% |
| Idle Average * (Watt) | 38 | 32 16% | 33.5 12% | 25 34% | 18 53% | 18.8 51% | 18 53% |
| Idle Maximum * (Watt) | 53.2 | 39 27% | 38.4 28% | 35 34% | 28 47% | 23.1 57% | 23 57% |
| Load Average * (Watt) | 123.8 | 124 -0% | 114.1 8% | 177 -43% | 99 20% | 112.3 9% | 114 8% |
| Witcher 3 ultra * (Watt) | 312.5 | 274 12% | 339.5 -9% | 227 27% | 146 53% | 231 26% | 283 9% |
| Load Maximum * (Watt) | 459.8 | 338 26% | 485.1 -6% | 280 39% | 210 54% | 291.5 37% | 443 4% |
* ... Meglio usare valori piccoli
Durata della batteria
L'autonomia è breve con poco meno di 2,5 ore di utilizzo della WLAN nel mondo reale quando si è sul profilo Balanced nonostante la grande batteria da 90 Wh. La ricarica completa richiede due ore piene. Tenere presente che entrambi gli alimentatori devono essere collegati, altrimenti il laptop non si ricaricherà affatto, a differenza dell'Alienware Area-51m.
Il sistema non può essere ricaricato tramite USB-C.
| MSI GT76 Titan DT 10SGS i9-10900K, GeForce RTX 2080 Super Mobile, 90 Wh | Asus ROG G703GXR i7-9750H, GeForce RTX 2080 Mobile, 96 Wh | Alienware Area-51m i9-9900K RTX 2080 i9-9900K, GeForce RTX 2080 Mobile, 90 Wh | Asus Strix Scar 17 G732LXS i9-10980HK, GeForce RTX 2080 Super Mobile, 66 Wh | Schenker XMG Pro 17 PB71RD-G i7-9750H, GeForce RTX 2060 Mobile, 62 Wh | MSI GE75 9SG i9-9880H, GeForce RTX 2080 Mobile, 65 Wh | MSI GT76 Titan DT 9SG i9-9900K, GeForce RTX 2080 Mobile, 90 Wh | |
|---|---|---|---|---|---|---|---|
| Autonomia della batteria | 154% | -12% | 146% | 71% | 104% | 108% | |
| WiFi v1.3 (h) | 2.4 | 6.1 154% | 2.1 -12% | 5.9 146% | 4.1 71% | 4.9 104% | 5 108% |
| Reader / Idle (h) | 8.1 | 2.6 | 10 | 5.2 | 6.8 | ||
| Load (h) | 1 | 1.1 | 1.5 | 1.3 | 0.9 |
Pro
Contro
Giudizio Complessivo
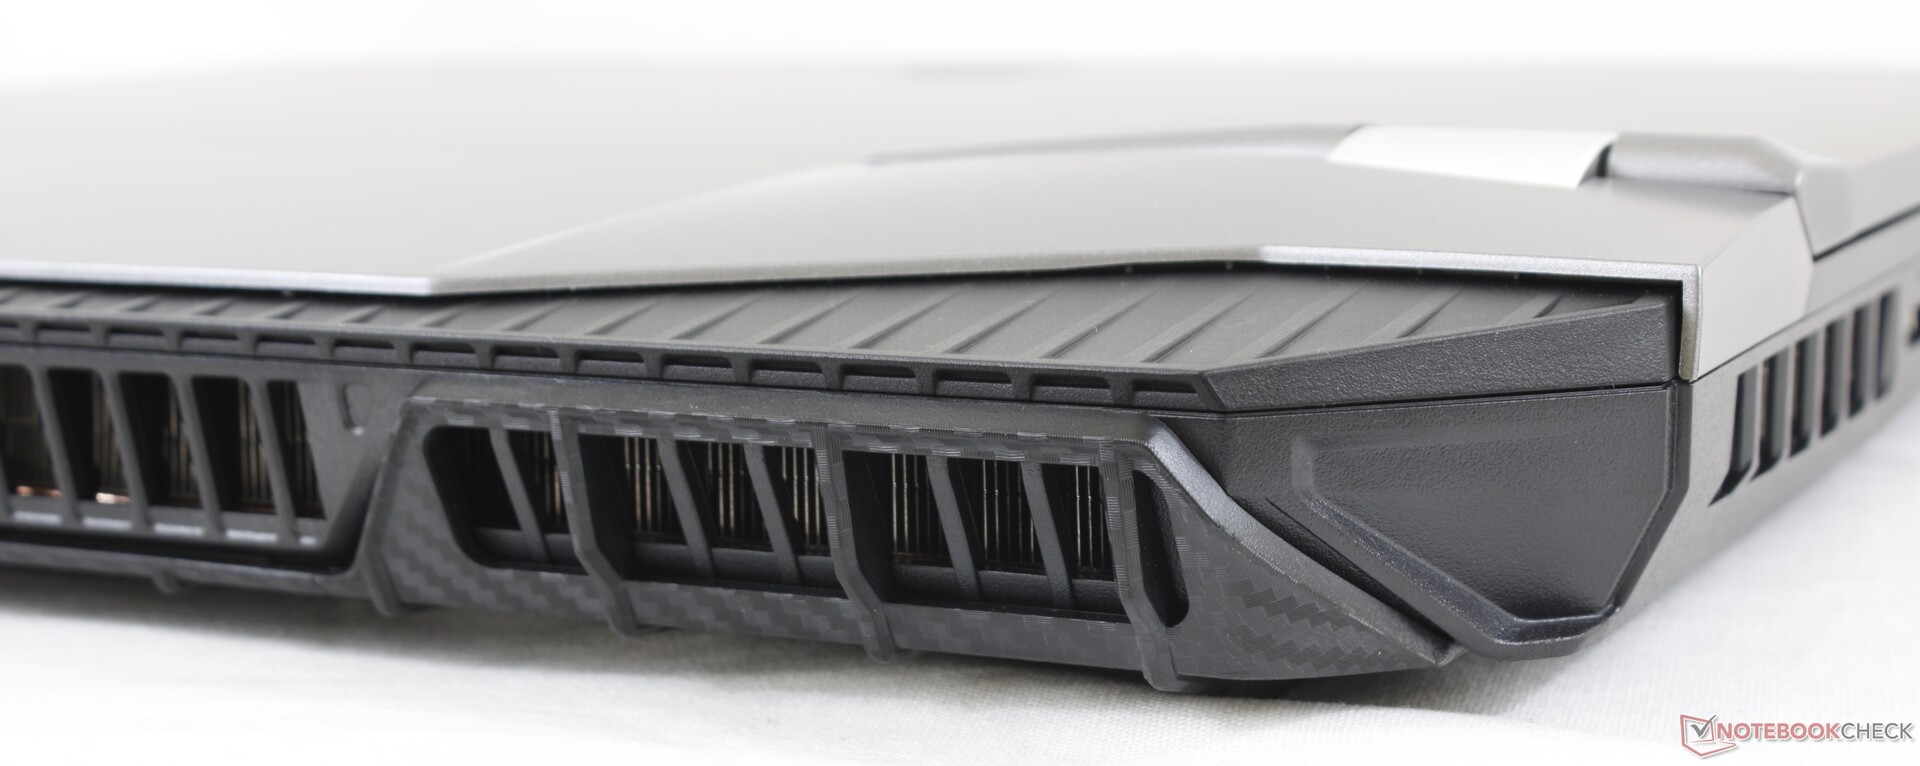
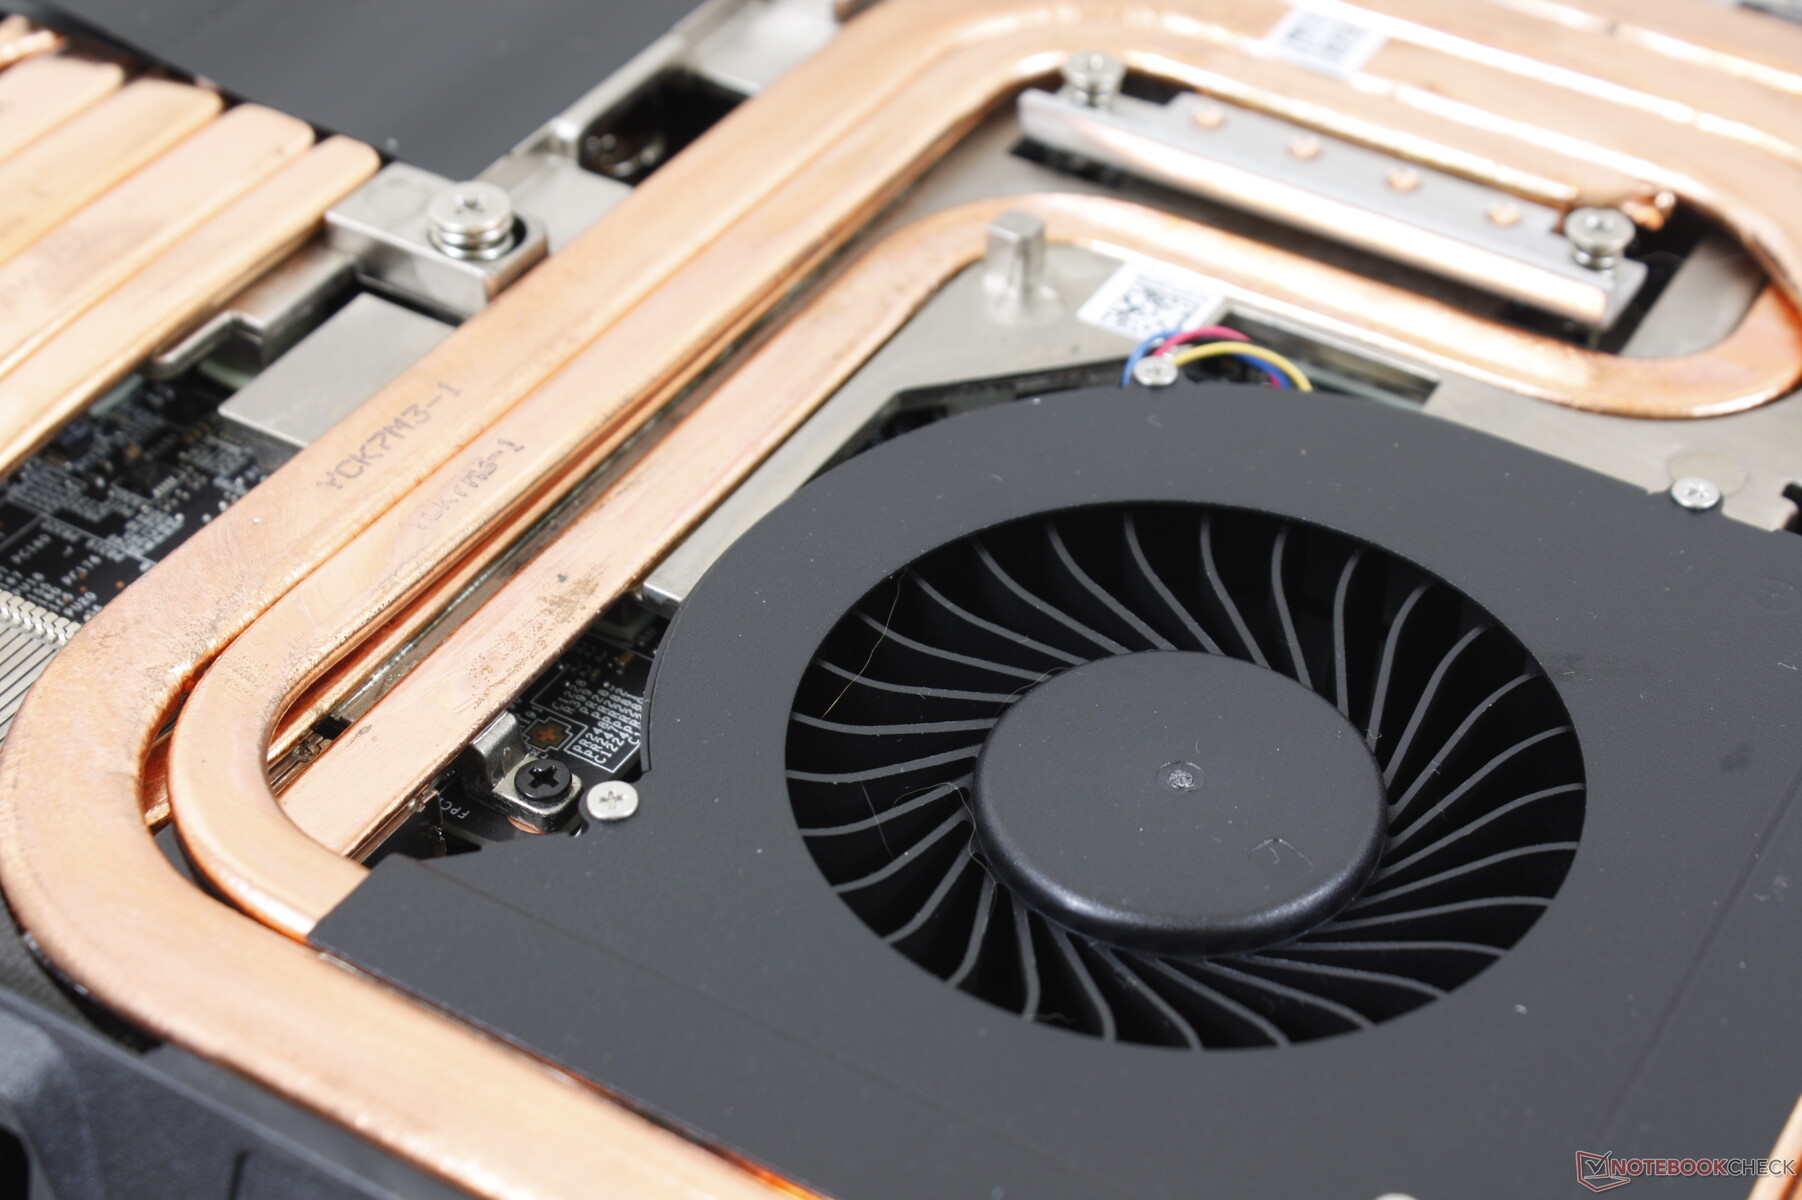
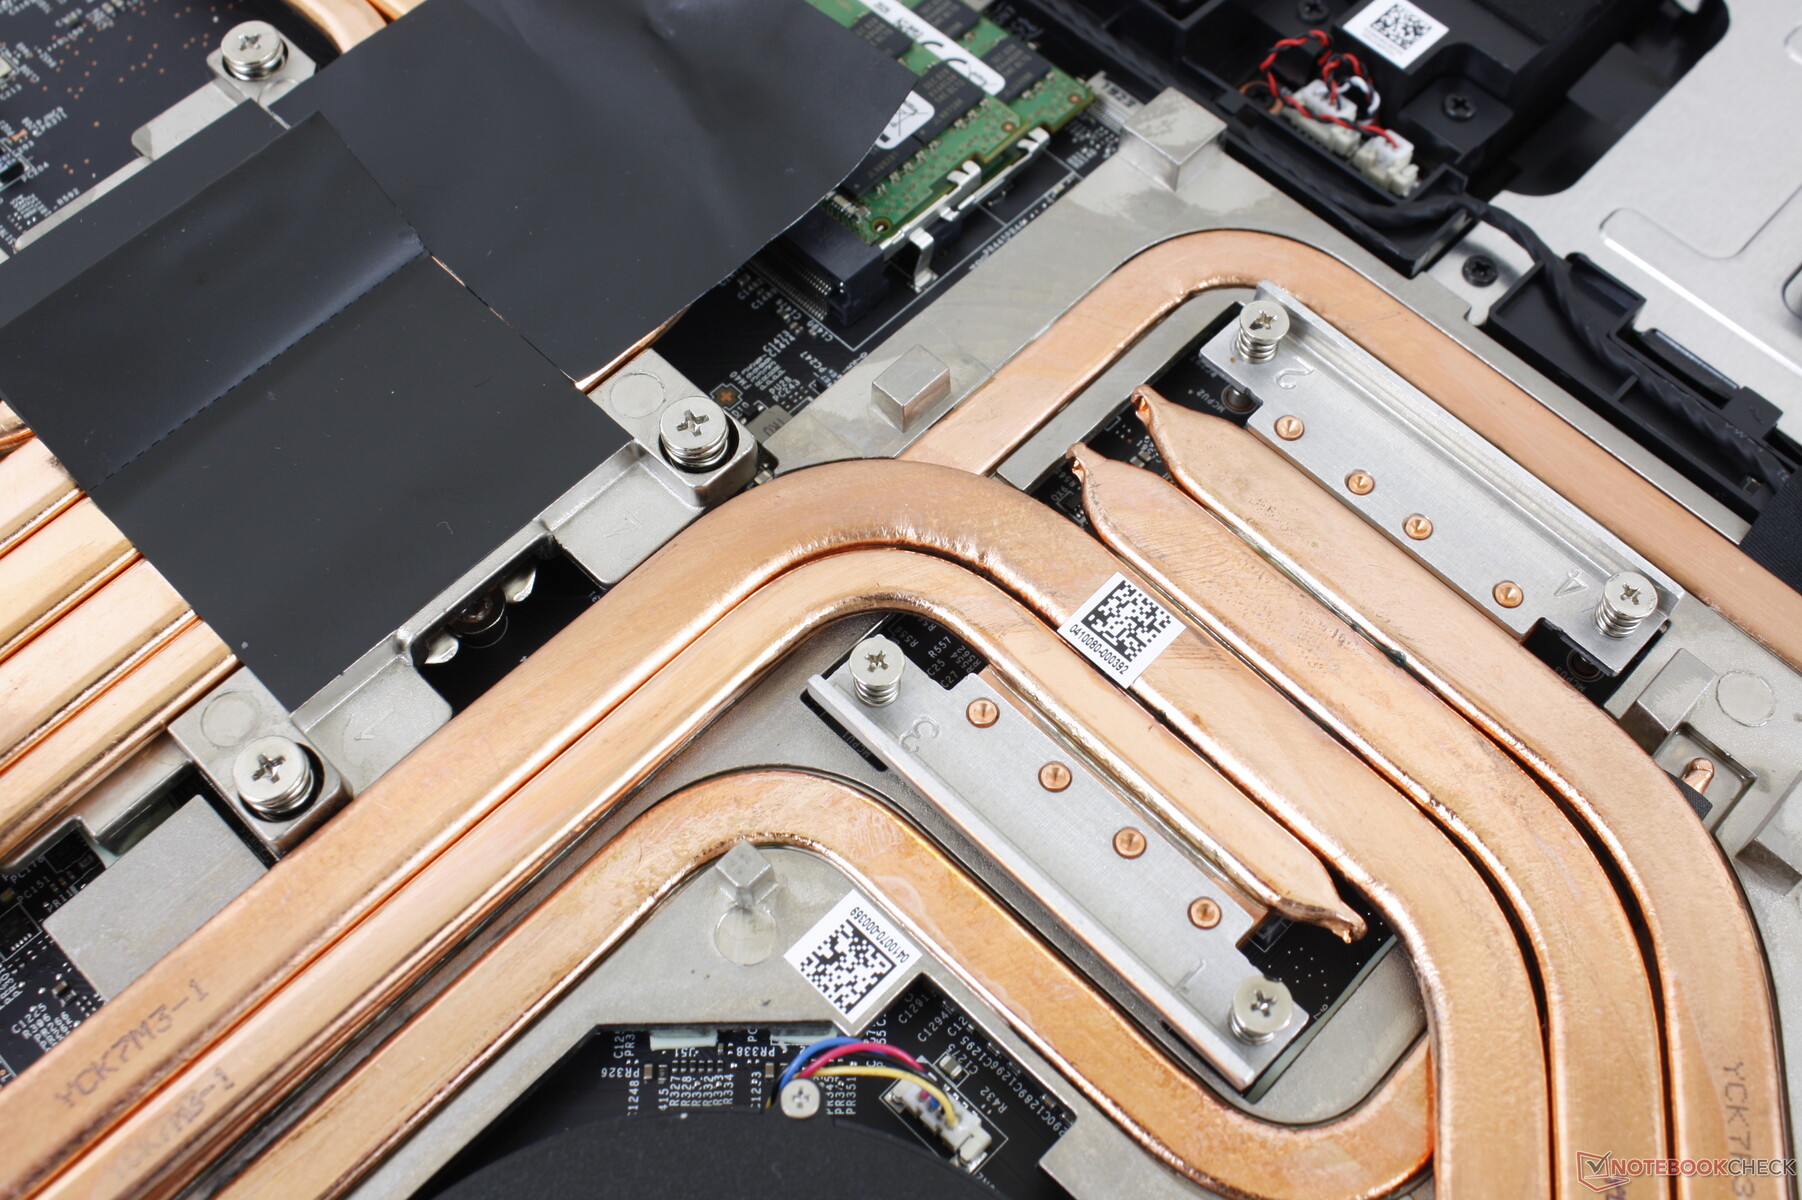
Il GT76 Titan ha un vantaggio fondamentale rispetto sia al Dell Alienware Area-51m che all'Asus ROG G703: le temperature del core. Il sistema MSI è in grado di far funzionare i suoi processori a temperature basse quando è sottoposto a carichi impegnativi come il gaming, il che non sorprende dato che la sua rete di 11 tubi di calore interni è la più grande che abbiamo mai visto su un portatile da 17,3 pollici. La CPU e la GPU sono raffreddate in modo indipendente senza tubi di calore sovrapposti per supportare meglio gli sforzi di overclocking.
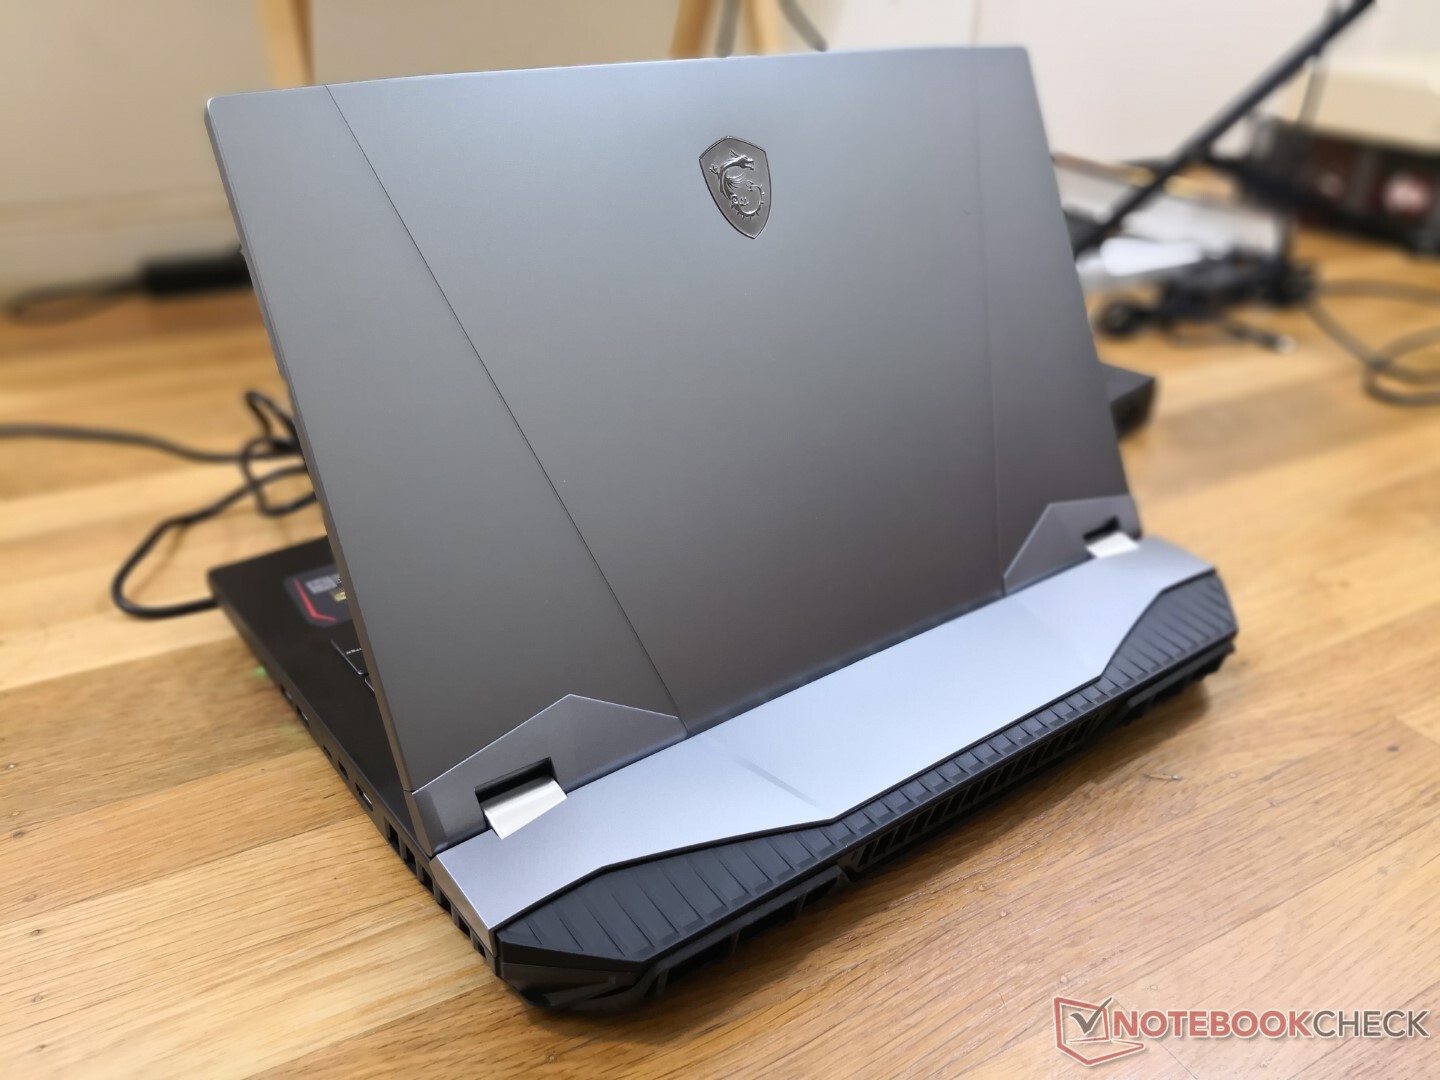
Altri vantaggi degni di nota sono il robusto design dello chassis, la facilità di manutenzione e l'opzione di display UHD 4K a 120 Hz, che non è ancora una caratteristica comune.
Ci sono una serie di svantaggi. Il rumore della ventola è ancora molto forte quando si eseguono carichi impegnativi e i due alimentatori e i cavi possono essere ancora più ingombranti da portare in giro rispetto al laptop stesso. Anche le dimensioni del telaio sono molto grandi anche per la categoria a causa della soluzione di raffreddamento posteriore sporgente e allargata. Il pannello inferiore può essere difficile da rimettere a posto e la mancanza sia di ricarica USB-C che di G-Sync è un'occasione persa.
Le temperature del core sono più basse rispetto a quelle di molti concorrenti in questa categoria con le stesse opzioni desktop Core i9 e RTX Super. Dovrete trascurare le ventole rumorose e gli ingombranti alimentatori per ottenere il massimo da questa desktop replacement.
MSI GT76 Titan DT 10SGS
- 10/05/2020 v7 (old)
Allen Ngo
Price comparison
