Recensione della Workstation MSI WS66 10TMT: più veloce del Razer Blade 15 Studio Edition
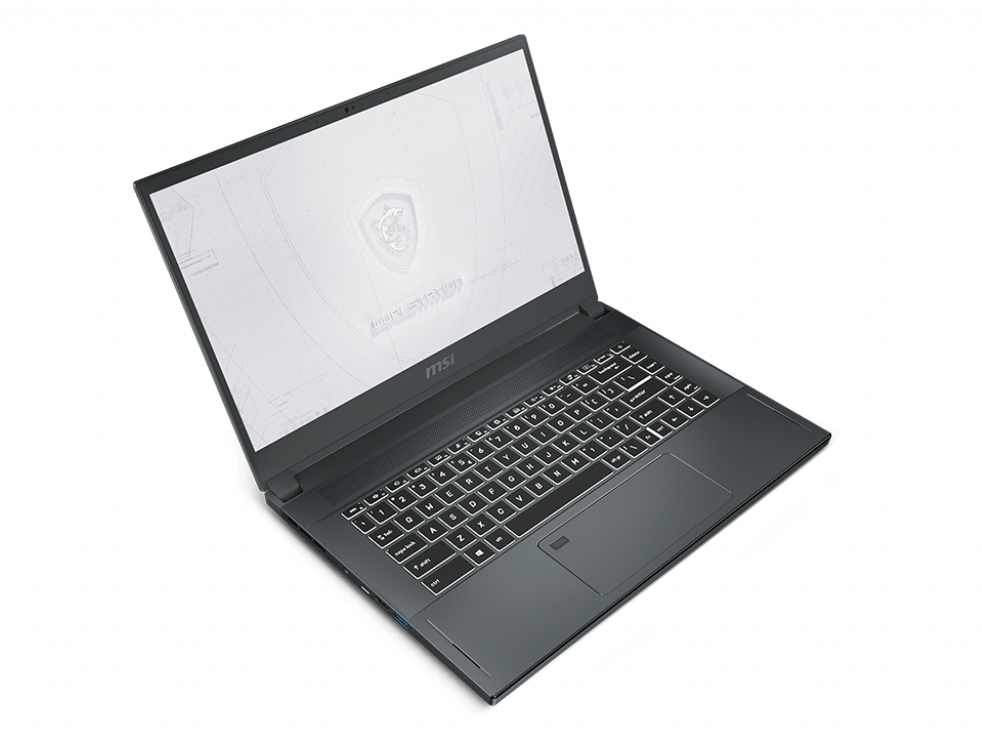
La WS66 è l'ultima workstation mobile ultrasottile di MSI, derivata dal portatile gaming GS66, che sostituisce le WS63 e WS65 dell'anno scorso. Si tratta di una riprogettazione completa rispetto al modello di ultima generazione per competere meglio con altre eleganti workstation Nvidia Studio come la Razer Blade 15 Studio, la serie Asus ProArt, HP ZBook Studio o il Dell Precision 5550.
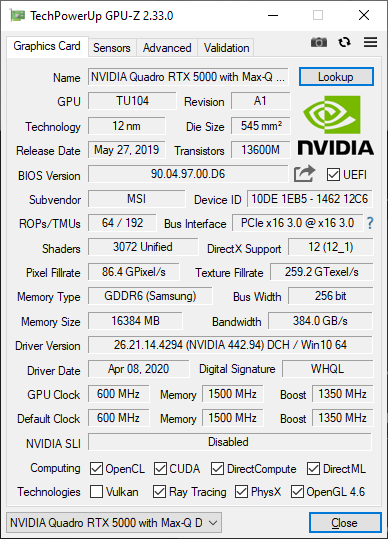
Le versioni attuali vanno dalla CPU Core i7-10875H, GPU Quadro RTX 3000 e touchscreen FHD per $2500 fino al Core i9-10980HK, Quadro RTX 5000 Max-Q e touchscreen UHD 4K per un massimo di $4000 a seconda della RAM o dello storage.
Consigliamo di controllare le nostre recesioni della GS66 per ulteriori informazioni su telaio, tastiera, clickpad e altre caratteristiche fisiche, dato che la WS66 condivide quasi lo stesso design esterno.
Altre recensioni MSI:
Punteggio | Data | Modello | Peso | Altezza | Dimensione | Risoluzione | Prezzo |
|---|---|---|---|---|---|---|---|
| 83.4 % v7 (old) | 09/2020 | MSI WS66 10TMT-207US i9-10980HK, Quadro RTX 5000 Max-Q | 2.3 kg | 19.8 mm | 15.60" | 1920x1080 | |
| 87.8 % v7 (old) | 09/2020 | Dell Precision 7550 W-10885M, Quadro RTX 5000 Max-Q | 2.8 kg | 27.36 mm | 15.60" | 3840x2160 | |
| 86.3 % v7 (old) | 08/2020 | Dell Precision 5550 P91F i7-10875H, Quadro T2000 Max-Q | 2 kg | 18 mm | 15.60" | 3840x2400 | |
| 87 % v7 (old) | 08/2020 | Razer Blade 15 Studio Edition 2020 i7-10875H, Quadro RTX 5000 Max-Q | 2.2 kg | 13.98 mm | 15.60" | 3840x2160 | |
| 85.6 % v6 (old) | 09/2017 | MSI WS63VR 7RL-023US i7-7700HQ, Quadro P4000 Max-Q | 1.9 kg | 18 mm | 15.60" | 3840x2160 | |
| 82.1 % v7 (old) | 06/2020 | Acer ConceptD 3 Pro CN315-71P-73W1 i7-9750H, Quadro T1000 (Laptop) | 2.4 kg | 23.4 mm | 15.60" | 1920x1080 |
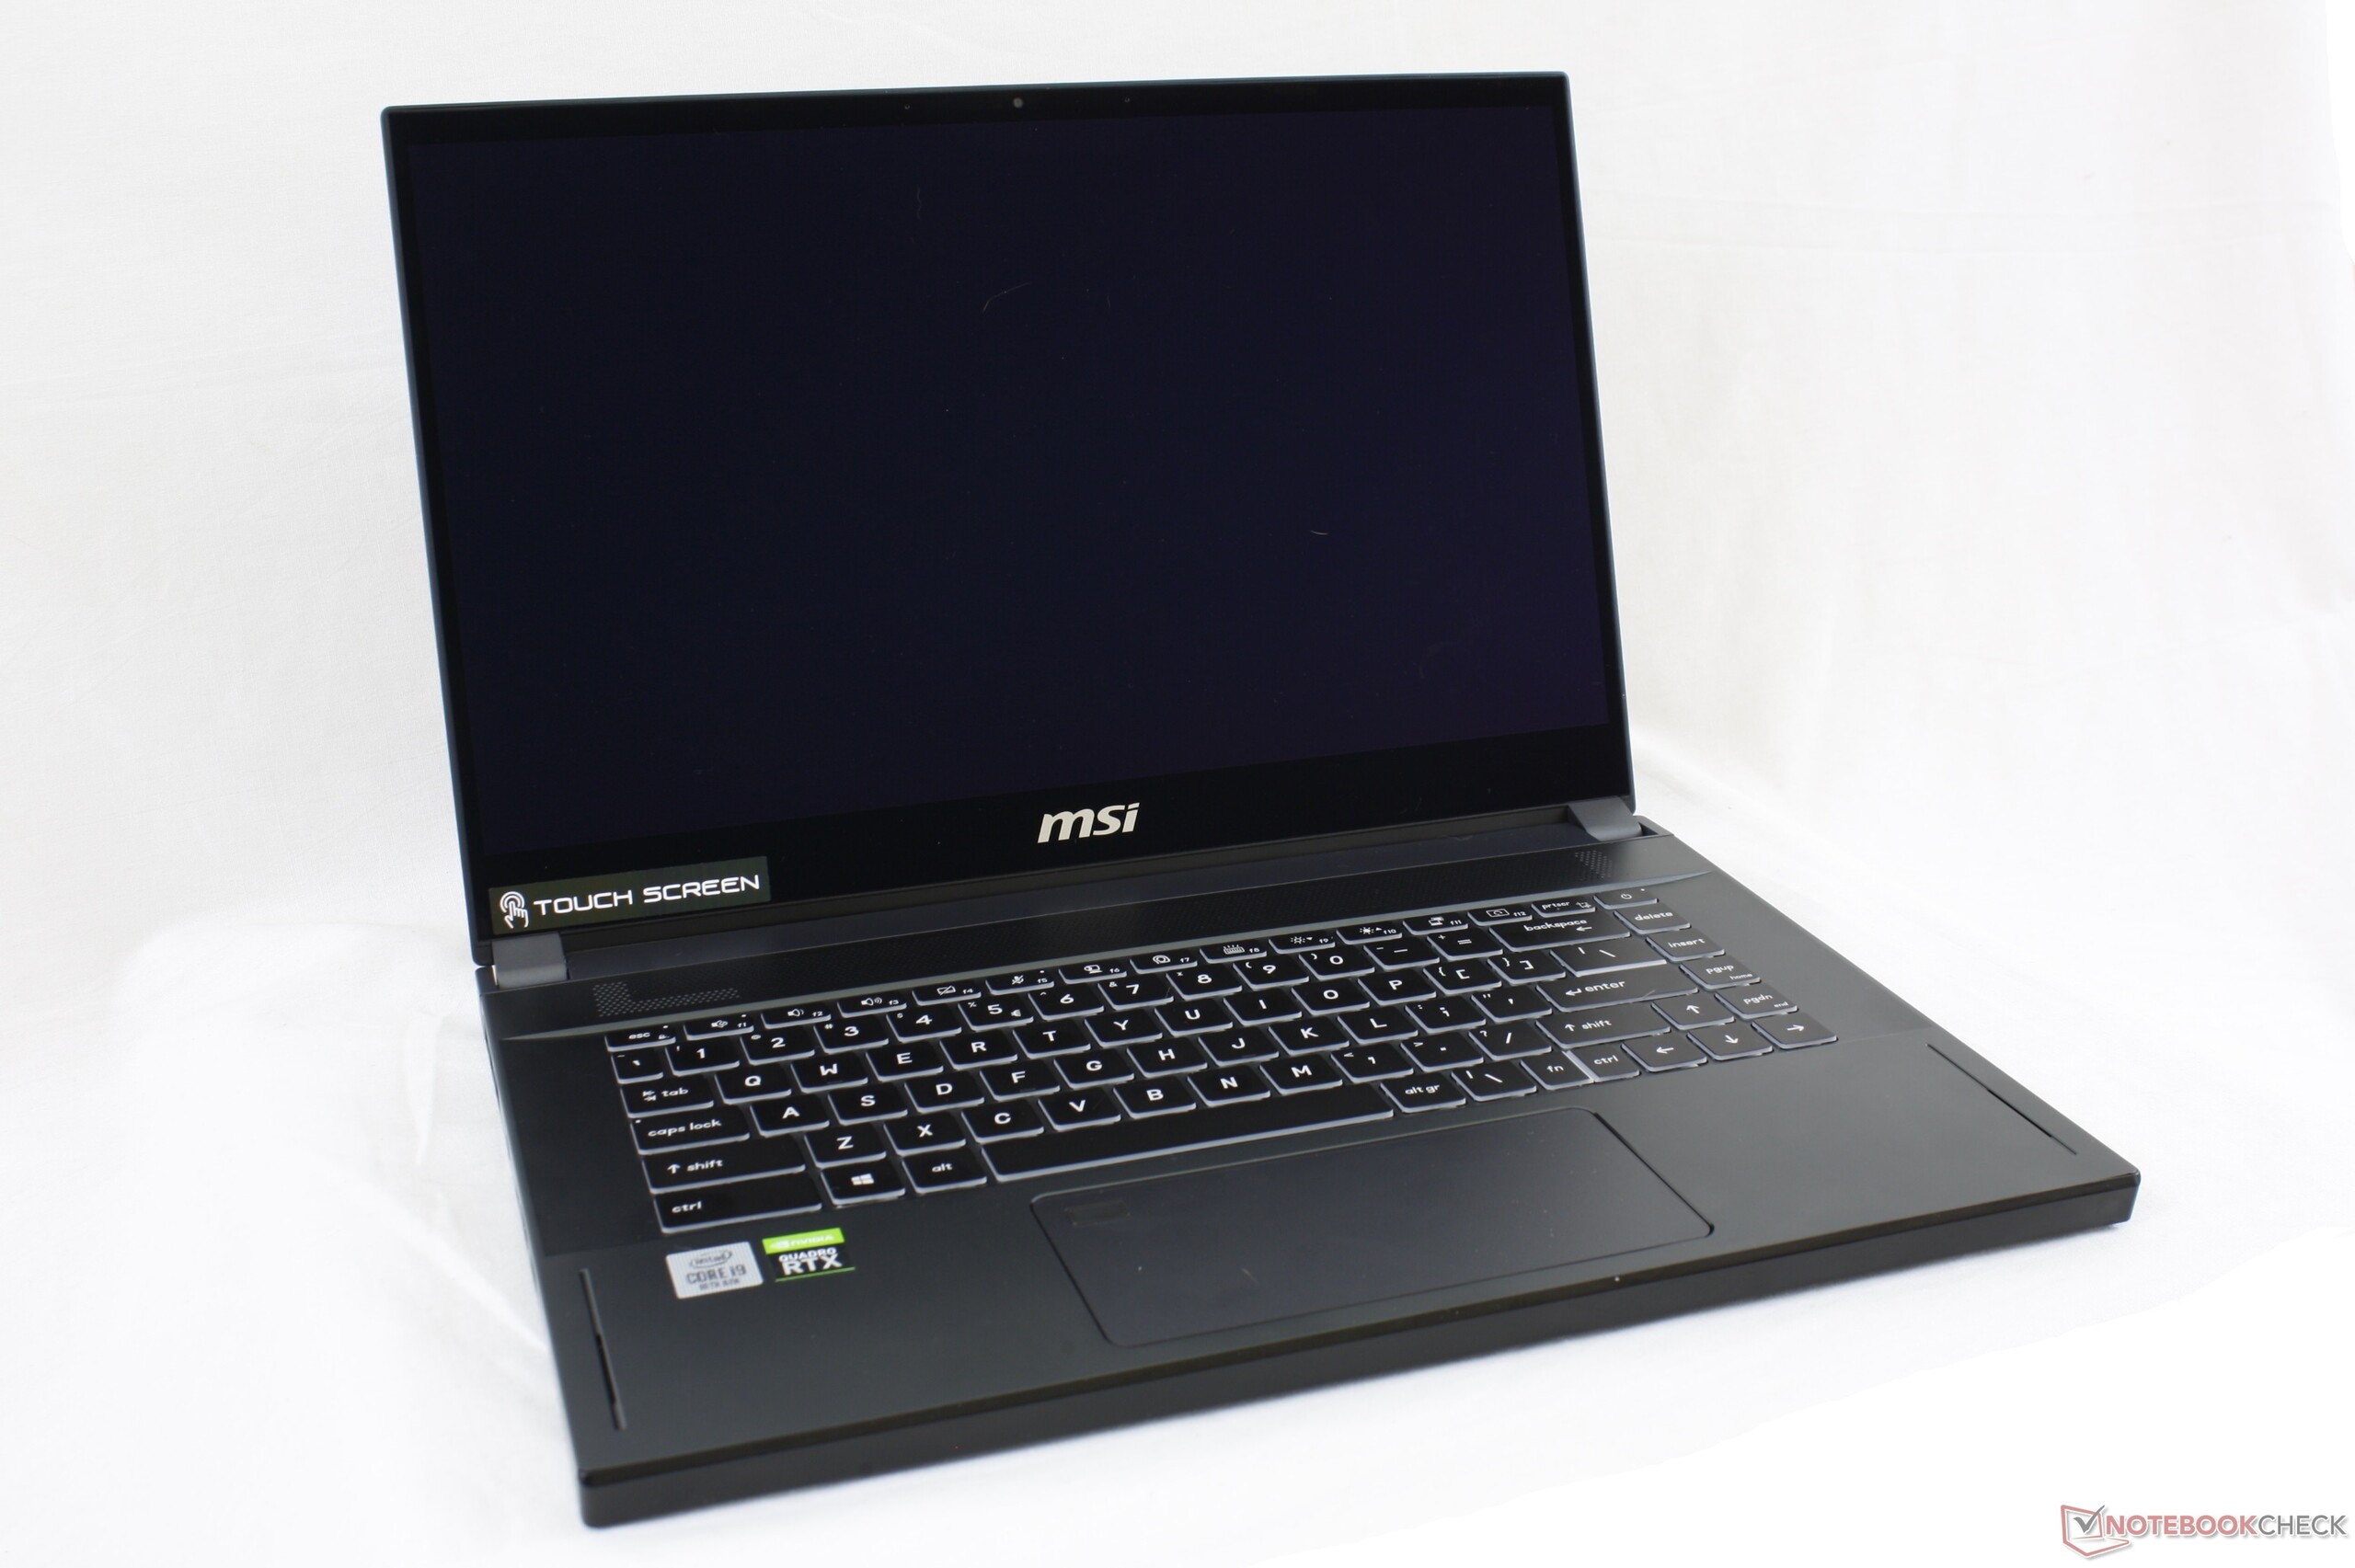
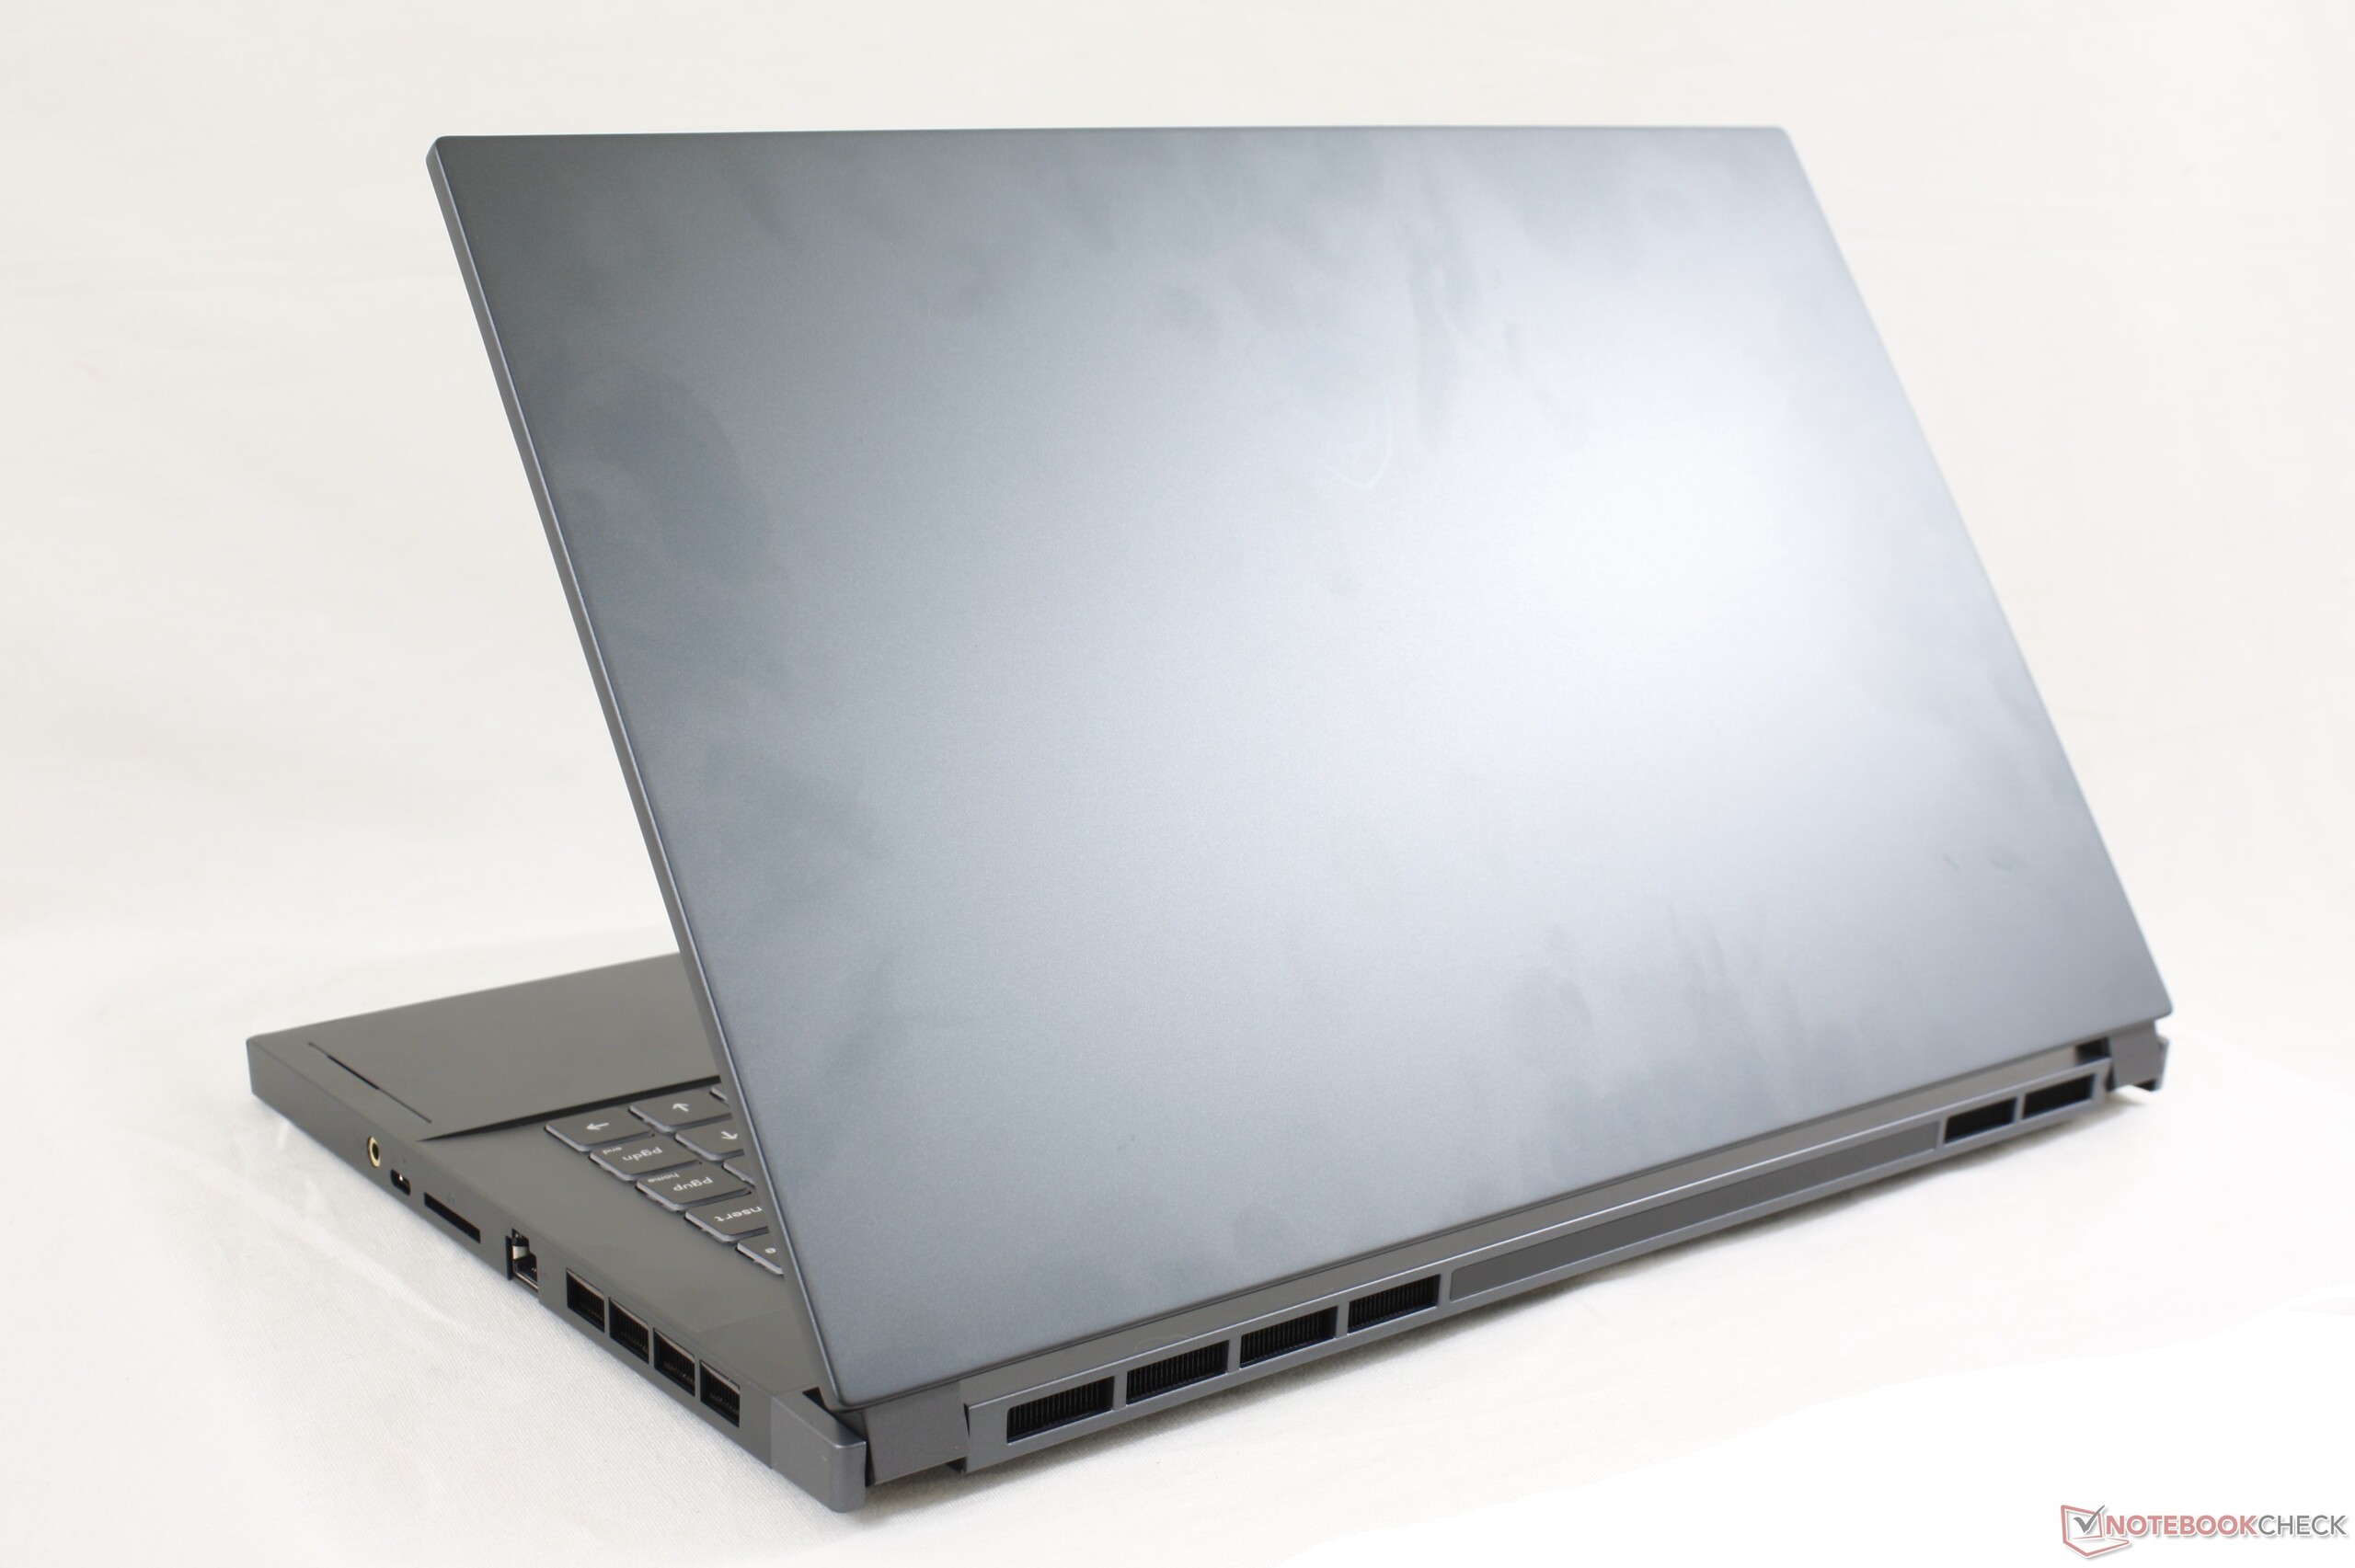
Case
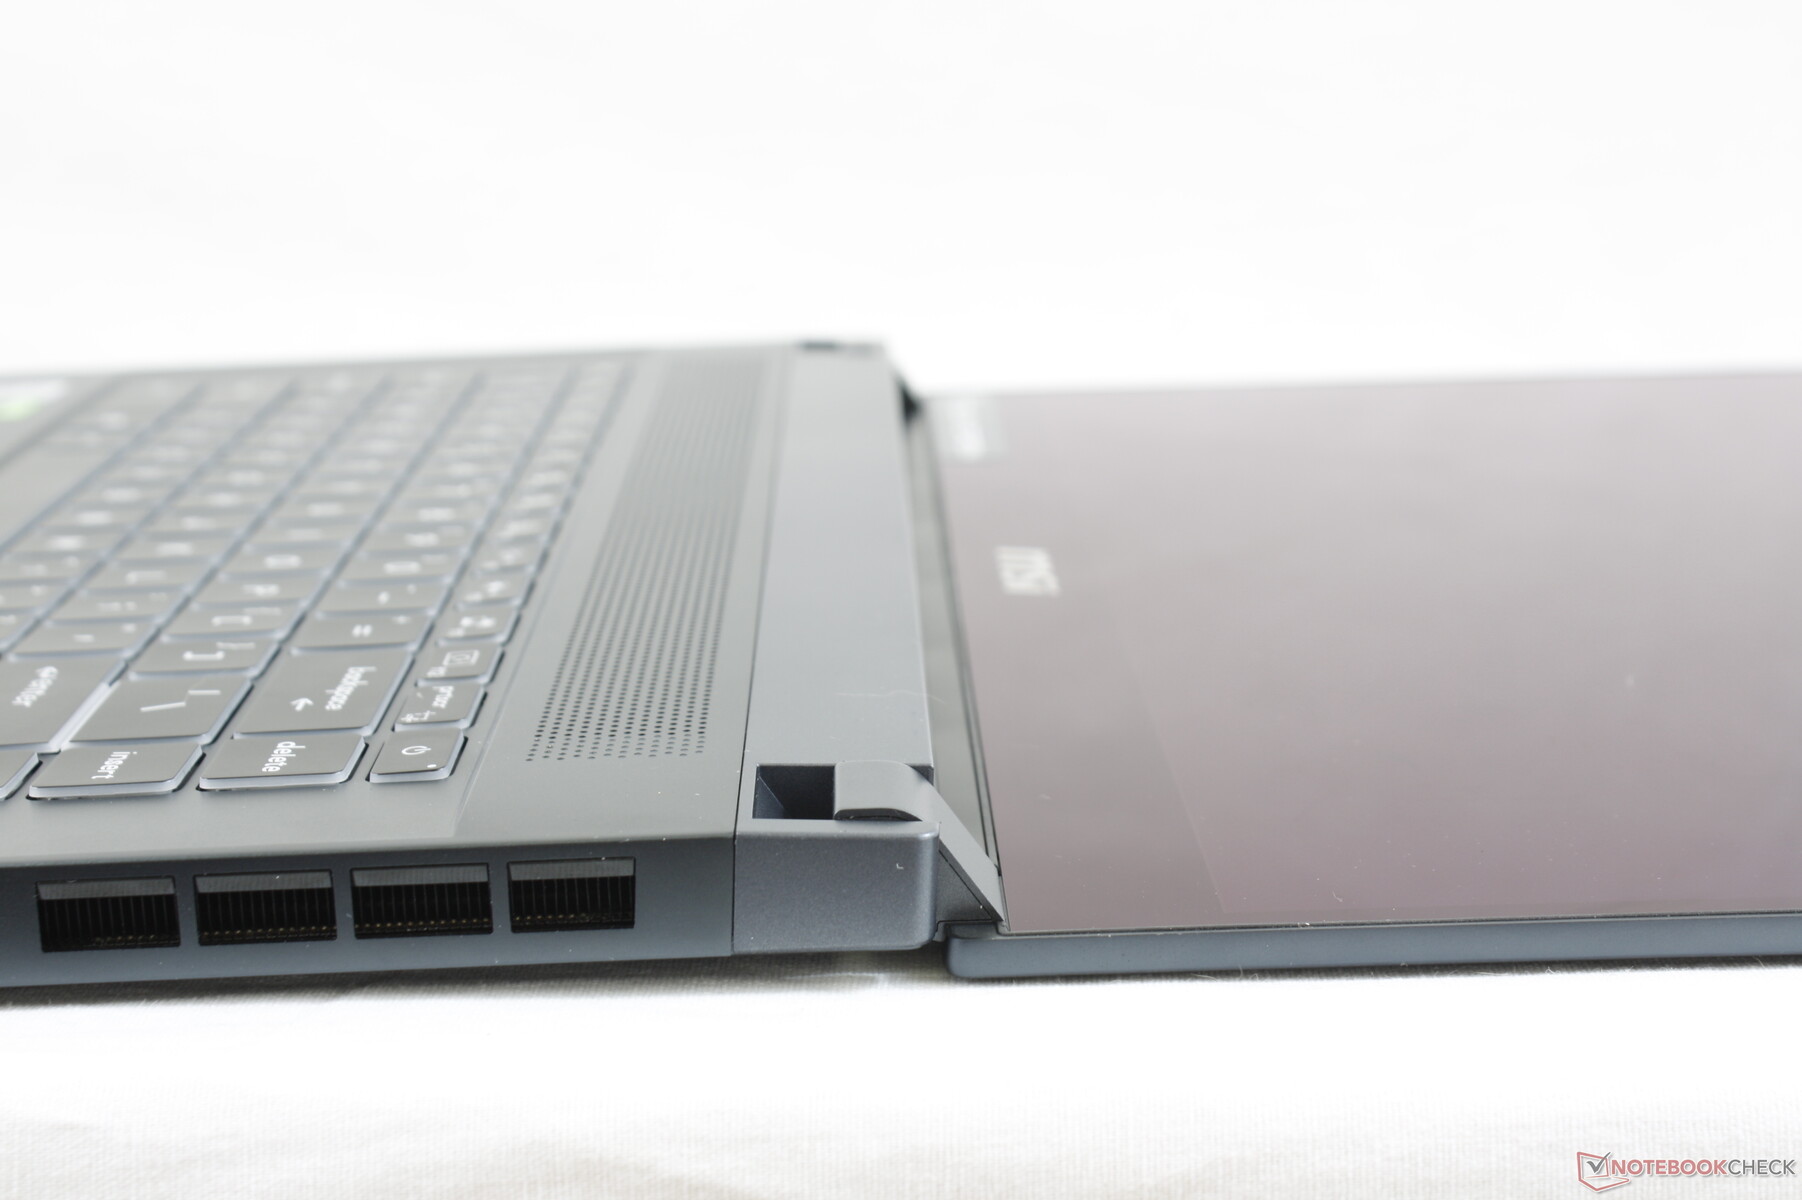
Il nuovo telaio sembra più robusto dell'ultima generazione WS63, ma è comunque un passo indietro rispetto al Razer Blade 15 Studio. Scricchiolii e piegamenti sono più evidenti sul sistema MSI rispetto al Razer.
Proprio come il salto dalla GS63 alla GS66, la WS66 è sia più spessa che più pesante della vecchia WS63 grazie ai miglioramenti della rigidità del telaio e ùdelle termiche da gen a gen. Nonostante ciò, continua ad essere una delle workstation più sottili che si possono trovare che può essere configurata sia con una CPU Core i9 che con una GPU Quadro RTX 5000 Max-Q.
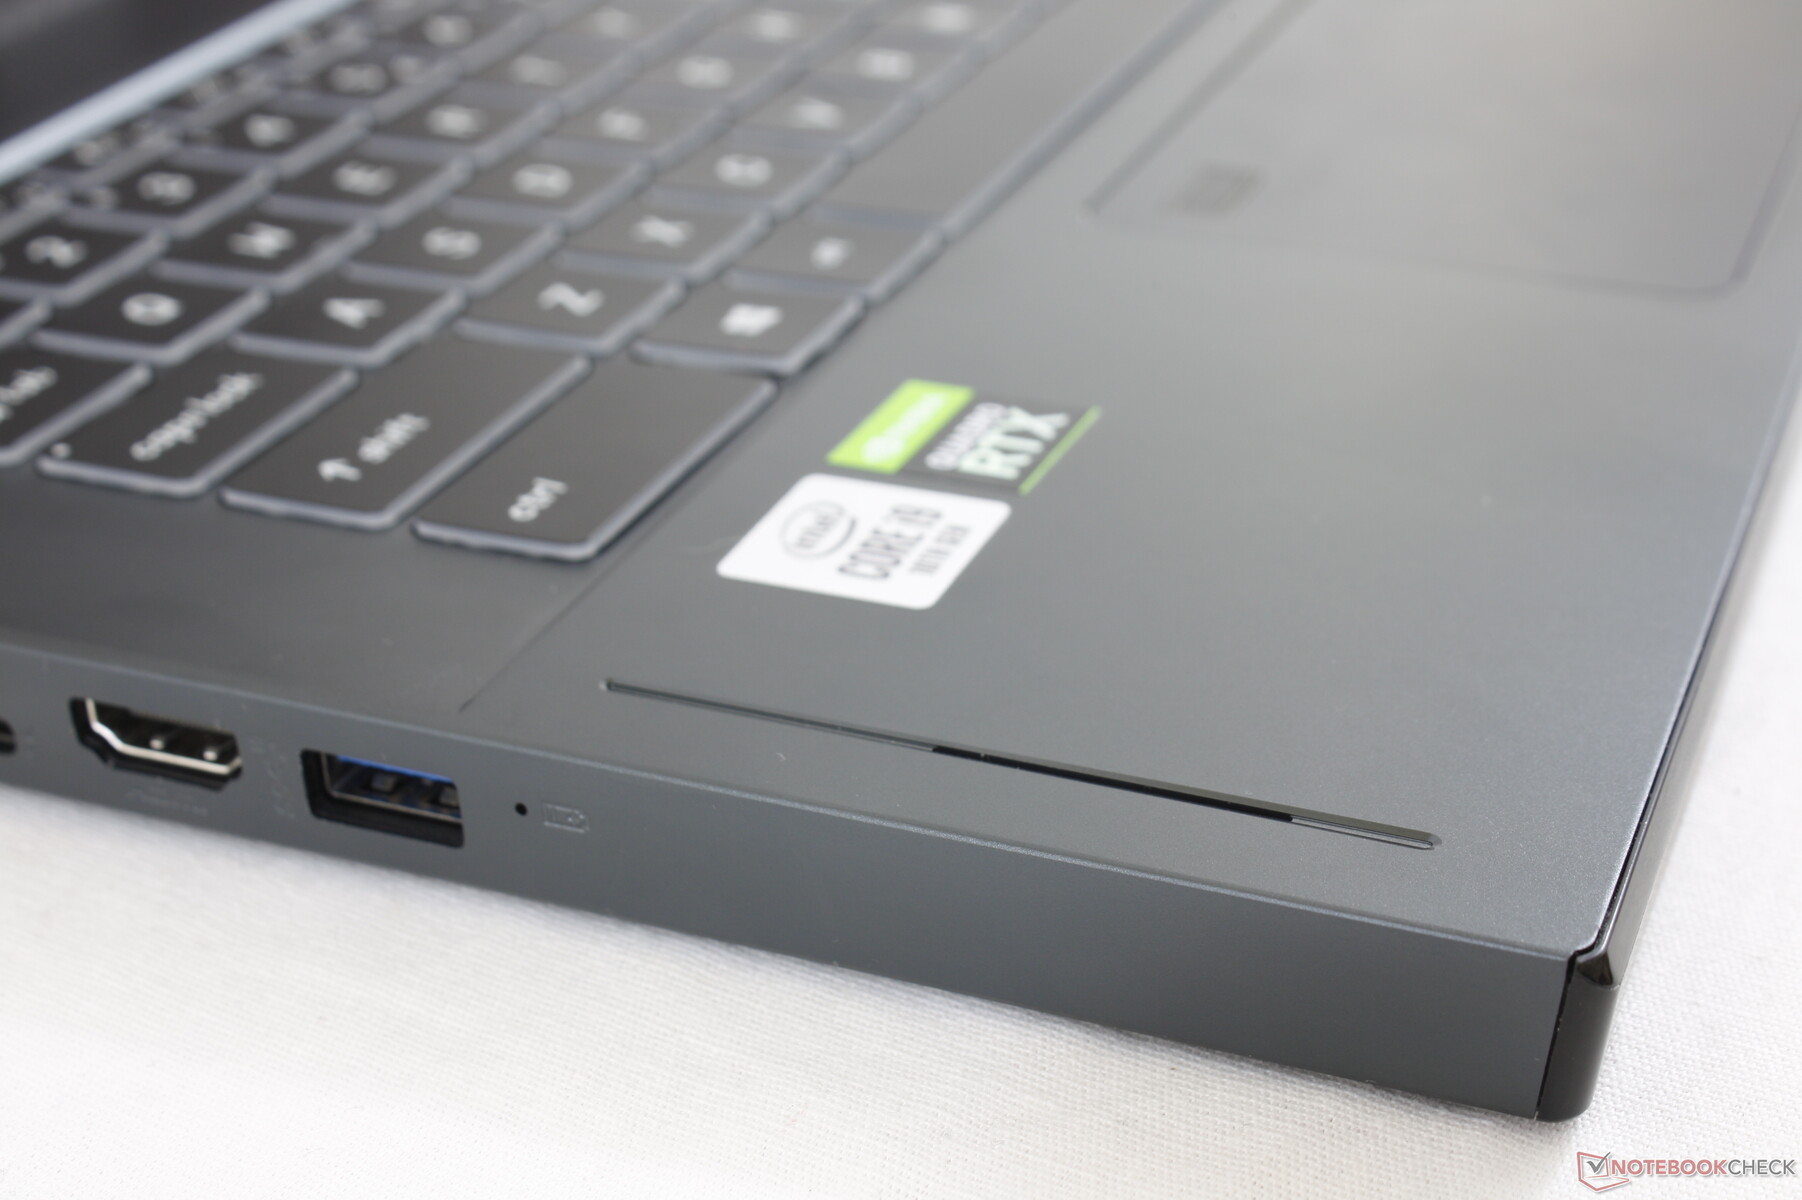
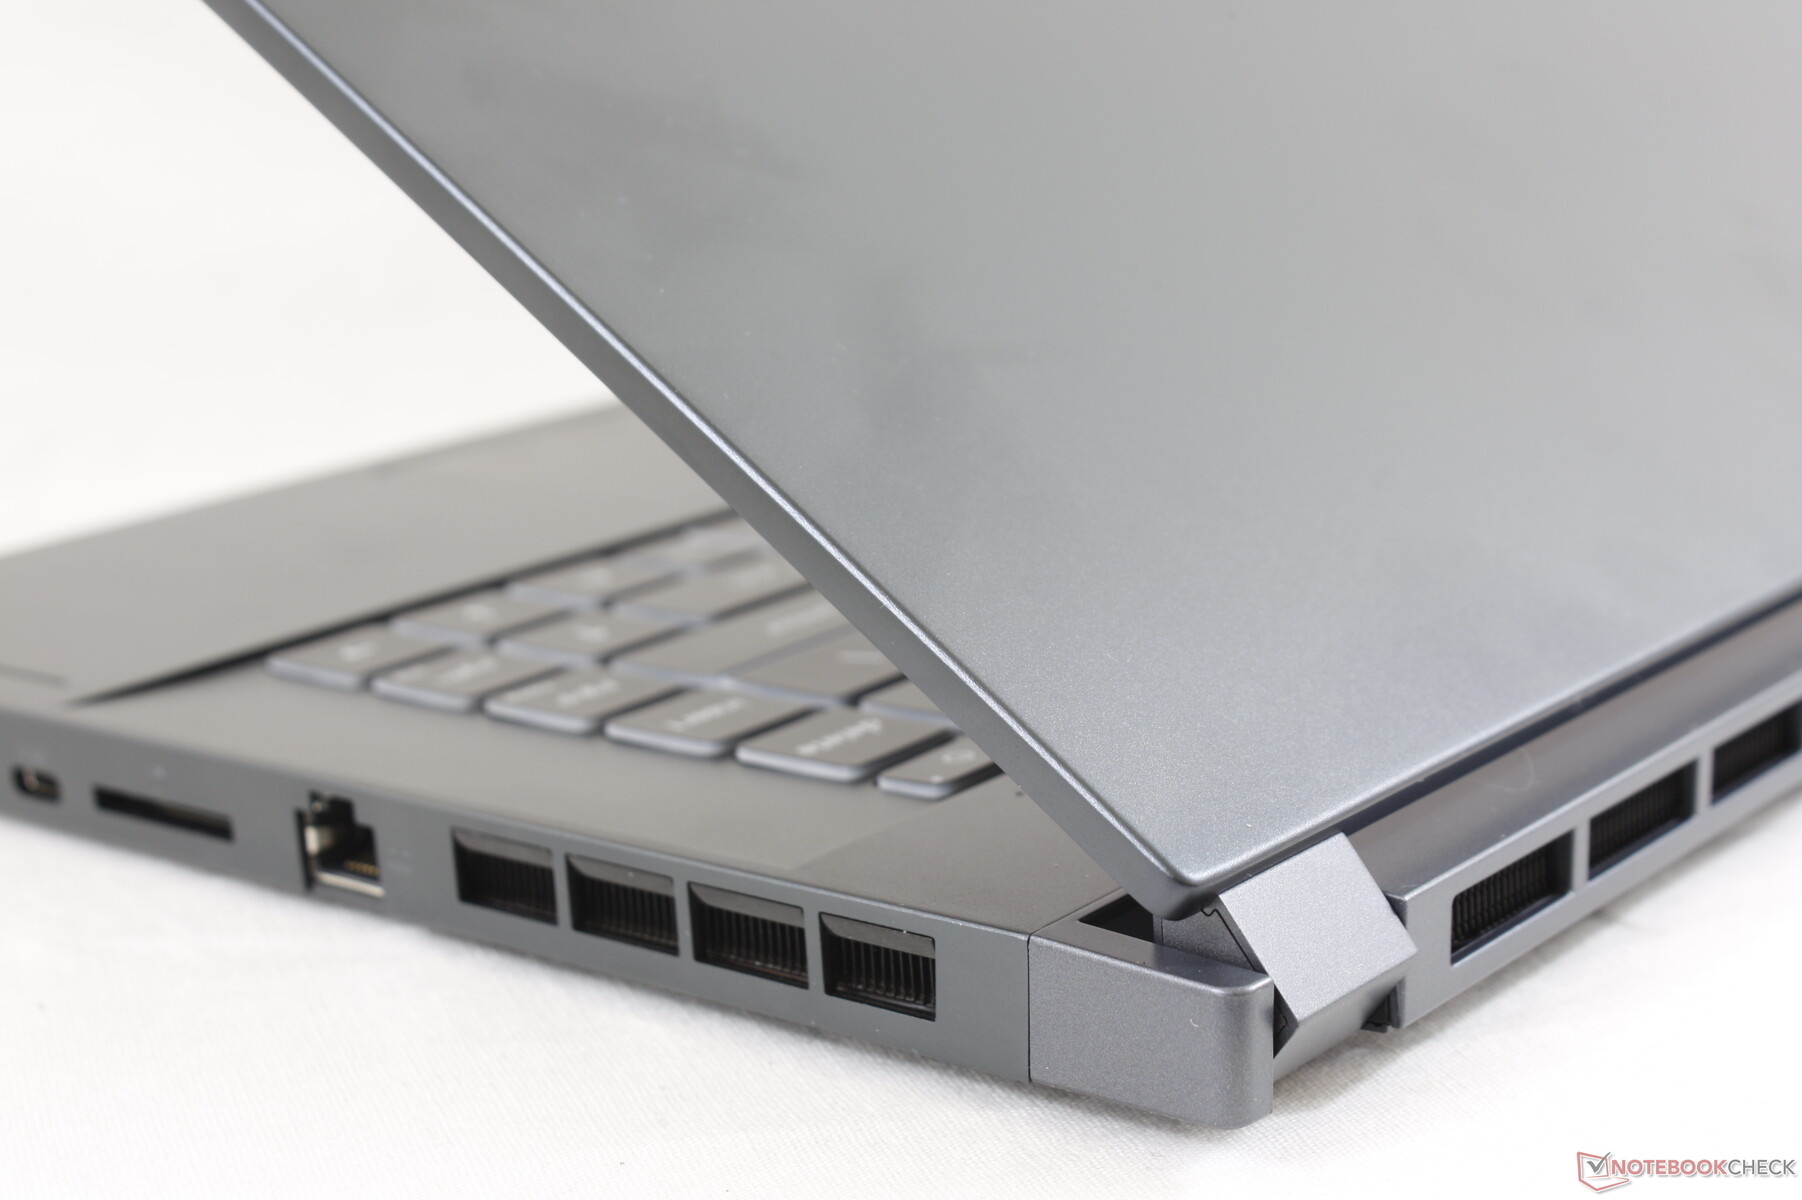
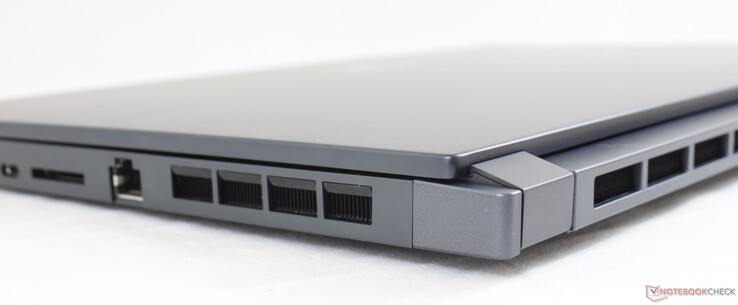
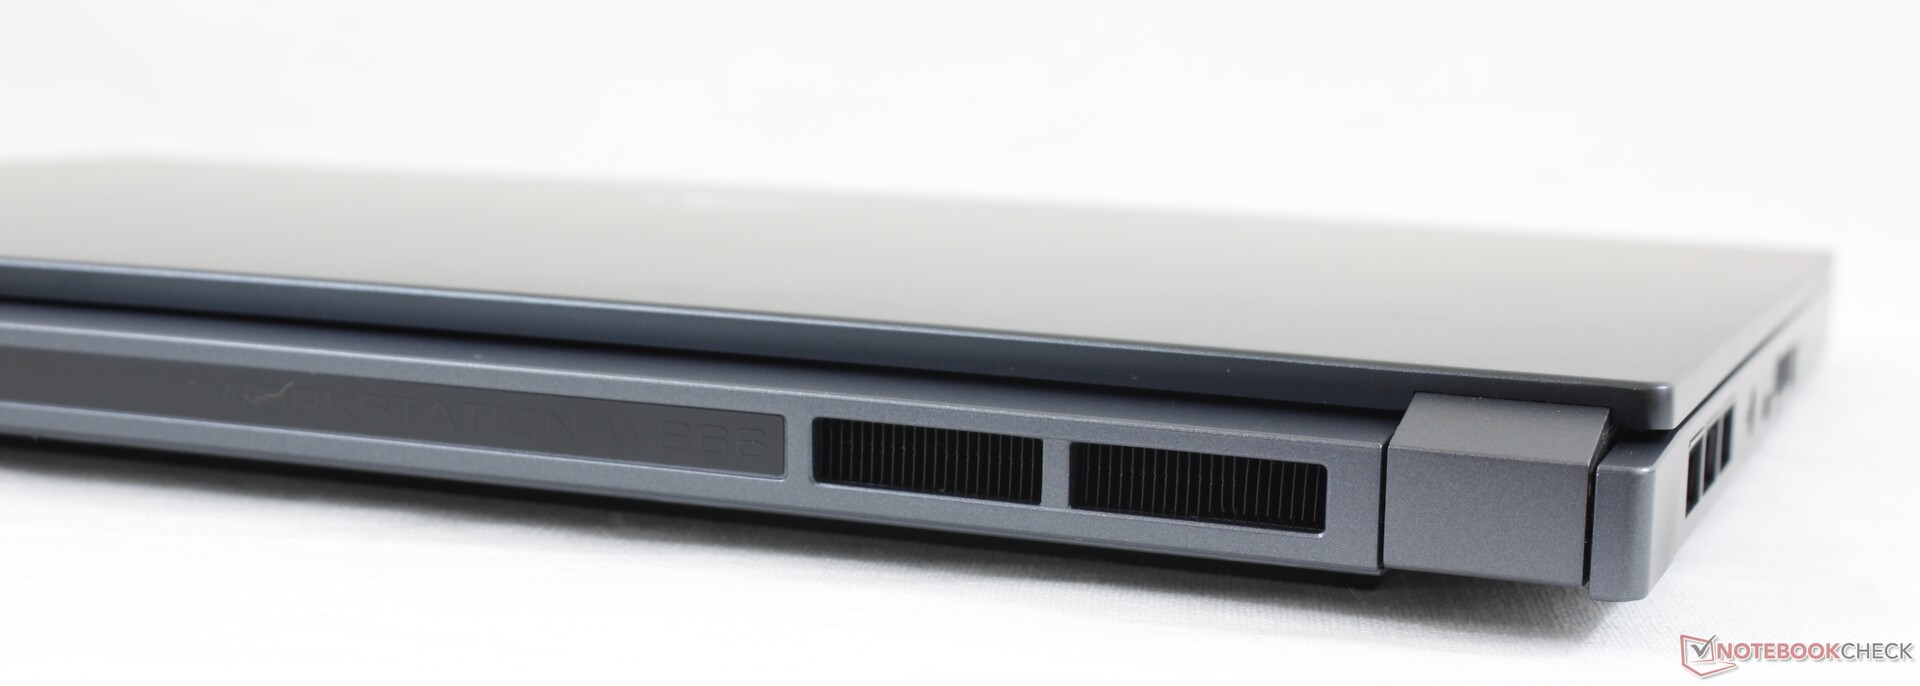
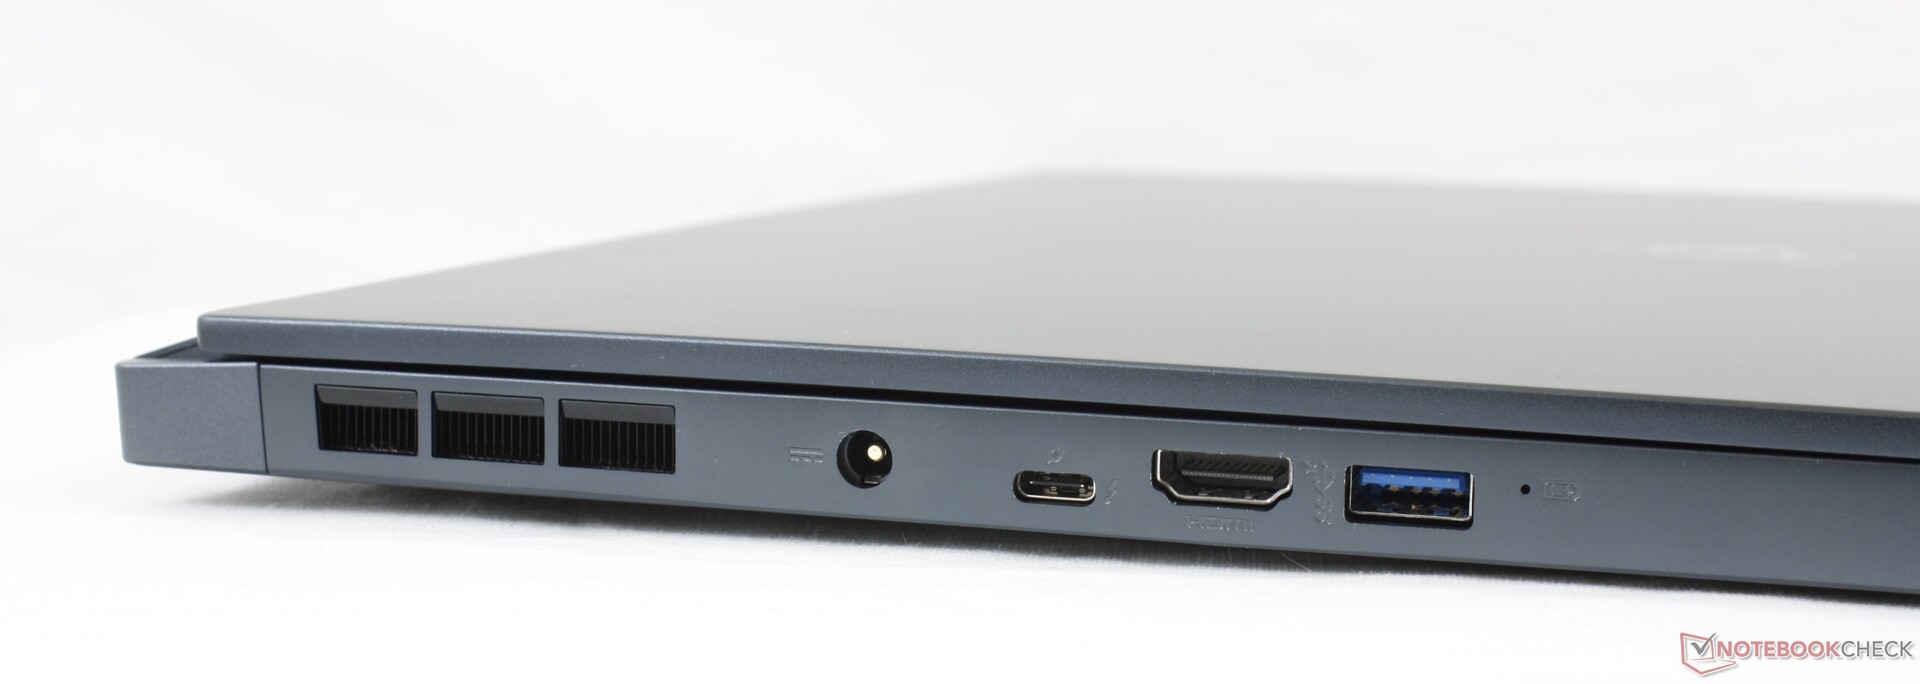
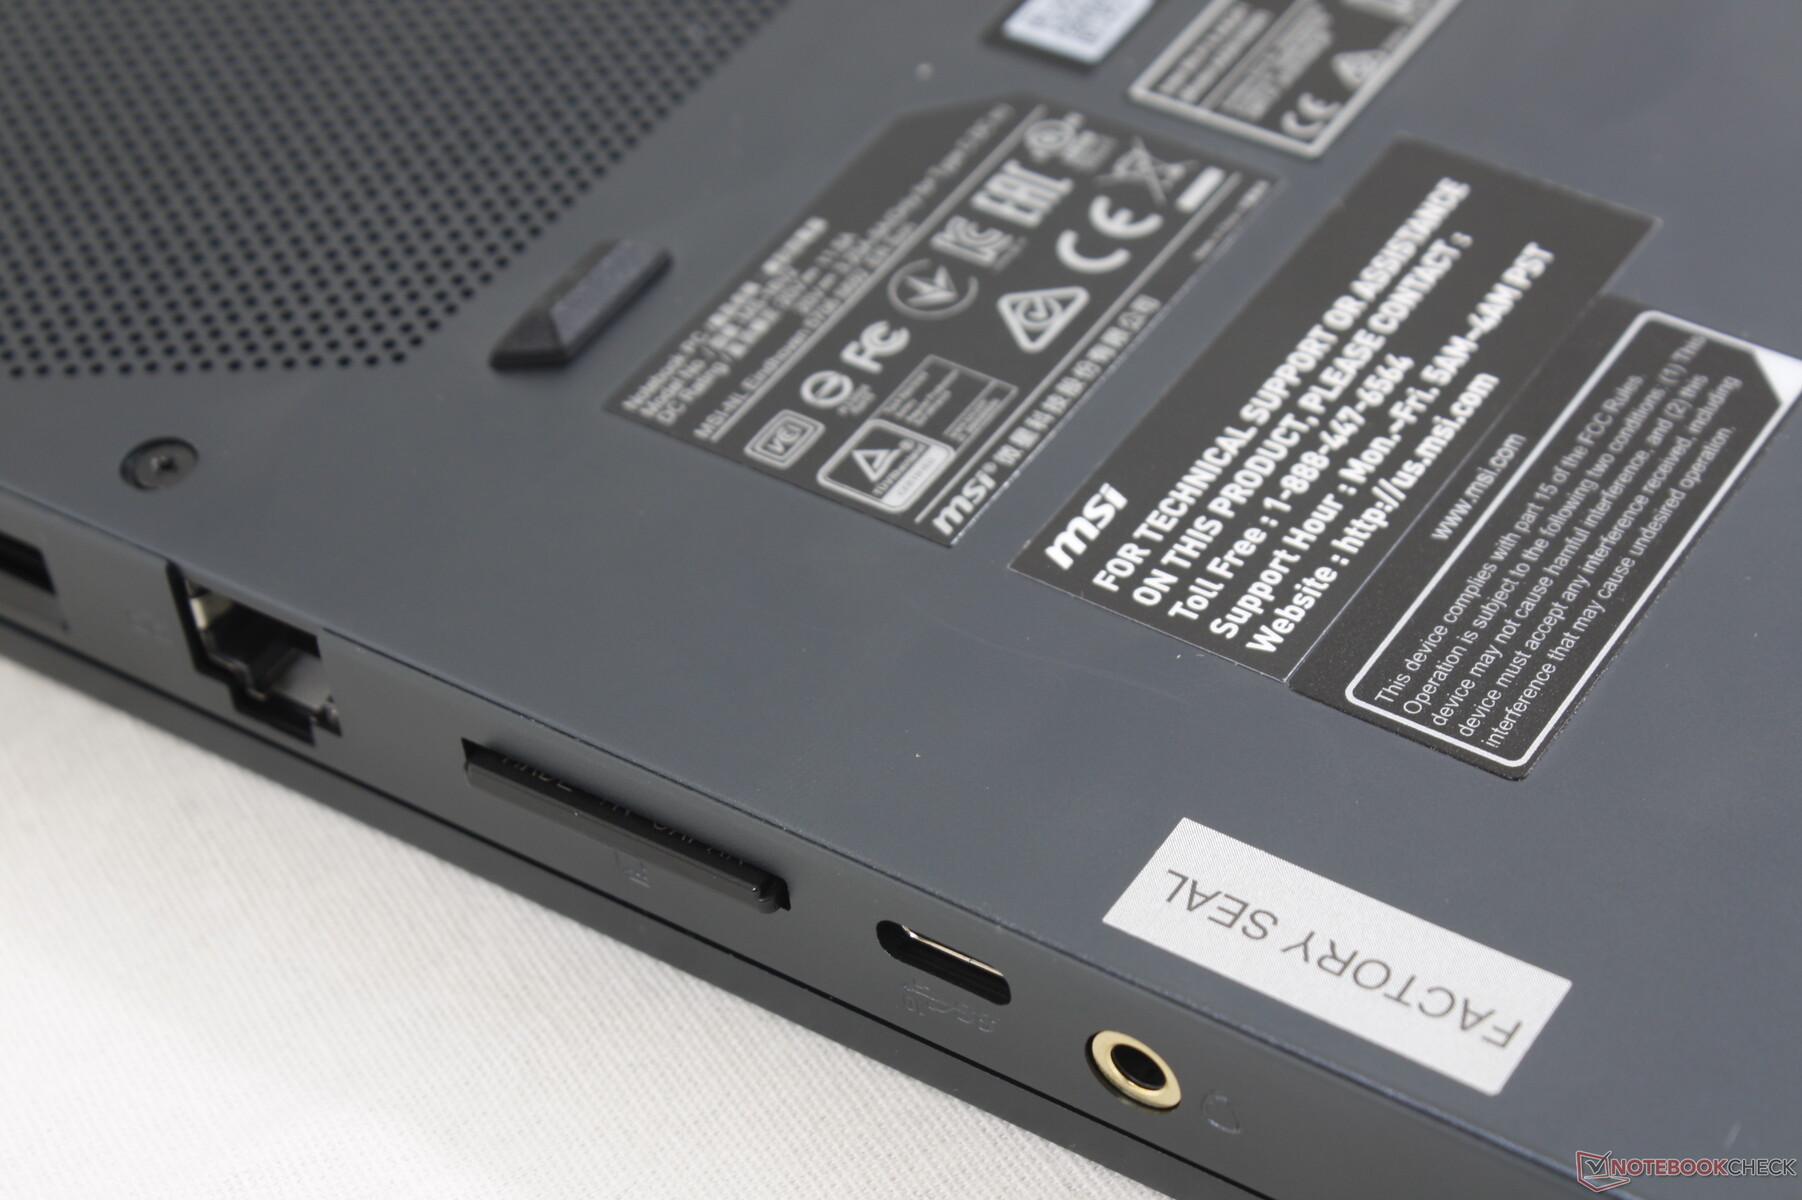
Connessioni
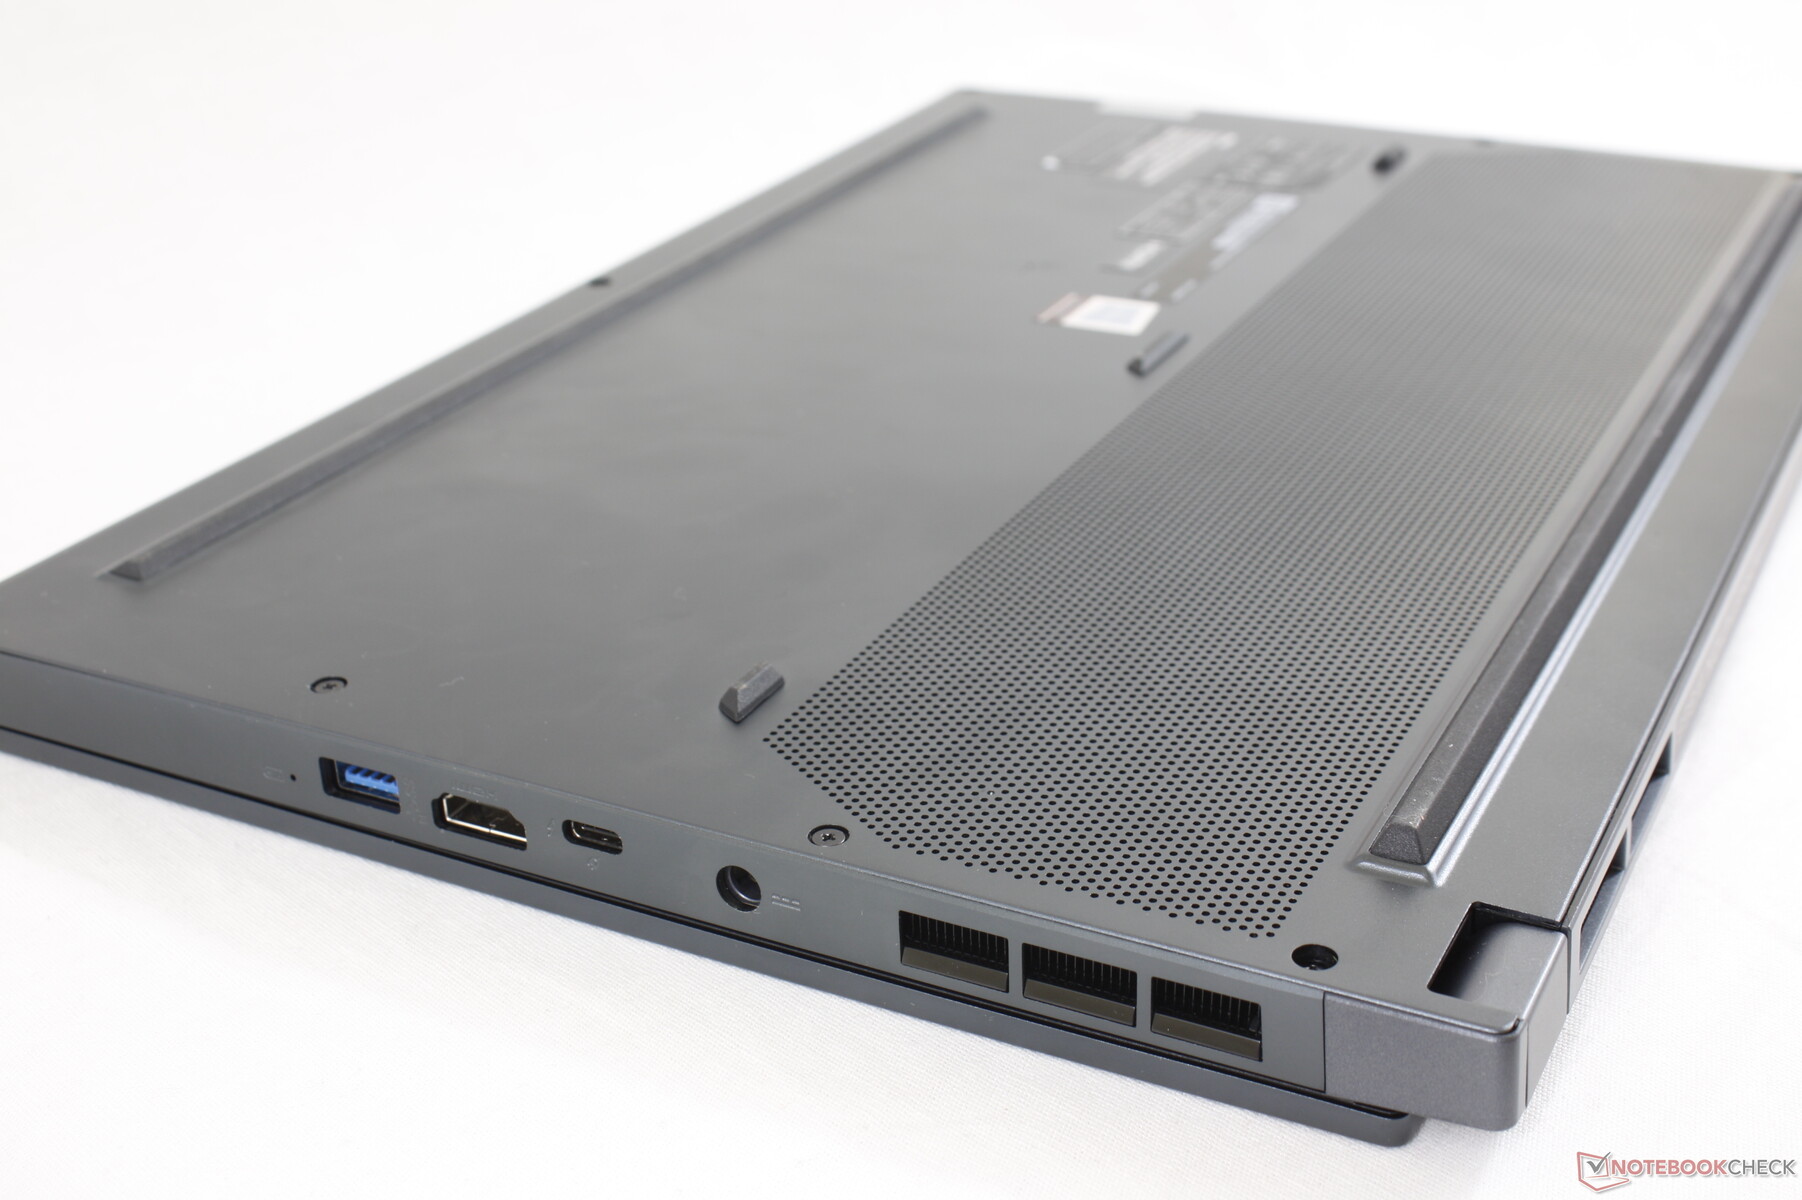
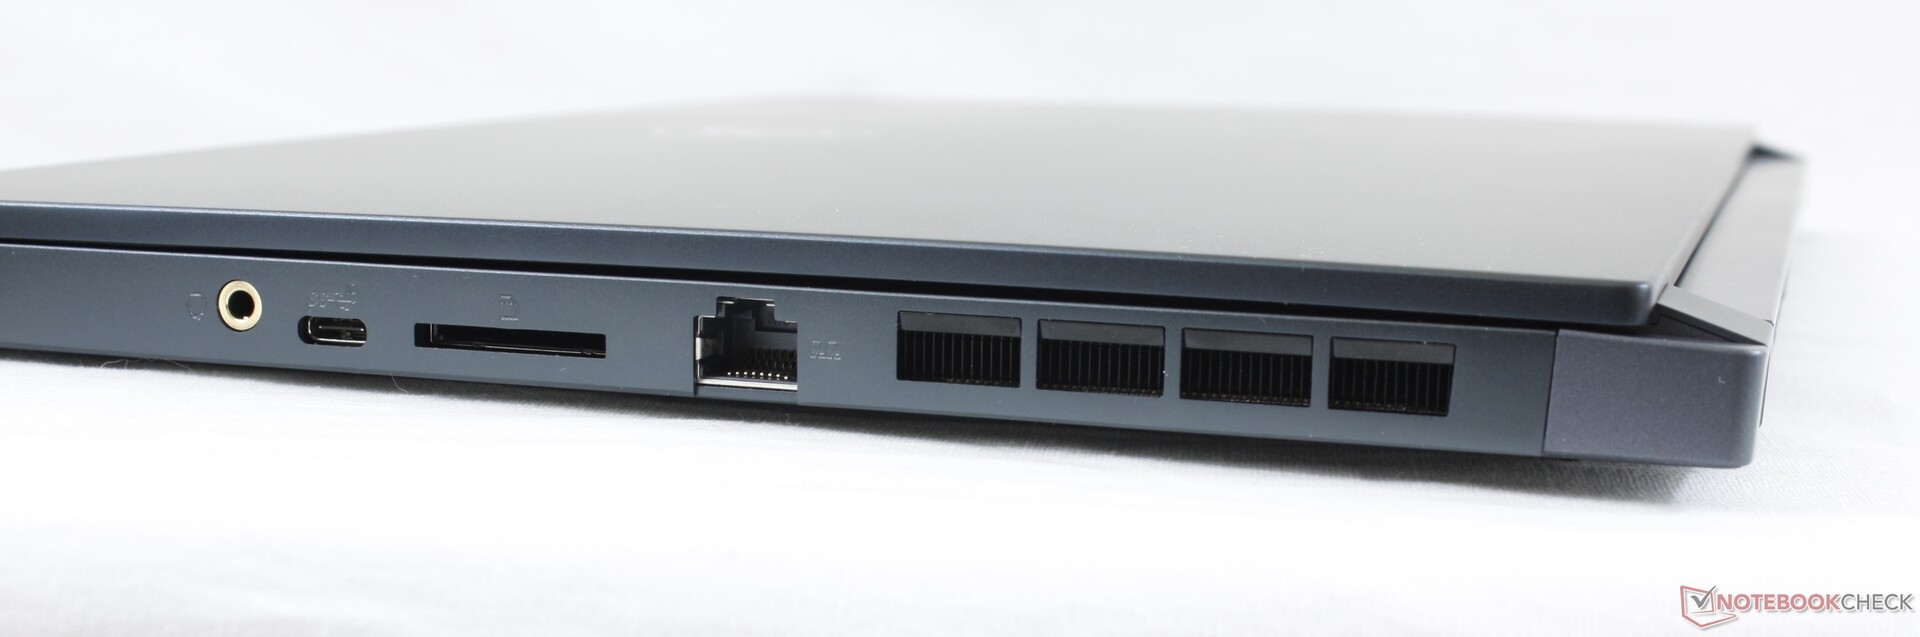
Un modo semplice per distinguere la WS66 dalla GS66 è guardare le loro porte USB-A. la WS66 ha una sola porta USB-A mentre la GS66 ne ha tre. In cambio, la WS66 ha un lettore di schede SD full-size.
Lettore schede SD
Le velocità di trasferimento dal lettore SD integrato sono estremamente elevate. Il trasferimento di 1 GB di immagini dalla nostra scheda di test UHS-II al desktop richiede meno di 5 secondi rispetto ai quasi 40 secondi dell'MSI WE75.
| SD Card Reader | |
| average JPG Copy Test (av. of 3 runs) | |
| MSI WS66 10TMT-207US (Toshiba Exceria Pro SDXC 64 GB UHS-II) | |
| Razer Blade 15 RTX 2070 Super Max-Q (Toshiba Exceria Pro SDXC 64 GB UHS-II) | |
| Dell Precision 5550 P91F (Toshiba Exceria Pro SDXC 64 GB UHS-II) | |
| Dell Precision 7550 (Toshiba Exceria Pro SDXC 64 GB UHS-II) | |
| MSI WS63VR 7RL-023US | |
| MSI WE75 9TK (Toshiba Exceria Pro SDXC 64 GB UHS-II) | |
| maximum AS SSD Seq Read Test (1GB) | |
| MSI WS63VR 7RL-023US | |
| MSI WS66 10TMT-207US (Toshiba Exceria Pro SDXC 64 GB UHS-II) | |
| Razer Blade 15 RTX 2070 Super Max-Q (Toshiba Exceria Pro SDXC 64 GB UHS-II) | |
| Dell Precision 5550 P91F (Toshiba Exceria Pro SDXC 64 GB UHS-II) | |
| Dell Precision 7550 (Toshiba Exceria Pro SDXC 64 GB UHS-II) | |
| MSI WE75 9TK (Toshiba Exceria Pro SDXC 64 GB UHS-II) | |
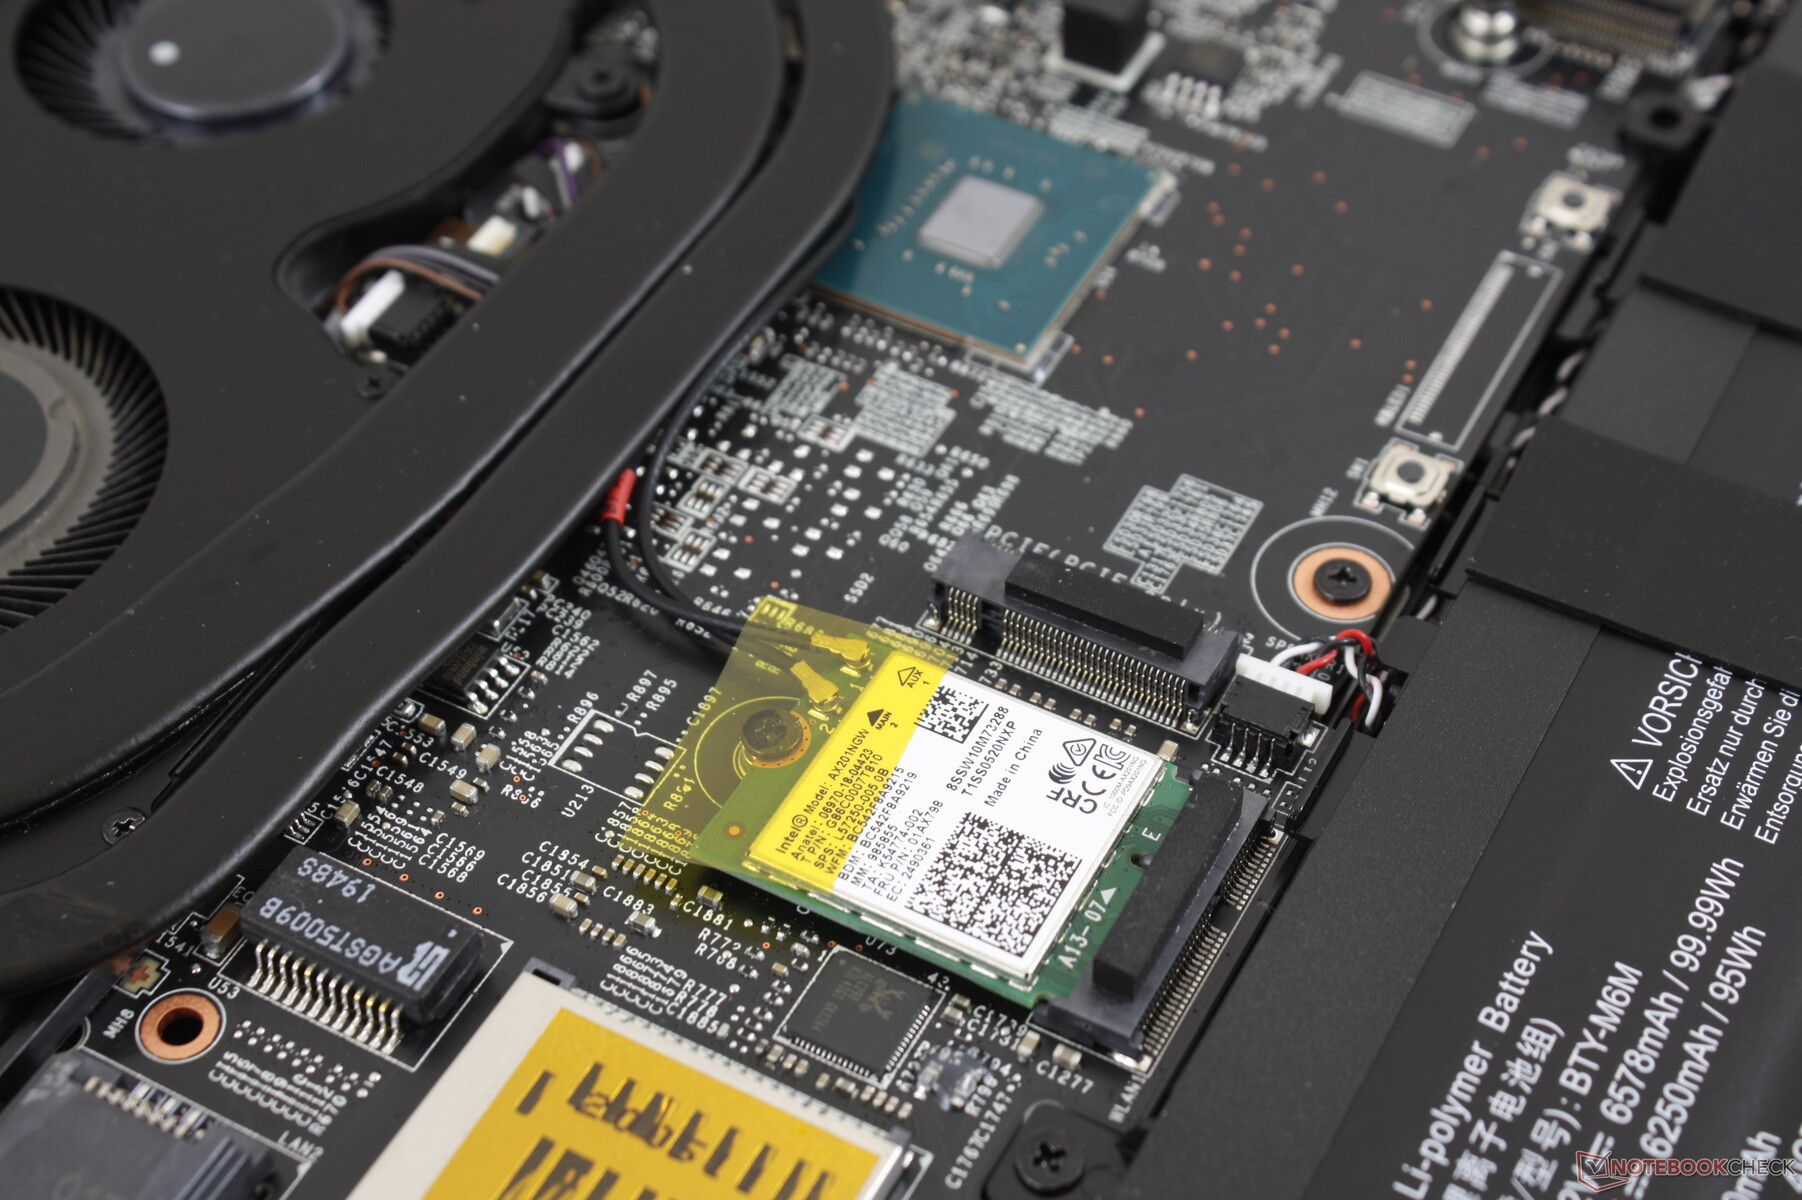
Comunicazioni
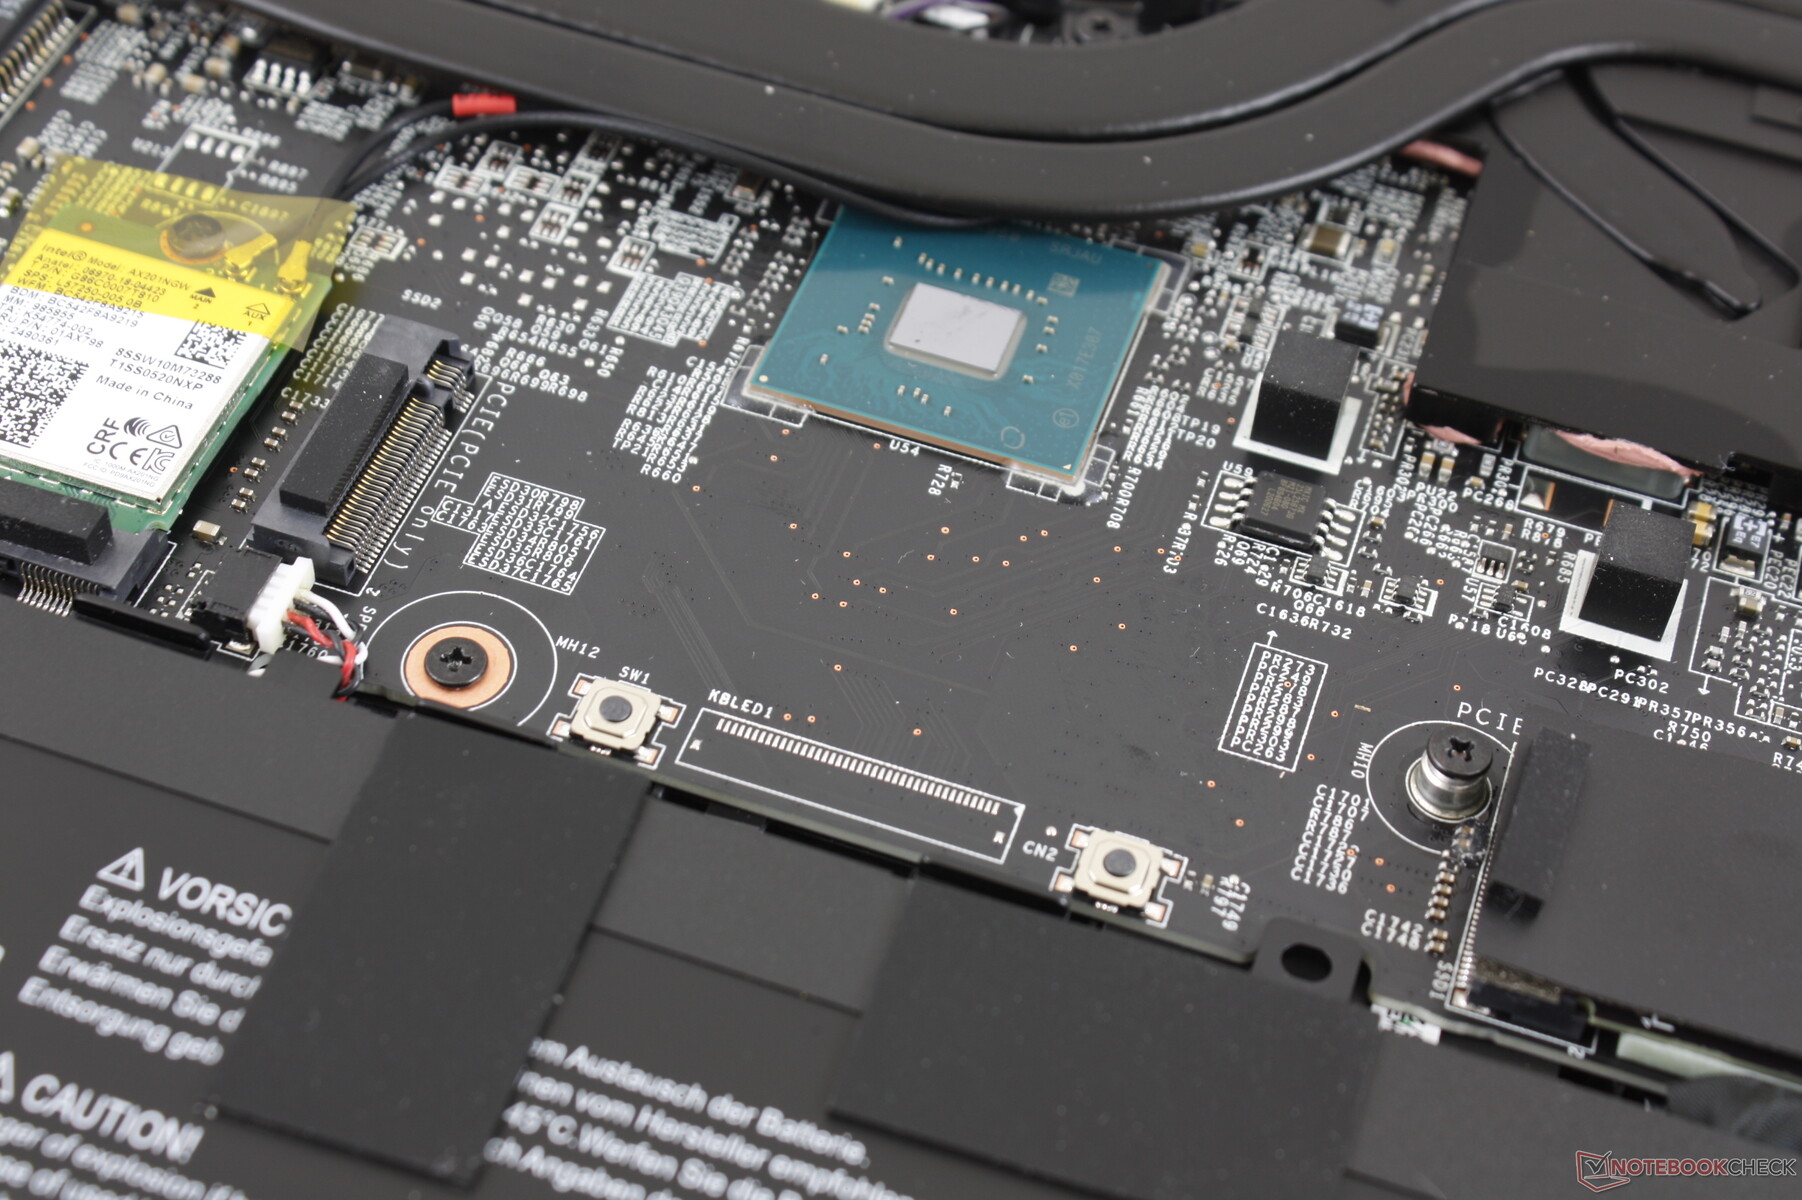
L'Intel AX201 viene fornito di serie per la connettività Wi-Fi 6 e Bluetooth 5.1. È interessante notare che i valori di ricezione raggiungono il massimo a circa 900 Mbps quando sappiamo che sono in grado di raggiungere velocità molto più elevate, ma per il resto non abbiamo riscontrato alcun problema quando siamo connessi al nostro router Netgear RAX200.
Webcam


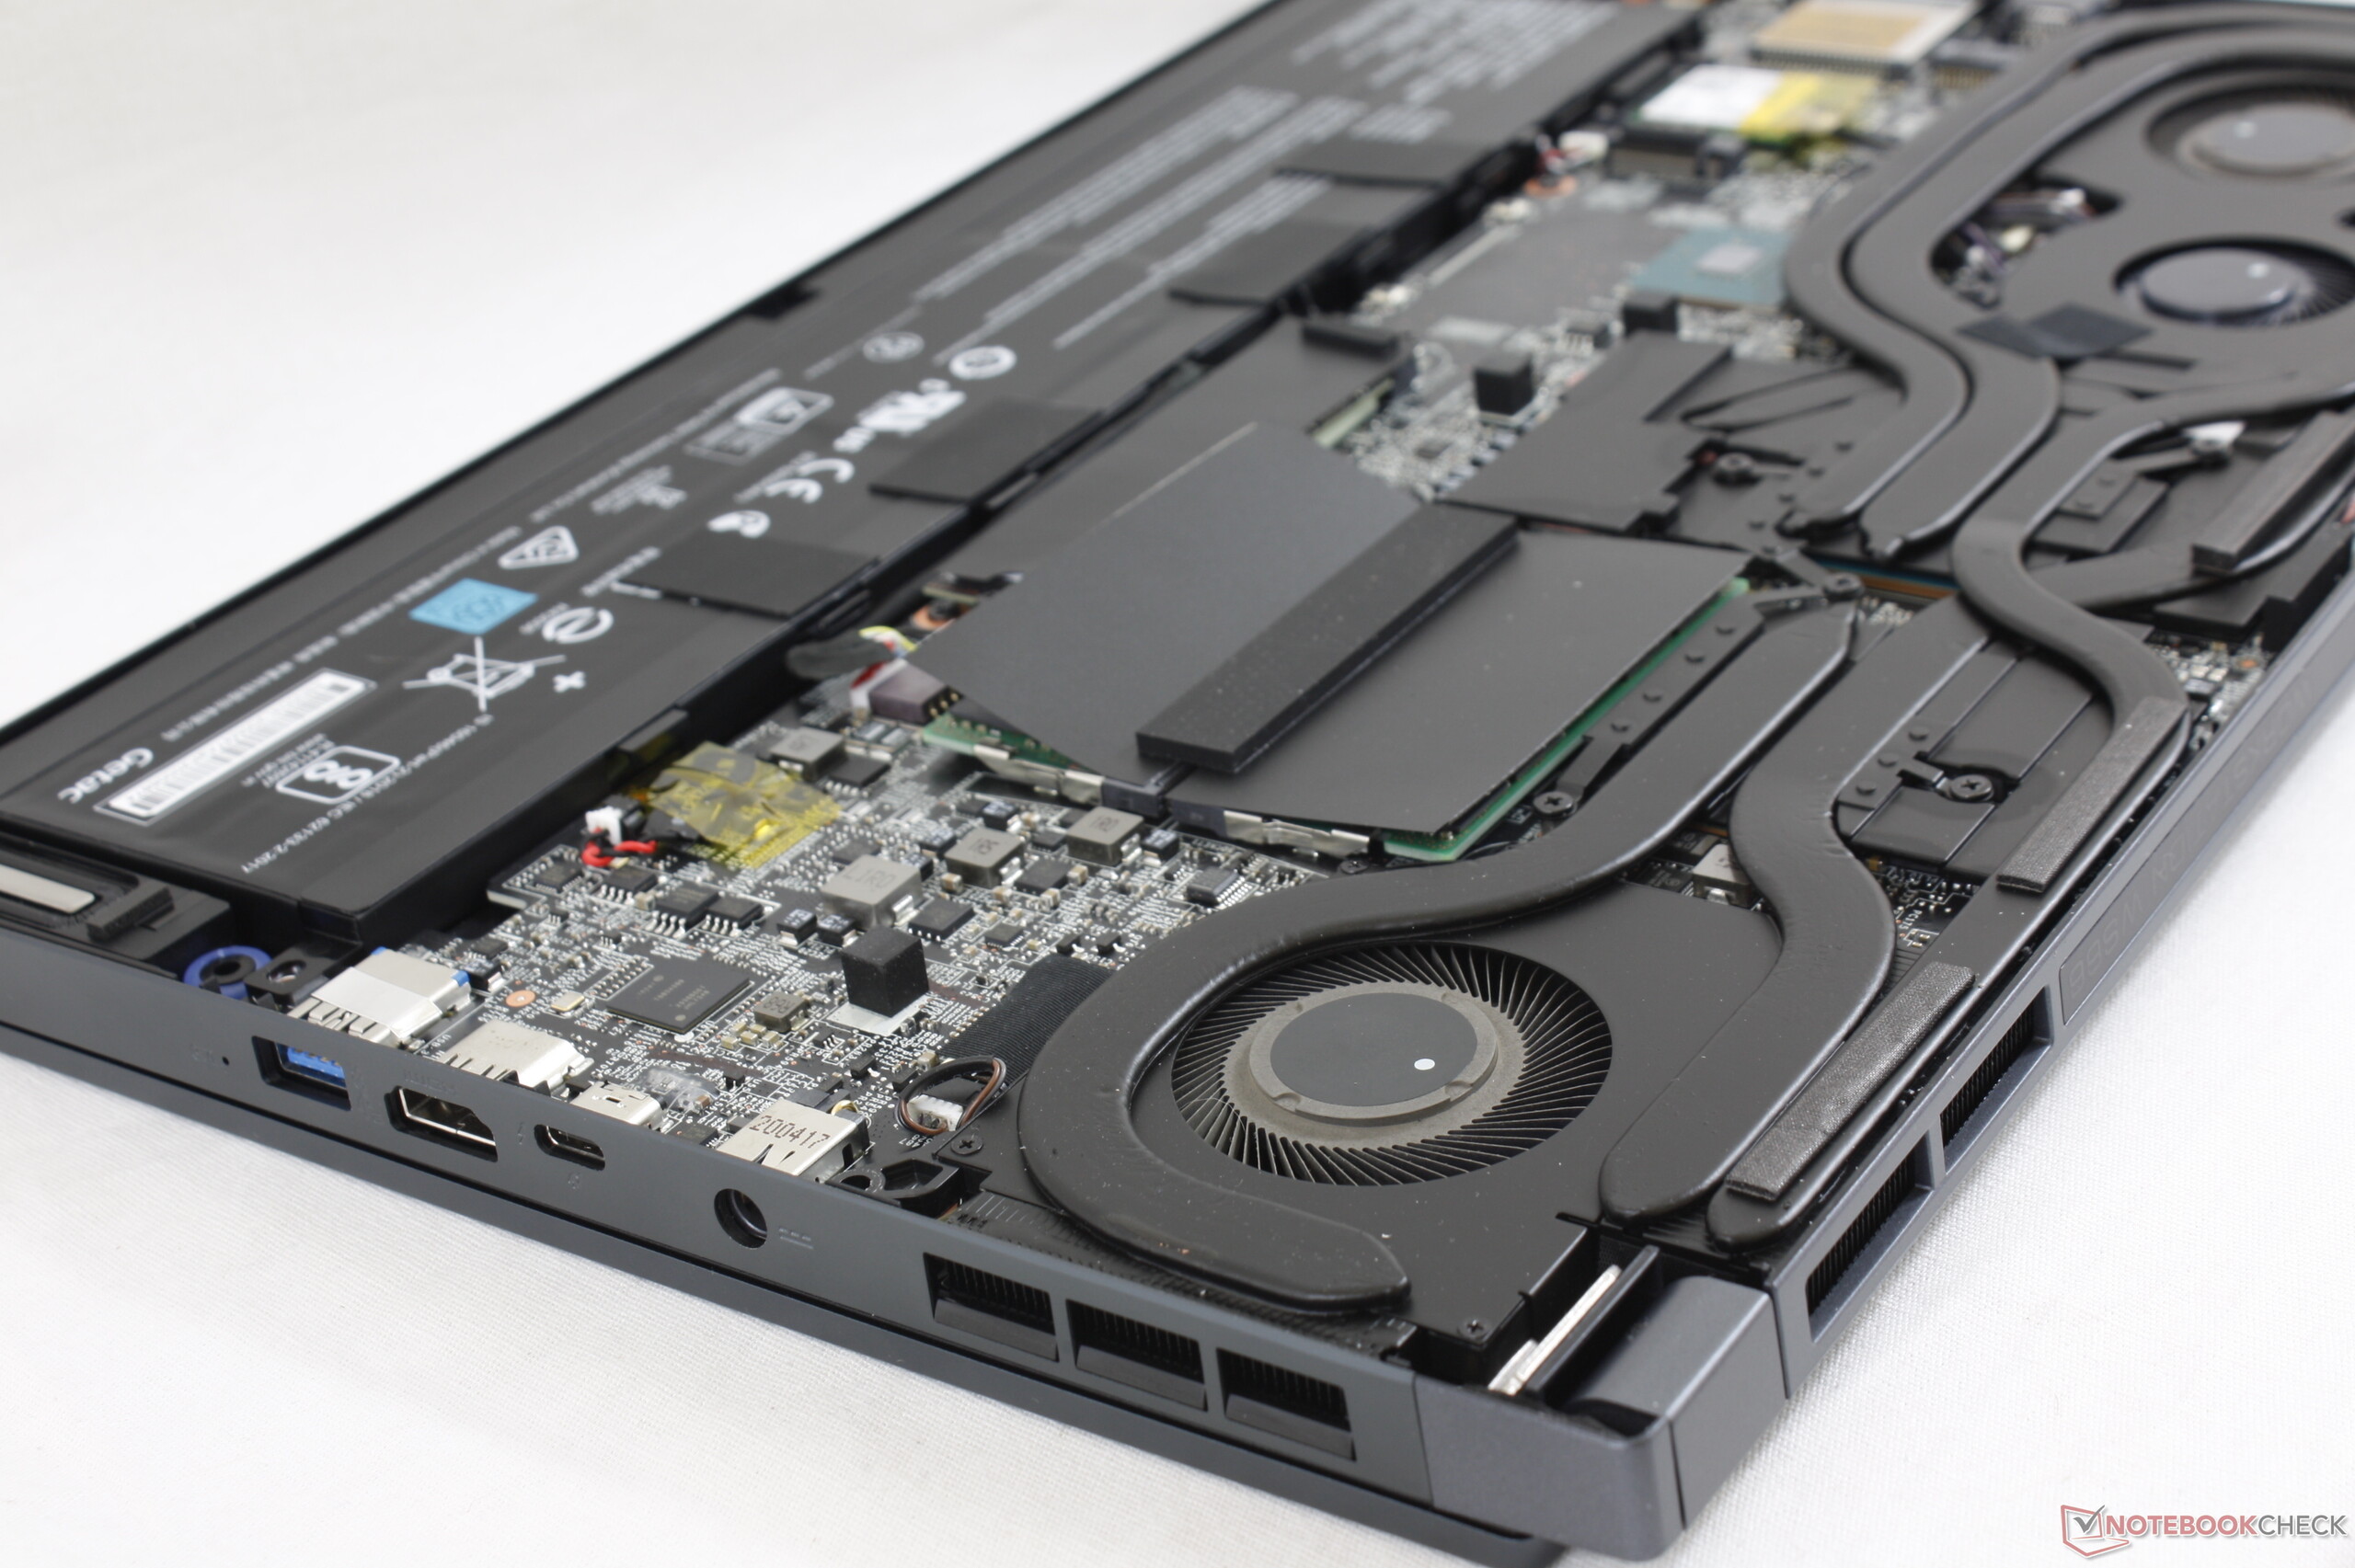
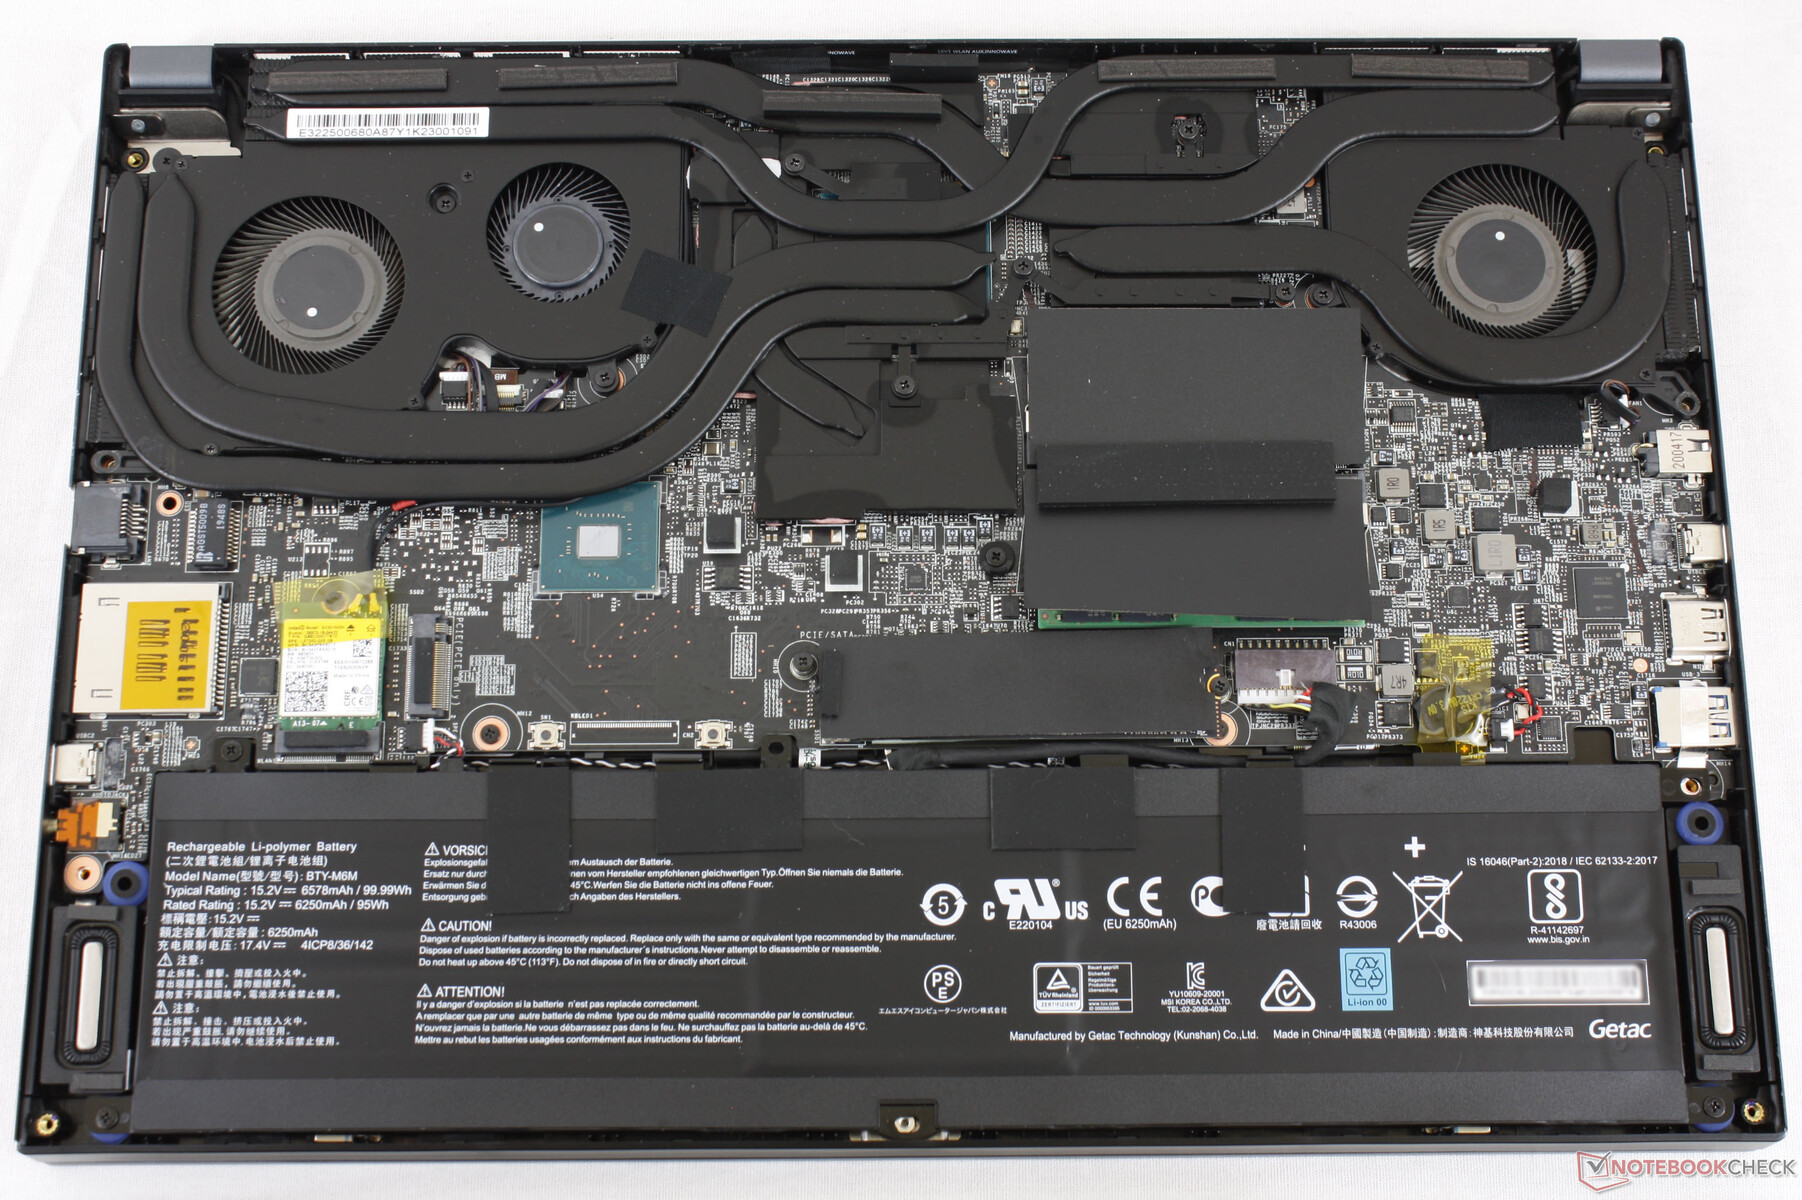
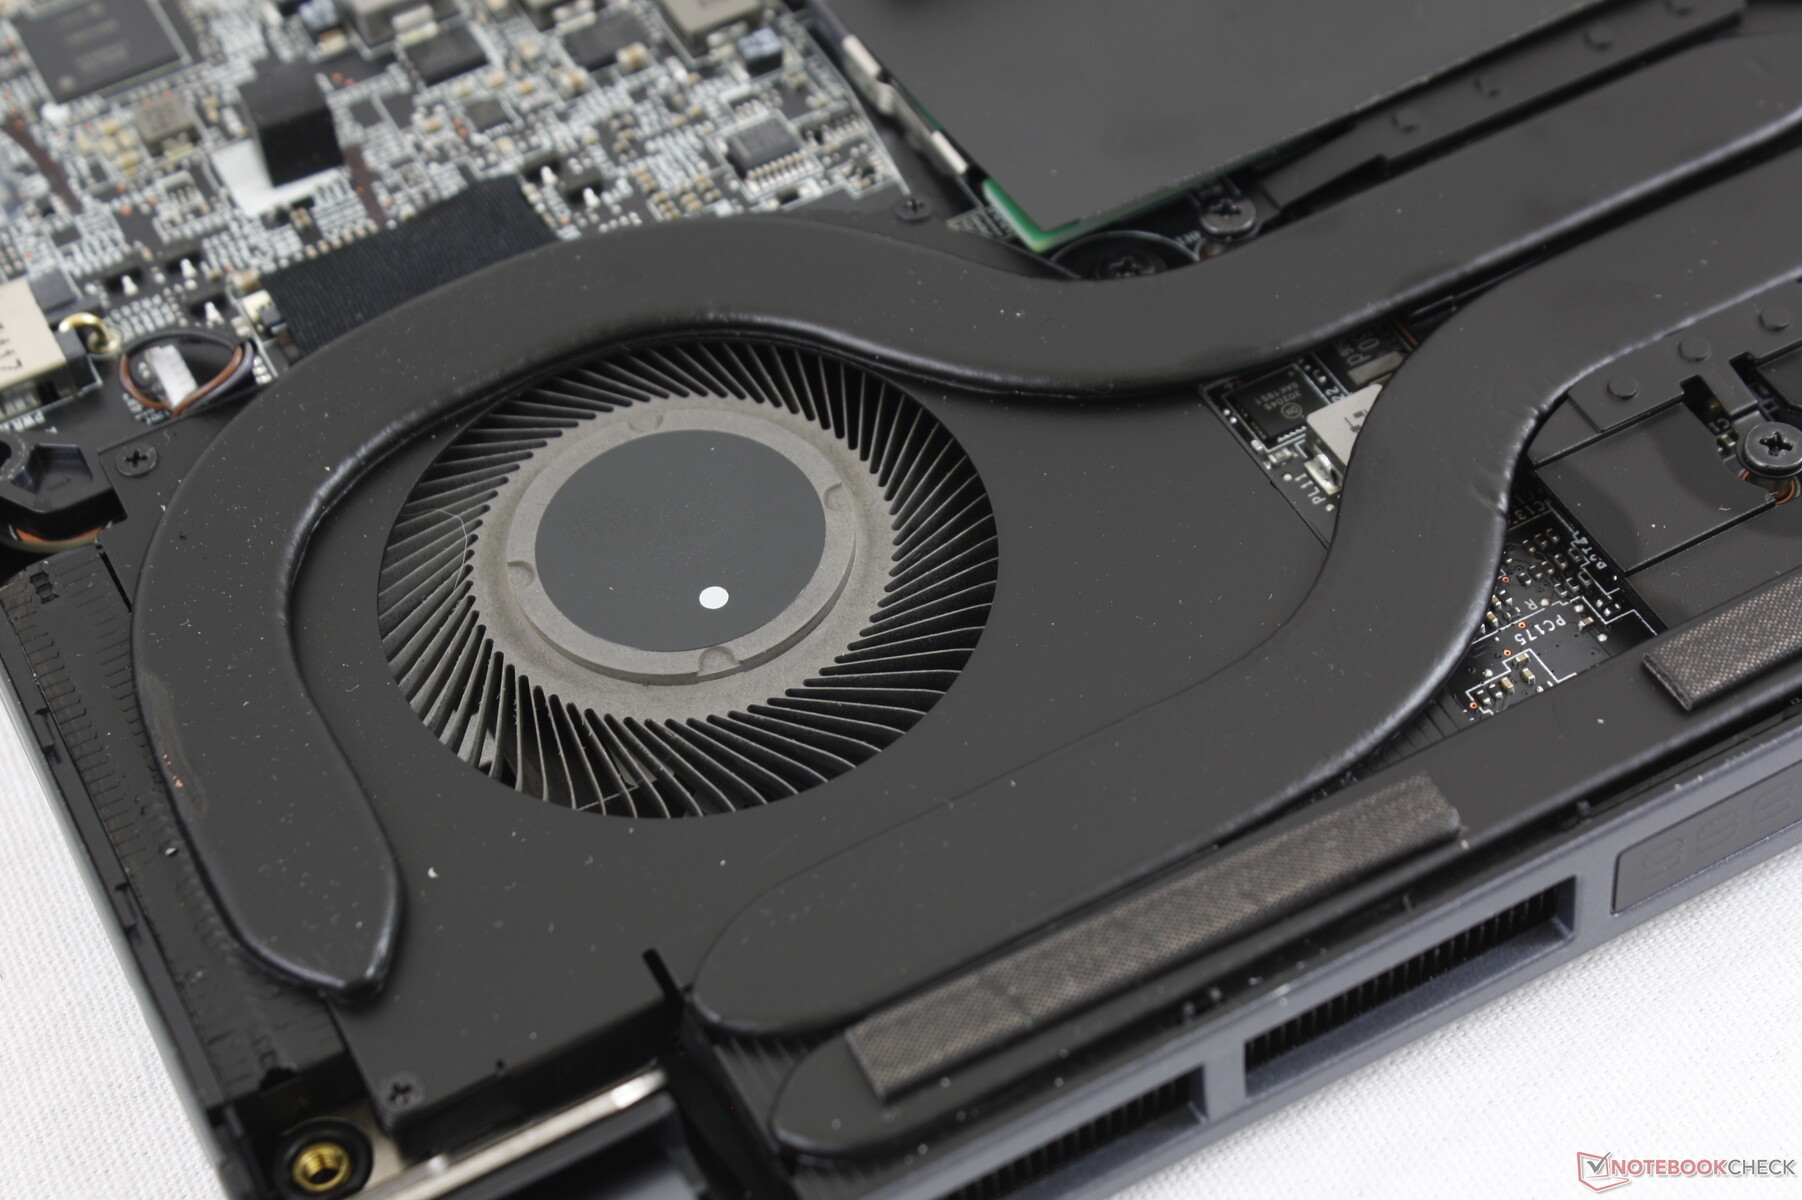
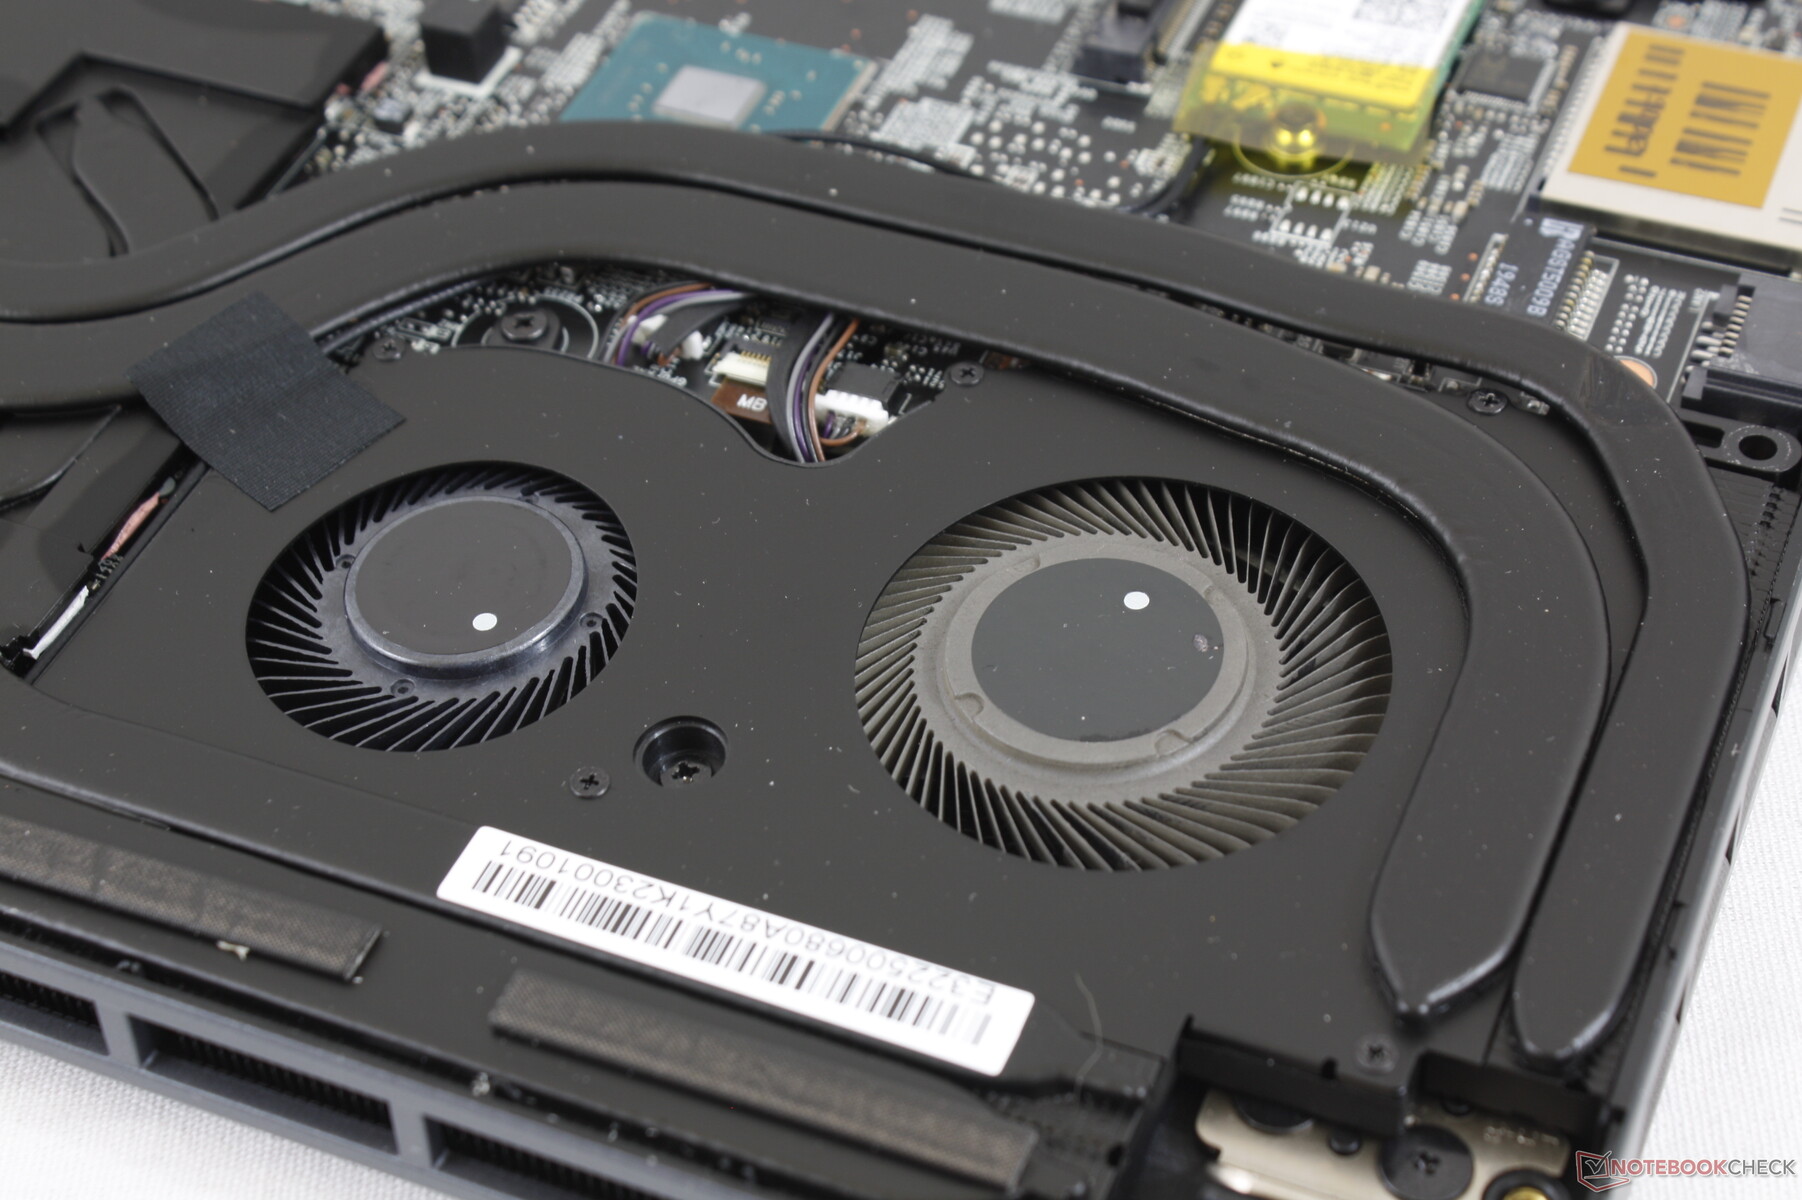
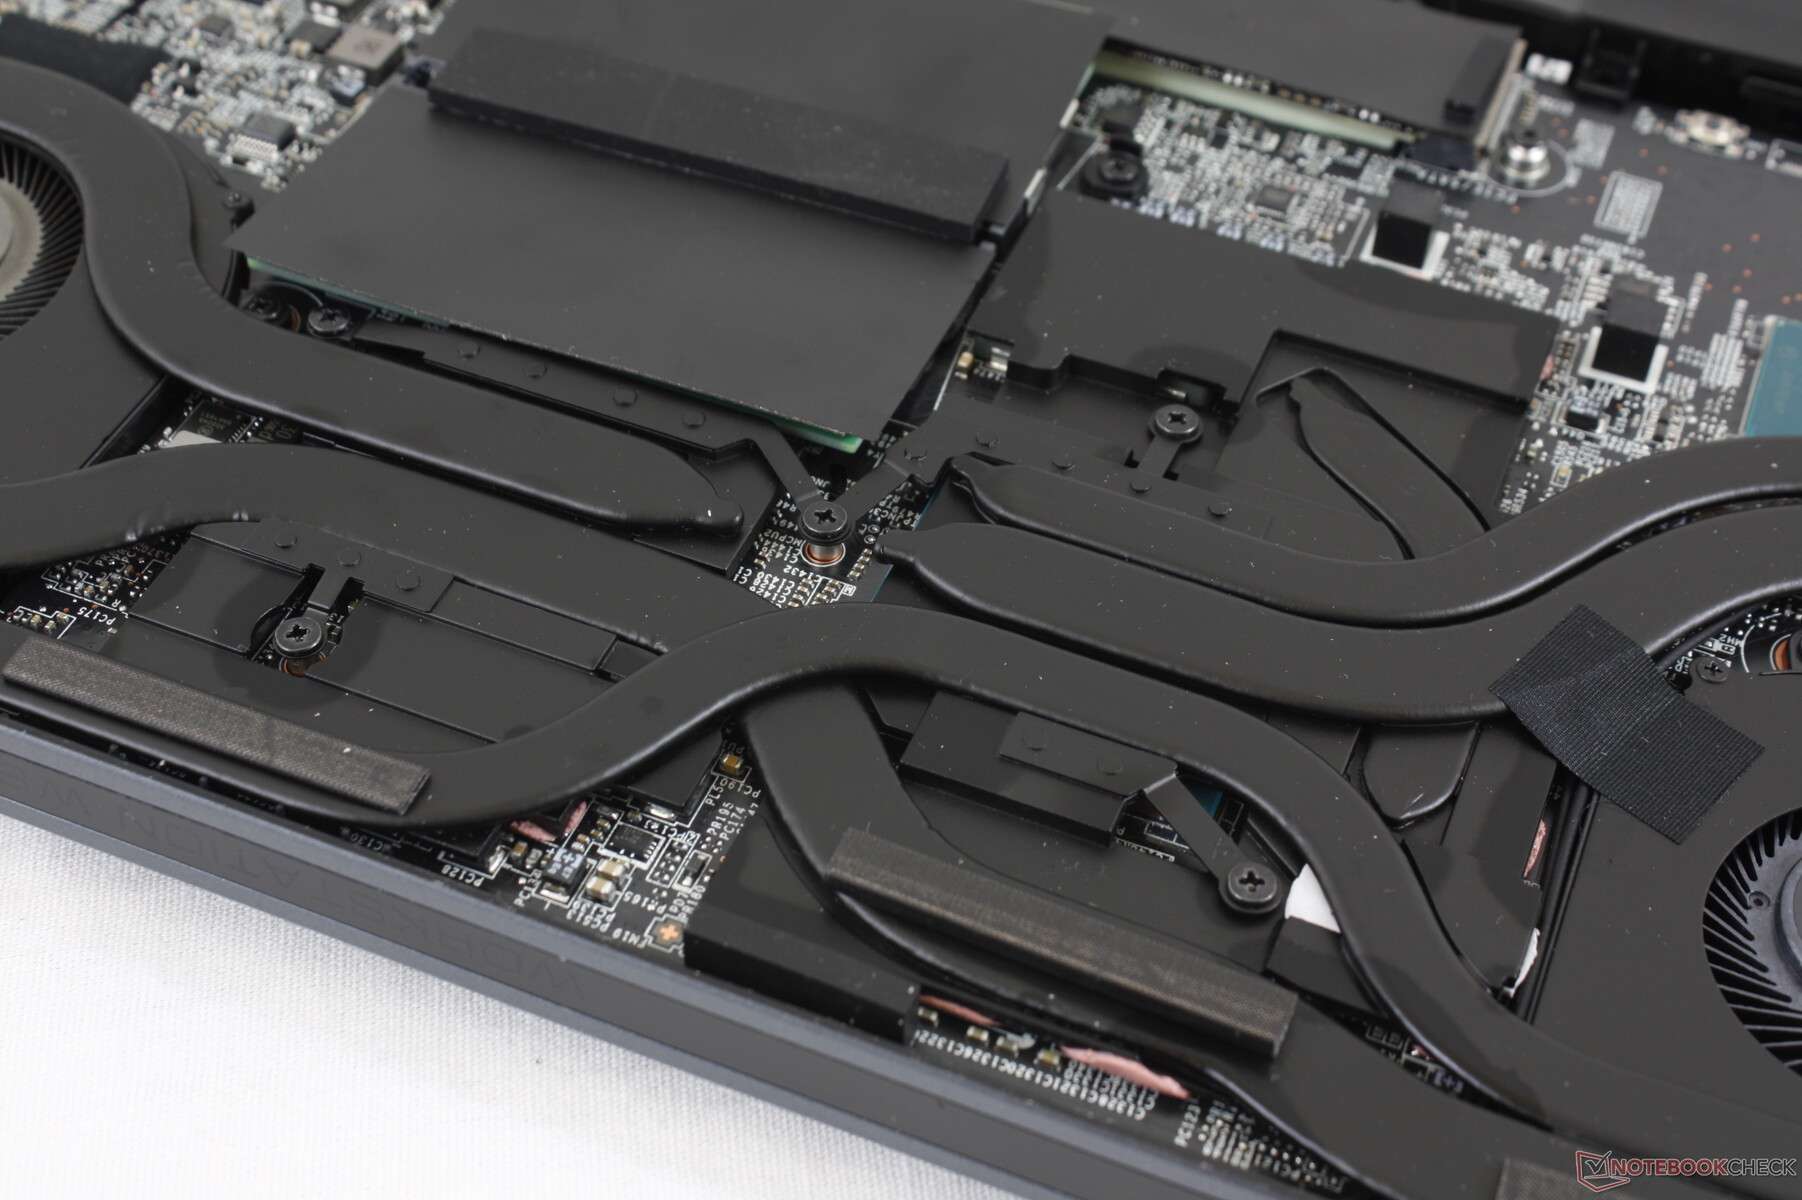
Manutenzione
Il pannello inferiore è fissato con 9 viti a croce. La sua rimozione è complicata perché i bordi e gli angoli appuntiti sono fissati saldamente alla base rispetto ai pannelli inferiori della WS63 o del Razer Blade 15 Studio.
Accessori e Garanzia
Non ci sono extra nella confezione oltre all'alimentatore e alla documentazione. MSI offre una garanzia limitata di tre anni con assistenza in loco di serie.
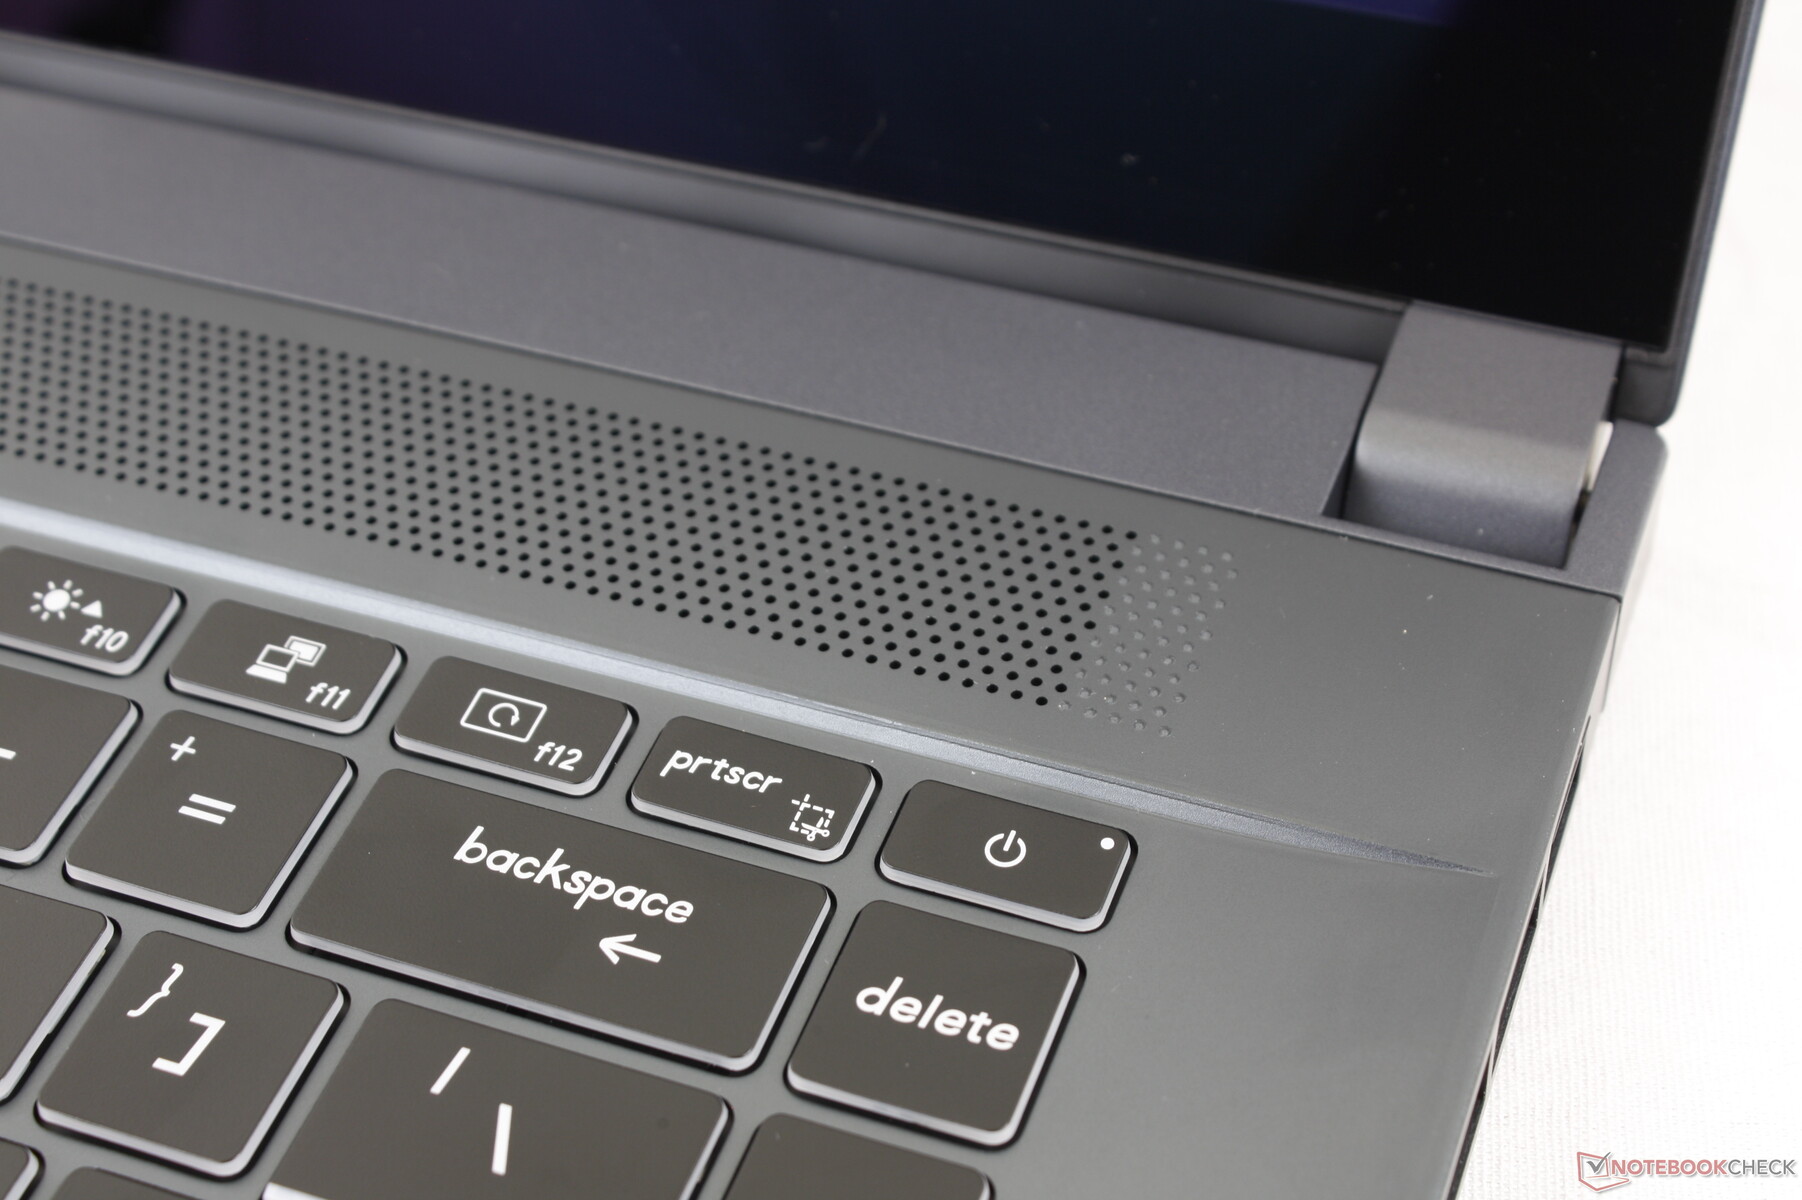
Dispositivi di Input
Tastiera
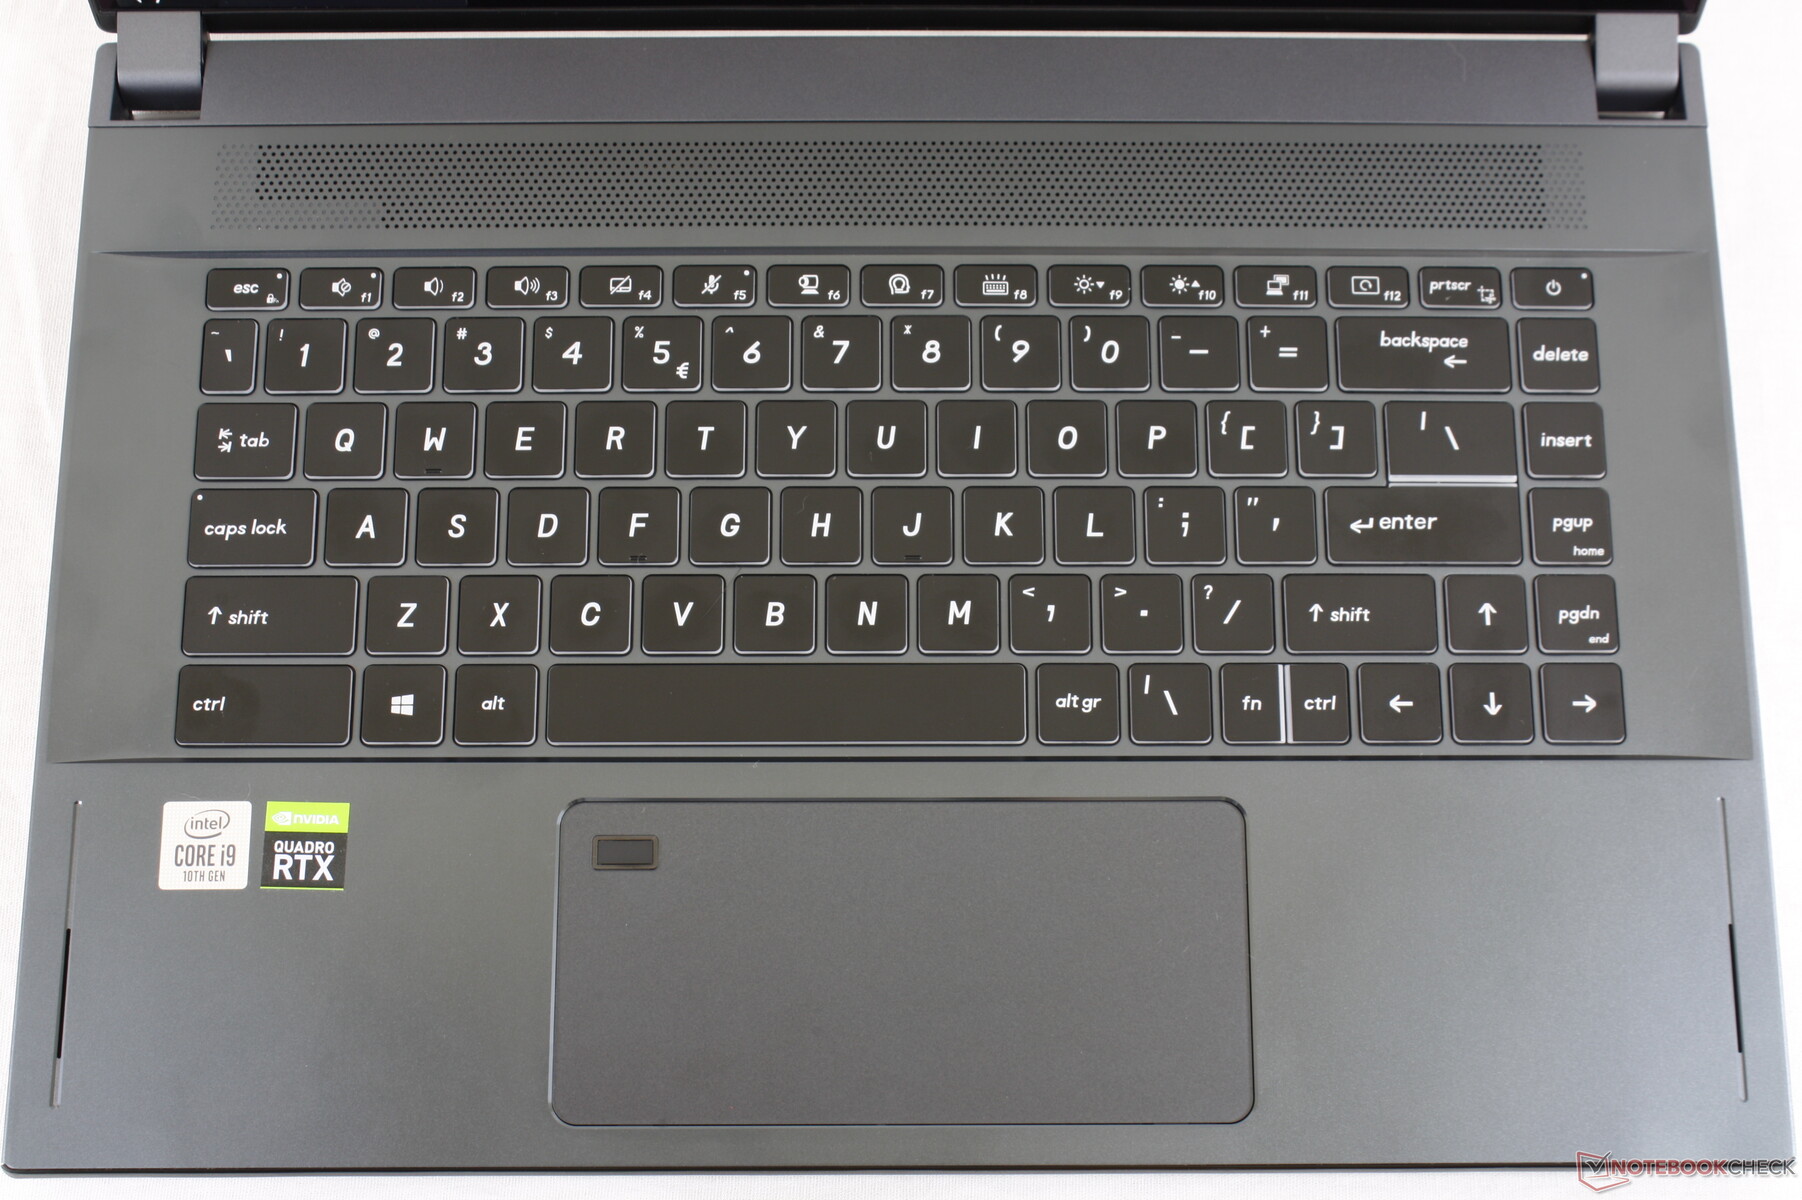
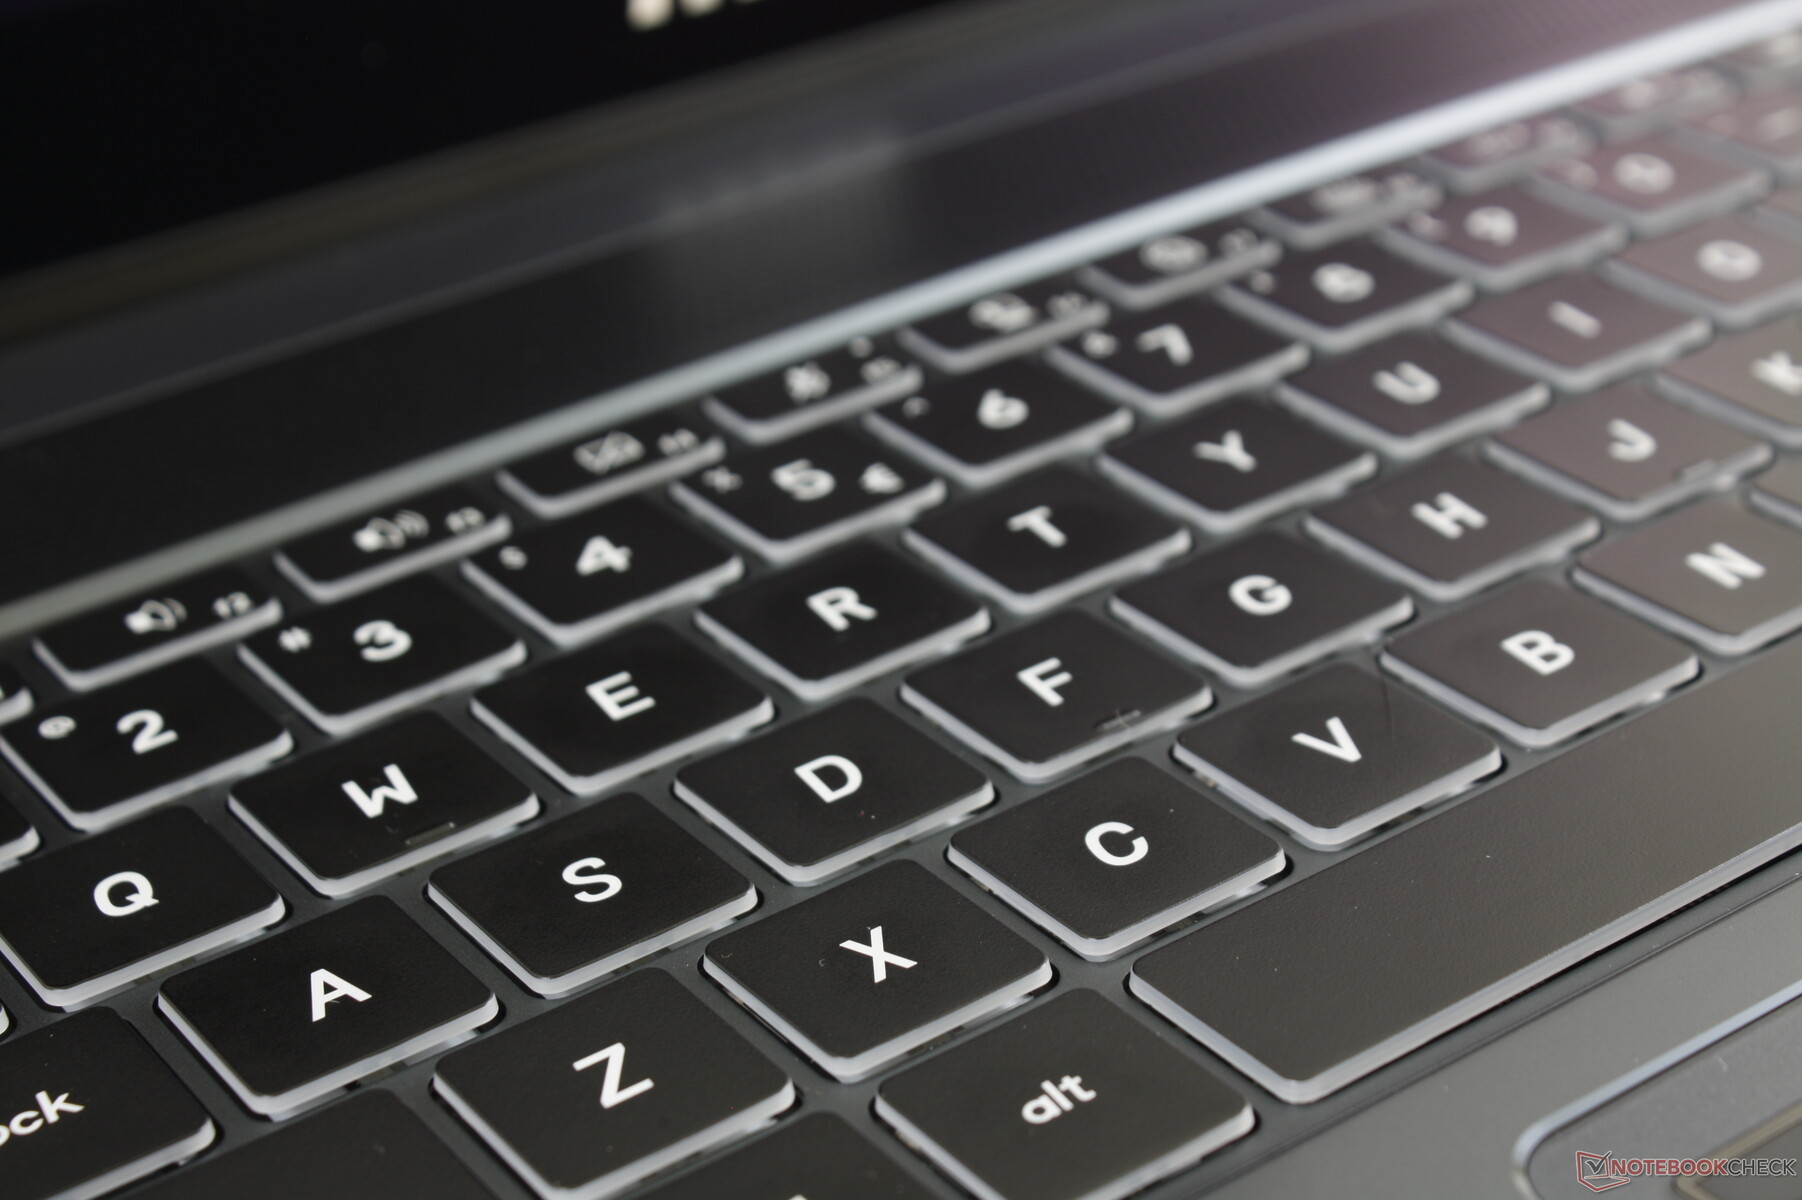
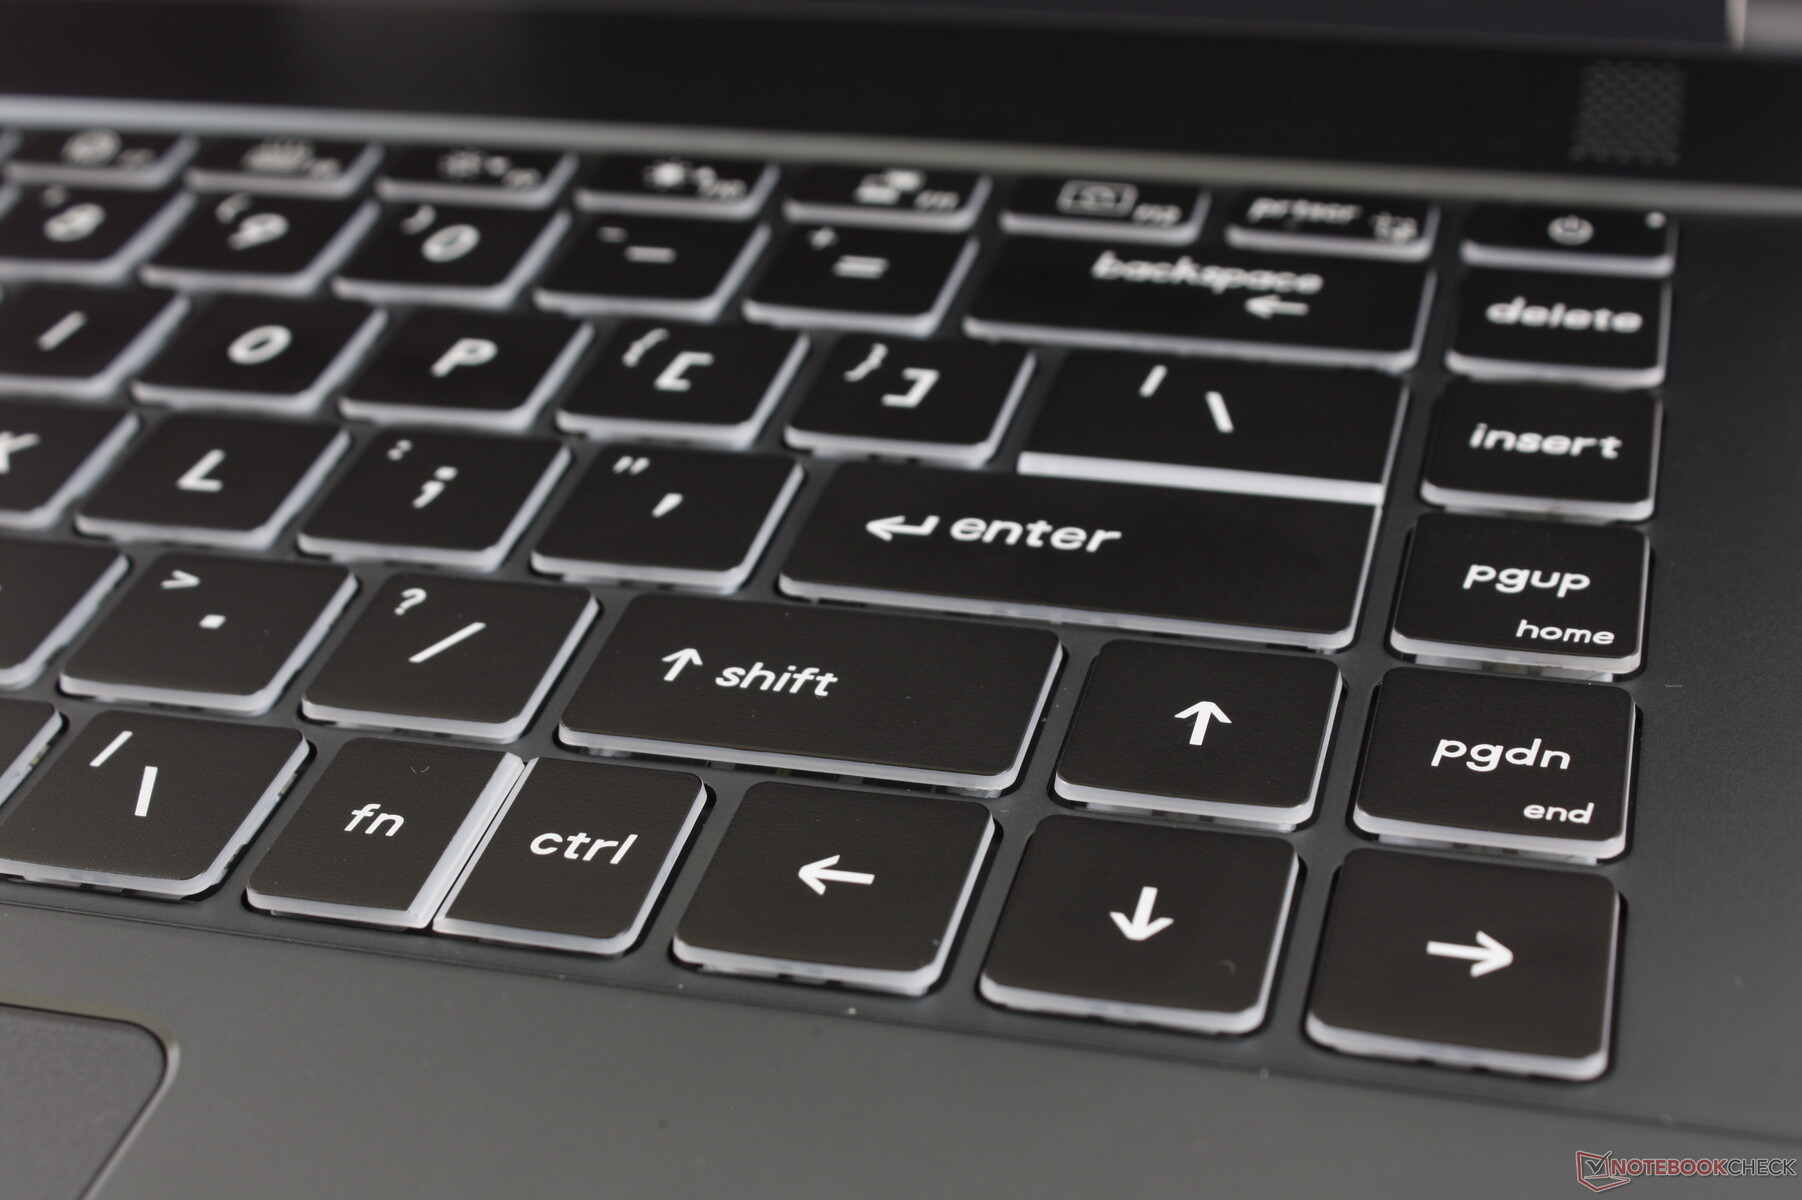
La disposizione dei tasti e il feedback sono identici a quelli della GS66, nel bene e nel male, ma con diversi stili di caratteri e funzioni secondarie. La luminosità delle hotkeys, ad esempio, sono attivati sulla WS66. Troviamo che i tasti siano troppo poco profondi con un feedback debole, specialmente se confrontati con le tastiere superiori della serie WE o WT di MSI. Se invece siete già abituati a digitare su Ultrabooks, allora la WS66 non sarà molo diversa.
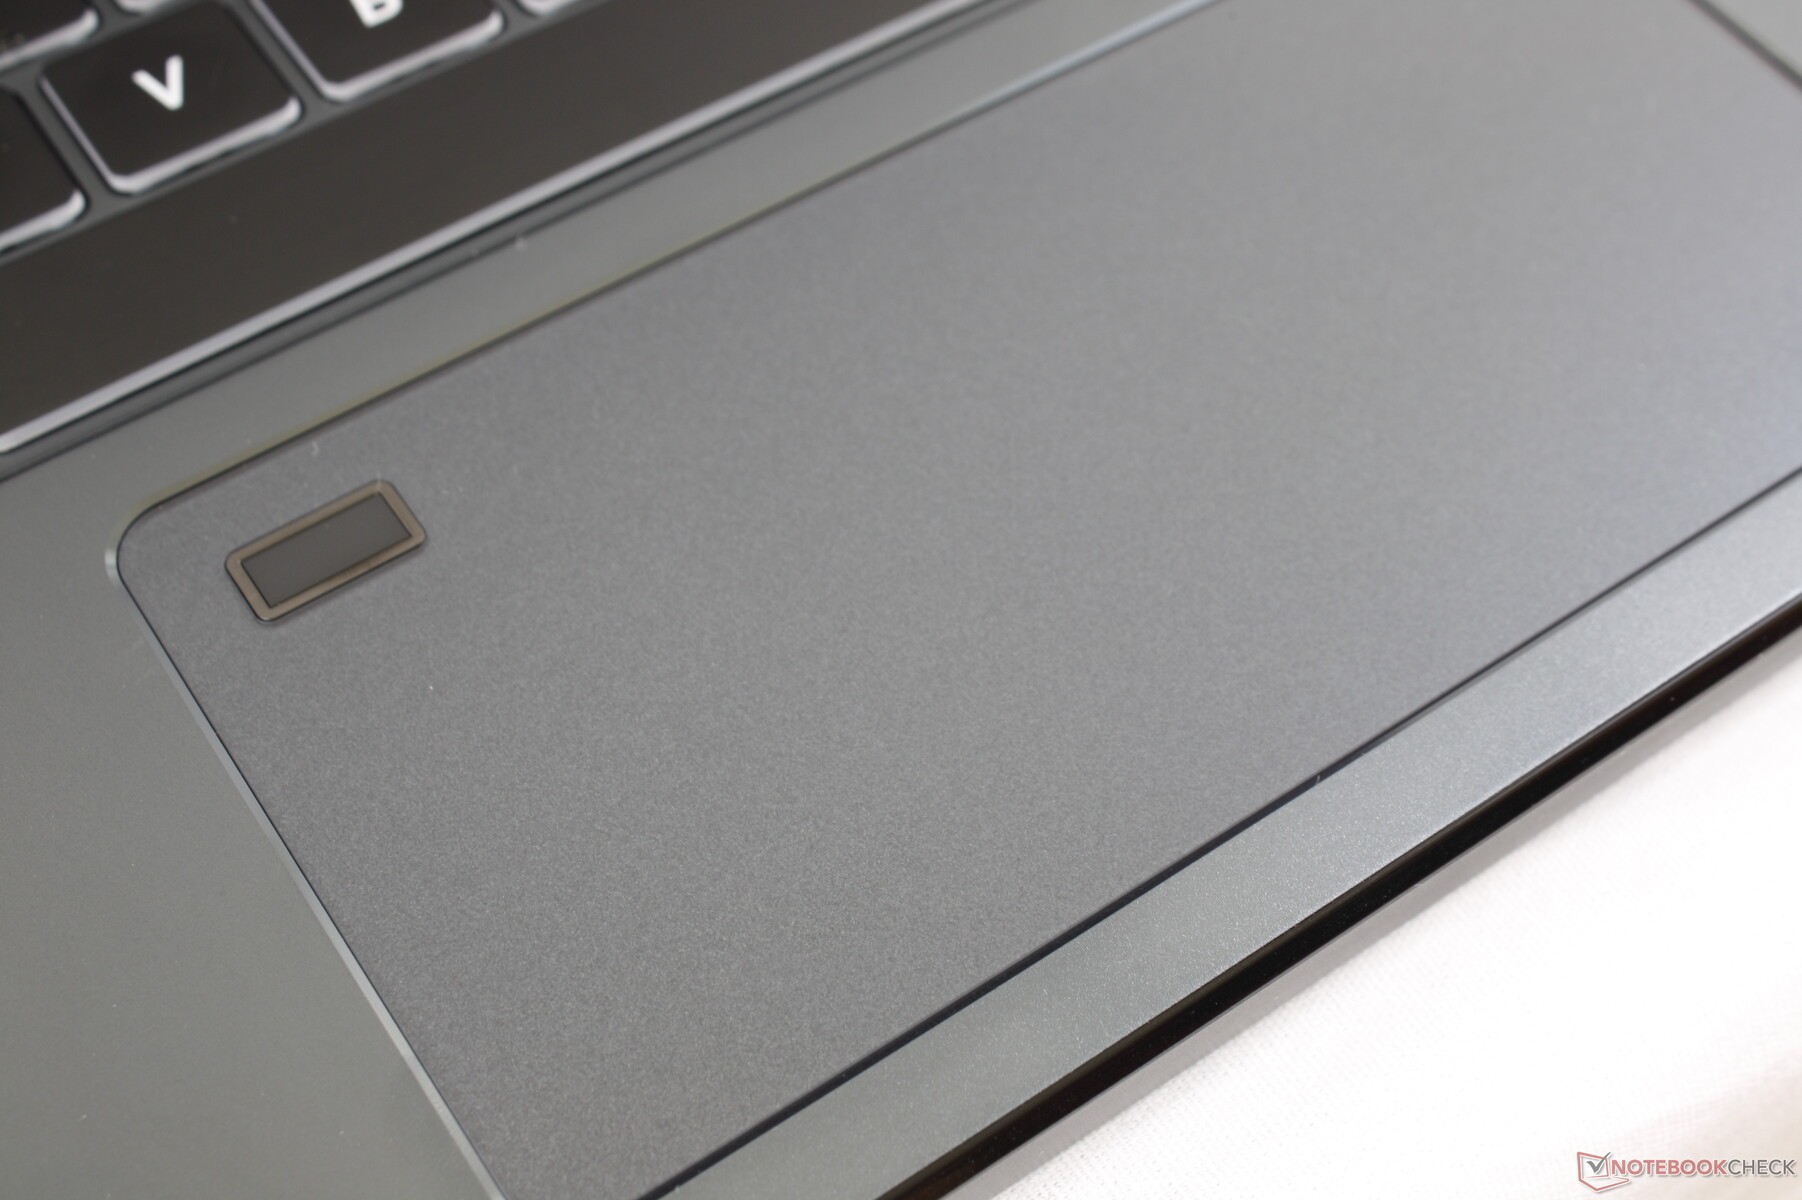
Touchpad
L'ampio clickpad Precision (14 x 6,5 cm) è liscio con solo un po' di aderenza quando si scorre a bassa velocità. Sfortunatamente, i pulsanti del mouse integrati sono morbidi nel feedback con spostamenti poco profondi per un'esperienza insoddisfacente. Inoltre, cliccando sulla metà destra del clickpad risulta più spugnoso della metà sinistra quando dovrebbe essere uniforme da un bordo all'altro. Lo spazio extra è piacevole per gli input multi-touch, ma noi preferiamo la precisione dei pulsanti del mouse dedicati come quelli dell'MSI WT75.
Una conseguenza fastidiosa del clickpad allungato è che il poggiapolsi destro sarà quasi sempre schiacciato mentre si digita. Ci si può aspettare qualche input accidentale del mouse ogni tanto.
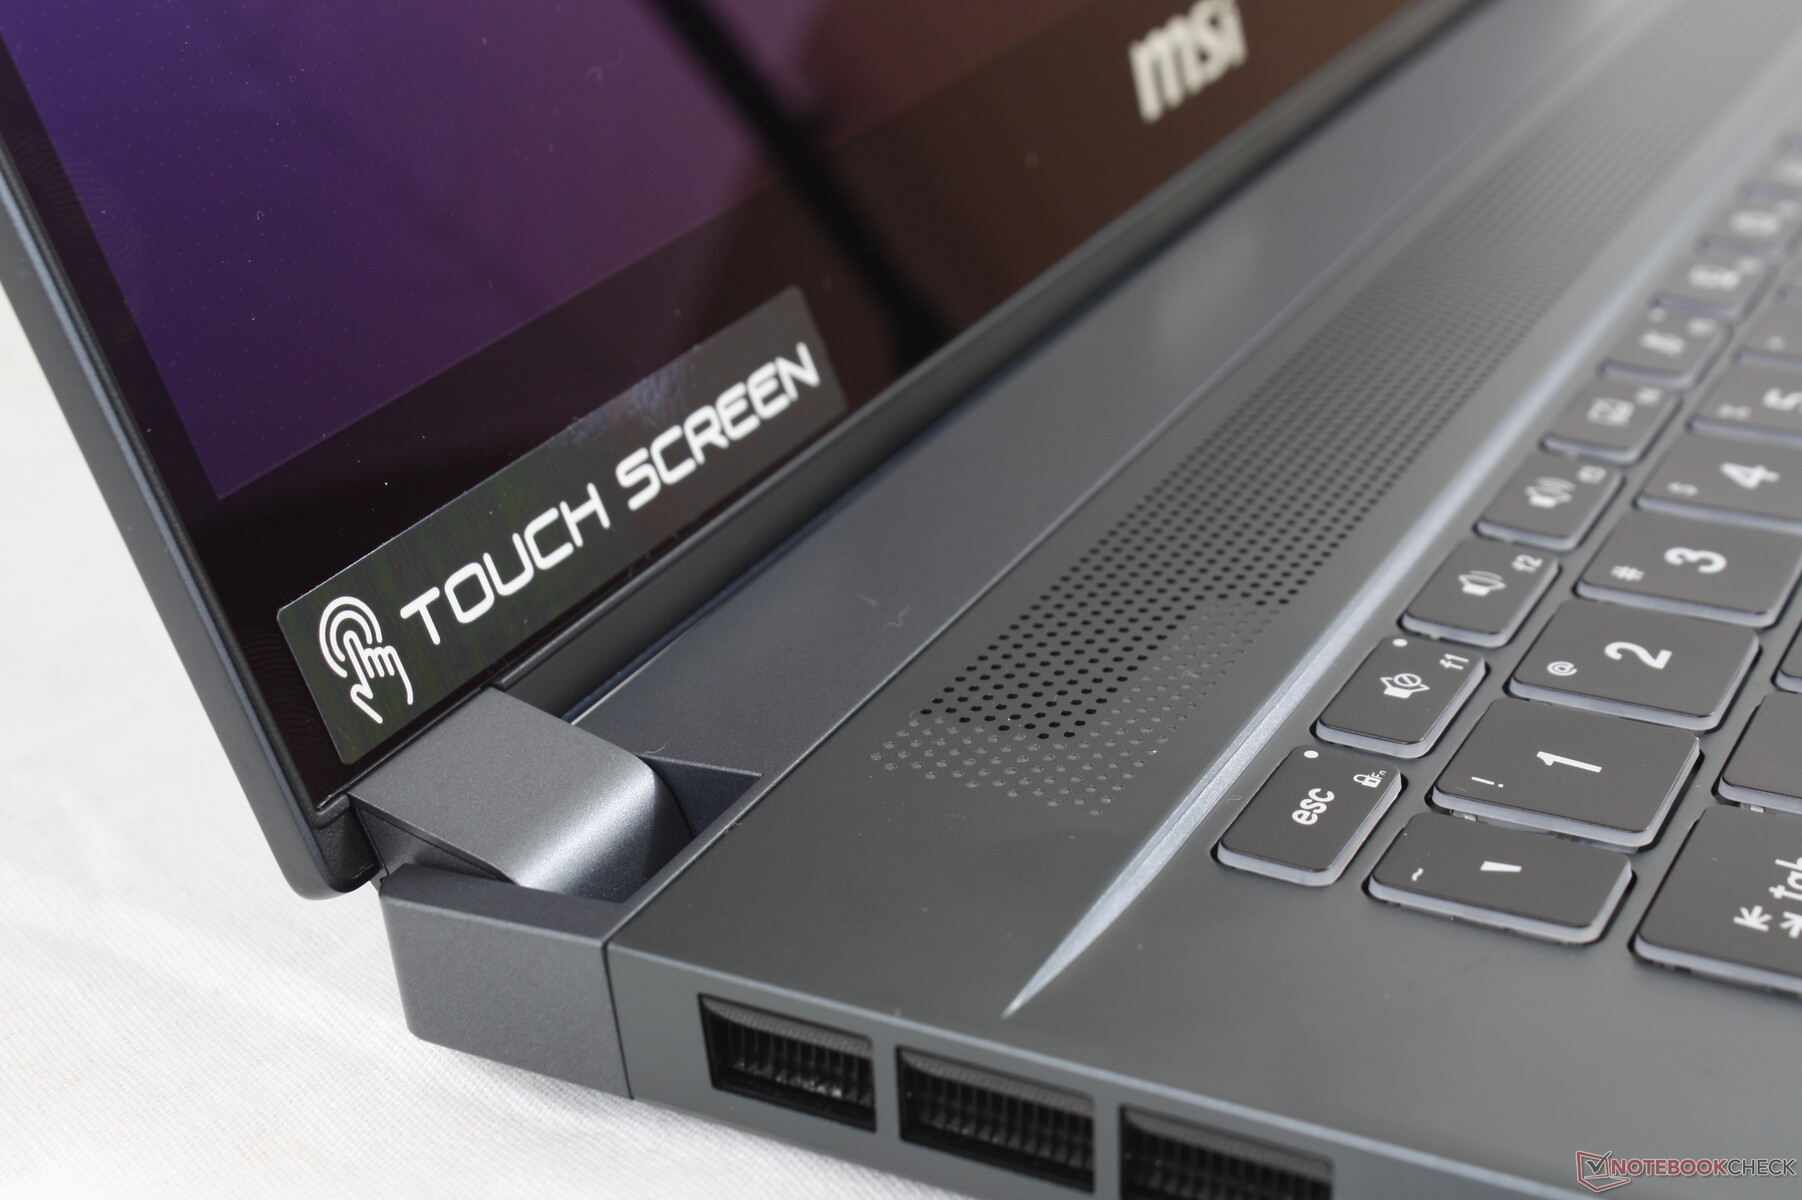
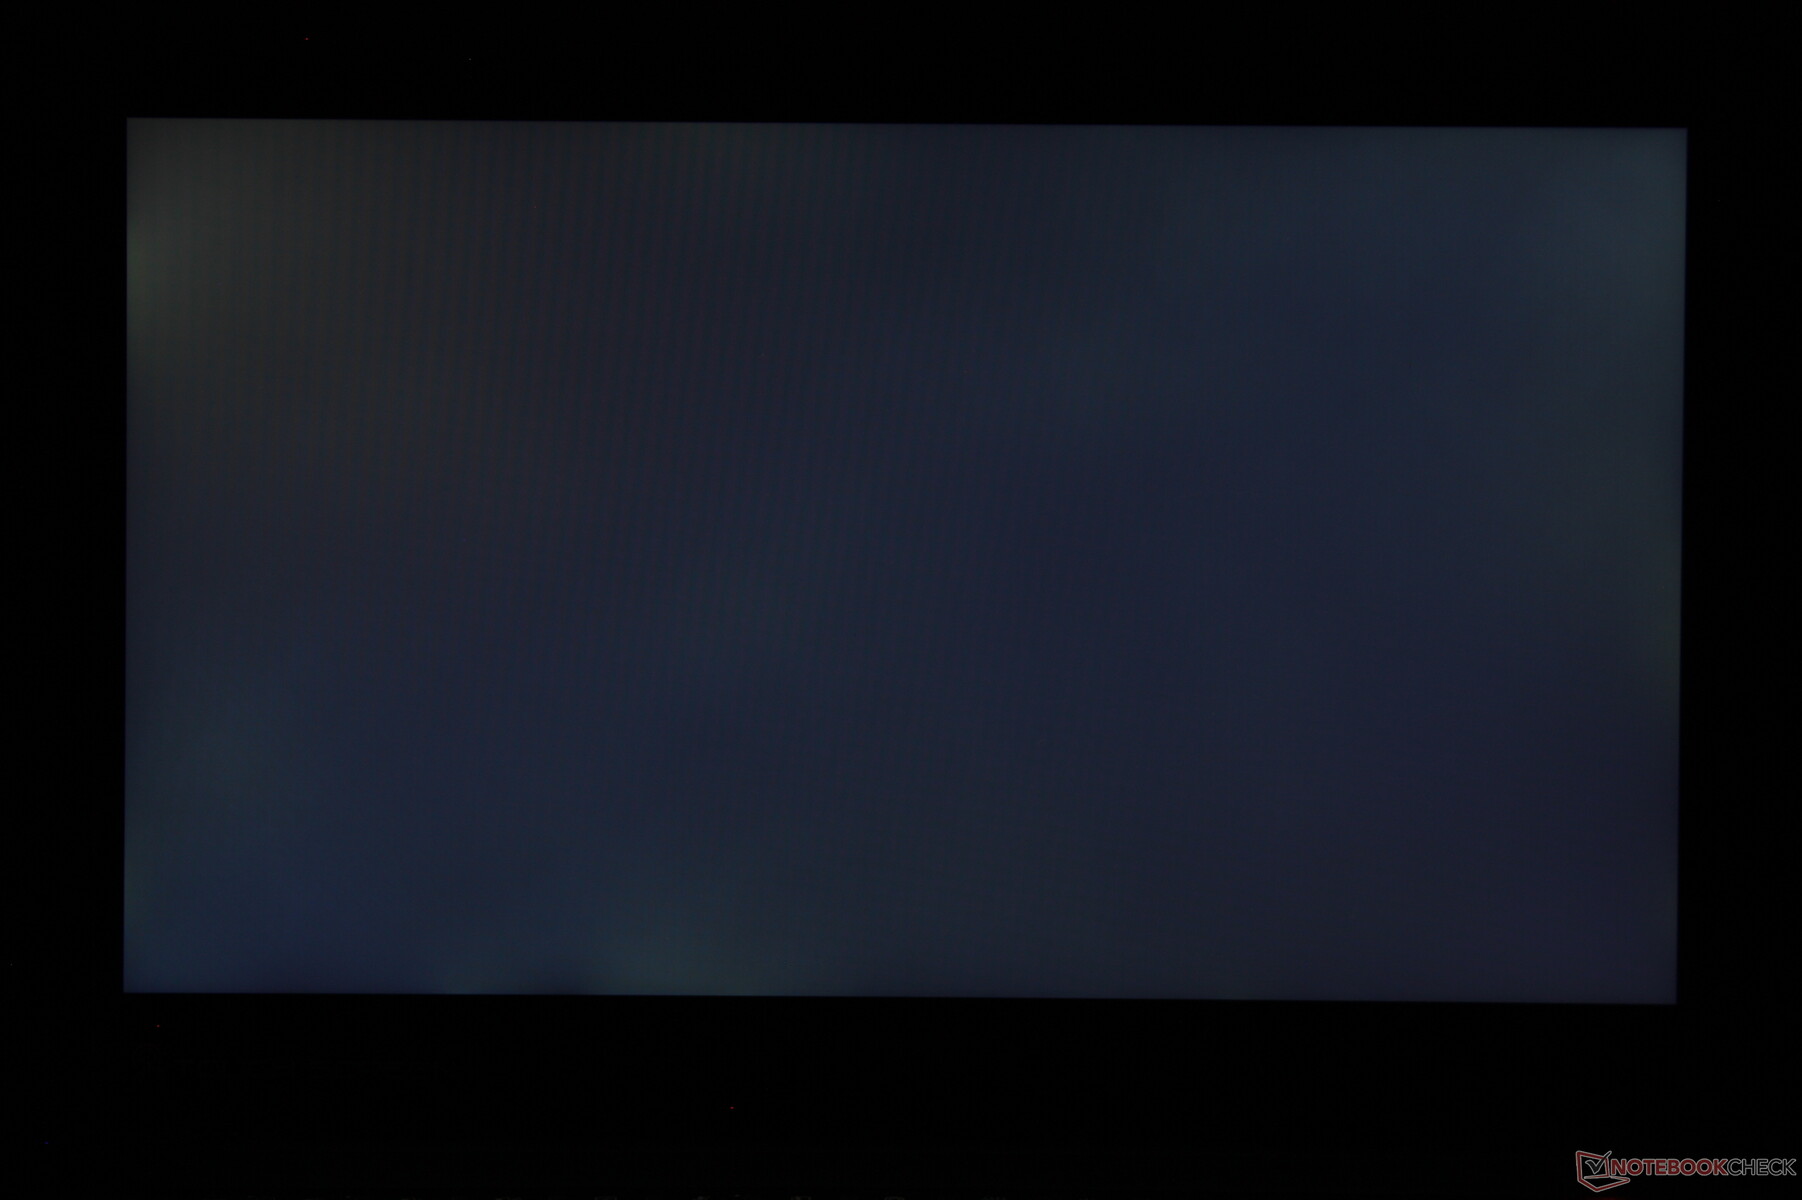
Display
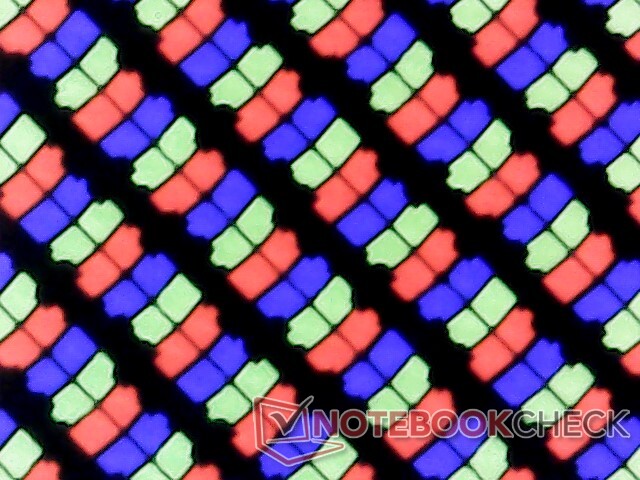
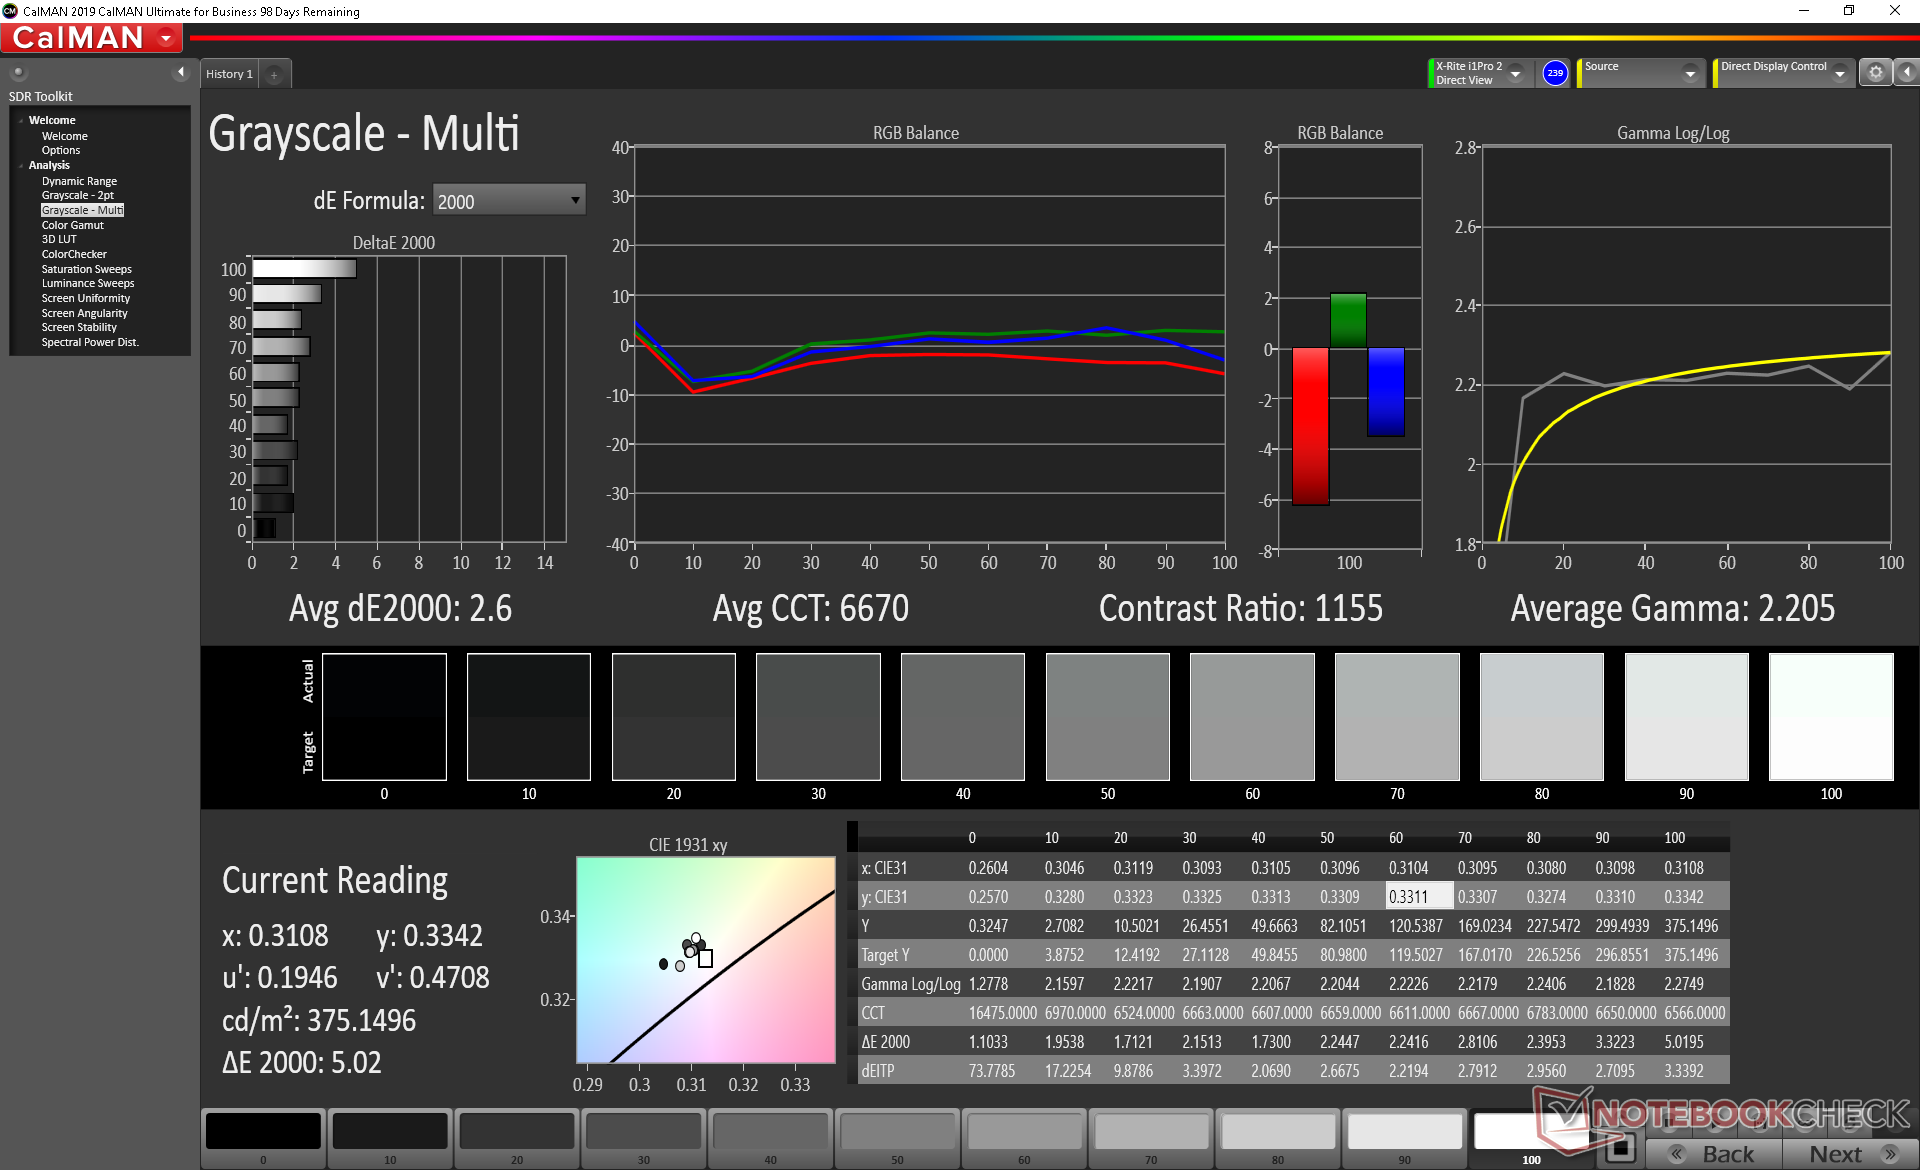
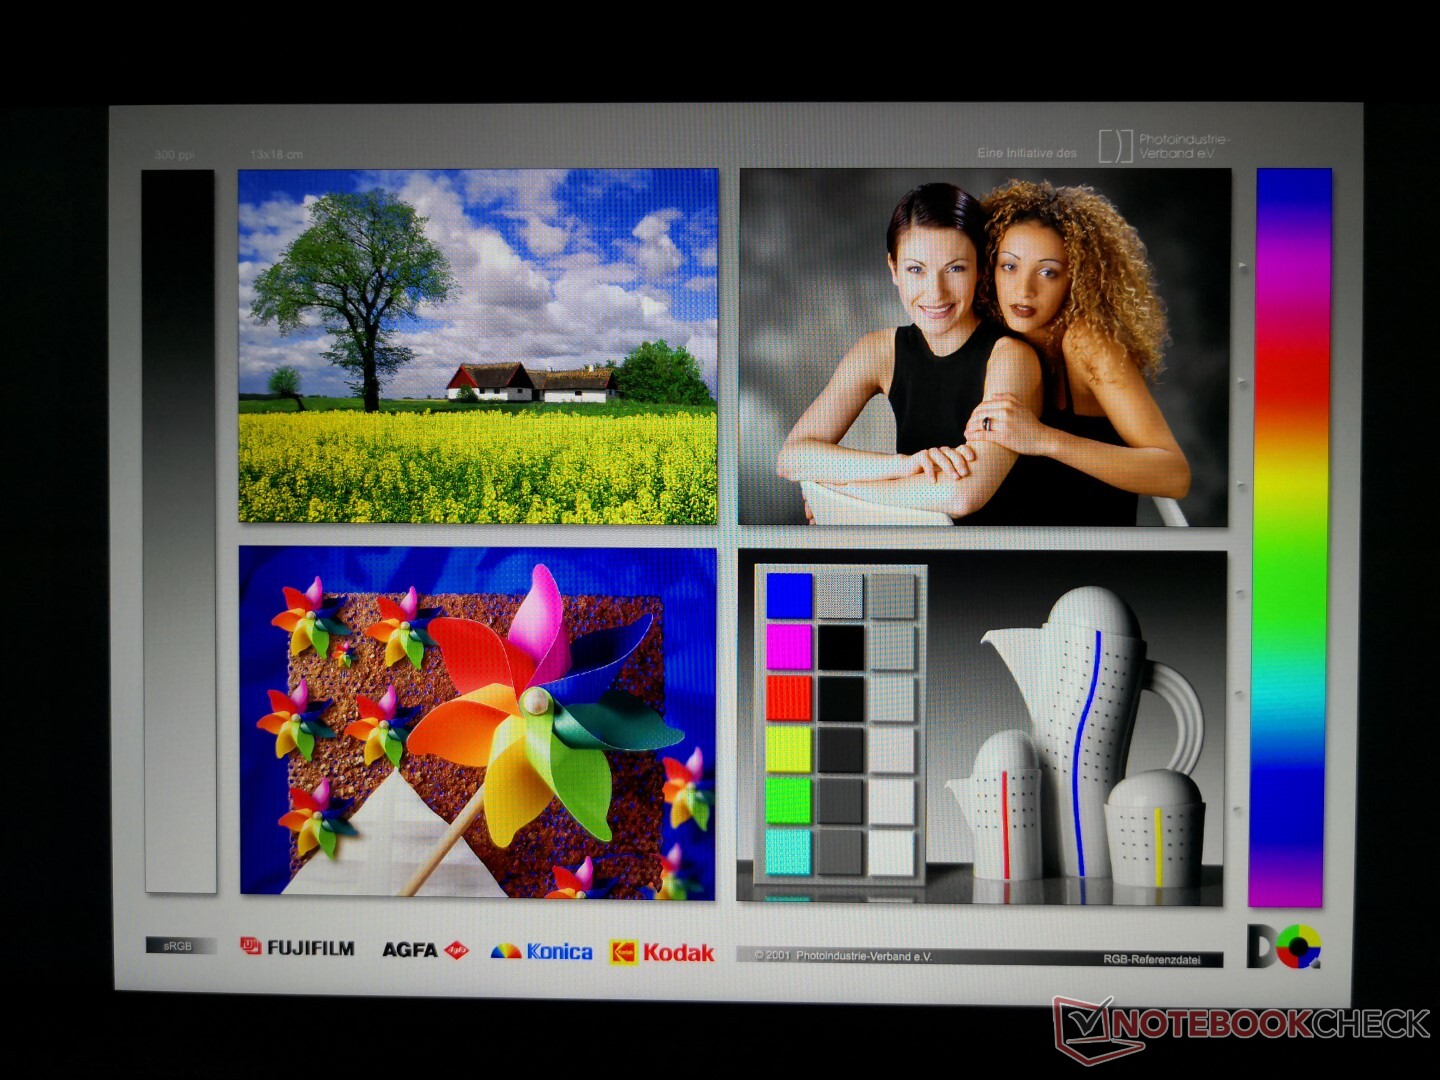
Il pannello IPS AU Optronics B156HAB03.0 è il primo ad apparire nel nostro database. Contrasto e luminosità sono entrambi buoni per la categoria a circa 900:1 e 363 nits, rispettivamente, ma alcune altre workstations ultrasottili come la Precision 5550 sono più luminose, più colorate e hanno livelli di nero più profondi per una qualità d'immagine superiore. I tempi di risposta in bianco e nero sono nella media, il che è normale, dato che questa non è una macchina gaming.
| |||||||||||||||||||||||||
Distribuzione della luminosità: 91 %
Al centro con la batteria: 374.5 cd/m²
Contrasto: 892:1 (Nero: 0.42 cd/m²)
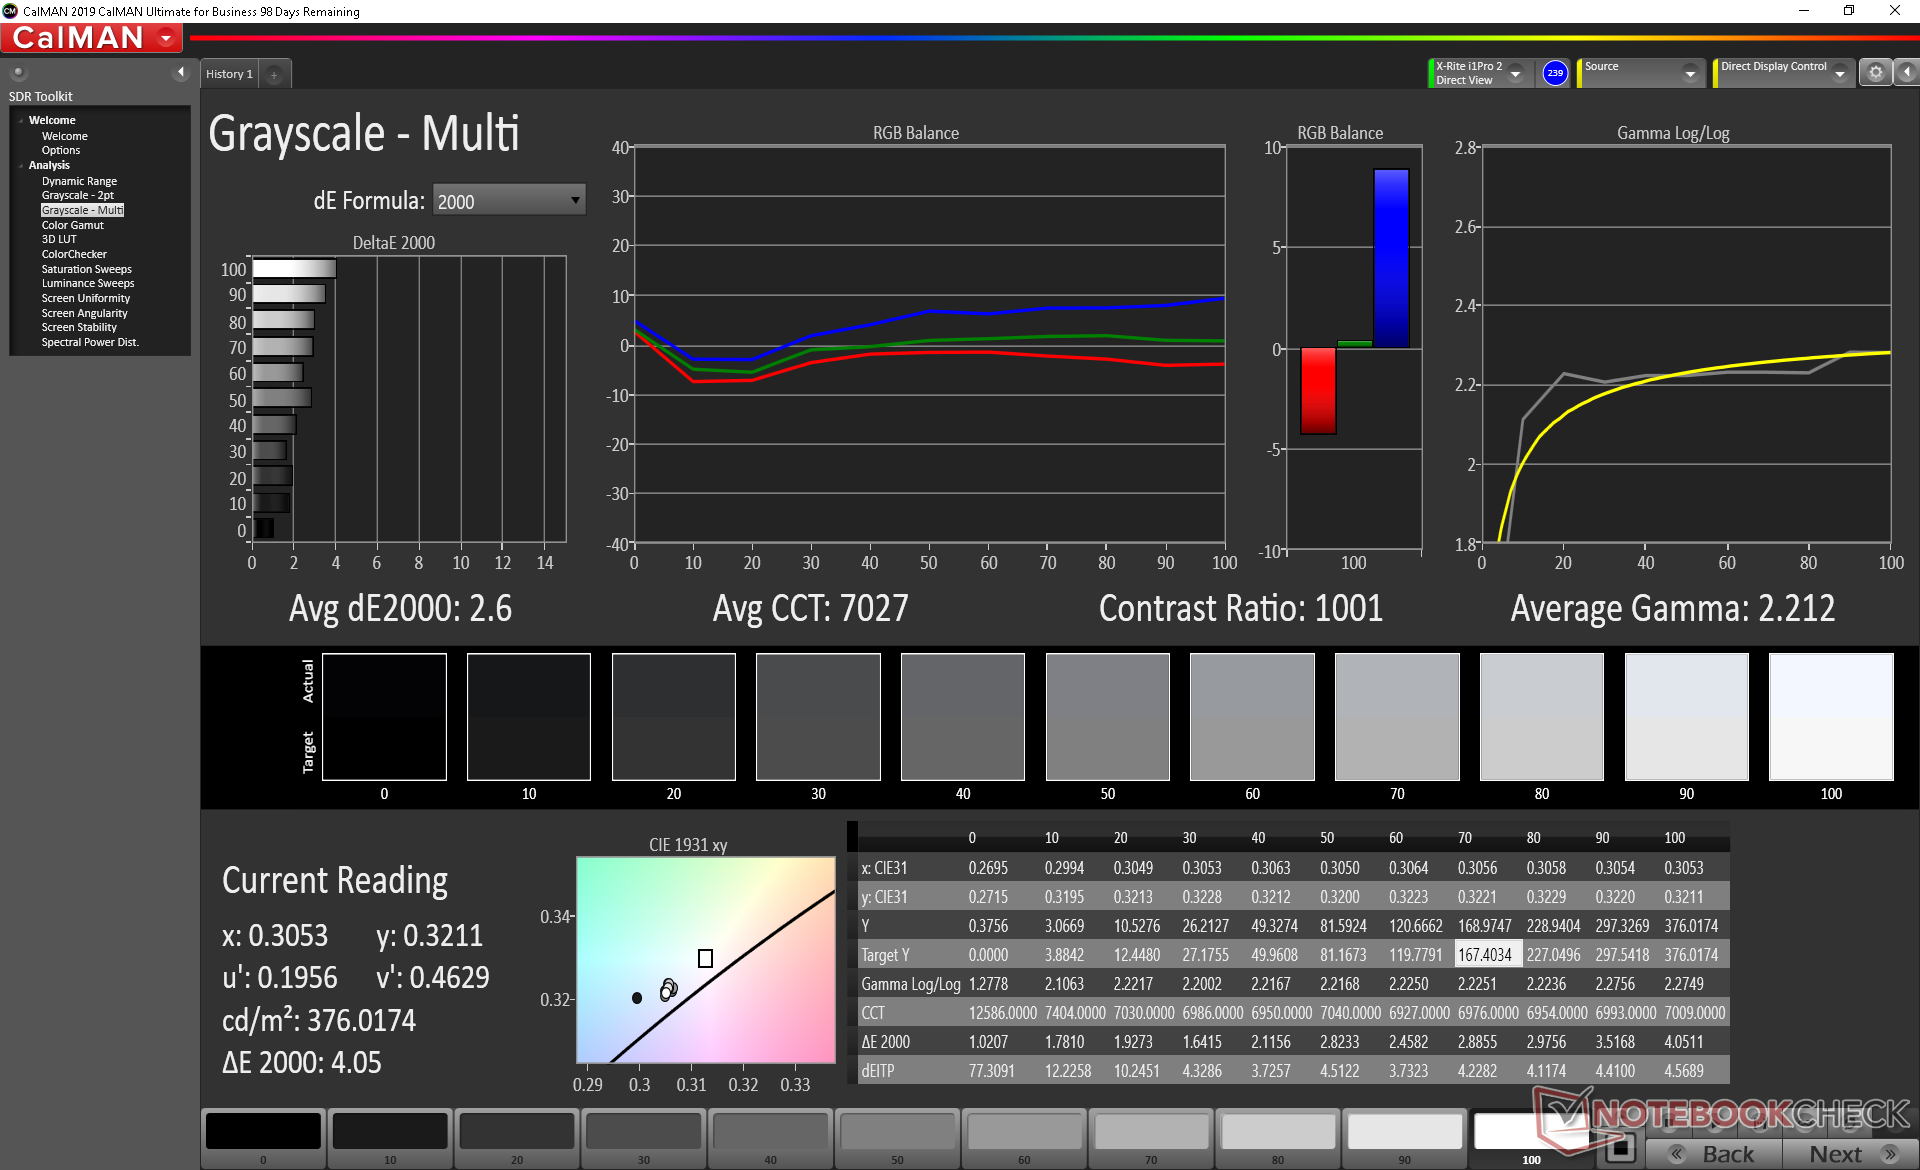
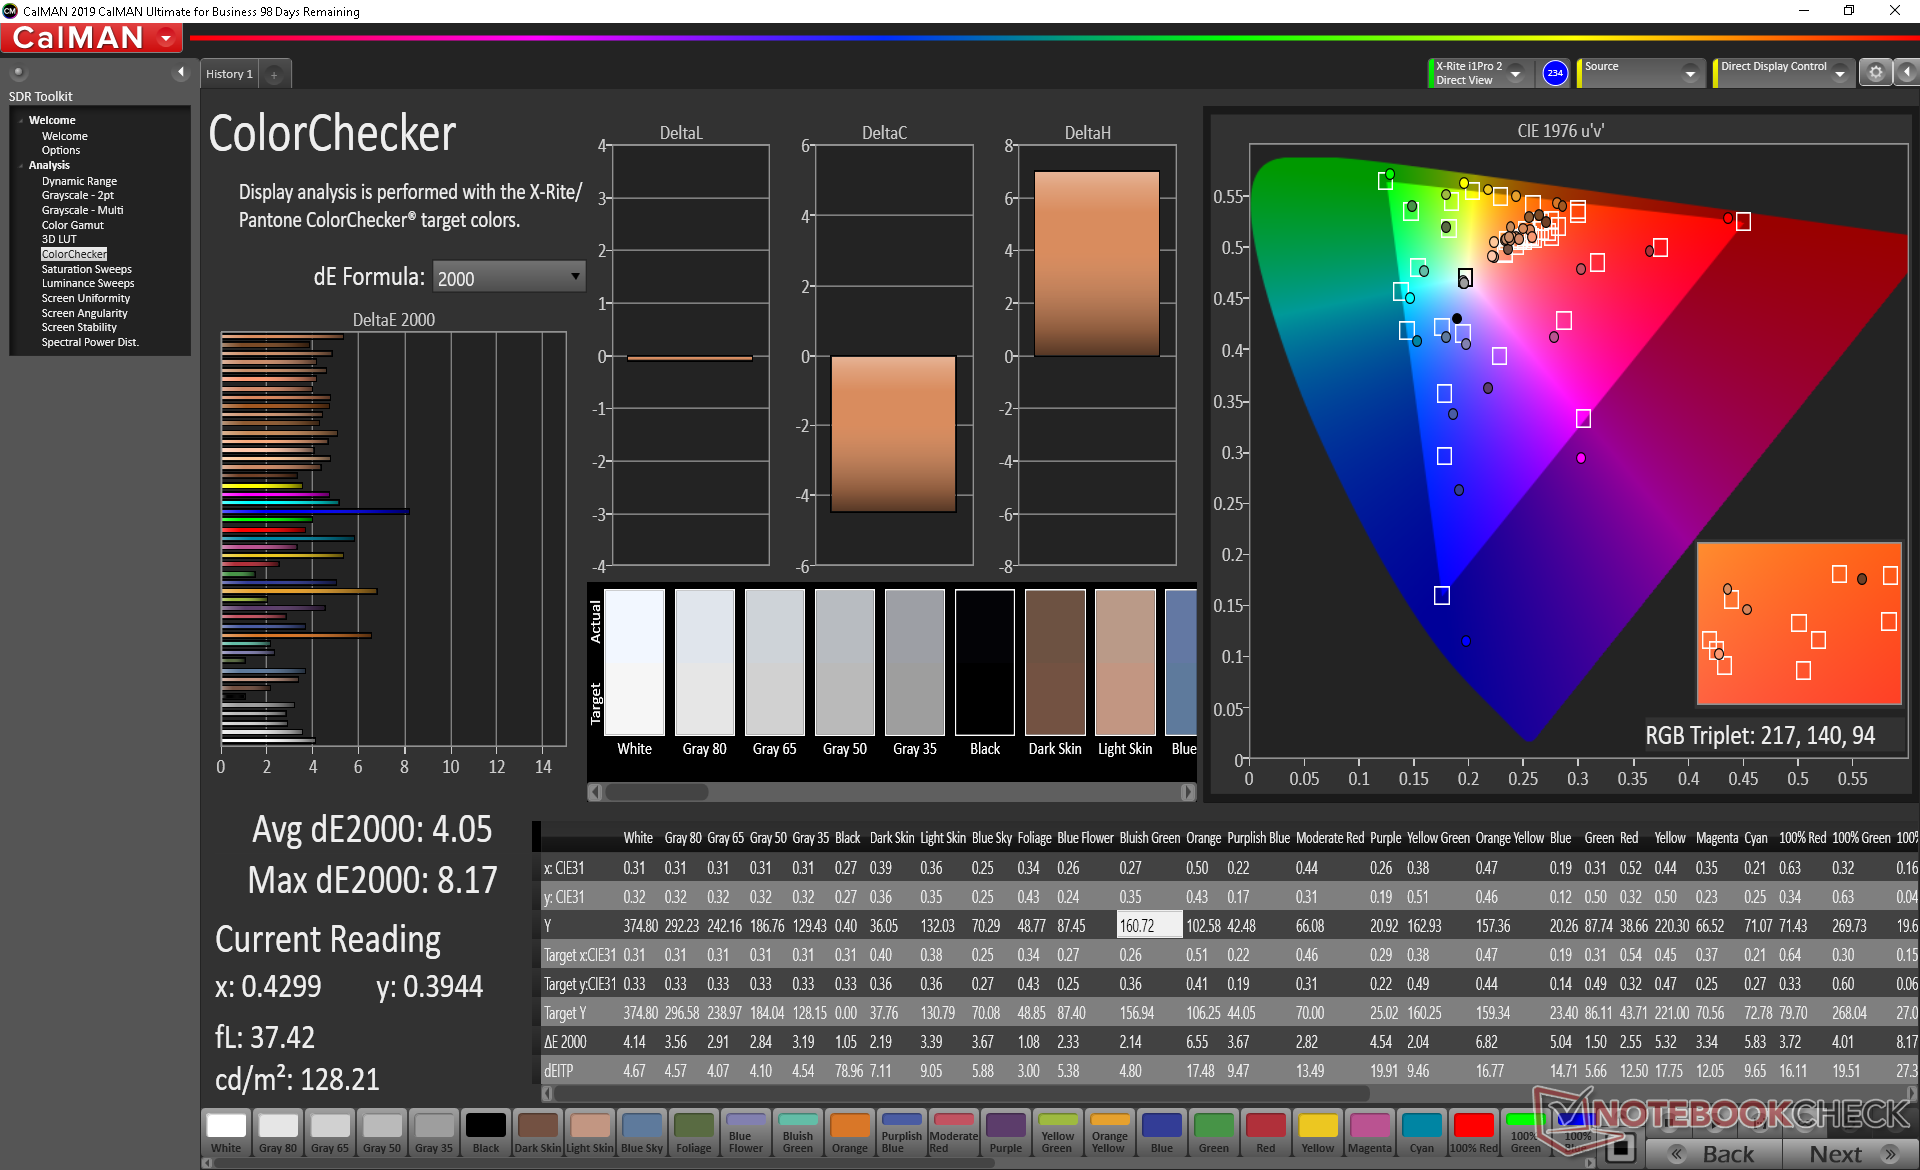
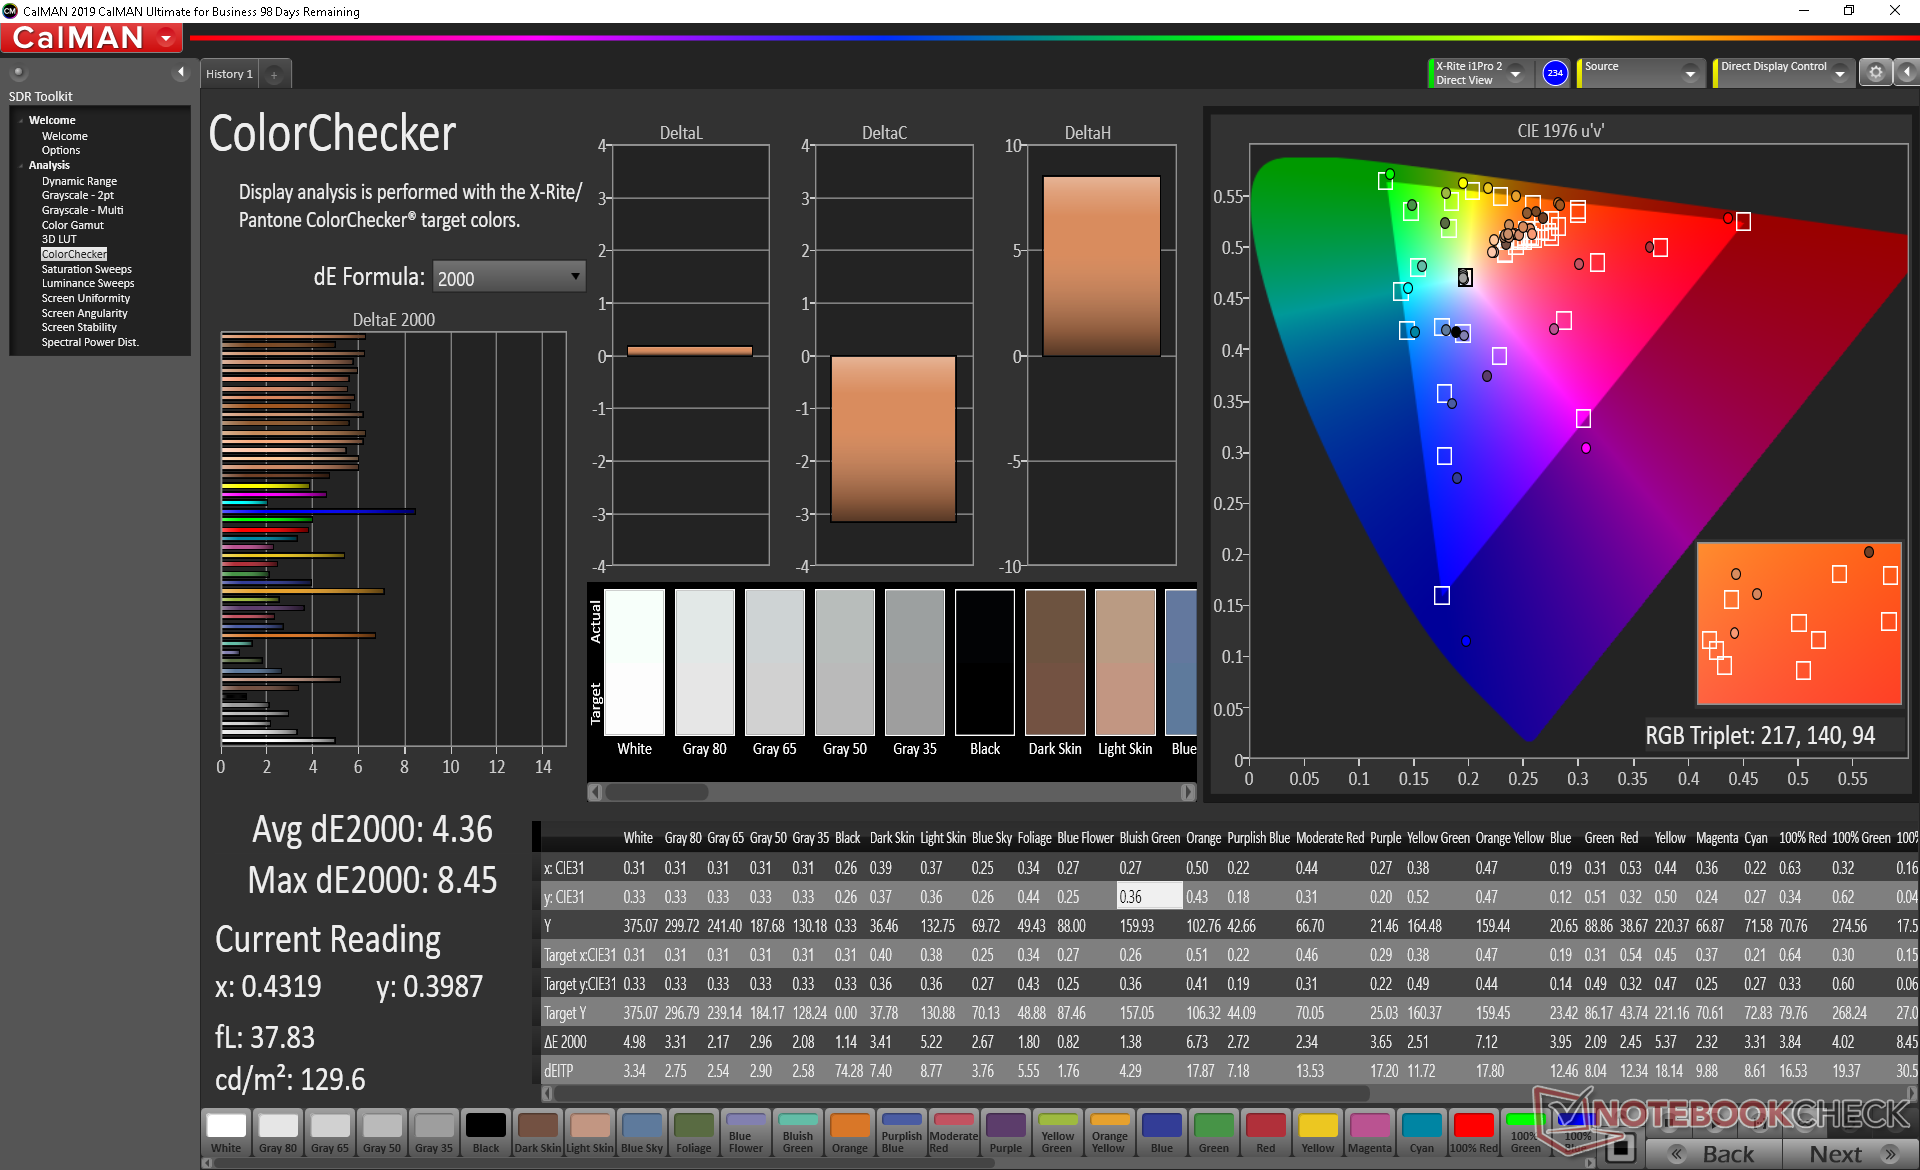
ΔE ColorChecker Calman: 4.05 | ∀{0.5-29.43 Ø4.72}
calibrated: 4.36
ΔE Greyscale Calman: 2.6 | ∀{0.09-98 Ø4.97}
86.3% sRGB (Argyll 1.6.3 3D)
56.4% AdobeRGB 1998 (Argyll 1.6.3 3D)
63.6% AdobeRGB 1998 (Argyll 3D)
86.9% sRGB (Argyll 3D)
62.8% Display P3 (Argyll 3D)
Gamma: 2.21
CCT: 7027 K
| MSI WS66 10TMT-207US AU Optronics B156HAB03.0, IPS, 15.6", 1920x1080 | Dell Precision 7550 AU Optronics B156ZAN, IPS, 15.6", 3840x2160 | Dell Precision 5550 P91F Sharp LQ156R1, IPS, 15.6", 3840x2400 | Razer Blade 15 Studio Edition 2020 Samsung SDCA029, OLED, 15.6", 3840x2160 | MSI WS63VR 7RL-023US SAMSUNG LƒFL156FL02-101 , IPS, 15.6", 3840x2160 | Acer ConceptD 3 Pro CN315-71P-73W1 Chi Mei N156HCE-EN2, IPS, 15.6", 1920x1080 | |
|---|---|---|---|---|---|---|
| Display | 33% | 38% | 42% | -22% | 36% | |
| Display P3 Coverage (%) | 62.8 | 82.1 31% | 89.9 43% | 99.9 59% | 47.43 -24% | 97.9 56% |
| sRGB Coverage (%) | 86.9 | 99.6 15% | 100 15% | 100 15% | 71.4 -18% | 99.9 15% |
| AdobeRGB 1998 Coverage (%) | 63.6 | 96.8 52% | 99.9 57% | 97.3 53% | 49 -23% | 87.2 37% |
| Response Times | -16% | -11% | 89% | 10% | 25% | |
| Response Time Grey 50% / Grey 80% * (ms) | 44.8 ? | 51.2 ? -14% | 46 ? -3% | 4 ? 91% | 36.8 ? 18% | 33 ? 26% |
| Response Time Black / White * (ms) | 28.8 ? | 34 ? -18% | 34 ? -18% | 4 ? 86% | 28.4 ? 1% | 22 ? 24% |
| PWM Frequency (Hz) | 1351 ? | |||||
| Screen | -2% | 1% | 212% | -27% | 16% | |
| Brightness middle (cd/m²) | 374.5 | 473.5 26% | 469.8 25% | 380 1% | 259.4 -31% | 343 -8% |
| Brightness (cd/m²) | 363 | 461 27% | 464 28% | 388 7% | 247 -32% | 309 -15% |
| Brightness Distribution (%) | 91 | 90 -1% | 85 -7% | 93 2% | 85 -7% | 85 -7% |
| Black Level * (cd/m²) | 0.42 | 0.55 -31% | 0.42 -0% | 0.018 96% | 0.43 -2% | 0.22 48% |
| Contrast (:1) | 892 | 861 -3% | 1119 25% | 21111 2267% | 603 -32% | 1559 75% |
| Colorchecker dE 2000 * | 4.05 | 4.8 -19% | 5.16 -27% | 5.47 -35% | 5.5 -36% | 3.73 8% |
| Colorchecker dE 2000 max. * | 8.17 | 8.73 -7% | 9.33 -14% | 8.19 -0% | 12.7 -55% | 6.51 20% |
| Colorchecker dE 2000 calibrated * | 4.36 | 3.08 29% | 3.75 14% | 3.04 30% | 1.43 67% | |
| Greyscale dE 2000 * | 2.6 | 5.6 -115% | 5.5 -112% | 5.3 -104% | 3.6 -38% | 4.24 -63% |
| Gamma | 2.21 100% | 2.34 94% | 2 110% | 2.15 102% | 2.24 98% | 2.2 100% |
| CCT | 7027 93% | 7549 86% | 6198 105% | 6128 106% | 7163 91% | 6329 103% |
| Color Space (Percent of AdobeRGB 1998) (%) | 56.4 | 86.4 53% | 89.2 58% | 86 52% | 45 -20% | 78 38% |
| Color Space (Percent of sRGB) (%) | 86.3 | 99.7 16% | 100 16% | 100 16% | 71 -18% | 100 16% |
| Media totale (Programma / Settaggio) | 5% /
3% | 9% /
6% | 114% /
165% | -13% /
-21% | 26% /
21% |
* ... Meglio usare valori piccoli
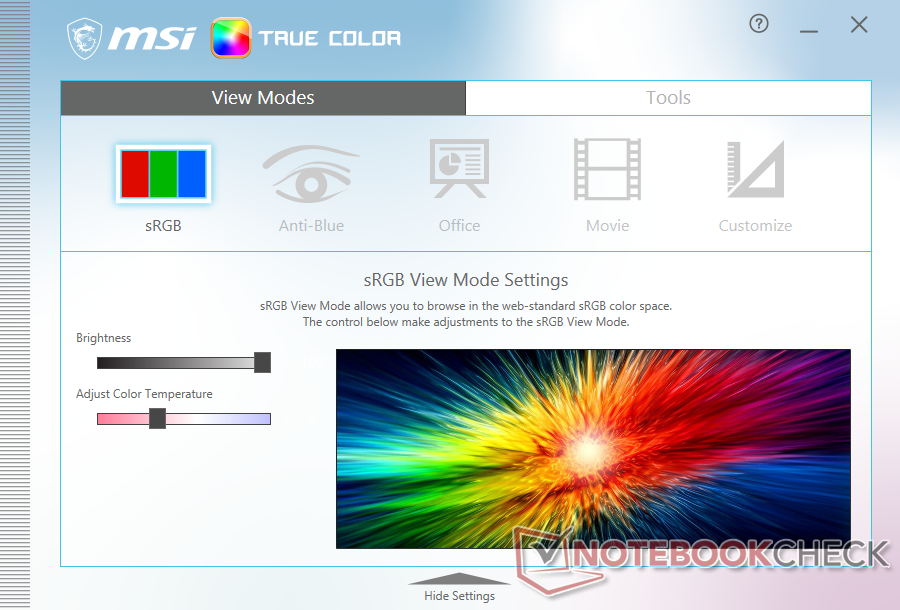
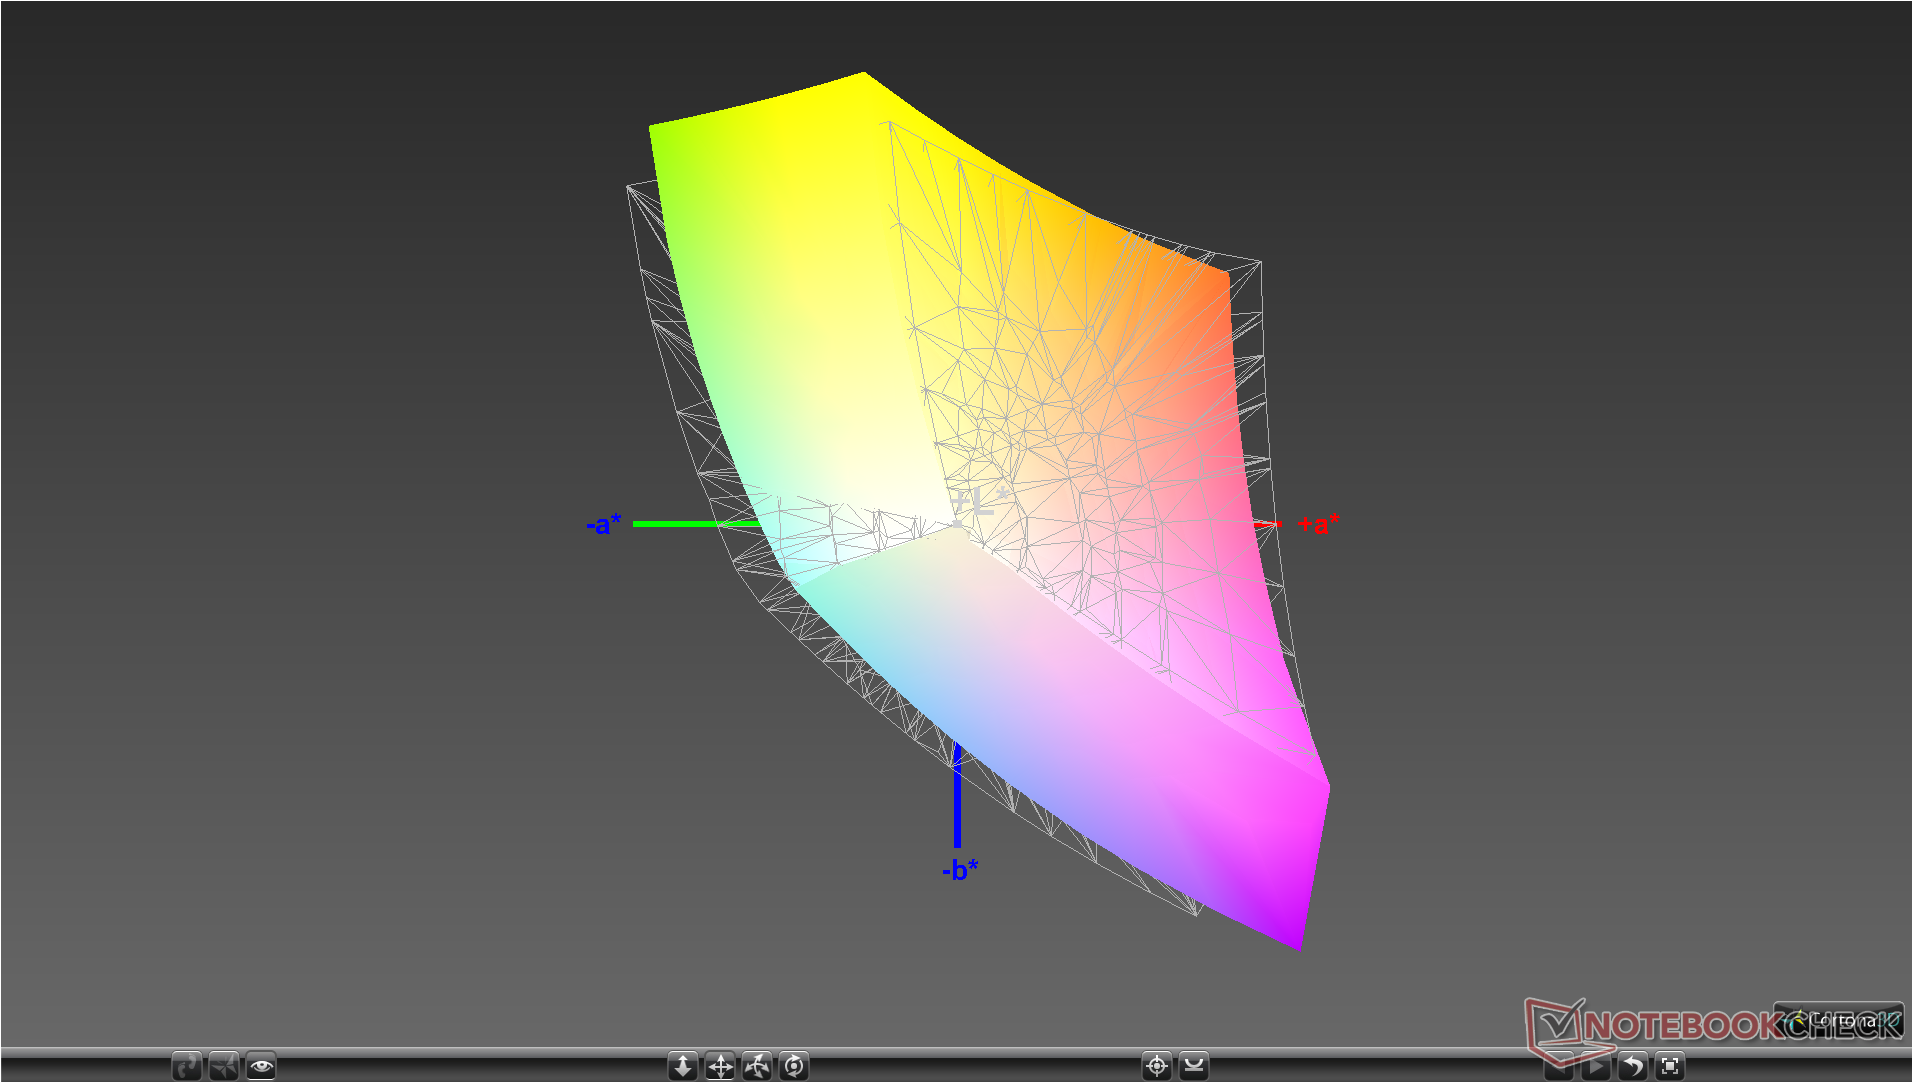
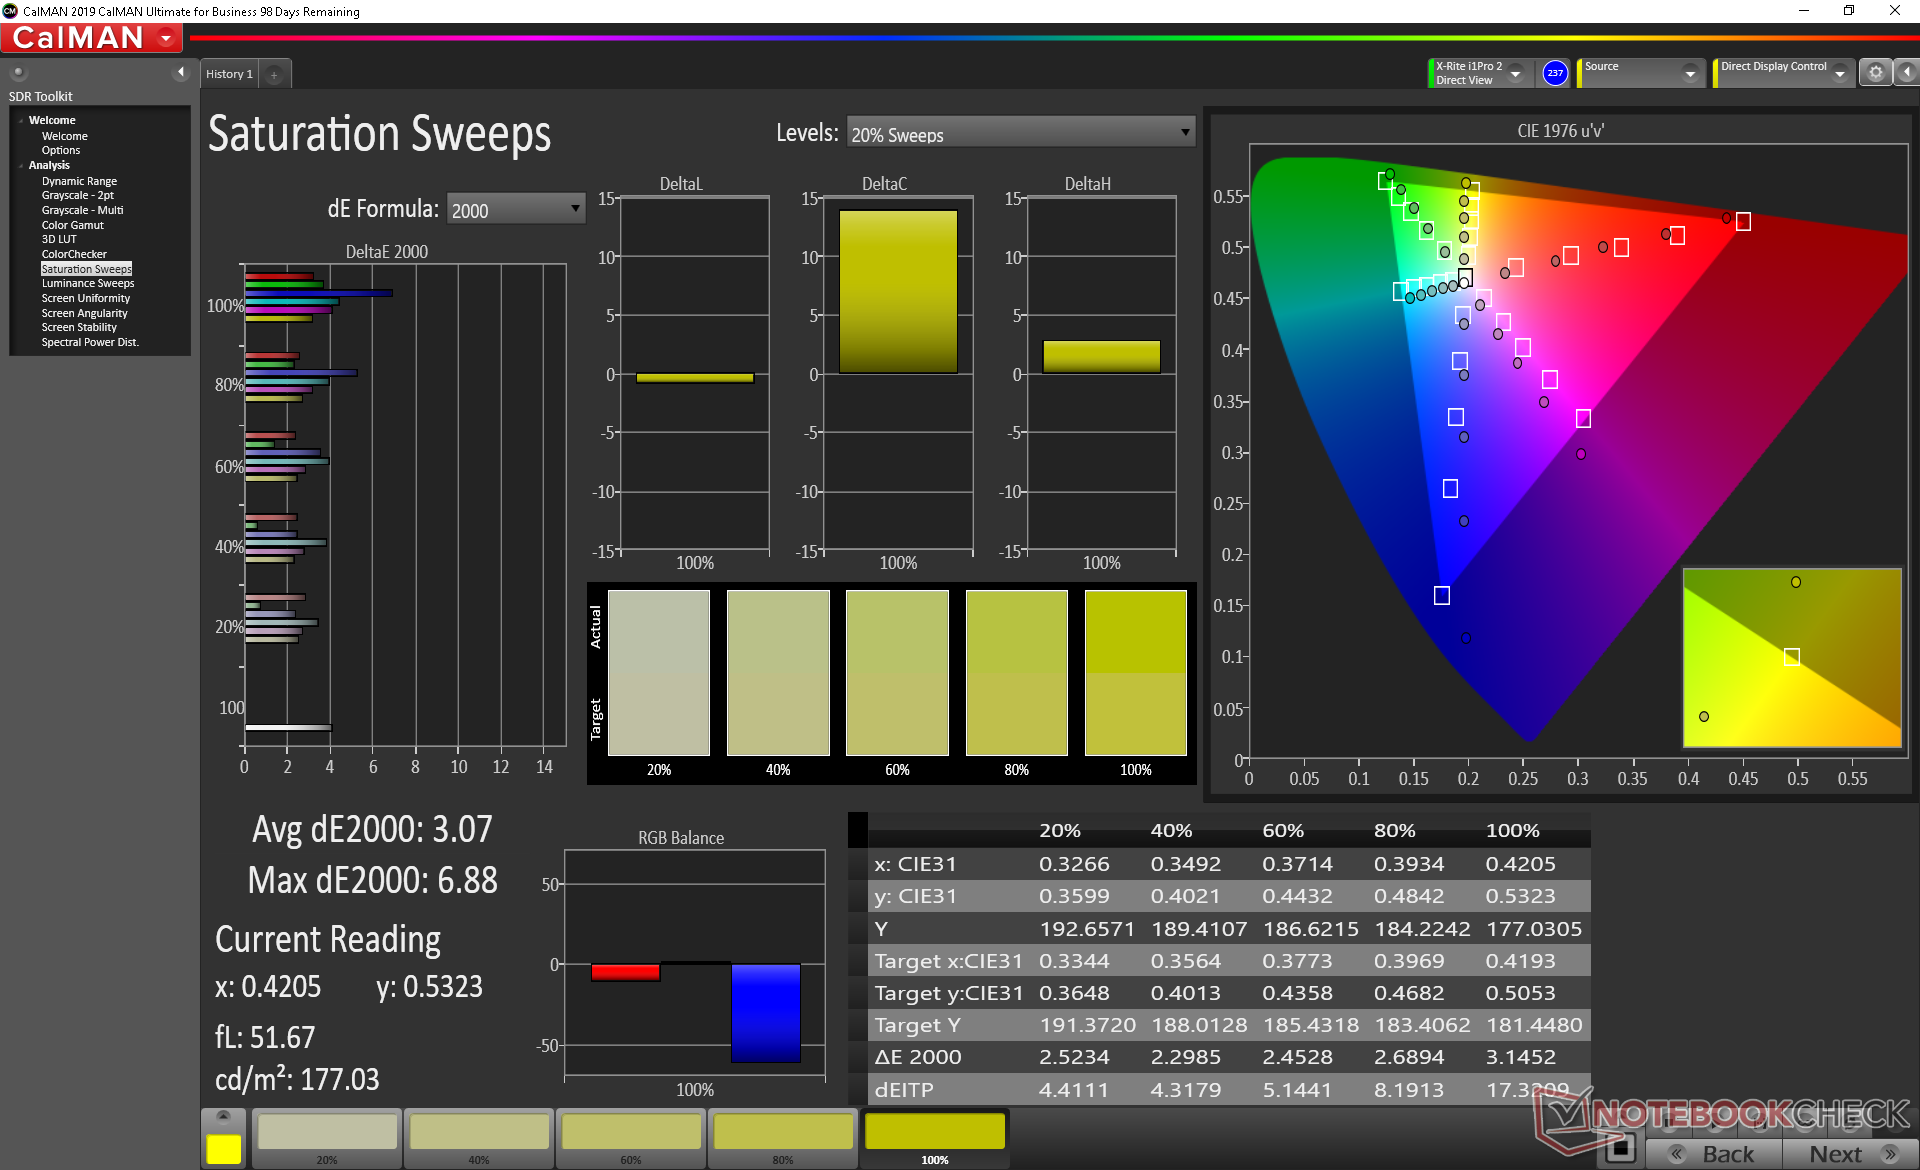
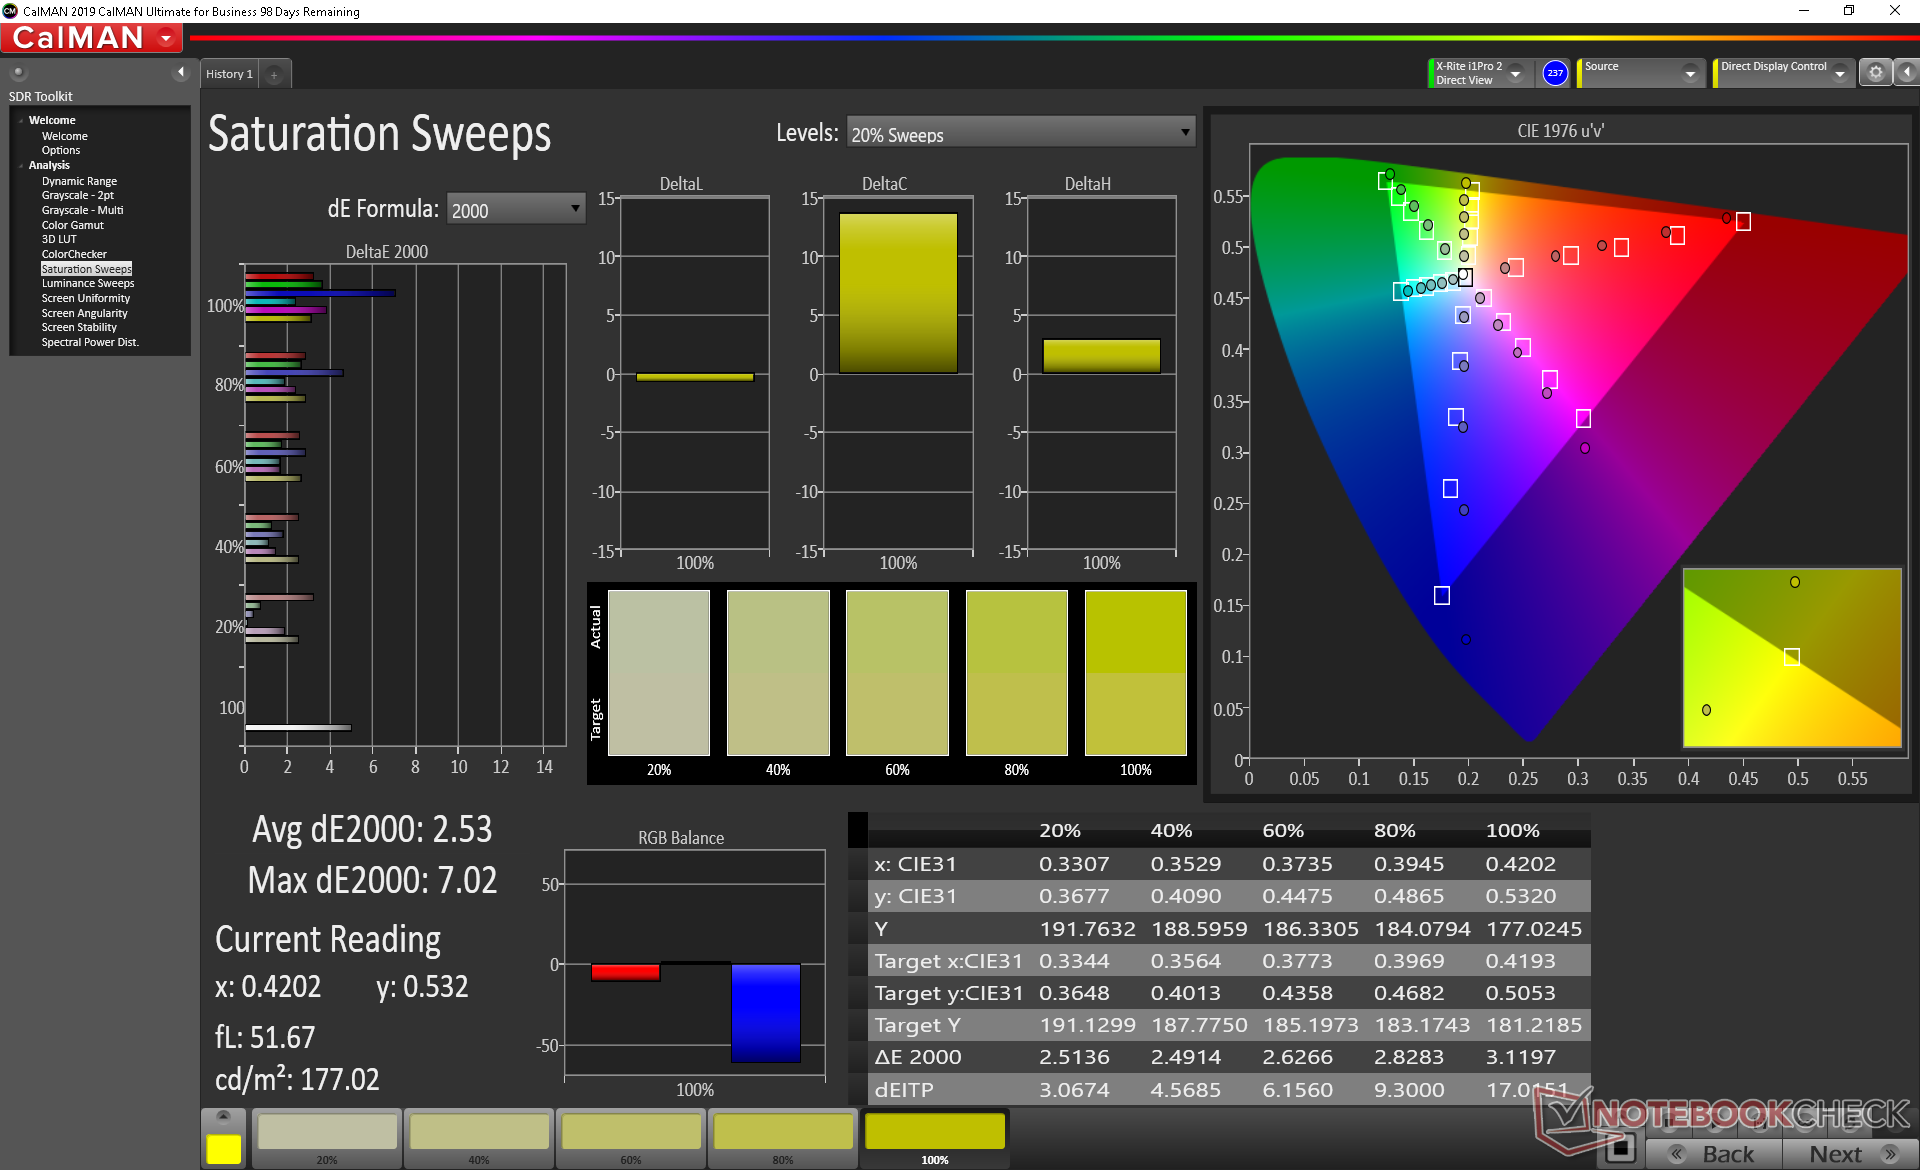
Lo spazio colore copre circa l'86% di sRGB, il che rappresenta un miglioramento rispetto al WS63 dello scorso anno, ma è ancora inferiore alla copertura del 100% offerta dalla maggior parte delle altre workstations mobili. Qui non sono disponibili opzioni OLED che avrebbero garantito la copertura DCI-P3.
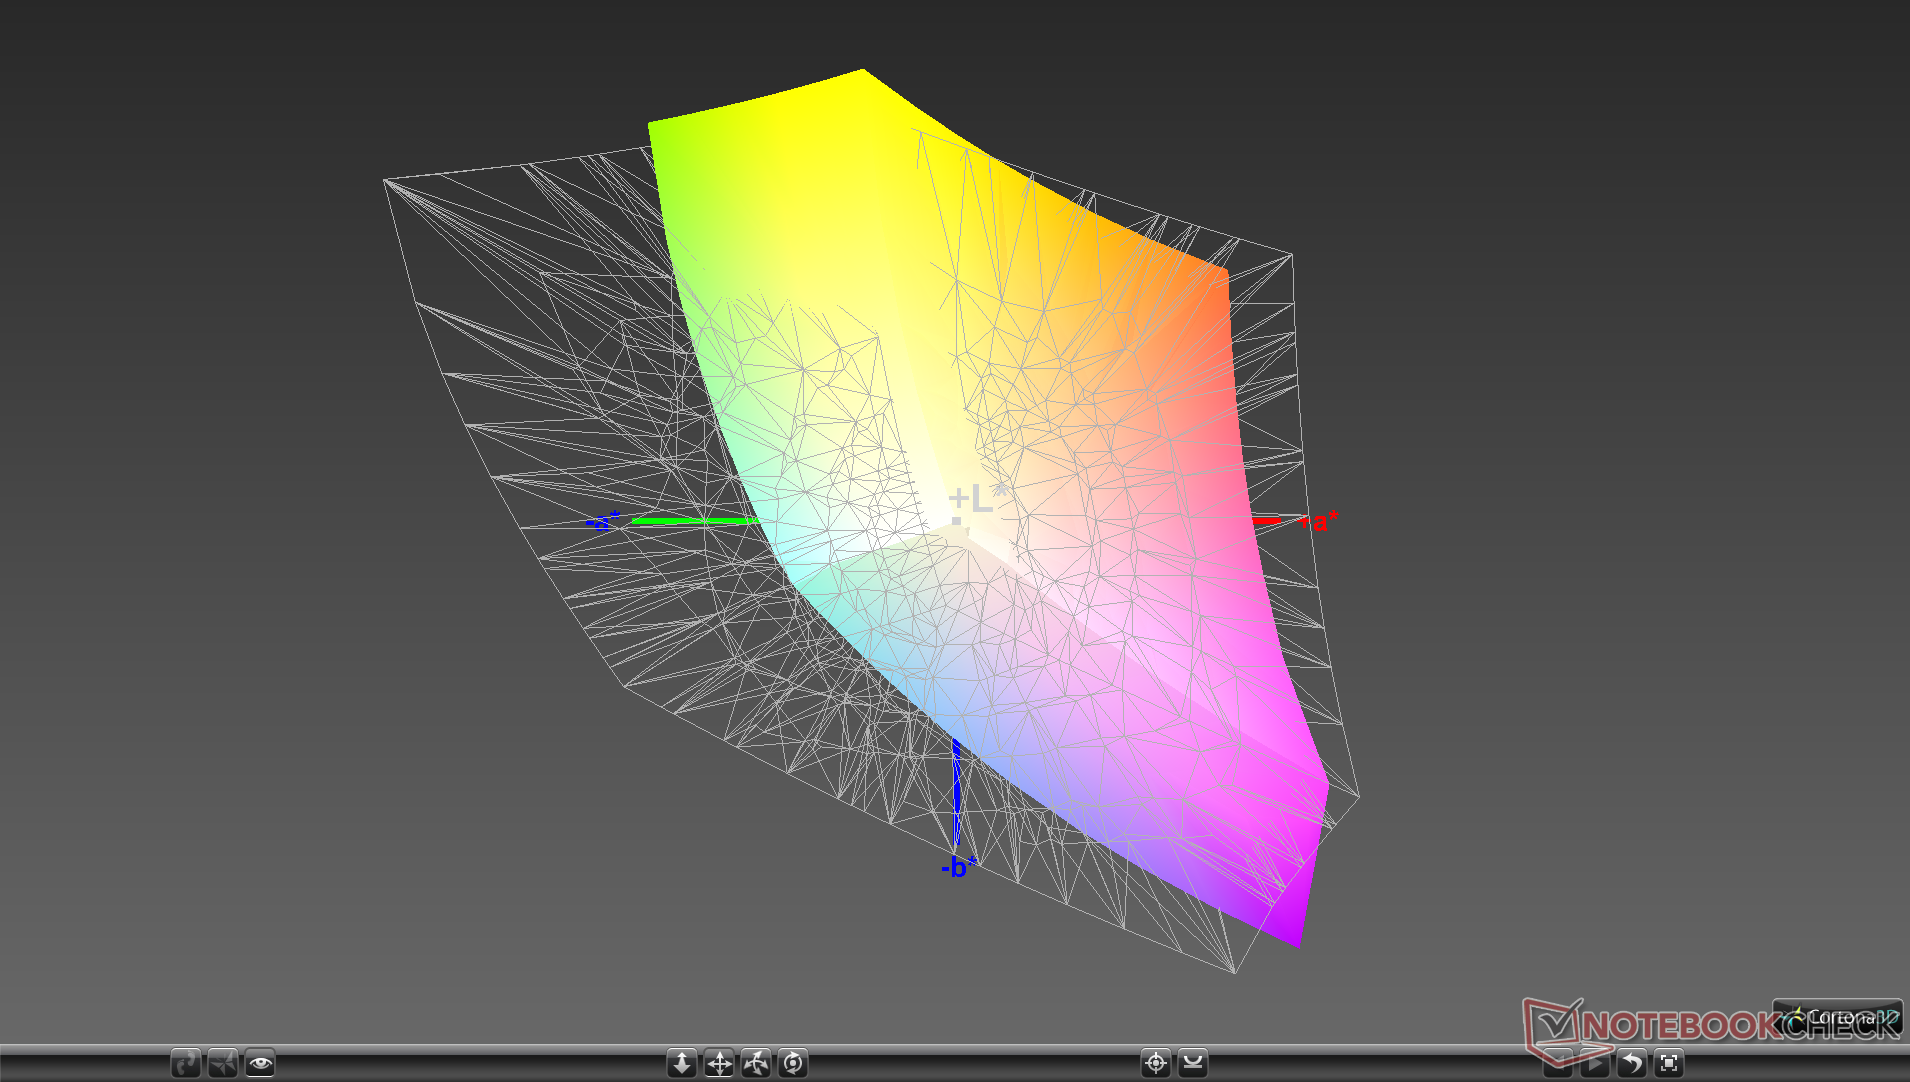
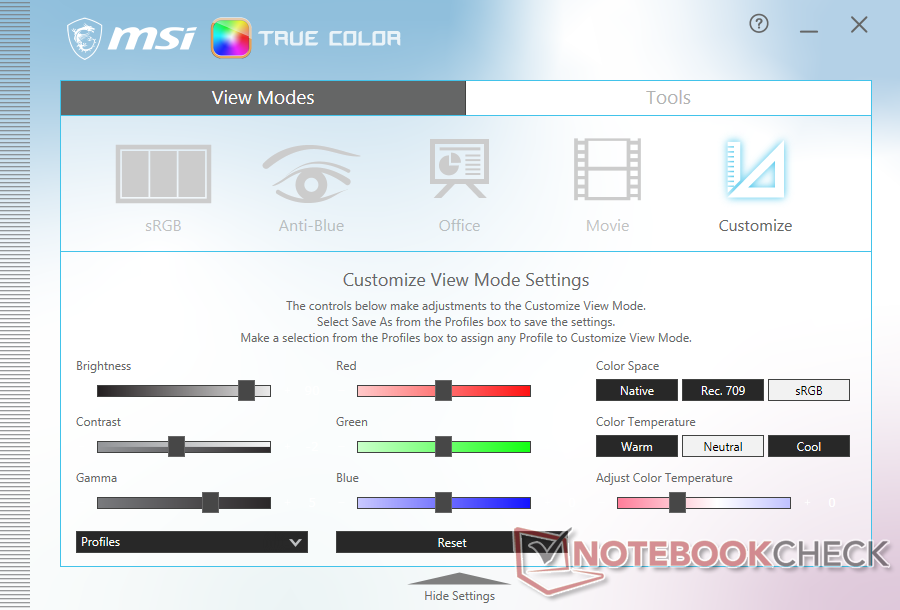
Le misurazioni del colorimetro X-Rite mostrano un display ben calibrato, come pubblicizzato da MSI. La temperatura del colore tende leggermente verso il freddo, ma questo può essere risolto con una calibrazione dell'utente finale.
Tempi di risposta del Display
| ↔ Tempi di risposta dal Nero al Bianco | ||
|---|---|---|
| 28.8 ms ... aumenta ↗ e diminuisce ↘ combinato | ↗ 17.2 ms Incremento | 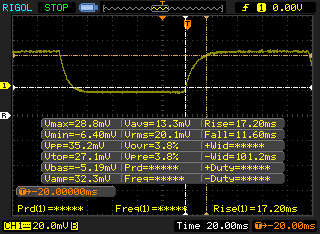 |
| ↘ 11.6 ms Calo | ||
| Lo schermo mostra tempi di risposta relativamente lenti nei nostri tests e potrebbe essere troppo lento per i gamers. In confronto, tutti i dispositivi di test variano da 0.1 (minimo) a 240 (massimo) ms. » 76 % di tutti i dispositivi è migliore. Questo significa che i tempi di risposta rilevati sono peggiori rispetto alla media di tutti i dispositivi testati (19.8 ms). | ||
| ↔ Tempo di risposta dal 50% Grigio all'80% Grigio | ||
| 44.8 ms ... aumenta ↗ e diminuisce ↘ combinato | ↗ 21.2 ms Incremento | 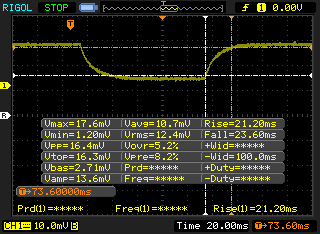 |
| ↘ 23.6 ms Calo | ||
| Lo schermo mostra tempi di risposta lenti nei nostri tests e sarà insoddisfacente per i gamers. In confronto, tutti i dispositivi di test variano da 0.165 (minimo) a 636 (massimo) ms. » 76 % di tutti i dispositivi è migliore. Questo significa che i tempi di risposta rilevati sono peggiori rispetto alla media di tutti i dispositivi testati (31 ms). | ||
Sfarfallio dello schermo / PWM (Pulse-Width Modulation)
| flickering dello schermo / PWM non rilevato | 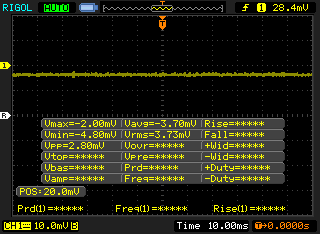 | ||
In confronto: 52 % di tutti i dispositivi testati non utilizza PWM per ridurre la luminosita' del display. Se è rilevato PWM, una media di 7772 (minimo: 5 - massimo: 343500) Hz è stata rilevata. | |||
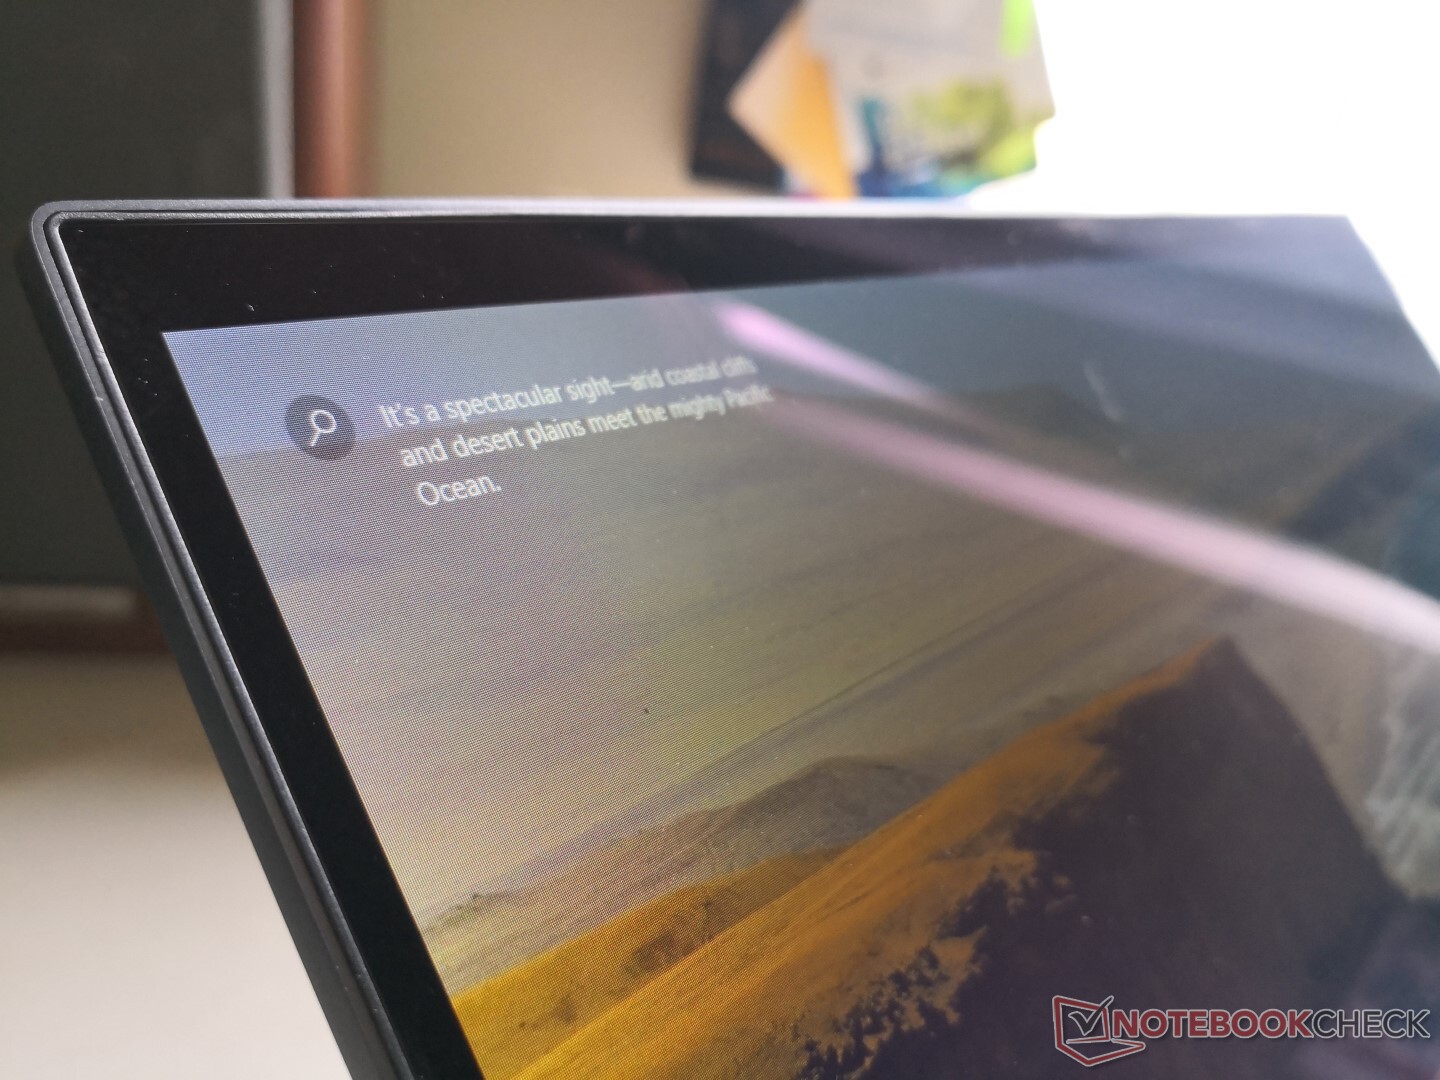
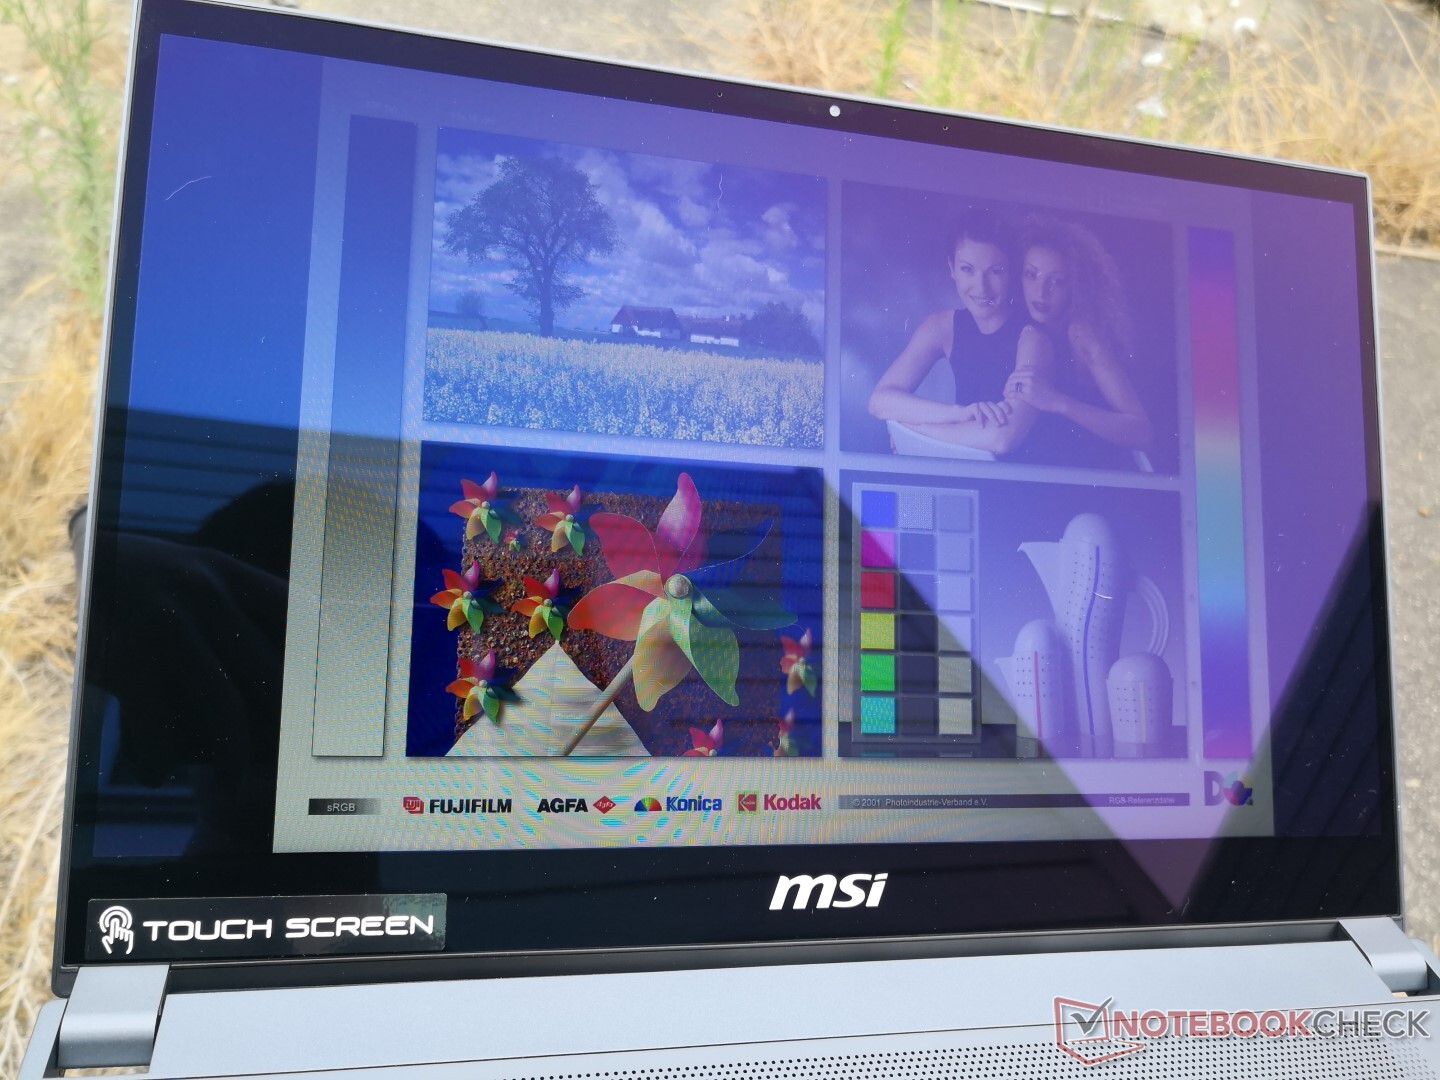
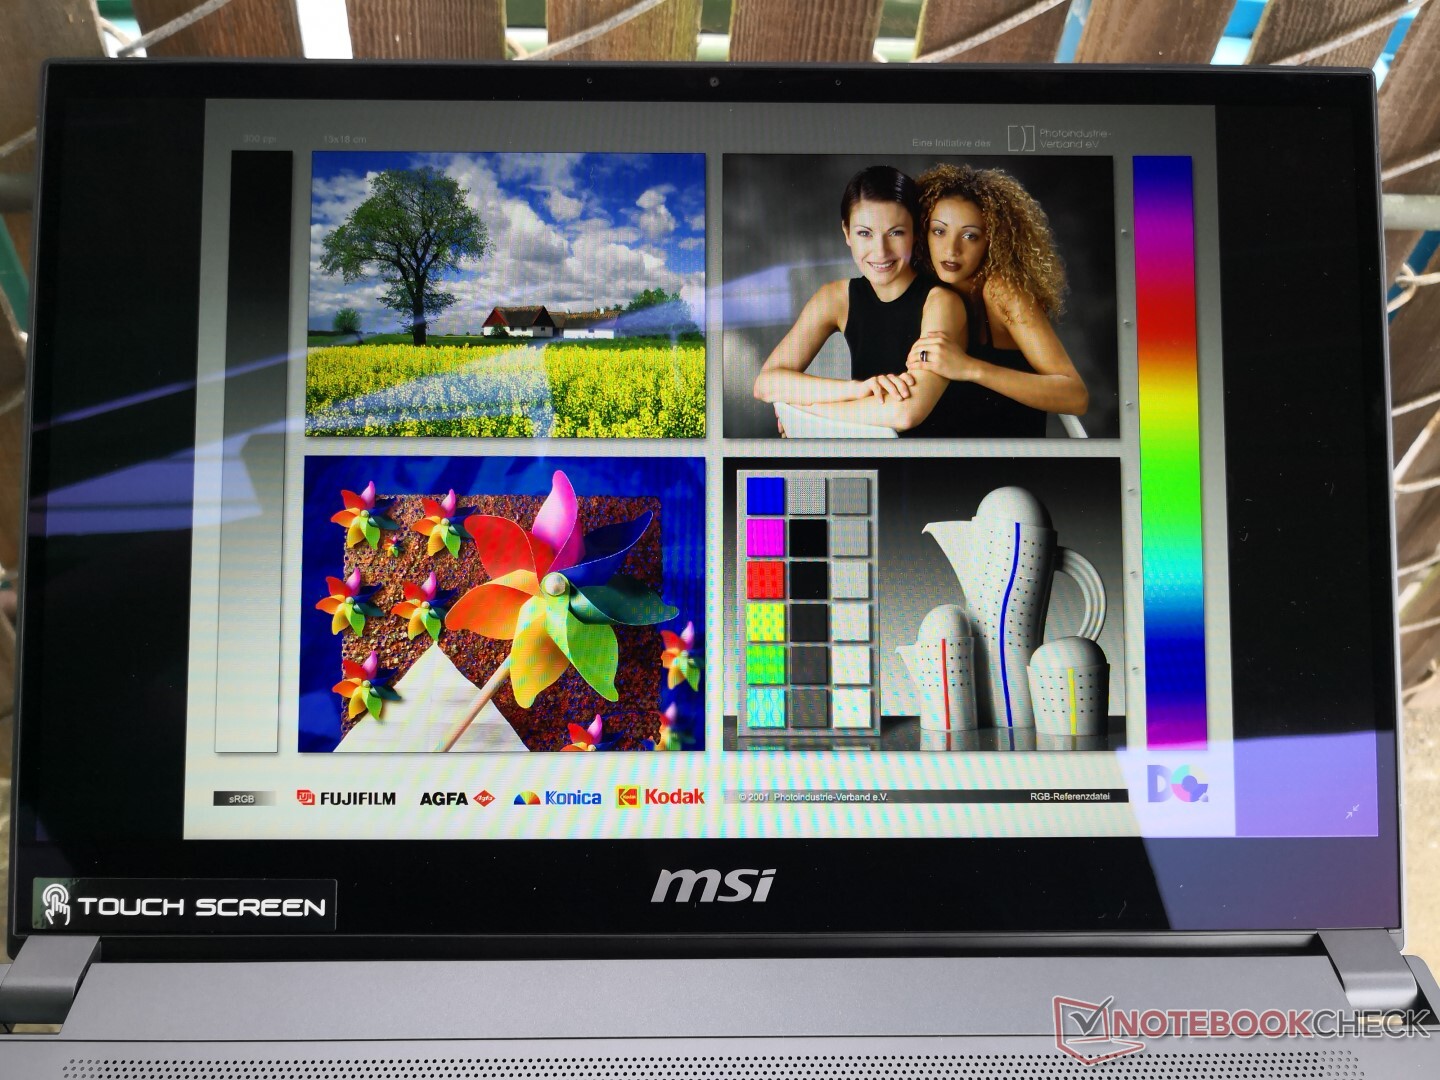
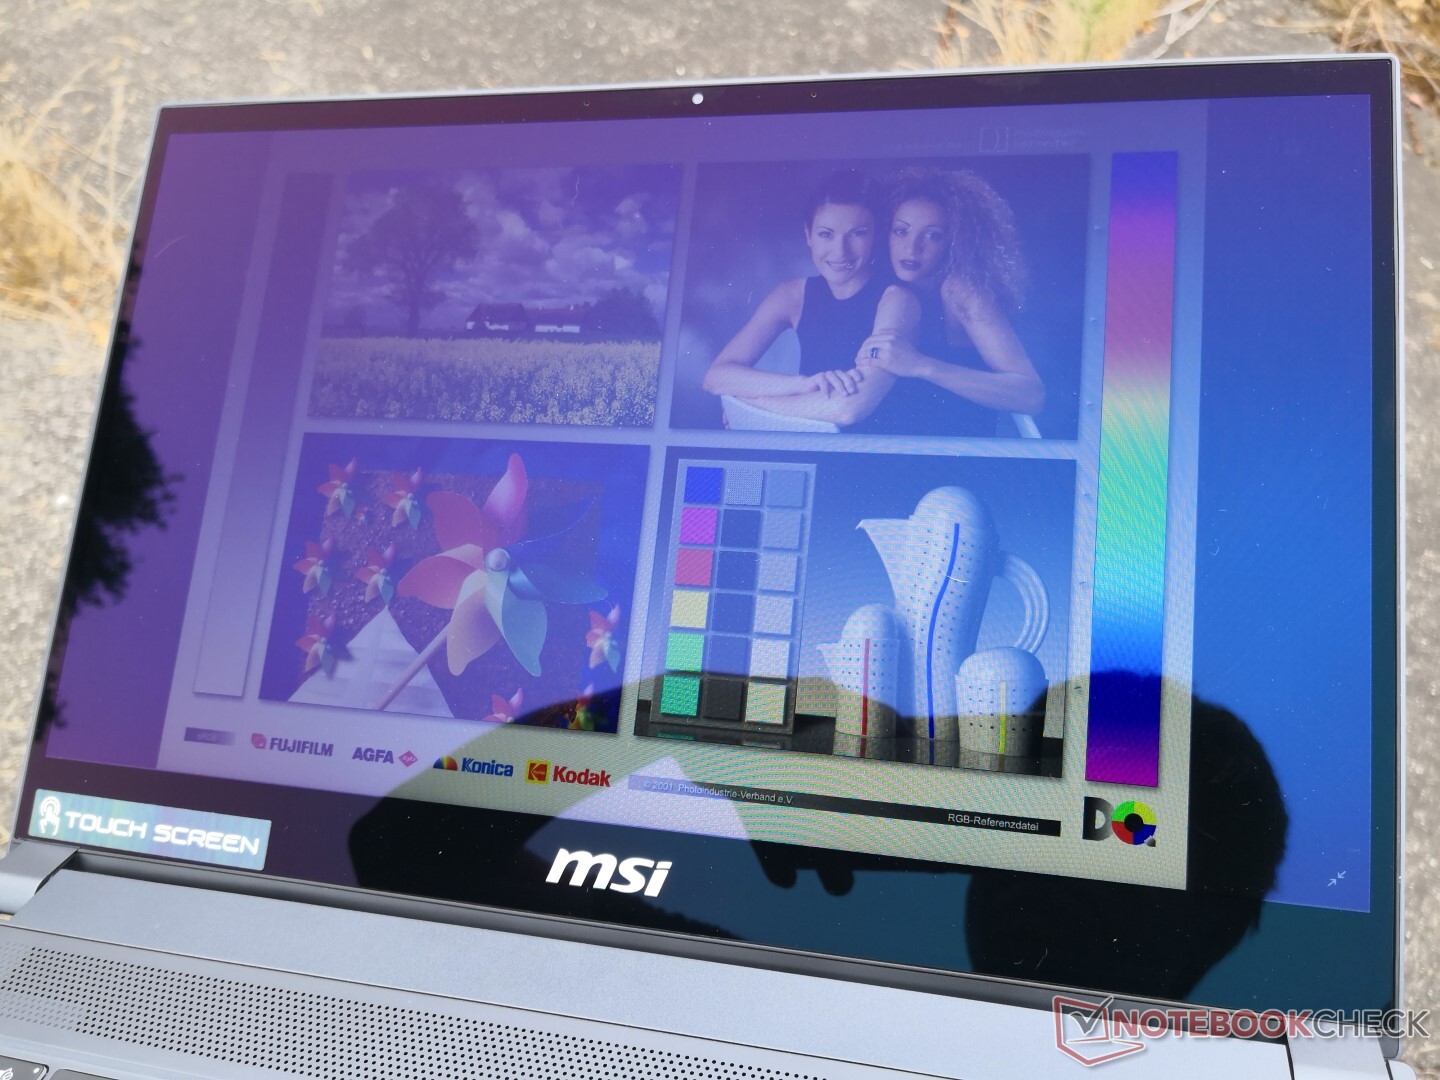
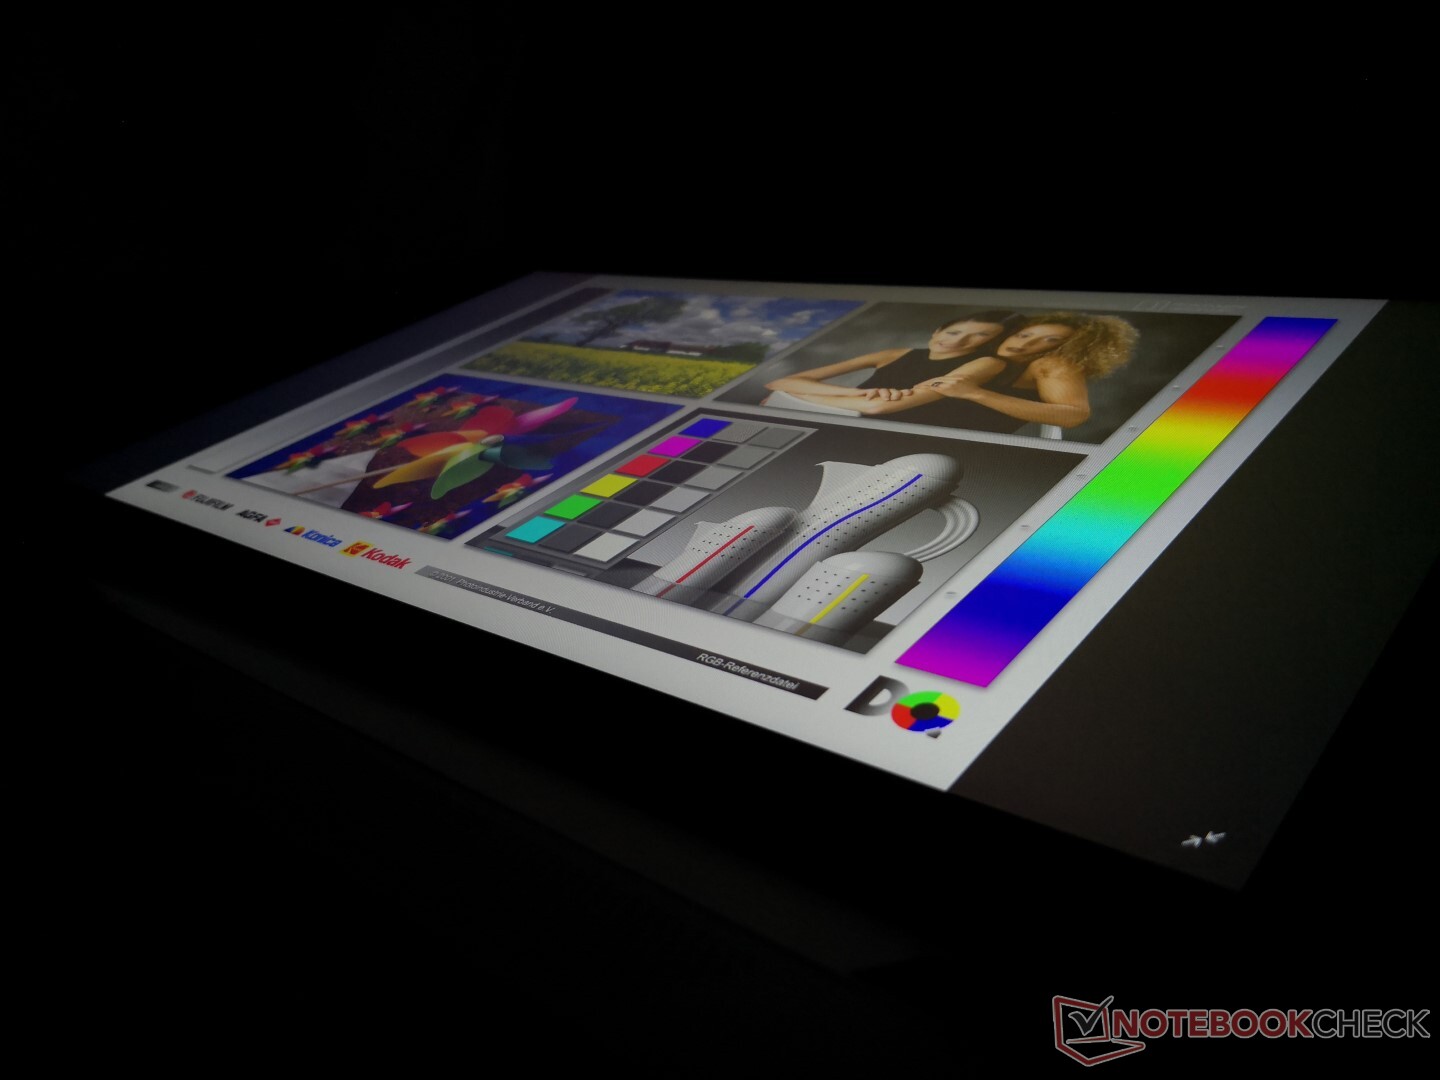
La visibilità all'aperto è discreta quando i si trova all'ombra. In caso contrario, l'illuminazione dell'ambiente è molto intensa e causa riflessi. Il pannello lucido mostra un leggero riflesso violaceo, a differenza della maggior parte degli altri computer portatili, che influenza i colori se si guarda da un angolo.

Prestazioni
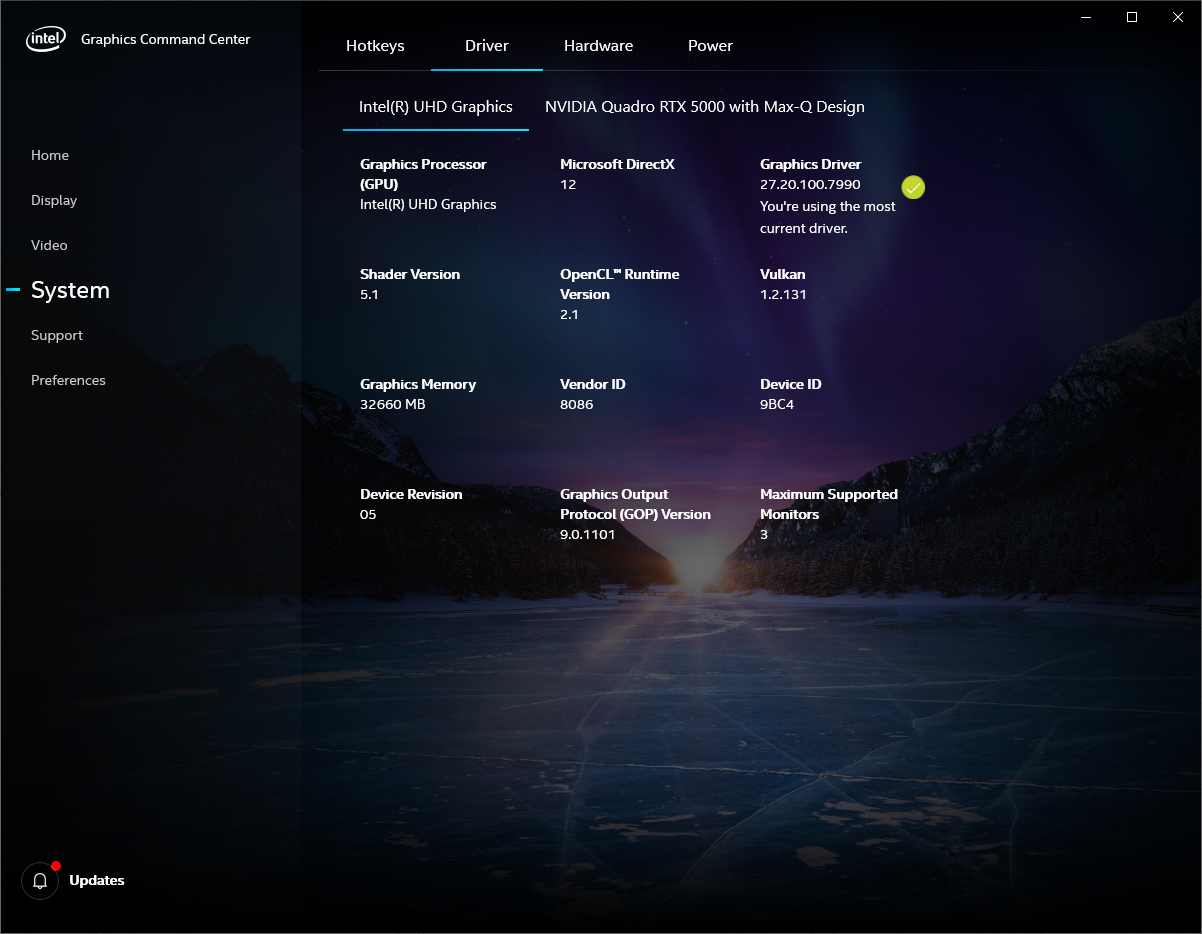
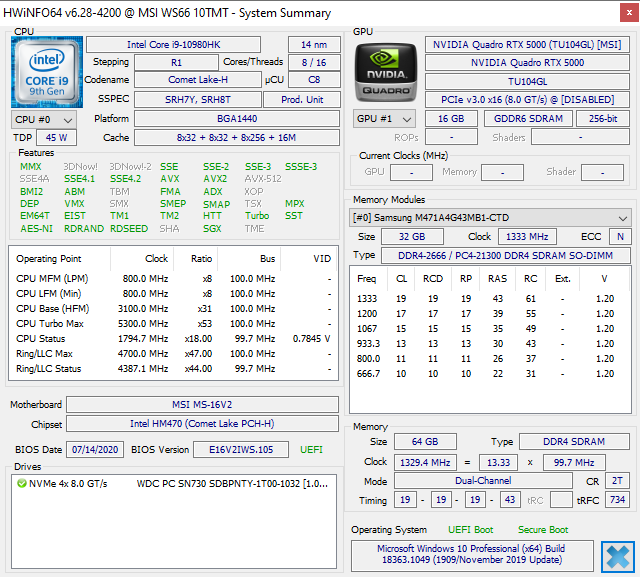
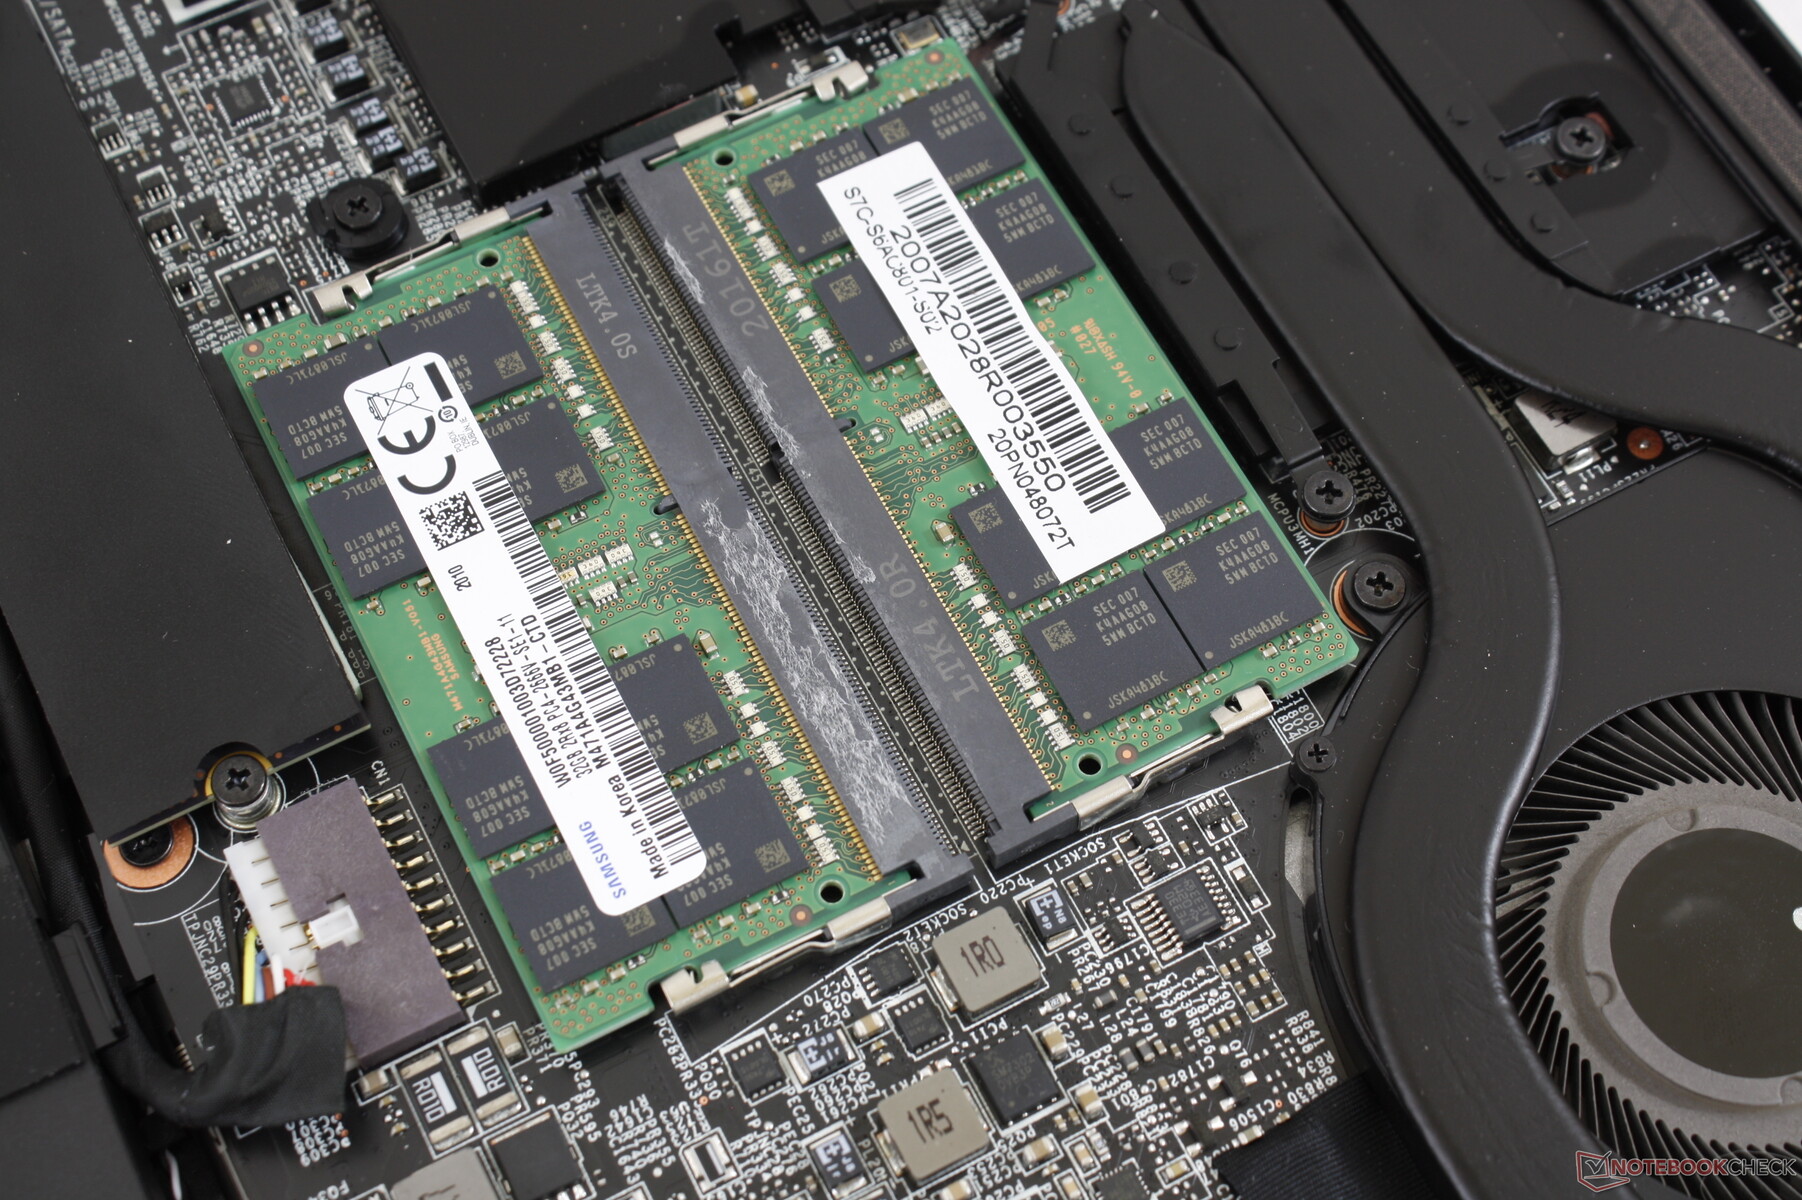
A differenza del Razer Blade 15 Studio che è fissato al Core i7-10875H, il WS66 offre opzioni Xeon e Core i9 per il supporto della RAM ECC e una più veloce potenza di calcolo grezza, rispettivamente. La RAM è configurabile fino a 64 GB rispetto ai 128 GB di una workstation full-size come la Dell Precision 7550. Optimus è fornito di serie per lo switching automatico della grafica.
Abbiamo utilizzato il profilo di potenza Ultra Performance di MSI con Cooler Boost attivo per eseguire i benchmarks delle prestazioni riportati di seguito per ottenere i punteggi più alti possibili.
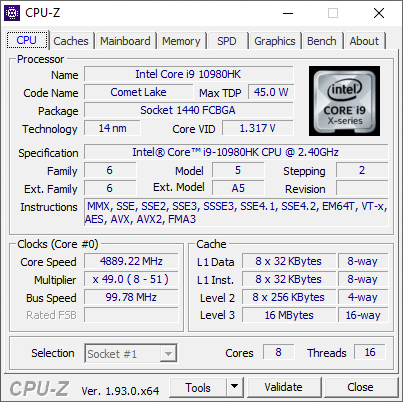
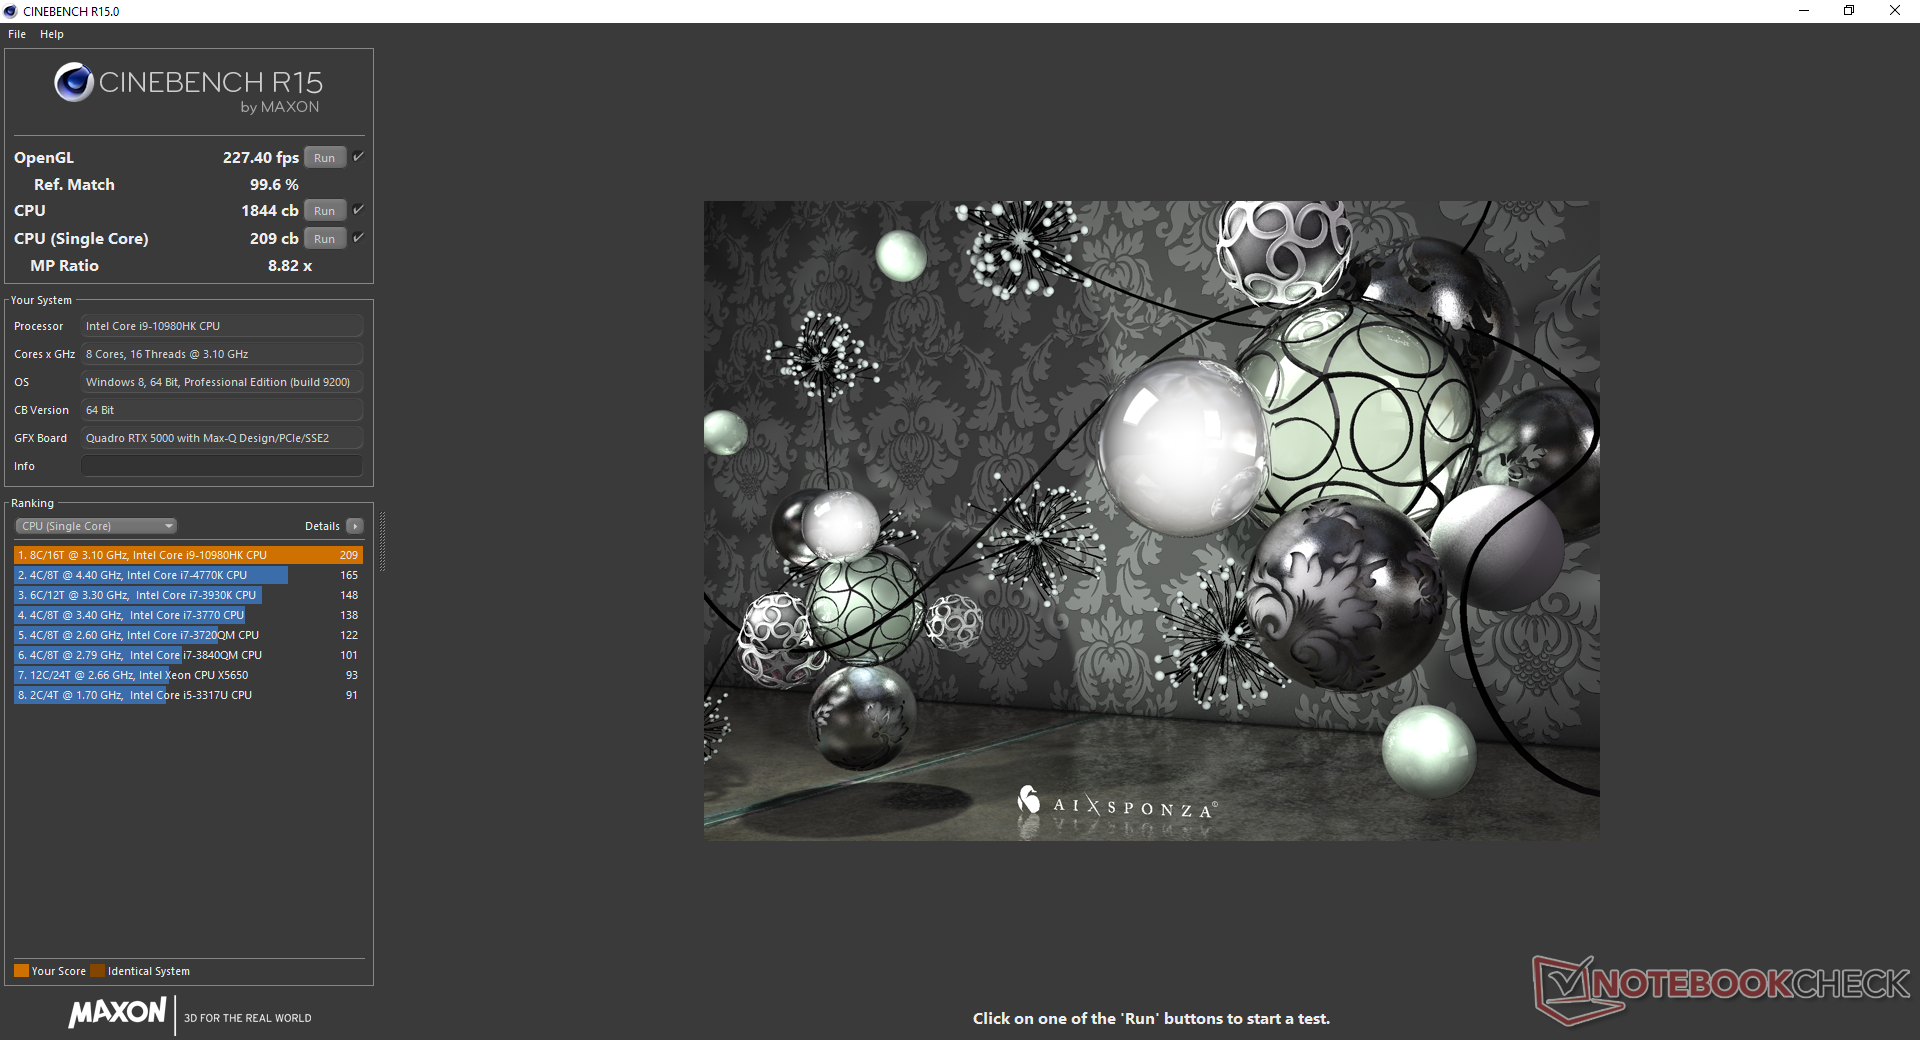
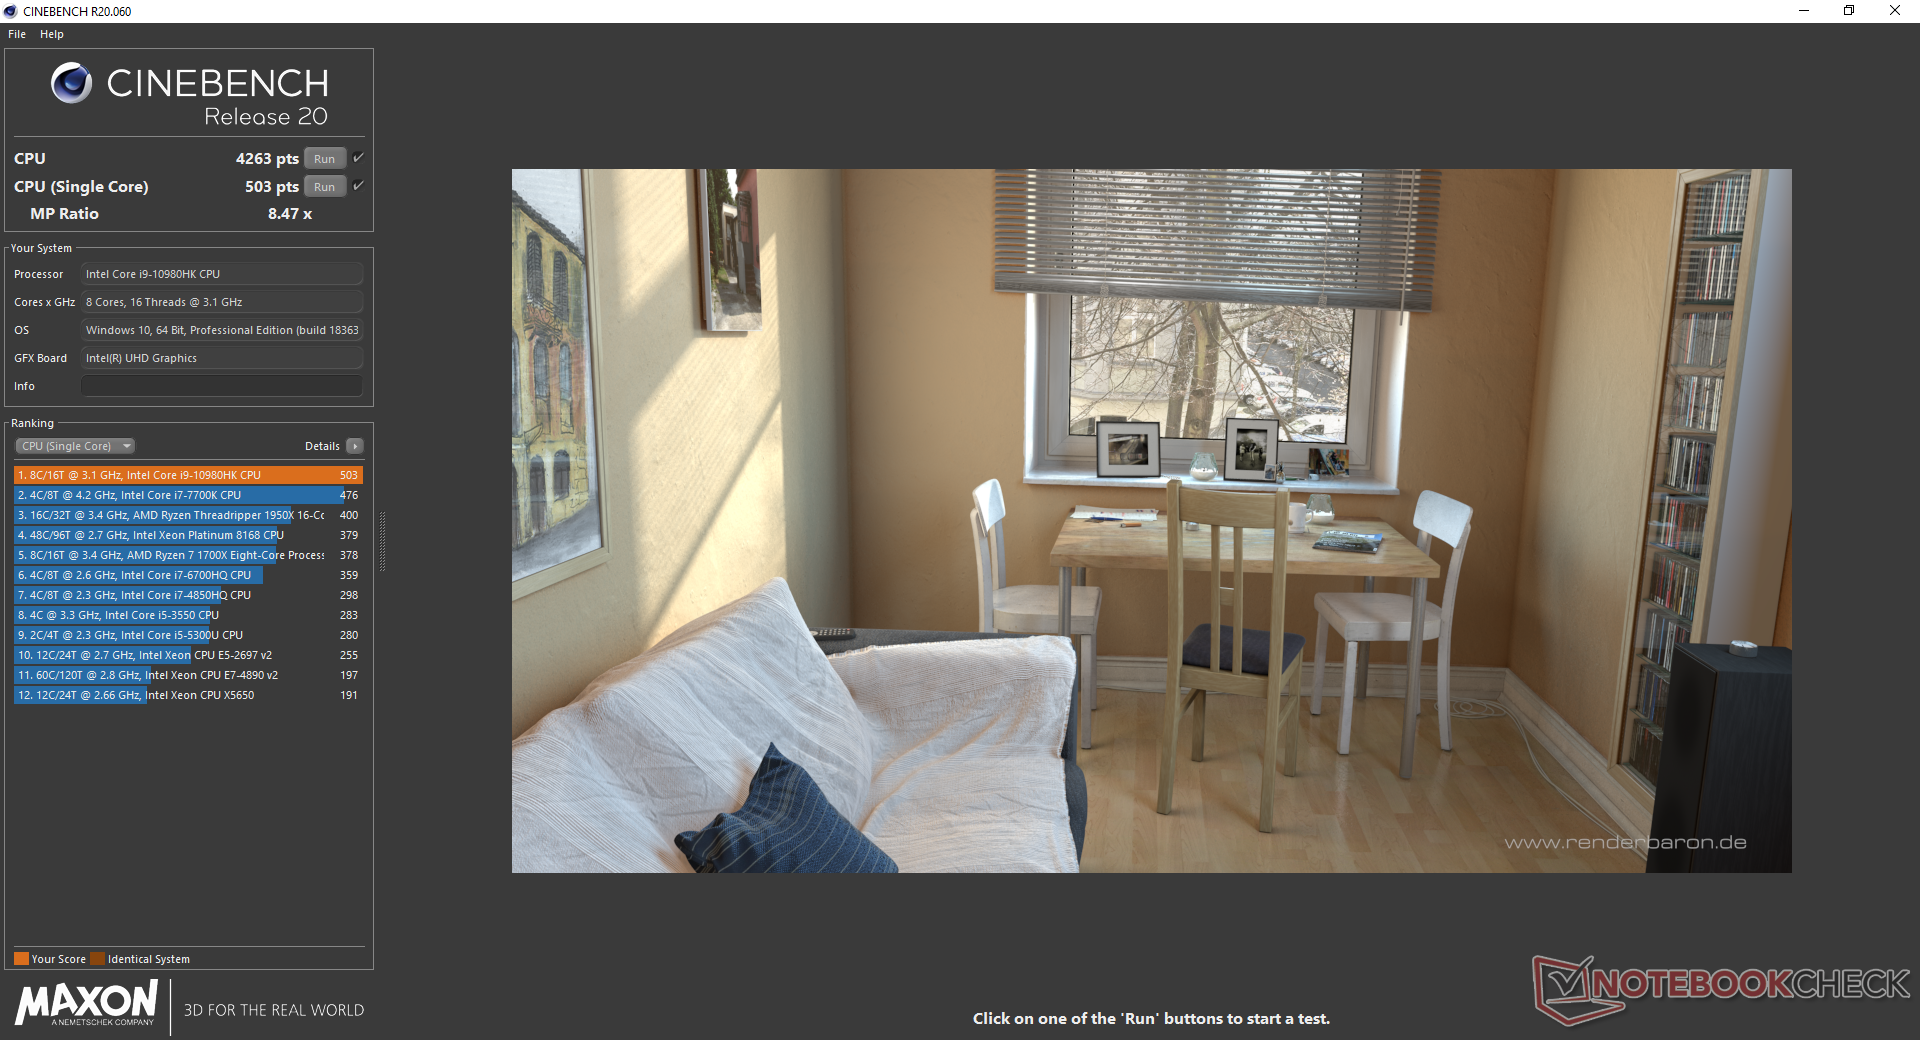
Processore
Le prestazioni della CPU sono eccellenti con i punteggi di CineBench Multi-Thread che sono dal 25 al 30% superiori a quelli del Core i7-10875H sottoperformante nel Razer Blade 15 Studio. Anche la sostenibilità delle prestazioni è rispettabile, con un calo del 10% nel tempo, come dimostra il grafico del loop CineBench R15 xT riportato di seguito. La configurazione con una CPU Intel Xeon comporterà un leggero rallentamento delle prestazioni del processore, ma con l'ulteriore vantaggio della RAM ECC.
Consultate la nostra pagina sul Core i9-10980HK per maggiori informazioni tecniche e benchmarks di confronto.
Cinebench R15: CPU Single 64Bit | CPU Multi 64Bit
Blender: v2.79 BMW27 CPU
7-Zip 18.03: 7z b 4 -mmt1 | 7z b 4
Geekbench 5.5: Single-Core | Multi-Core
HWBOT x265 Benchmark v2.2: 4k Preset
LibreOffice : 20 Documents To PDF
R Benchmark 2.5: Overall mean
| Cinebench R20 / CPU (Multi Core) | |
| Intel Core i9-9900KS, Nvidia Titan RTX | |
| Eluktronics RP-15 | |
| MSI WS66 10TMT-207US | |
| Media Intel Core i9-10980HK (3526 - 4487, n=13) | |
| Dell Precision 7550 | |
| Dell Precision 5550 P91F | |
| Razer Blade 15 RTX 2070 Super Max-Q | |
| HP Envy 15-ep0098nr | |
| Acer ConceptD 9 Pro | |
| Acer ConceptD 3 Pro CN315-71P-73W1 | |
| Cinebench R20 / CPU (Single Core) | |
| Intel Core i9-9900KS, Nvidia Titan RTX | |
| Acer ConceptD 9 Pro | |
| MSI WS66 10TMT-207US | |
| Dell Precision 5550 P91F | |
| Eluktronics RP-15 | |
| Razer Blade 15 RTX 2070 Super Max-Q | |
| Dell Precision 7550 | |
| Media Intel Core i9-10980HK (465 - 507, n=13) | |
| Acer ConceptD 3 Pro CN315-71P-73W1 | |
| HP Envy 15-ep0098nr | |
| Cinebench R15 / CPU Single 64Bit | |
| Intel Core i9-9900KS, Nvidia Titan RTX | |
| MSI WS66 10TMT-207US | |
| Dell Precision 7550 | |
| Media Intel Core i9-10980HK (198 - 219, n=15) | |
| Dell Precision 5550 P91F | |
| Razer Blade 15 RTX 2070 Super Max-Q | |
| Acer ConceptD 9 Pro | |
| HP Envy 15-ep0098nr | |
| Eluktronics RP-15 | |
| Acer ConceptD 3 Pro CN315-71P-73W1 | |
| Cinebench R15 / CPU Multi 64Bit | |
| Intel Core i9-9900KS, Nvidia Titan RTX | |
| Eluktronics RP-15 | |
| Media Intel Core i9-10980HK (1606 - 1862, n=15) | |
| MSI WS66 10TMT-207US | |
| Dell Precision 7550 | |
| Acer ConceptD 9 Pro | |
| Dell Precision 5550 P91F | |
| Razer Blade 15 RTX 2070 Super Max-Q | |
| HP Envy 15-ep0098nr | |
| Acer ConceptD 3 Pro CN315-71P-73W1 | |
| Blender / v2.79 BMW27 CPU | |
| Acer ConceptD 3 Pro CN315-71P-73W1 | |
| HP Envy 15-ep0098nr | |
| Dell Precision 5550 P91F | |
| Razer Blade 15 RTX 2070 Super Max-Q | |
| Dell Precision 7550 | |
| Media Intel Core i9-10980HK (239 - 299, n=13) | |
| MSI WS66 10TMT-207US | |
| Eluktronics RP-15 | |
| Intel Core i9-9900KS, Nvidia Titan RTX | |
| Geekbench 5.5 / Single-Core | |
| MSI WS66 10TMT-207US | |
| Media Intel Core i9-10980HK (1283 - 1401, n=12) | |
| Dell Precision 7550 | |
| Dell Precision 5550 P91F | |
| Acer ConceptD 9 Pro | |
| Razer Blade 15 RTX 2070 Super Max-Q | |
| HP Envy 15-ep0098nr | |
| Eluktronics RP-15 | |
| Acer ConceptD 3 Pro CN315-71P-73W1 | |
| Geekbench 5.5 / Multi-Core | |
| Eluktronics RP-15 | |
| Dell Precision 5550 P91F | |
| Dell Precision 7550 | |
| MSI WS66 10TMT-207US | |
| Media Intel Core i9-10980HK (7634 - 8666, n=12) | |
| Acer ConceptD 9 Pro | |
| Razer Blade 15 RTX 2070 Super Max-Q | |
| HP Envy 15-ep0098nr | |
| Acer ConceptD 3 Pro CN315-71P-73W1 | |
| HWBOT x265 Benchmark v2.2 / 4k Preset | |
| Intel Core i9-9900KS, Nvidia Titan RTX | |
| Eluktronics RP-15 | |
| Dell Precision 7550 | |
| MSI WS66 10TMT-207US | |
| Media Intel Core i9-10980HK (12 - 14.6, n=13) | |
| Razer Blade 15 RTX 2070 Super Max-Q | |
| Dell Precision 5550 P91F | |
| HP Envy 15-ep0098nr | |
| Acer ConceptD 3 Pro CN315-71P-73W1 | |
| LibreOffice / 20 Documents To PDF | |
| Eluktronics RP-15 | |
| Acer ConceptD 9 Pro | |
| Acer ConceptD 3 Pro CN315-71P-73W1 | |
| Media Intel Core i9-10980HK (44 - 89, n=13) | |
| HP Envy 15-ep0098nr | |
| Dell Precision 7550 | |
| Razer Blade 15 RTX 2070 Super Max-Q | |
| MSI WS66 10TMT-207US | |
| Dell Precision 5550 P91F | |
| R Benchmark 2.5 / Overall mean | |
| Acer ConceptD 3 Pro CN315-71P-73W1 | |
| HP Envy 15-ep0098nr | |
| Dell Precision 5550 P91F | |
| Razer Blade 15 RTX 2070 Super Max-Q | |
| Media Intel Core i9-10980HK (0.561 - 0.596, n=13) | |
| Eluktronics RP-15 | |
| MSI WS66 10TMT-207US | |
| Dell Precision 7550 | |
* ... Meglio usare valori piccoli
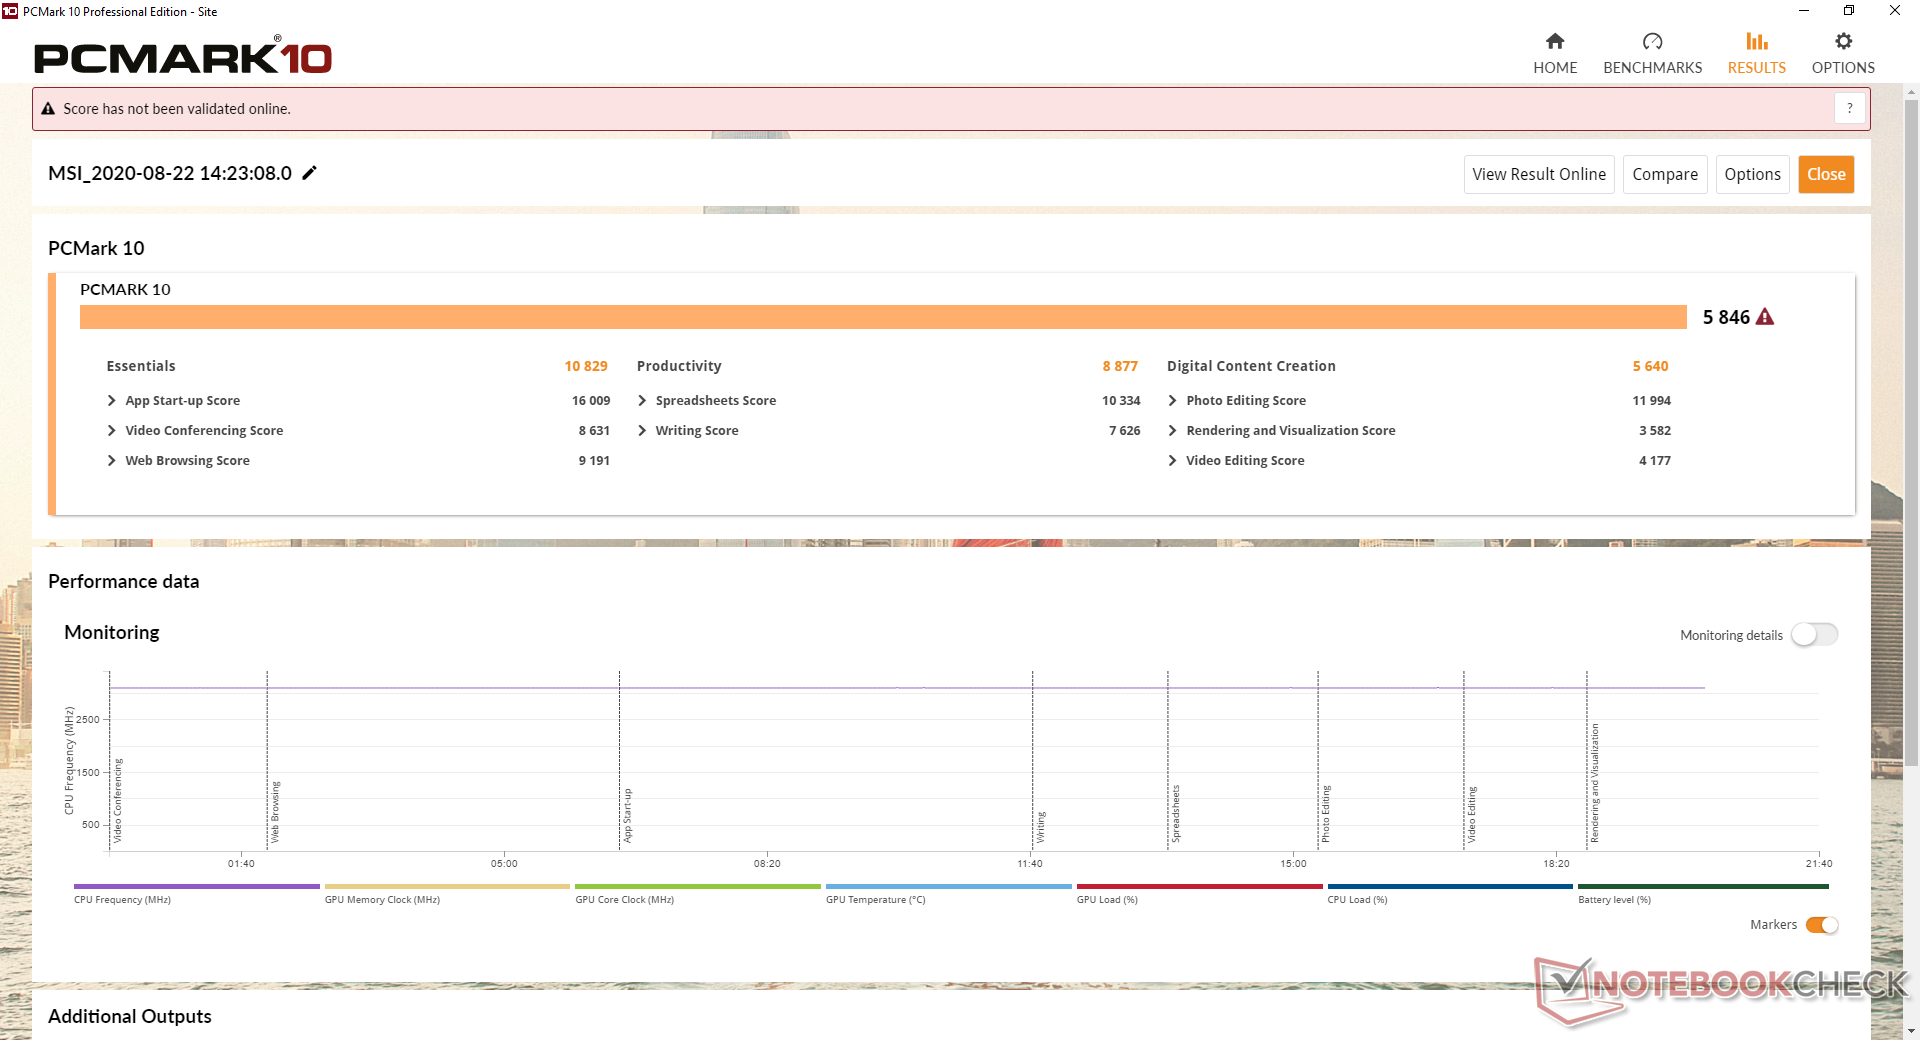
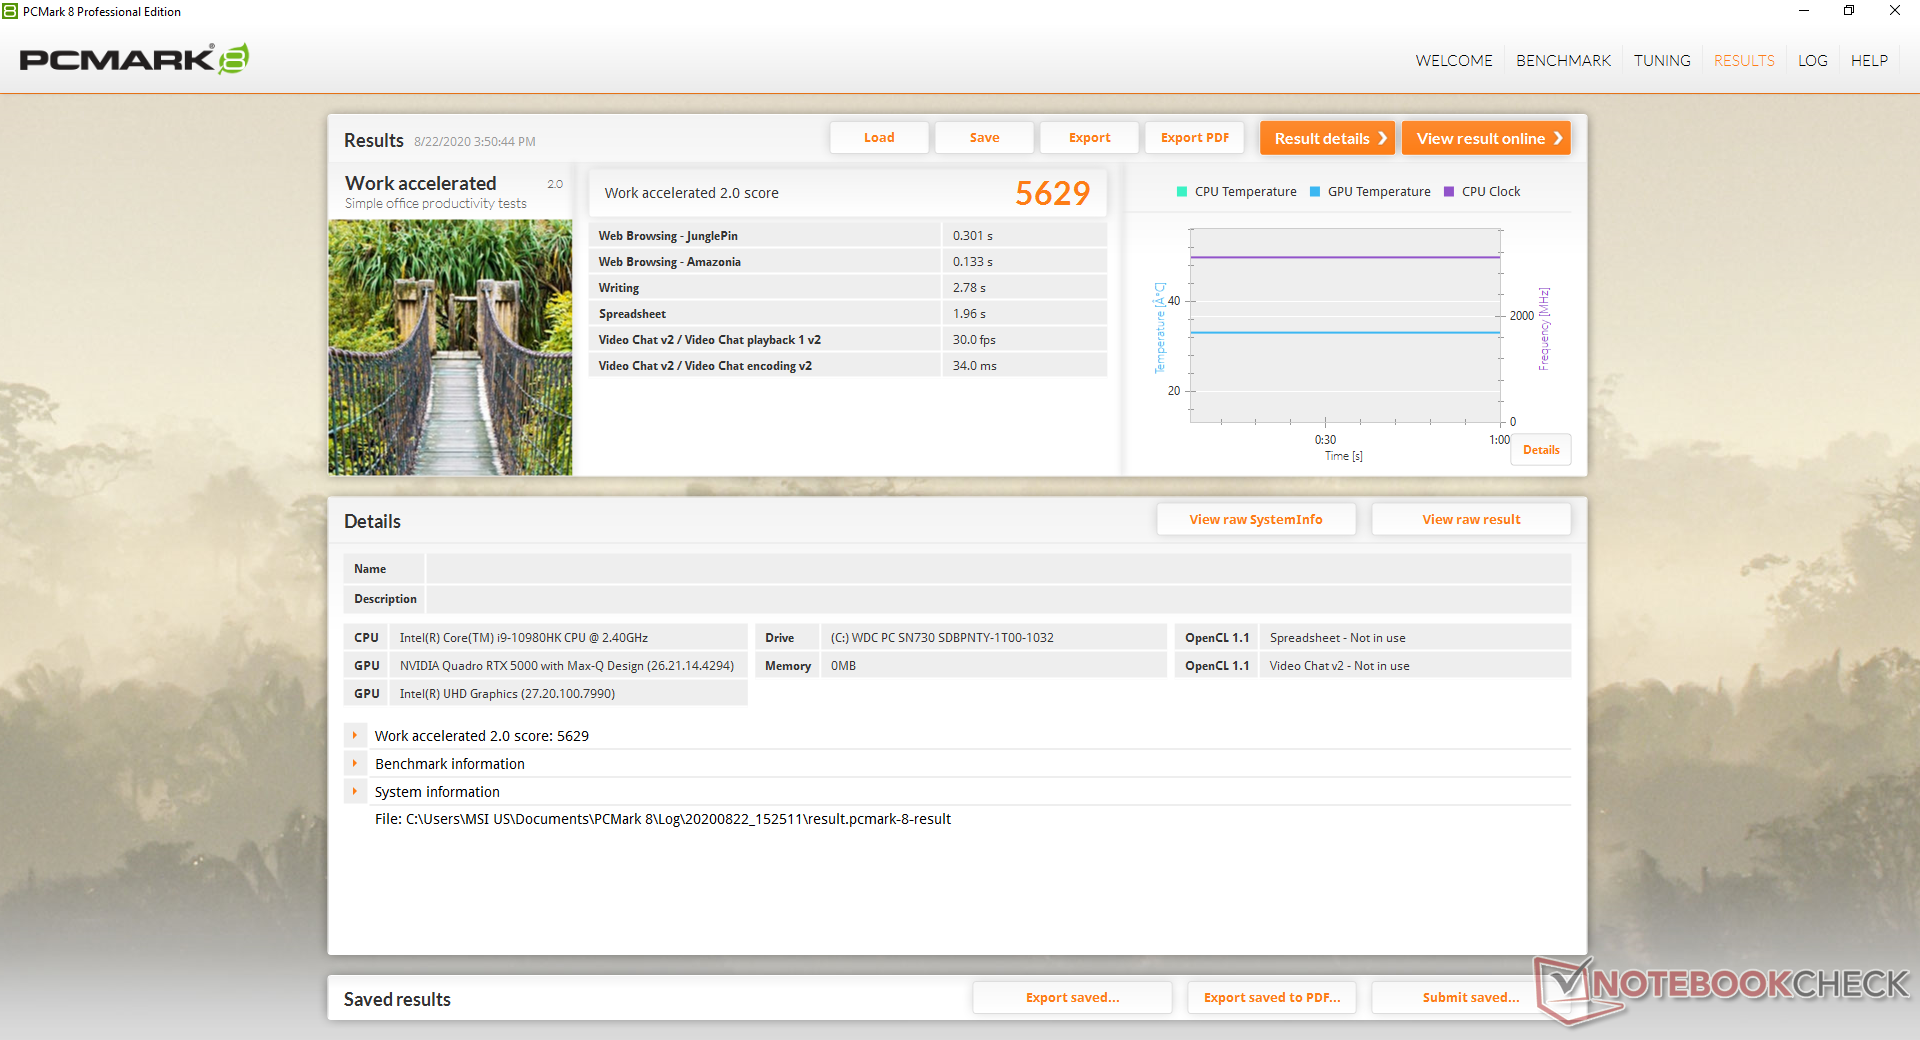
Prestazioni di sistema
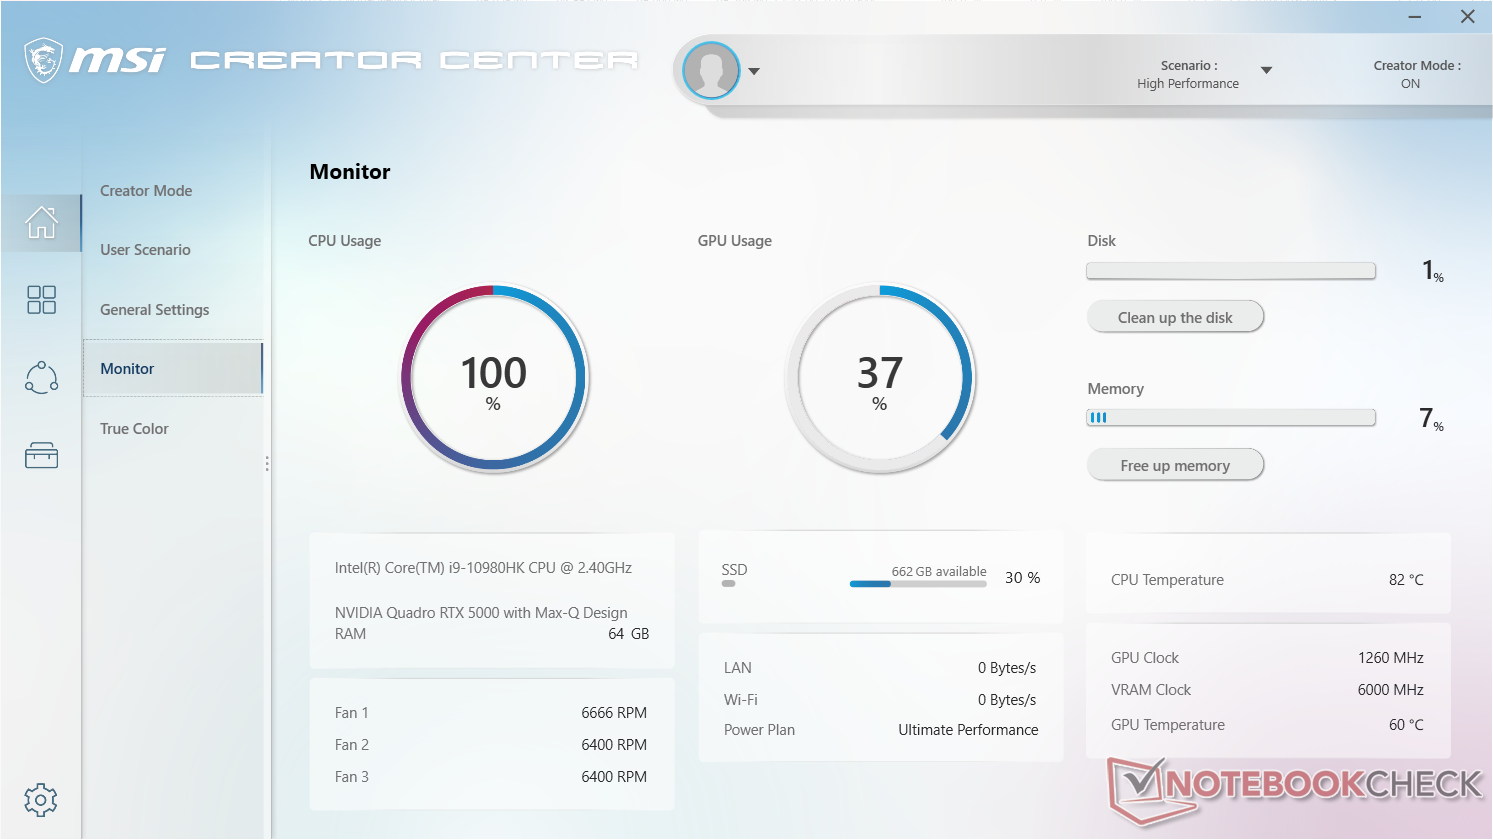
I risultati dei benchmarks PCMark sono costantemente in vantaggio rispetto al Razer Blade 15 Studio, probabilmente anche grazie alle prestazioni complessive della CPU più veloci di cui sopra. Non abbiamo riscontrato alcun problema di software durante il tempo trascorso con l'unità di test, ma raccomandiamo di familiarizzare con l'MSI Creator Center, dato che i controlli delle prestazioni e del rumore della ventola si gestiscono qui.
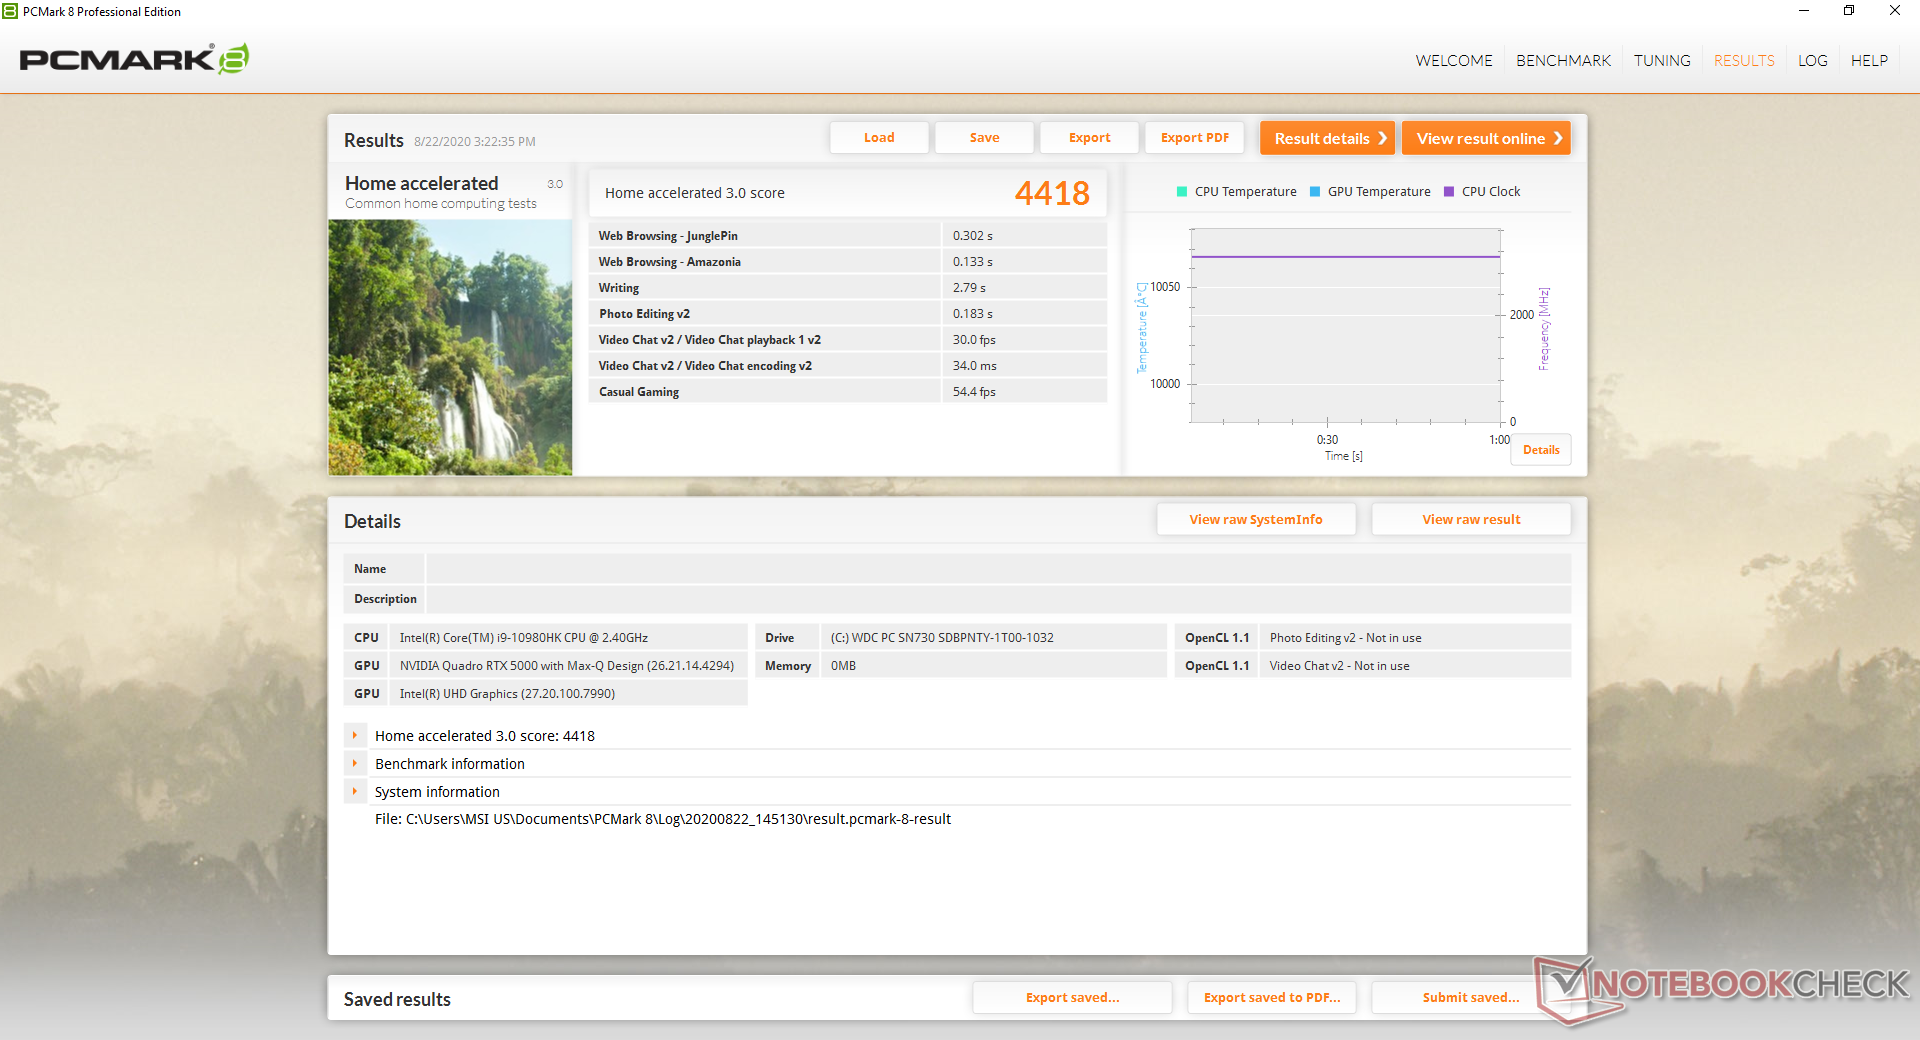
| PCMark 8 Home Score Accelerated v2 | 4418 punti | |
| PCMark 8 Work Score Accelerated v2 | 5629 punti | |
| PCMark 10 Score | 5846 punti | |
Aiuto | ||
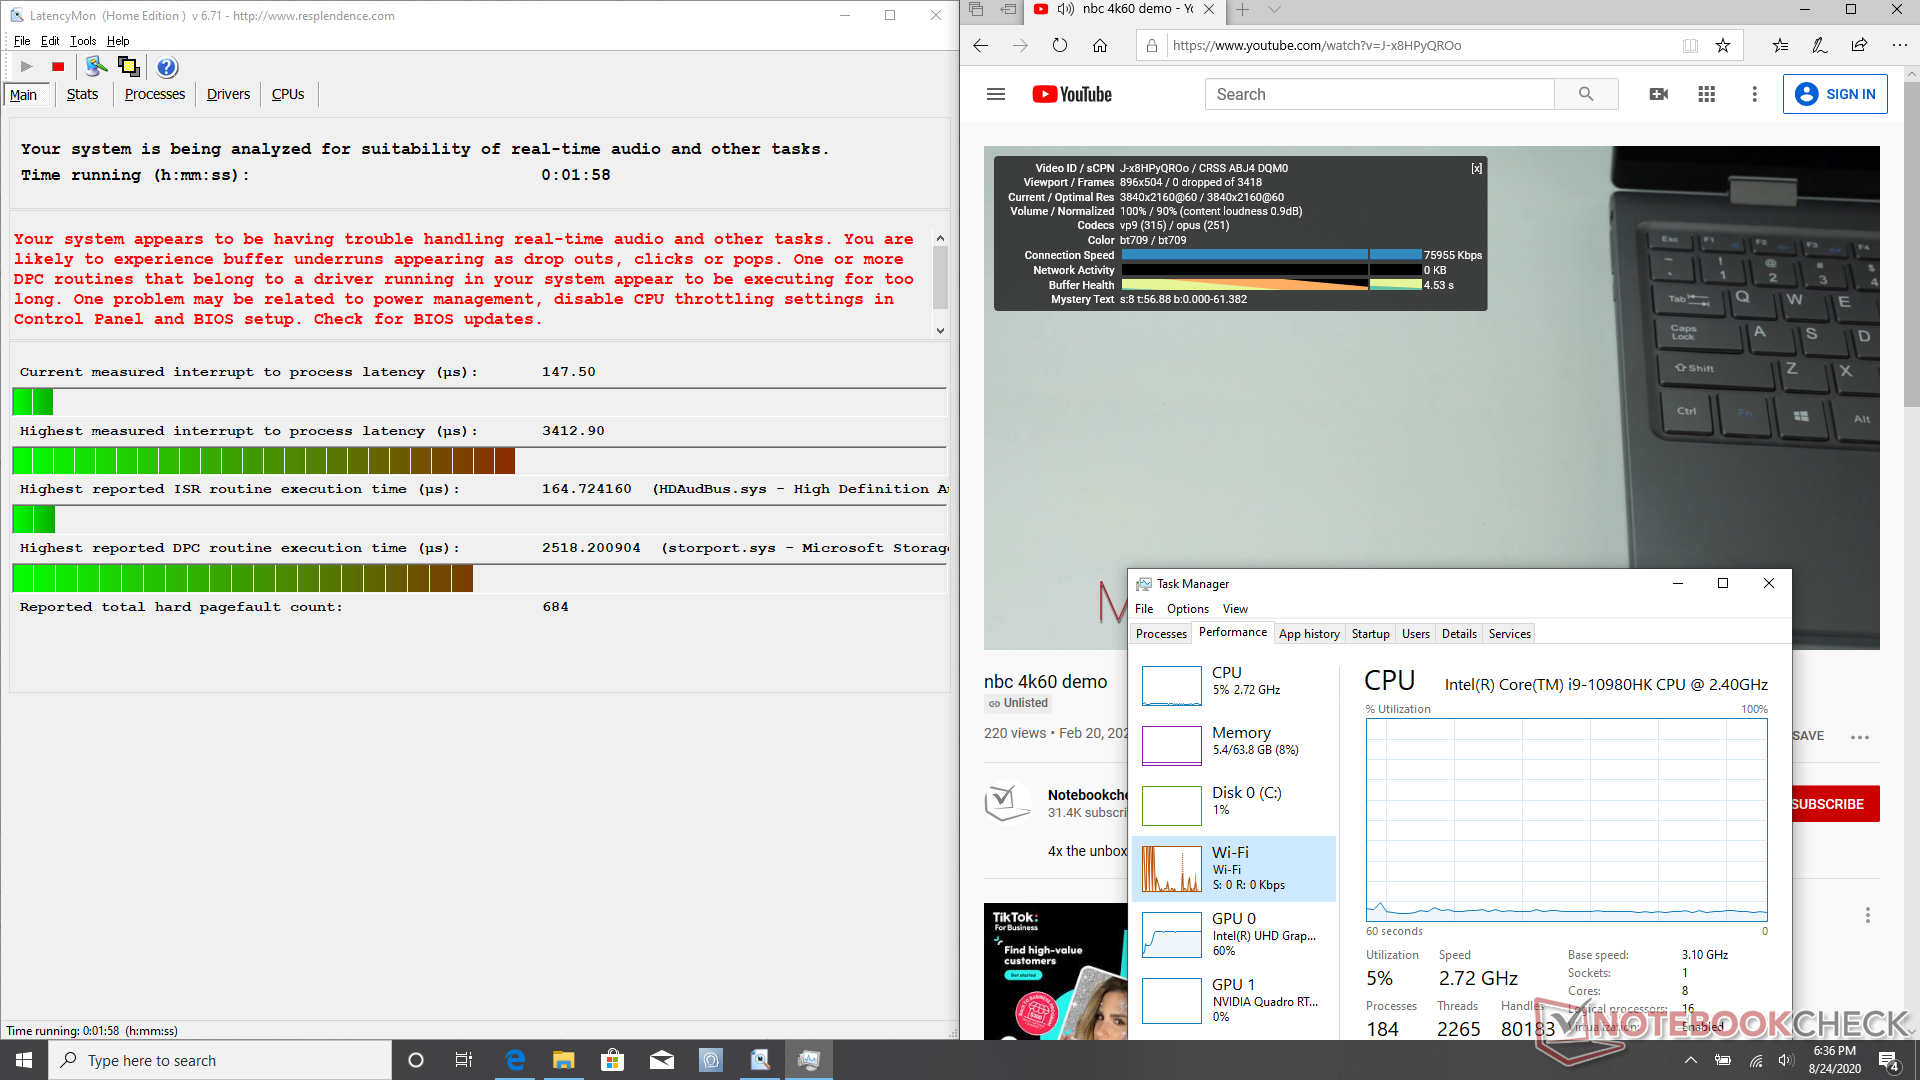
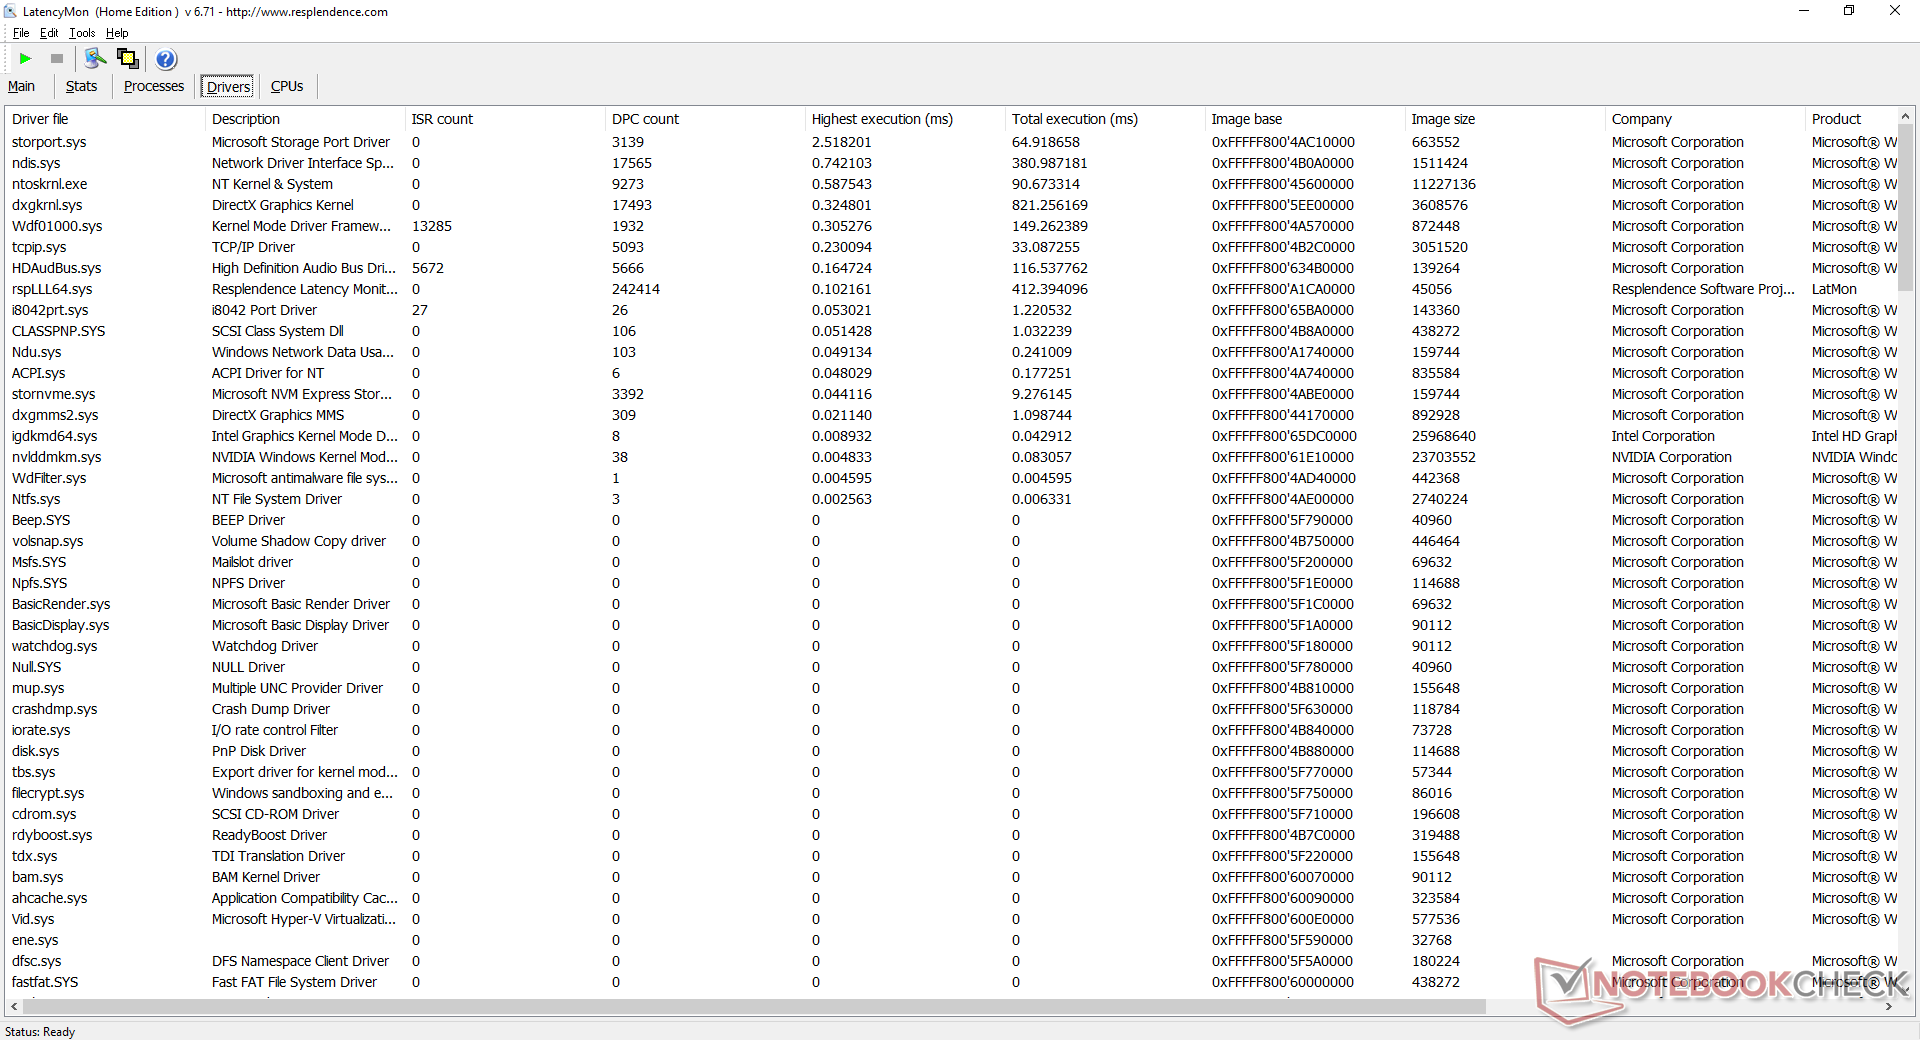
Latenza DPC
LatencyMon mostra i problemi di latenza del DPC mentre apre più schede sulla nostra homepage, cosa deludente da vedere su una workstation mobile. Per il resto la riproduzione di 4K60 è fluida e non mostra cali di fotogrammi durante il nostro video di prova di YouTube, di un minuto.
| DPC Latencies / LatencyMon - interrupt to process latency (max), Web, Youtube, Prime95 | |
| Dell Precision 7550 | |
| MSI WS66 10TMT-207US | |
| Razer Blade 15 RTX 2070 Super Max-Q | |
| Acer ConceptD 3 Pro CN315-71P-73W1 | |
| Razer Blade 15 Studio Edition 2020 | |
| Dell Precision 5550 P91F | |
* ... Meglio usare valori piccoli
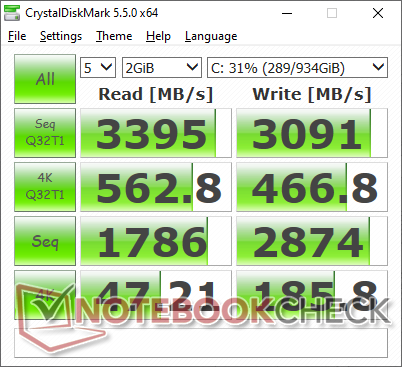
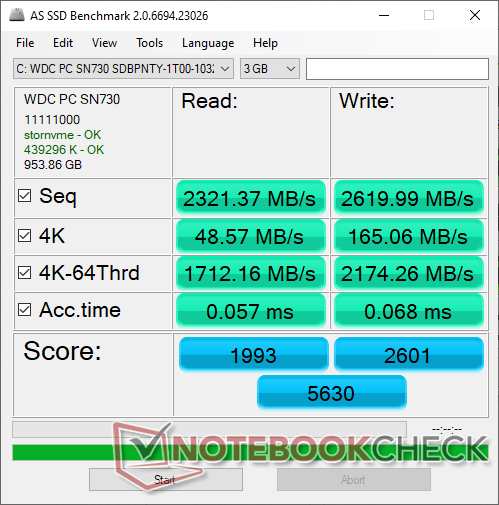
Dispositivi di archiviazione
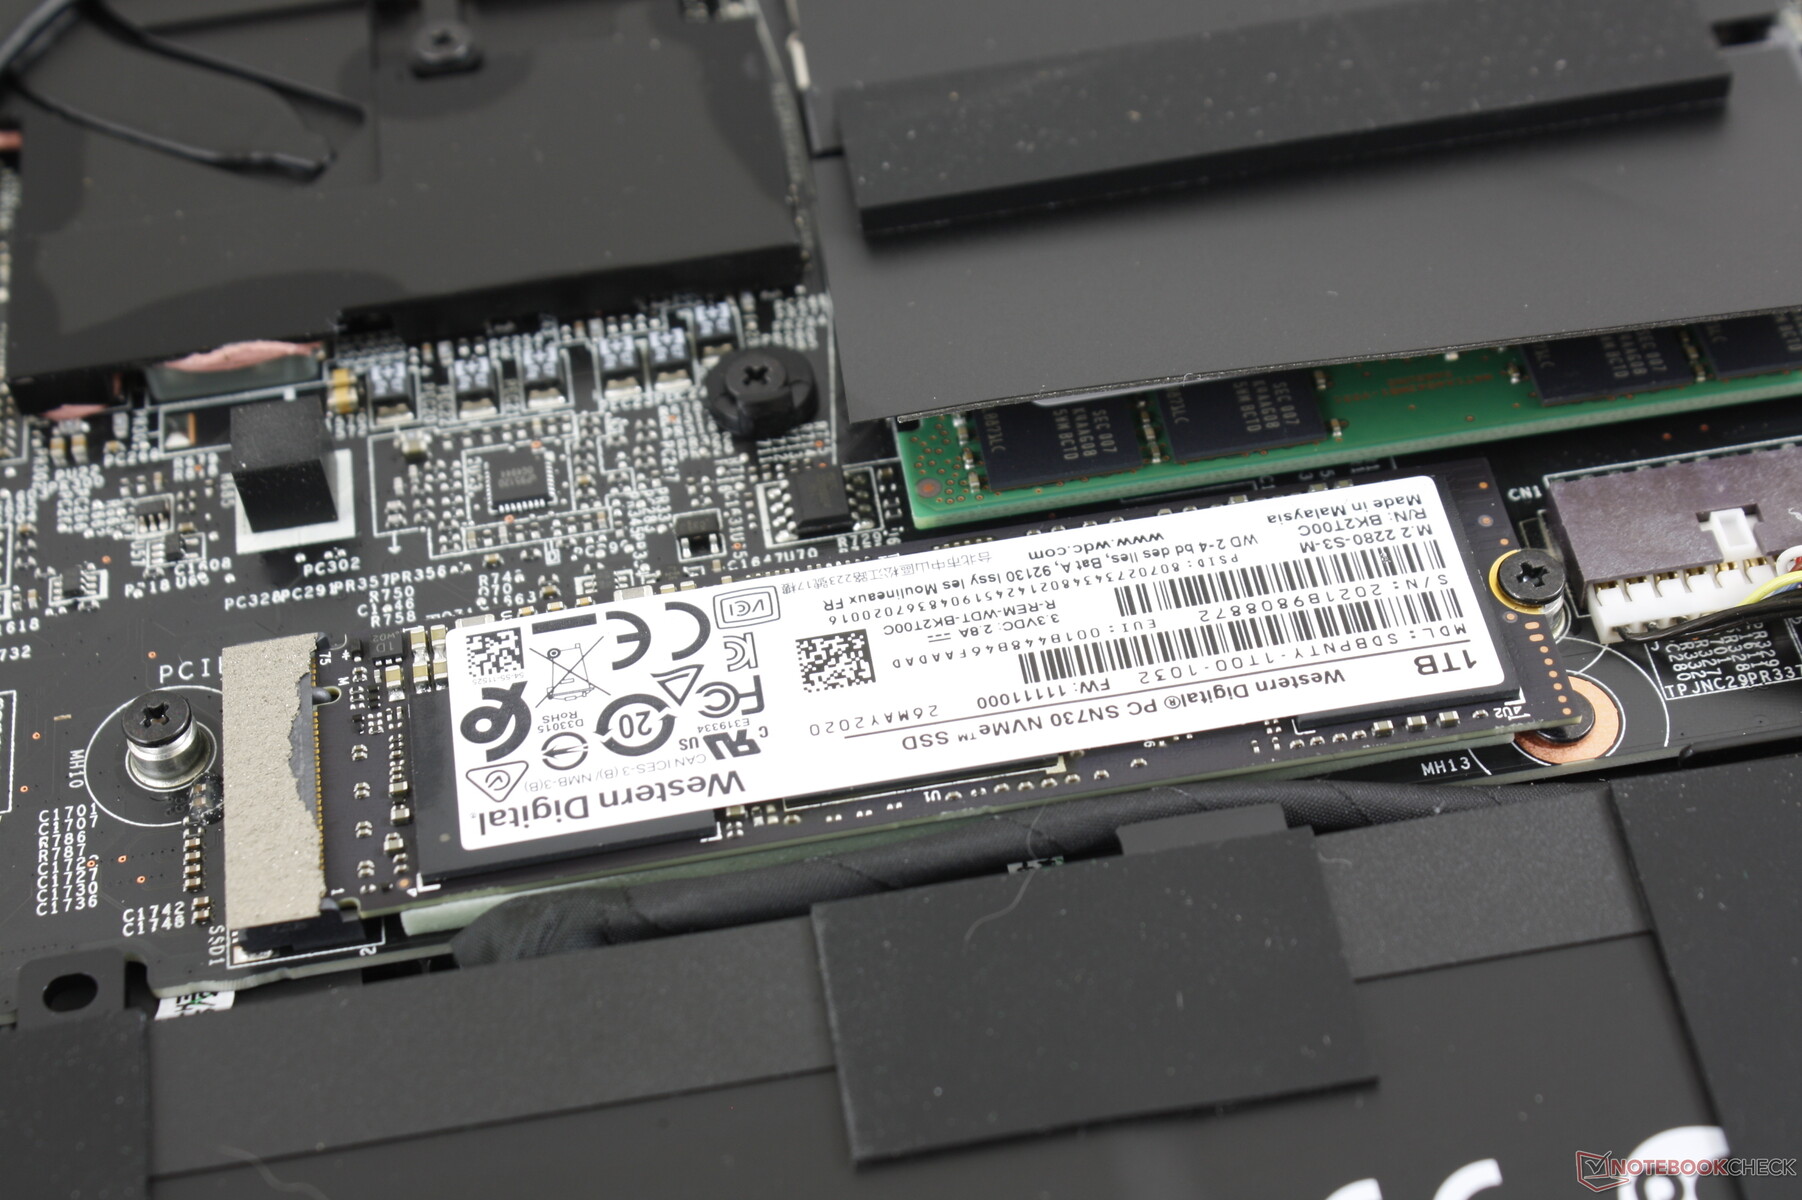
| MSI WS66 10TMT-207US WDC PC SN730 SDBPNTY-1T00 | Dell Precision 7550 SK Hynix PC601A NVMe 1TB | Dell Precision 5550 P91F SK Hynix PC601A NVMe 1TB | Razer Blade 15 Studio Edition 2020 Samsung PM981a MZVLB1T0HBLR | MSI WS63VR 7RL-023US Toshiba NVMe THNSN5512GPU7 | Acer ConceptD 3 Pro CN315-71P-73W1 WDC PC SN720 SDAPNTW-512G | |
|---|---|---|---|---|---|---|
| AS SSD | -30% | -117% | -18% | -47% | -22% | |
| Seq Read (MB/s) | 2321 | 2028 -13% | 2039 -12% | 1982 -15% | 2133 -8% | 2973 28% |
| Seq Write (MB/s) | 2620 | 1193 -54% | 1376 -47% | 2252 -14% | 1287 -51% | 2429 -7% |
| 4K Read (MB/s) | 48.57 | 42.31 -13% | 44.11 -9% | 47.13 -3% | 40.2 -17% | 24.7 -49% |
| 4K Write (MB/s) | 165.1 | 105.5 -36% | 113.3 -31% | 88.2 -47% | 114.6 -31% | 115.3 -30% |
| 4K-64 Read (MB/s) | 1712 | 1128 -34% | 1094 -36% | 1481 -13% | 710 -59% | 1243 -27% |
| 4K-64 Write (MB/s) | 2174 | 1537 -29% | 1630 -25% | 1842 -15% | 314 -86% | 835 -62% |
| Access Time Read * (ms) | 0.057 | 0.069 -21% | 0.059 -4% | 0.087 -53% | 0.128 -125% | |
| Access Time Write * (ms) | 0.068 | 0.106 -56% | 0.99 -1356% | 0.04 41% | 0.033 51% | 0.034 50% |
| Score Read (Points) | 1993 | 1373 -31% | 1342 -33% | 1726 -13% | 962 -52% | 1565 -21% |
| Score Write (Points) | 2601 | 1762 -32% | 1881 -28% | 2155 -17% | 557 -79% | 1193 -54% |
| Score Total (Points) | 5630 | 3801 -32% | 3883 -31% | 4781 -15% | 1979 -65% | 3525 -37% |
| Copy ISO MB/s (MB/s) | 2589 | 1768 -32% | 2489 -4% | 1982 -23% | 2136 -17% | |
| Copy Program MB/s (MB/s) | 791 | 627 -21% | 682 -14% | 501 -37% | 489.6 -38% | |
| Copy Game MB/s (MB/s) | 1625 | 1477 -9% | 1515 -7% | 1140 -30% | 1163 -28% | |
| CrystalDiskMark 5.2 / 6 | -16% | -17% | -6% | -27% | -19% | |
| Write 4K (MB/s) | 185.8 | 121 -35% | 122.6 -34% | 132.9 -28% | 157.1 -15% | 113.2 -39% |
| Read 4K (MB/s) | 47.21 | 42.16 -11% | 42.4 -10% | 46.73 -1% | 43.82 -7% | 31.1 -34% |
| Write Seq (MB/s) | 2874 | 2150 -25% | 2167 -25% | 2214 -23% | 1110 -61% | 2540 -12% |
| Read Seq (MB/s) | 1786 | 1755 -2% | 1747 -2% | 2018 13% | 1162 -35% | 2005 12% |
| Write 4K Q32T1 (MB/s) | 466.8 | 395.3 -15% | 388.8 -17% | 478.9 3% | 361.3 -23% | 331.4 -29% |
| Read 4K Q32T1 (MB/s) | 563 | 381.8 -32% | 367.3 -35% | 540 -4% | 563 0% | 368.3 -35% |
| Write Seq Q32T1 (MB/s) | 3091 | 2730 -12% | 2629 -15% | 2975 -4% | 1558 -50% | 2535 -18% |
| Read Seq Q32T1 (MB/s) | 3395 | 3468 2% | 3460 2% | 3195 -6% | 2635 -22% | 3427 1% |
| Media totale (Programma / Settaggio) | -23% /
-25% | -67% /
-81% | -12% /
-14% | -37% /
-39% | -21% /
-21% |
* ... Meglio usare valori piccoli

Throttling disco: DiskSpd Read Loop, Queue Depth 8
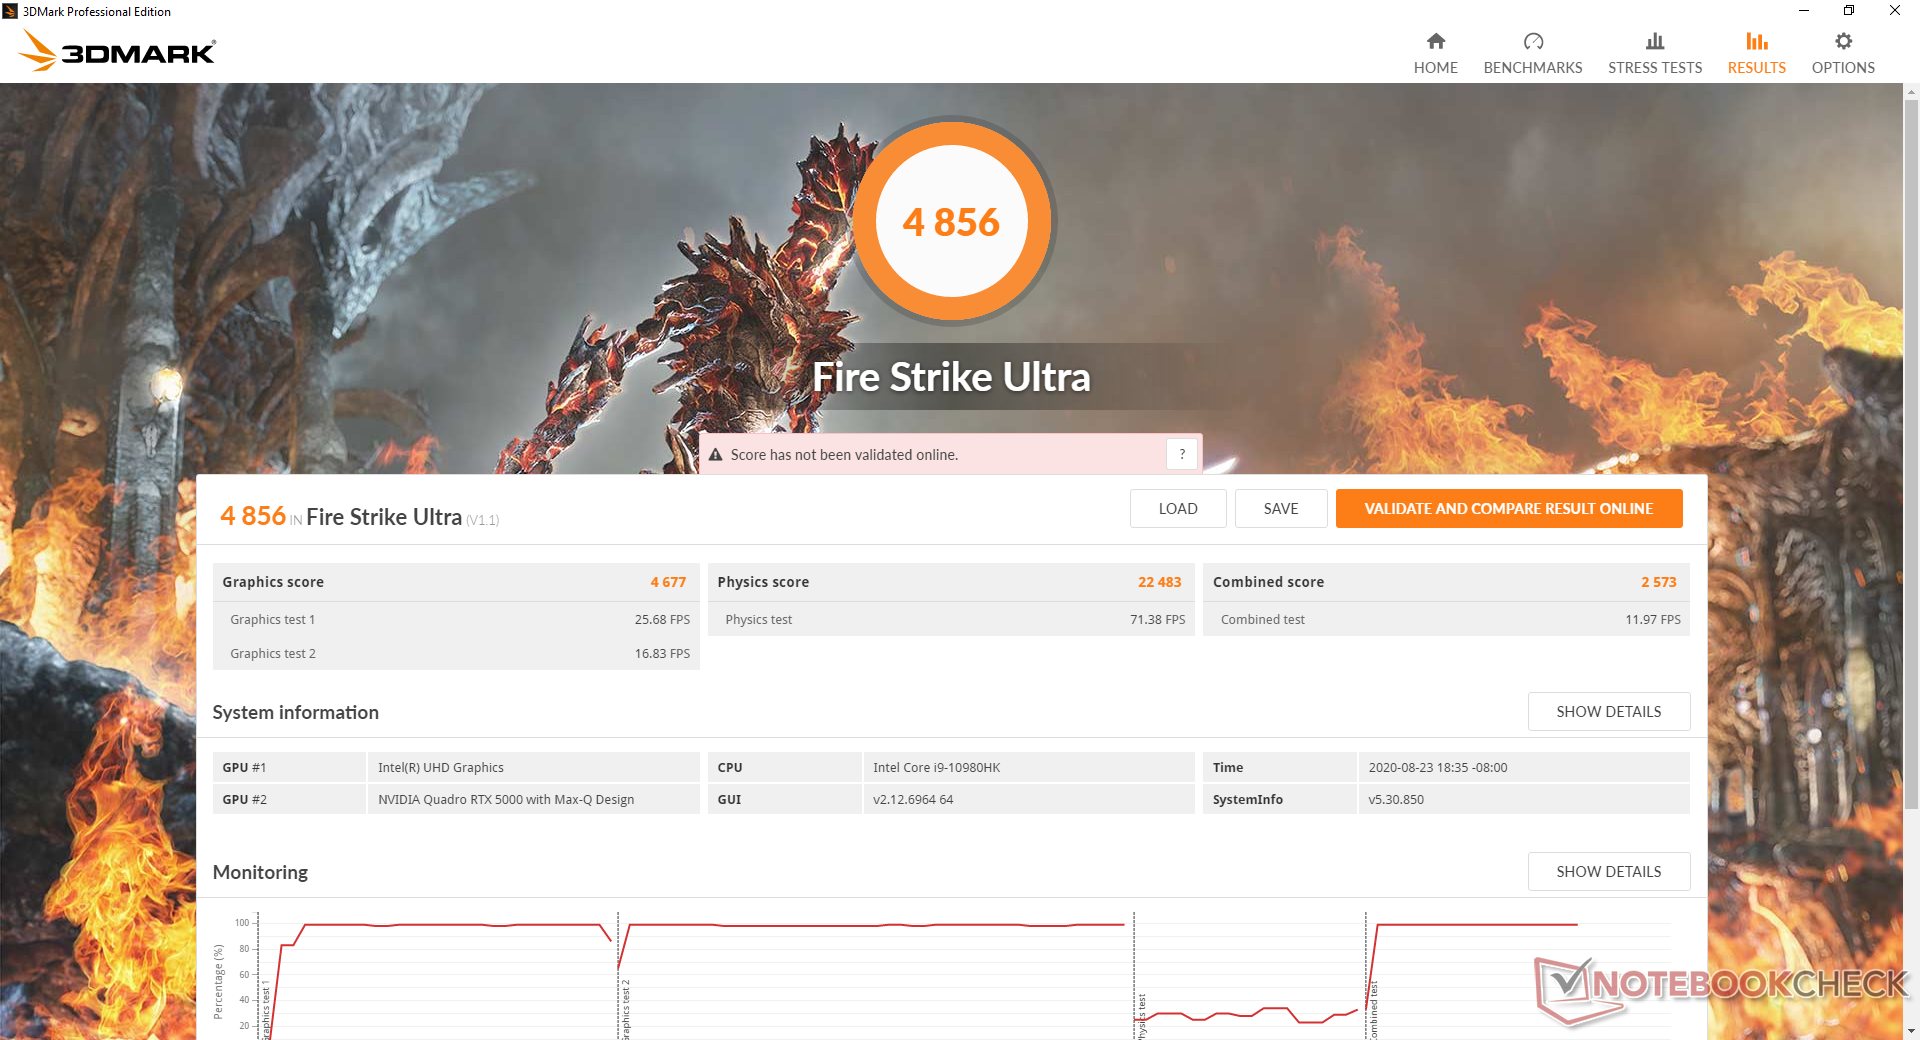
Prestazioni GPU
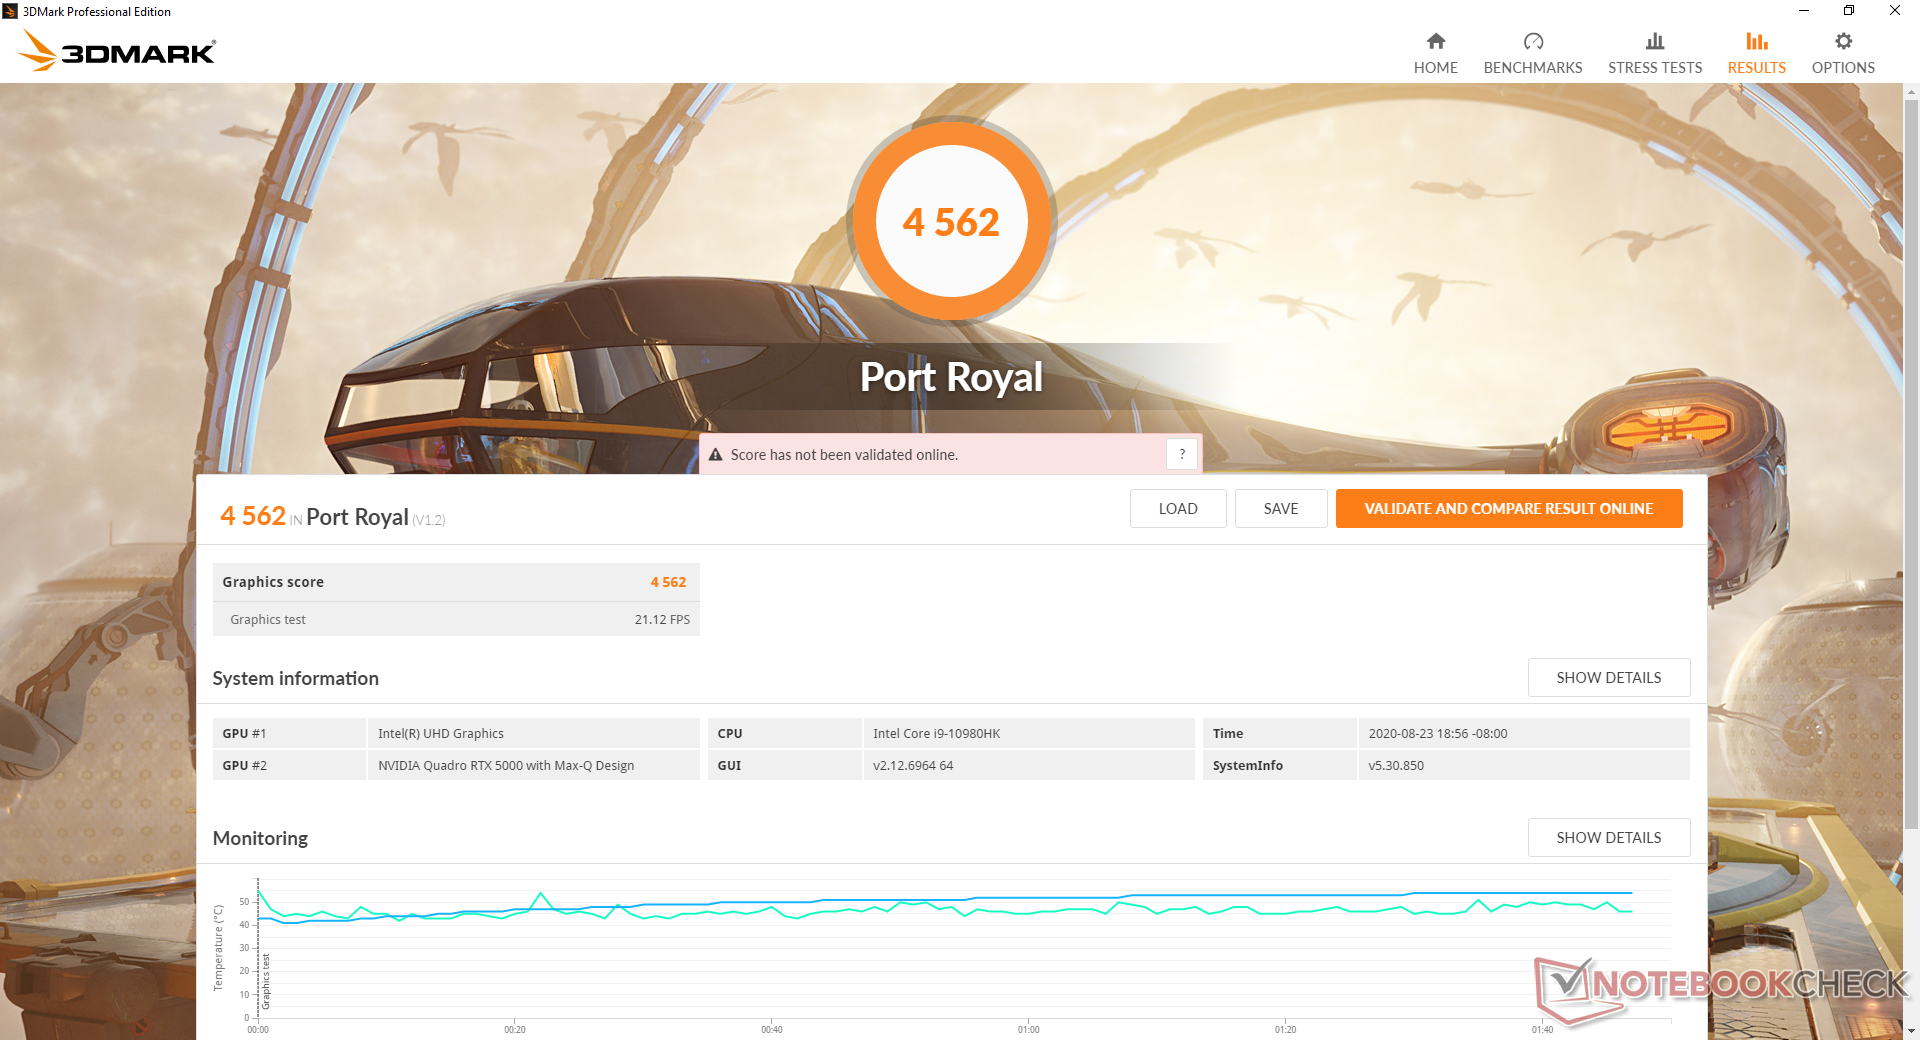
La Quadro RTX 5000 Max-Q funziona secondo le attese rispetto ad altri portatili con la stessa GPU. Il passaggio a workstation più spesse come Acer ConceptD 9 Pro o Eurocom Tornado F5W con la Quadro RTX 5000 a piena potenza può dare un aumento del 30-50% della potenza grafica.
Consultate la nostra pagina dedicata alla Quadro RTX 5000 Max-Q per maggiori informazioni tecniche e benchmarks di confronto.
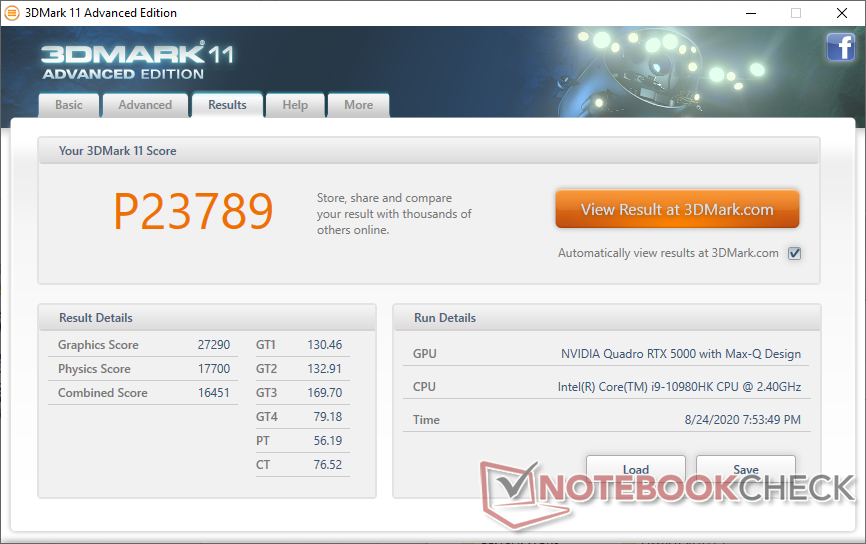

| 3DMark 11 Performance | 23789 punti | |
| 3DMark Cloud Gate Standard Score | 52005 punti | |
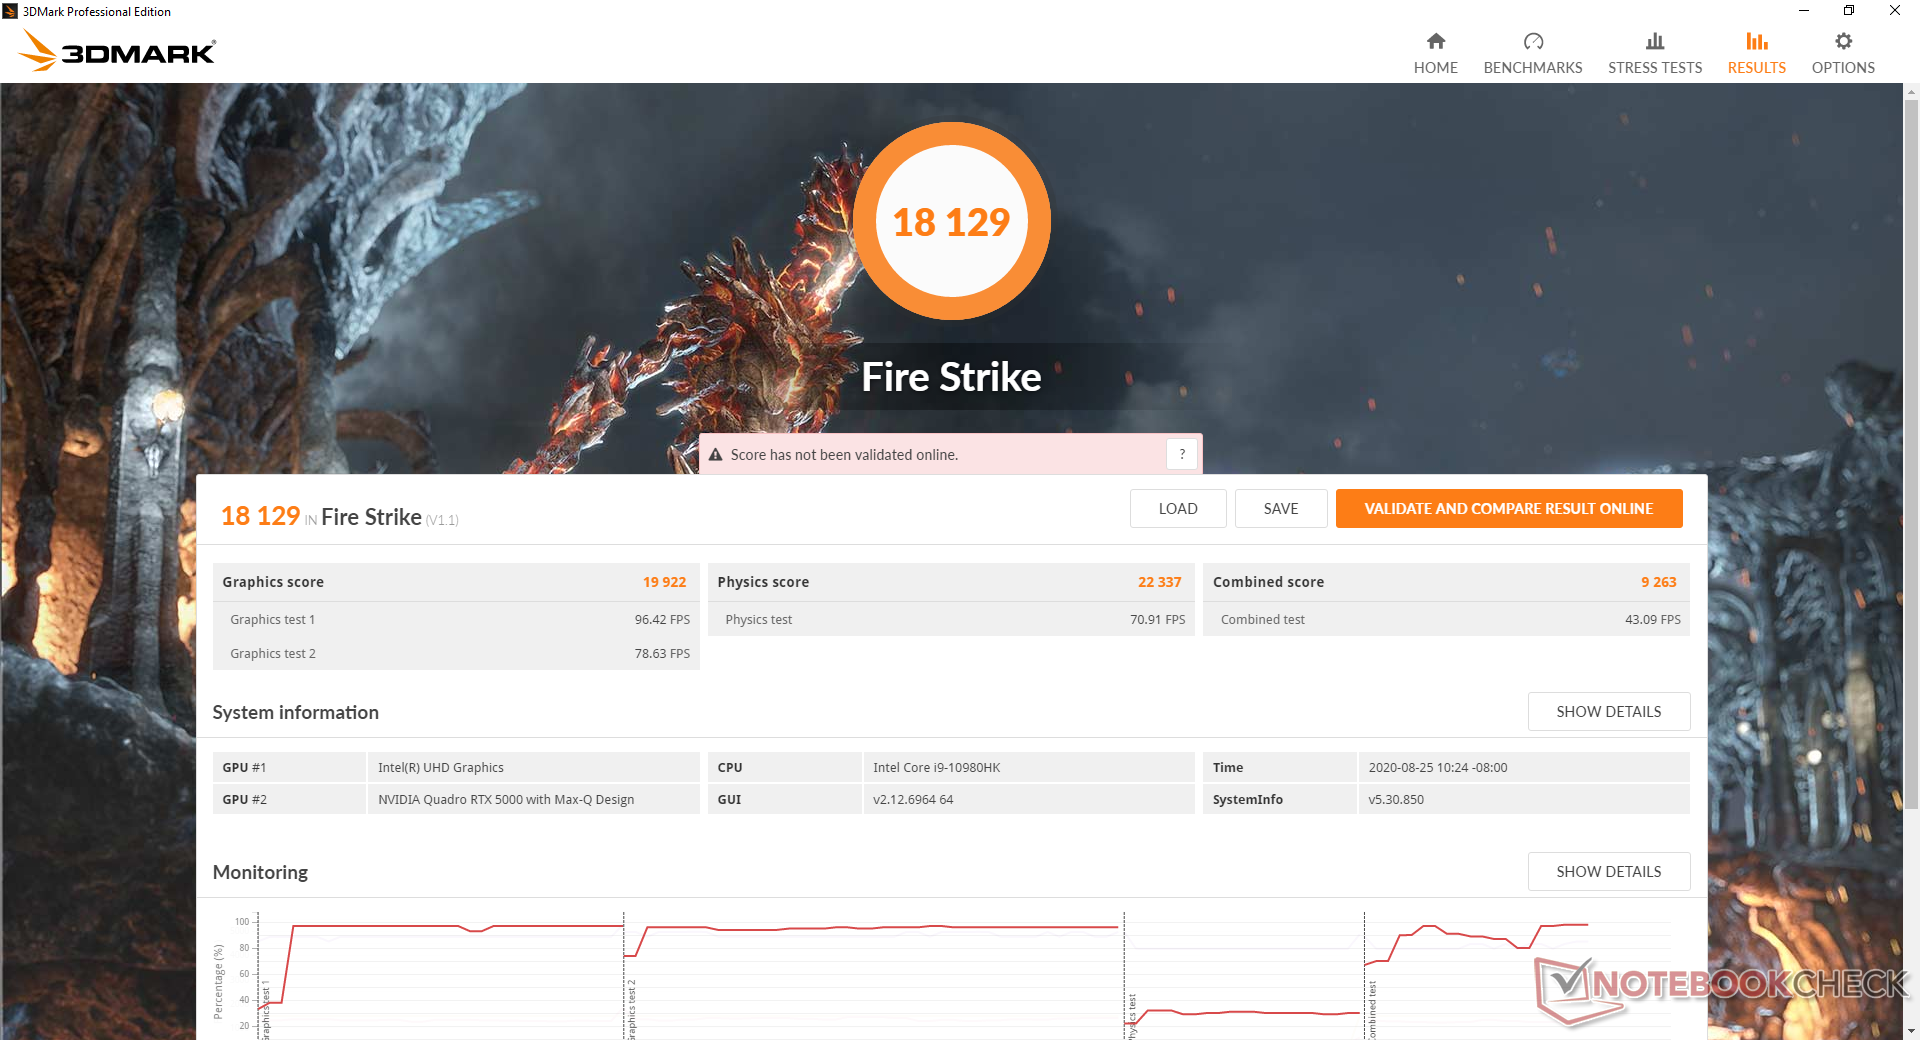
| 3DMark Fire Strike Score | 18226 punti | |
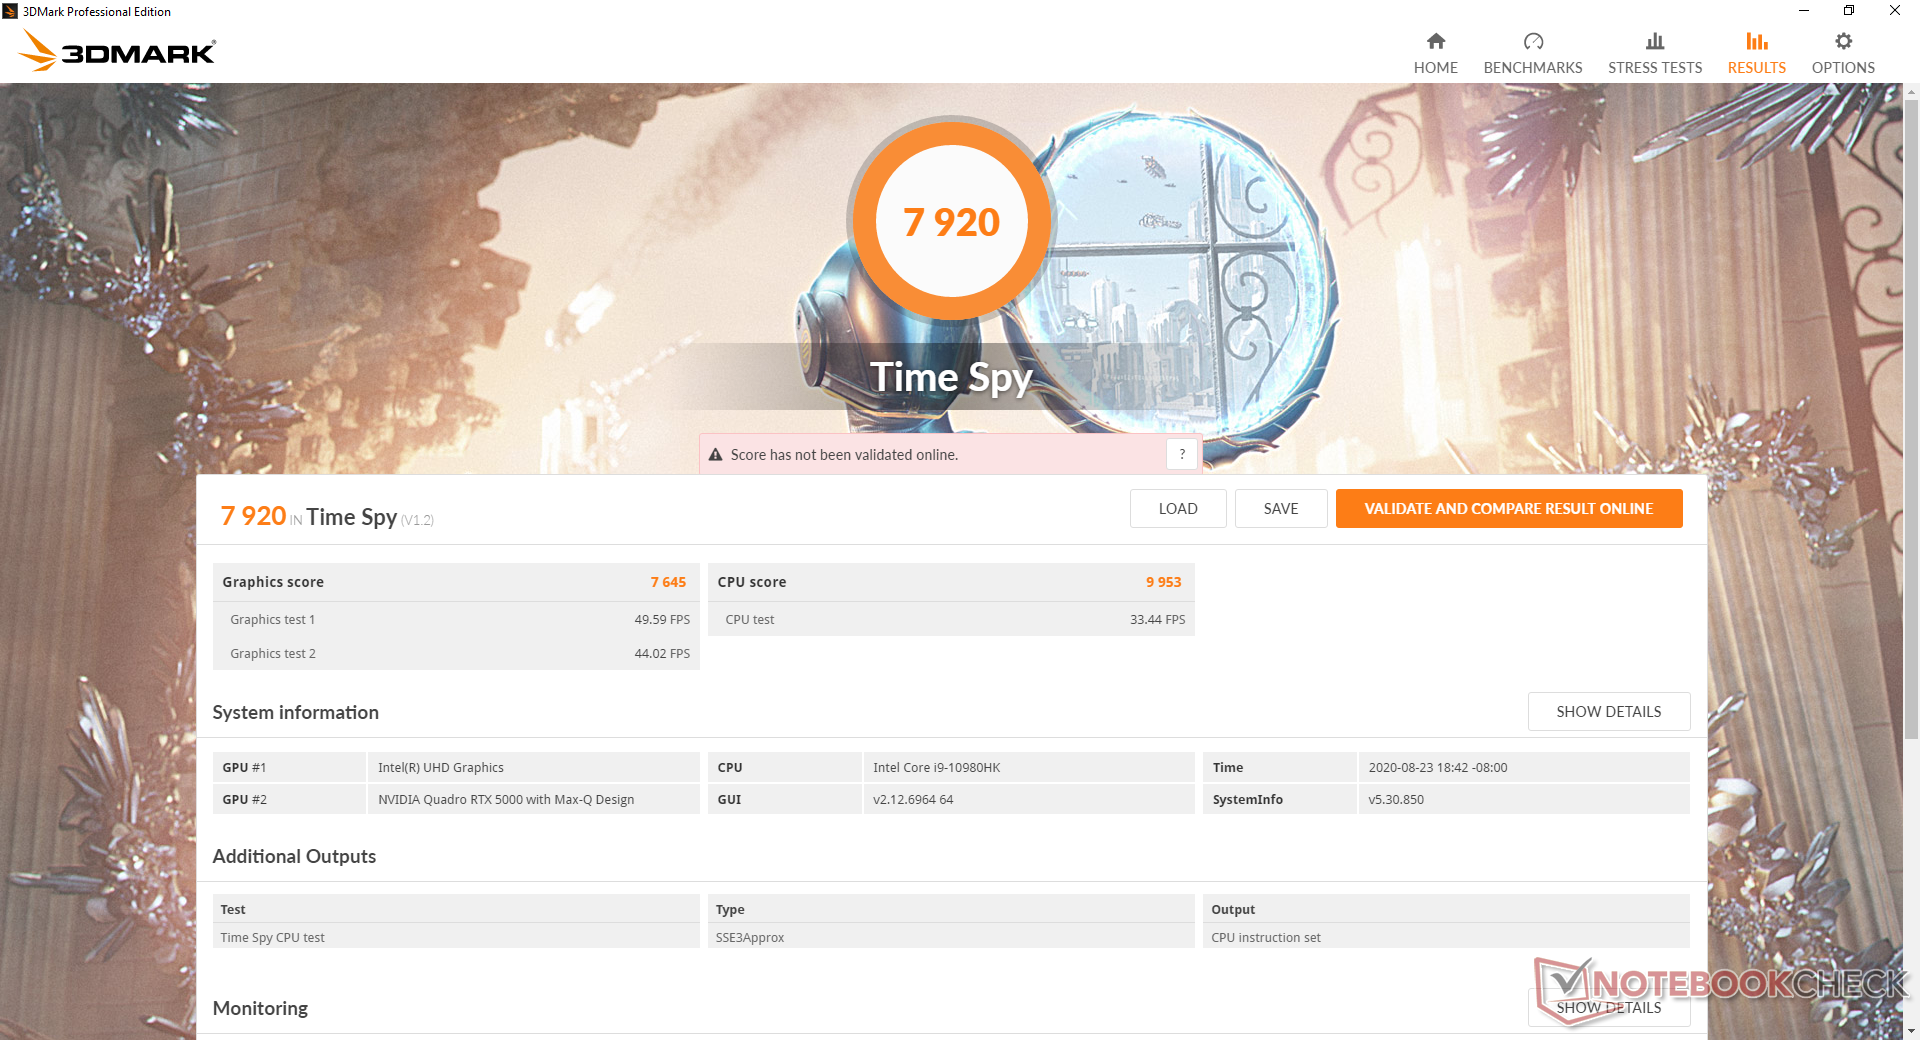
| 3DMark Time Spy Score | 7920 punti | |
Aiuto | ||
| basso | medio | alto | ultra | |
|---|---|---|---|---|
| The Witcher 3 (2015) | 353.2 | 249.8 | 158.2 | 81.1 |
| Dota 2 Reborn (2015) | 161 | 143 | 130 | 122 |
| Final Fantasy XV Benchmark (2018) | 177 | 103 | 80.8 | |
| X-Plane 11.11 (2018) | 113 | 98.9 | 82 |
Emissioni
Rumorosità di sistema
Le ventole non sono mai silenziose anche se impostate in modalità Silenziosa con circa 32 dB(A) minimo con una rumorosità ambientale di 26 dB(A). Questo è simile a quanto abbiamo rilevato sul WS63 dello scorso anno, suggerendo che il comportamento delle ventole non è realmente migliorato tra le generazioni nonostante la riprogettazione del telaio. Tuttavia, la modalità Silenziosa è raccomandata quando si naviga sul web o in streaming video, poiché le ventole pulseranno più frequentemente se impostate su altri profili di potenza.
L'esecuzione di carichi impegnativi come The Witcher 3 indurrà un rumore di ventola ciclico tra 45,5 dB(A) e 47,4 d(A) quando il Cooler Boost è spento. Se Cooler Boost è acceso, il rumore della ventola salirà e si stabilizzerà a 59,7 dB(A) risultando essere una delle workstation da 15,6 pollici più rumorose che abbiamo mai testato.
| MSI WS66 10TMT-207US Quadro RTX 5000 Max-Q, i9-10980HK, WDC PC SN730 SDBPNTY-1T00 | Dell Precision 7550 Quadro RTX 5000 Max-Q, W-10885M, SK Hynix PC601A NVMe 1TB | Dell Precision 5550 P91F Quadro T2000 Max-Q, i7-10875H, SK Hynix PC601A NVMe 1TB | Razer Blade 15 Studio Edition 2020 Quadro RTX 5000 Max-Q, i7-10875H, Samsung PM981a MZVLB1T0HBLR | MSI WS63VR 7RL-023US Quadro P4000 Max-Q, i7-7700HQ, Toshiba NVMe THNSN5512GPU7 | Acer ConceptD 3 Pro CN315-71P-73W1 Quadro T1000 (Laptop), i7-9750H, WDC PC SN720 SDAPNTW-512G | |
|---|---|---|---|---|---|---|
| Noise | 6% | 13% | 4% | 4% | 7% | |
| off /ambiente * (dB) | 26 | 25.8 1% | 26.2 -1% | 30.1 -16% | 28 -8% | 31.2 -20% |
| Idle Minimum * (dB) | 32 | 25.8 19% | 26.2 18% | 30.1 6% | 33.2 -4% | 31.2 2% |
| Idle Average * (dB) | 32 | 25.8 19% | 26.2 18% | 30.1 6% | 33.2 -4% | 31.2 2% |
| Idle Maximum * (dB) | 32 | 25.9 19% | 26.2 18% | 30.1 6% | 33.2 -4% | 31.5 2% |
| Load Average * (dB) | 42 | 51.2 -22% | 39.2 7% | 42.3 -1% | 41.4 1% | 38.4 9% |
| Witcher 3 ultra * (dB) | 47.4 | 51.9 -9% | 39 18% | 48.2 -2% | 38.4 19% | 36.9 22% |
| Load Maximum * (dB) | 59.7 | 51.9 13% | 50.6 15% | 42.1 29% | 43.5 27% | 41.2 31% |
* ... Meglio usare valori piccoli
Rumorosità
| Idle |
| 32 / 32 / 32 dB(A) |
| Sotto carico |
| 42 / 59.7 dB(A) |
 | ||
30 dB silenzioso 40 dB(A) udibile 50 dB(A) rumoroso |
||
min: | ||
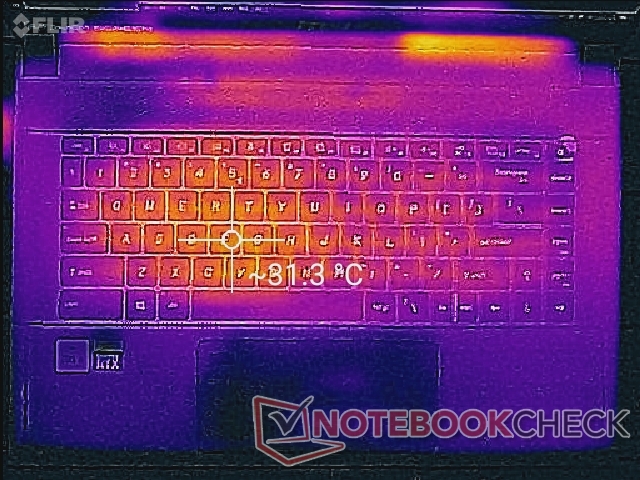
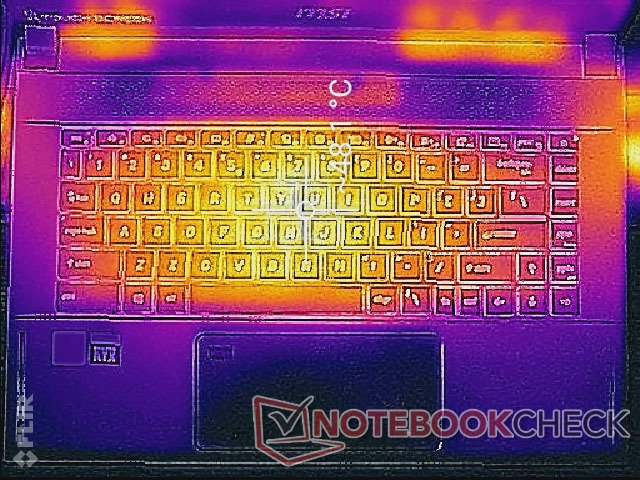
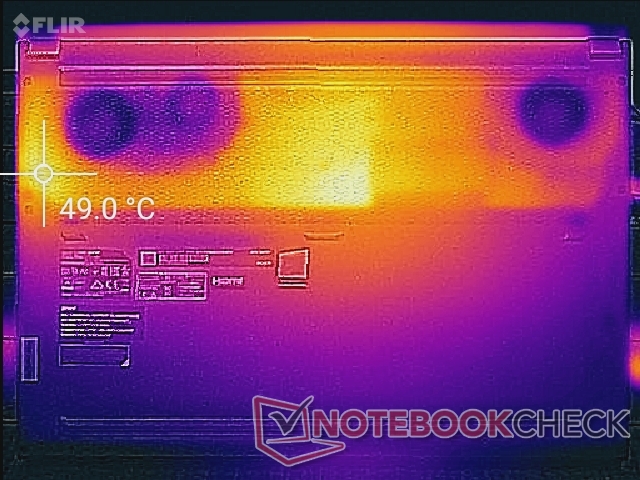
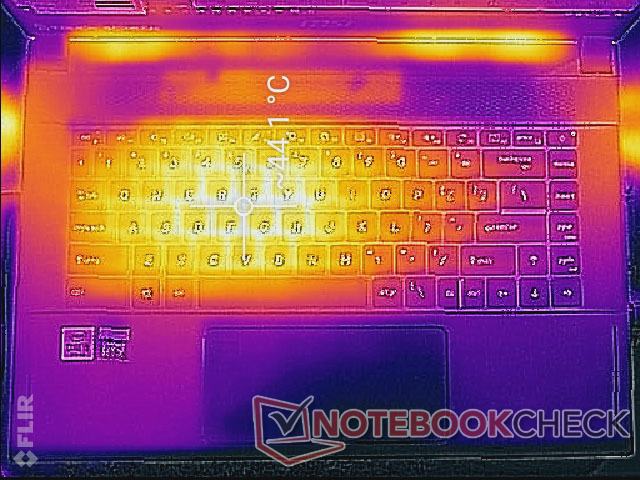
Temperature
Le temperature di superficie sono più calde verso il centro della tastiera, dove possono essere comprese tra i 44 °C e i 48 °C in presenza di carichi di elaborazione estremi. I risultati sono più freddi di quelli che abbiamo registrato nello Studio Razer Blade 15 dove i punti caldi e i poggiapolsi possono arrivare rispettivamente a 60° C e 38° C. Le ventole più rumorose dell'MSI possono essere in parte responsabili delle temperature di superficie complessivamente più basse rispetto all'alternativa Razer.
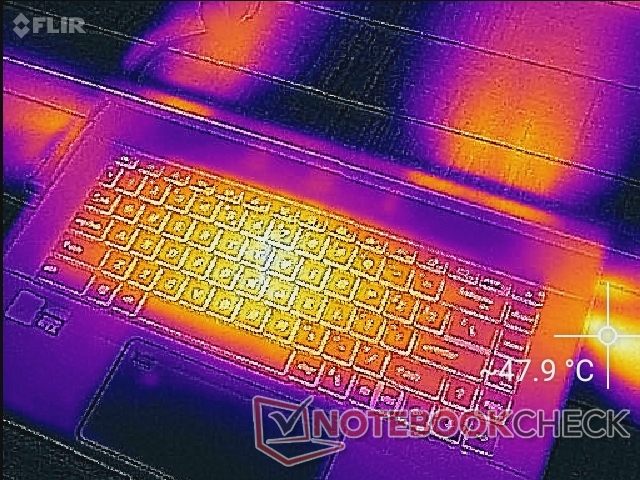
(±) La temperatura massima sul lato superiore è di 44.2 °C / 112 F, rispetto alla media di 38.2 °C / 101 F, che varia da 22.2 a 69.8 °C per questa classe Workstation.
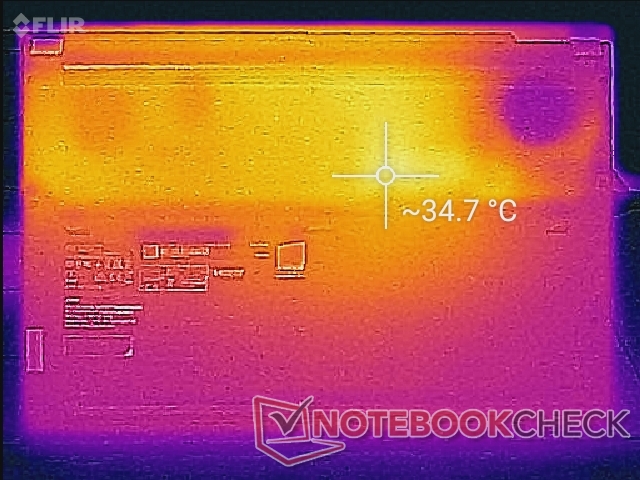
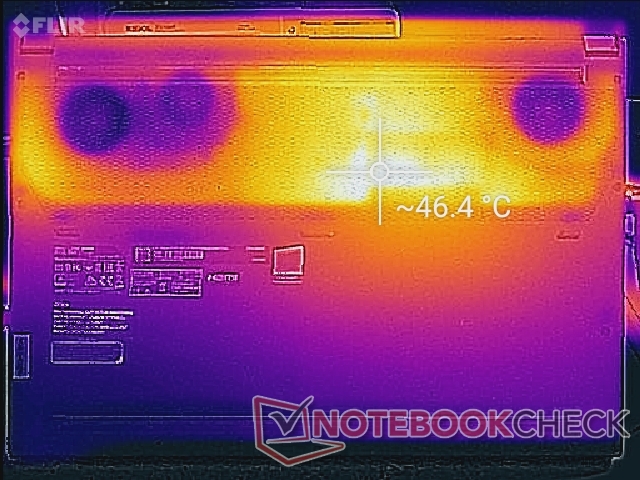
(-) Il lato inferiore si riscalda fino ad un massimo di 46.2 °C / 115 F, rispetto alla media di 41.1 °C / 106 F
(+) In idle, la temperatura media del lato superiore è di 29 °C / 84 F, rispetto alla media deld ispositivo di 32 °C / 90 F.
(±) Riproducendo The Witcher 3, la temperatura media per il lato superiore e' di 36.8 °C / 98 F, rispetto alla media del dispositivo di 32 °C / 90 F.
(+) I poggiapolsi e il touchpad raggiungono la temperatura massima della pelle (32 °C / 89.6 F) e quindi non sono caldi.
(-) La temperatura media della zona del palmo della mano di dispositivi simili e'stata di 27.8 °C / 82 F (-4.2 °C / -7.6 F).
Stress Test
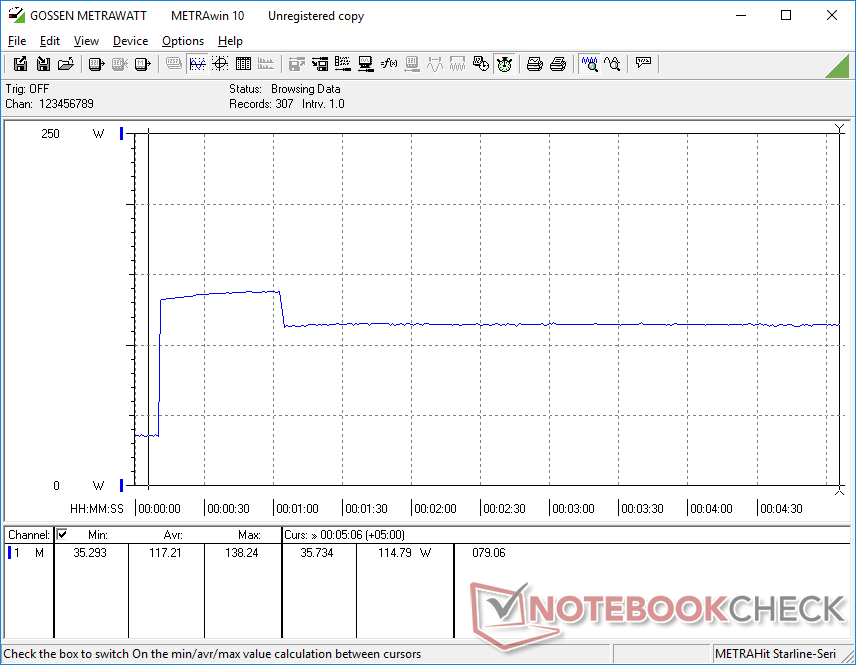
Quando si esegue Prime95 per stressare la CPU, le frequenze di clock salgono a 4,3 GHz per circa un minuto fino a raggiungere una temperatura del core di 84°C. Le frequenze di clock scendono poi a 3,9 GHz per mantenere una temperatura del core più fredda di 74 °C. Questo comportamento può essere notato anche nella nostra sezione Consumo energetico qui sotto.
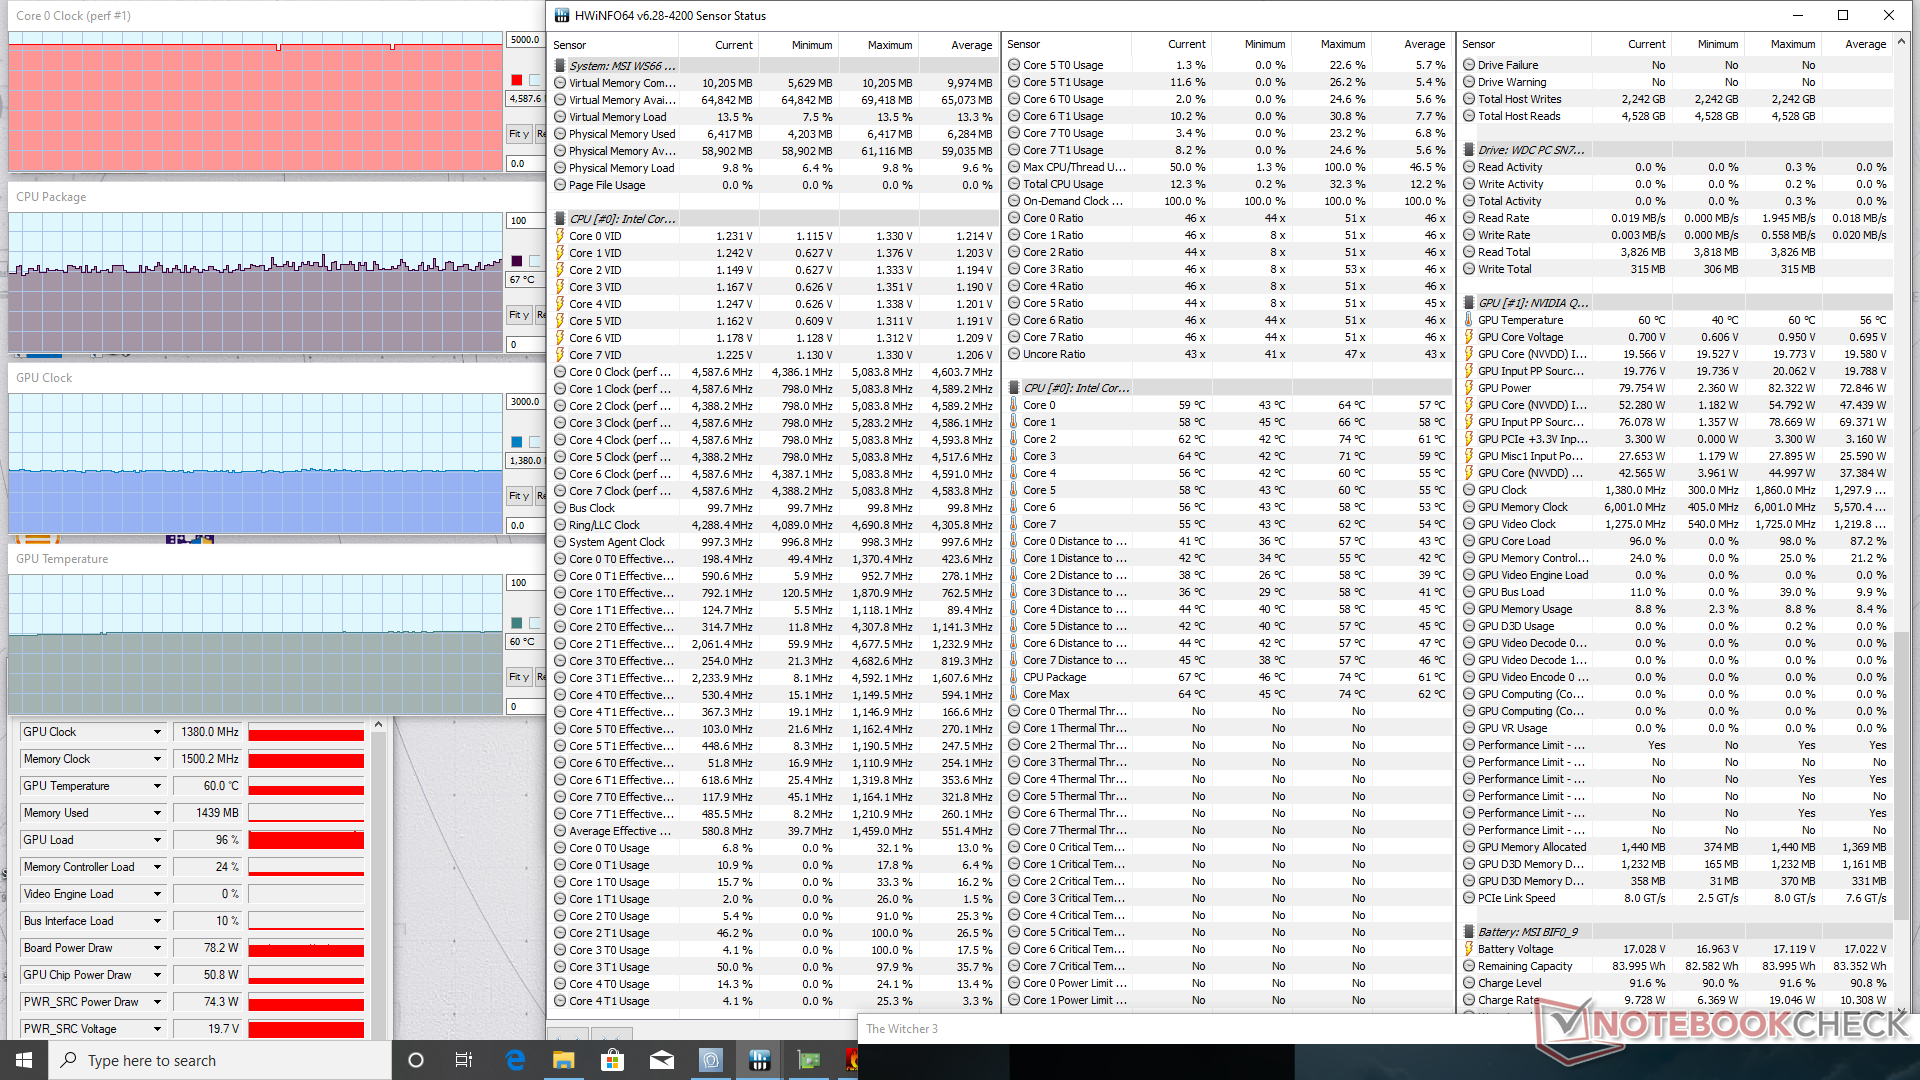
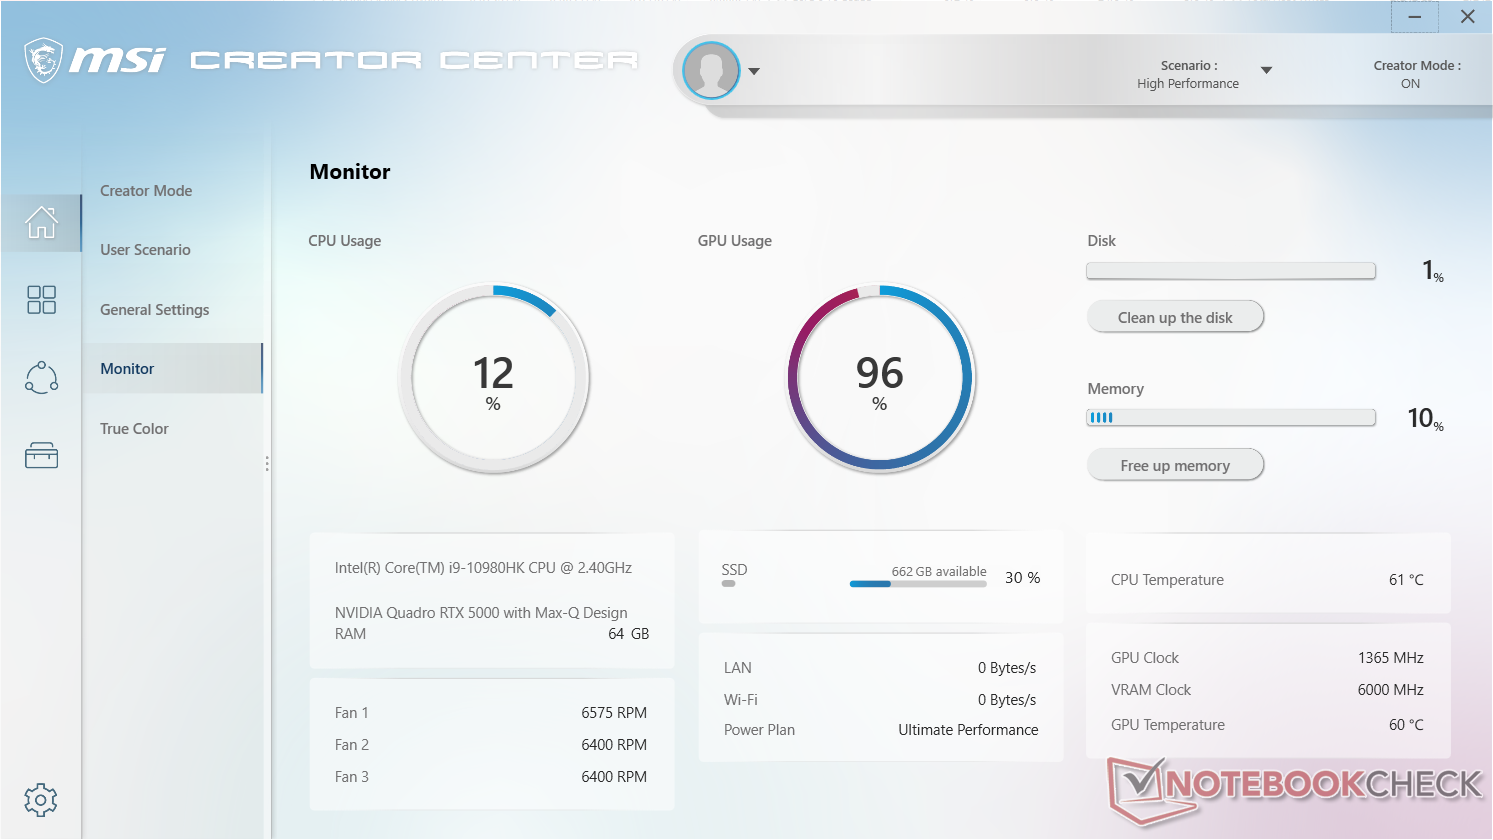
L'attivazione del Cooler Boost aumenterà leggermente la velocità di clock sia della CPU che della GPU, riducendo al contempo le temperature del core, come mostrato dalla nostra tabella qui sotto.
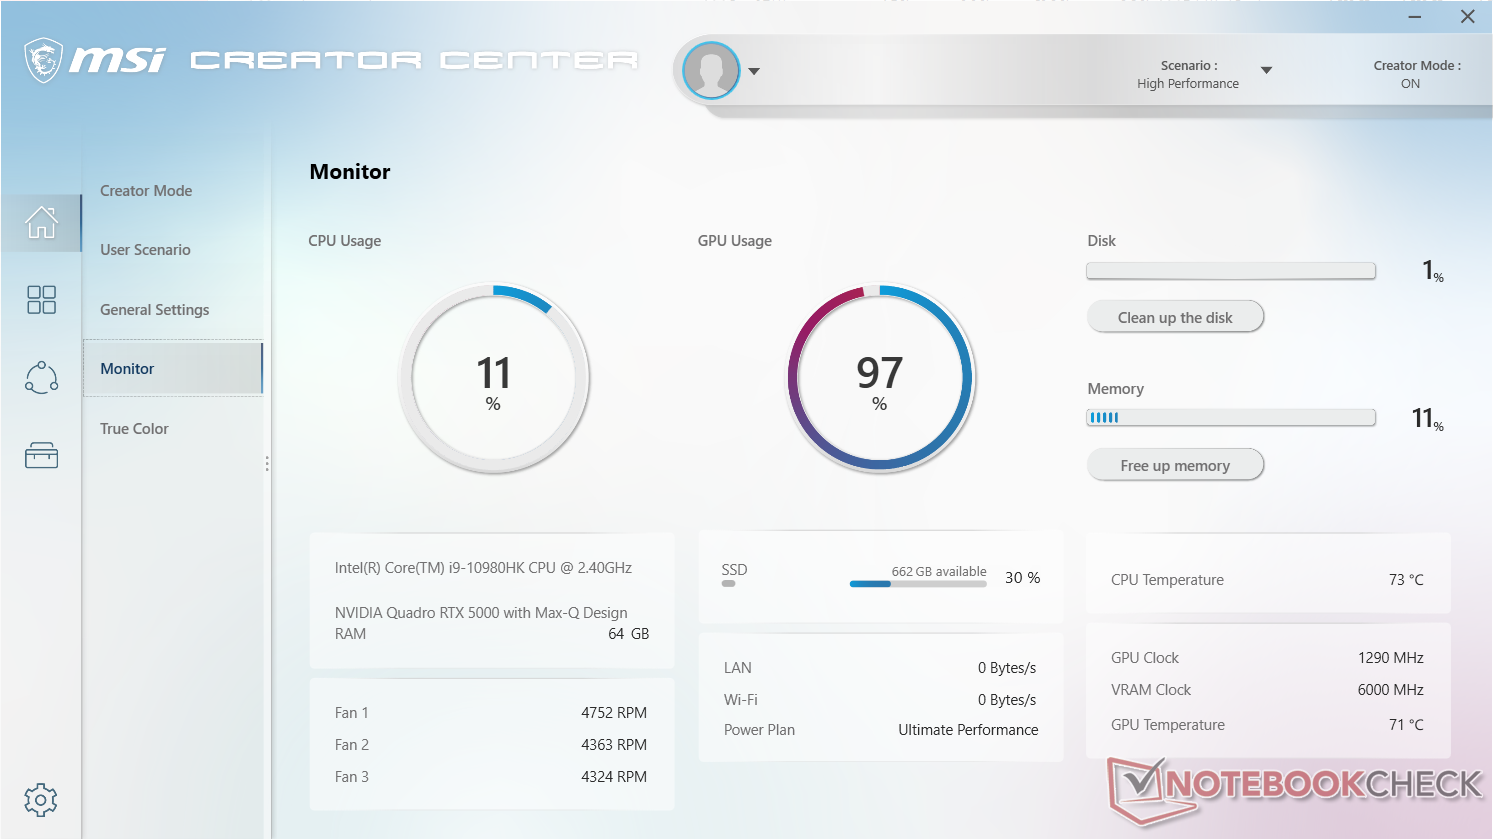
Quando si esegue The Witcher 3 con la funzione disabilitata, ad esempio, le temperature di CPU e GPU si assestano rispettivamente a 75 °C e 71 °C, rispetto a 67 °C e 60 °C quando la funzione è abilitata.
Quando si usa la batteria le prestazioni sono limitate. Un Fire Strike eseguito con la batteria produce punteggi di Physics e Graphics di 13238 e 5944 punti, rispettivamente, rispetto ai 22317 e 20164 punti quando è alimentato dalla rete elettrica.
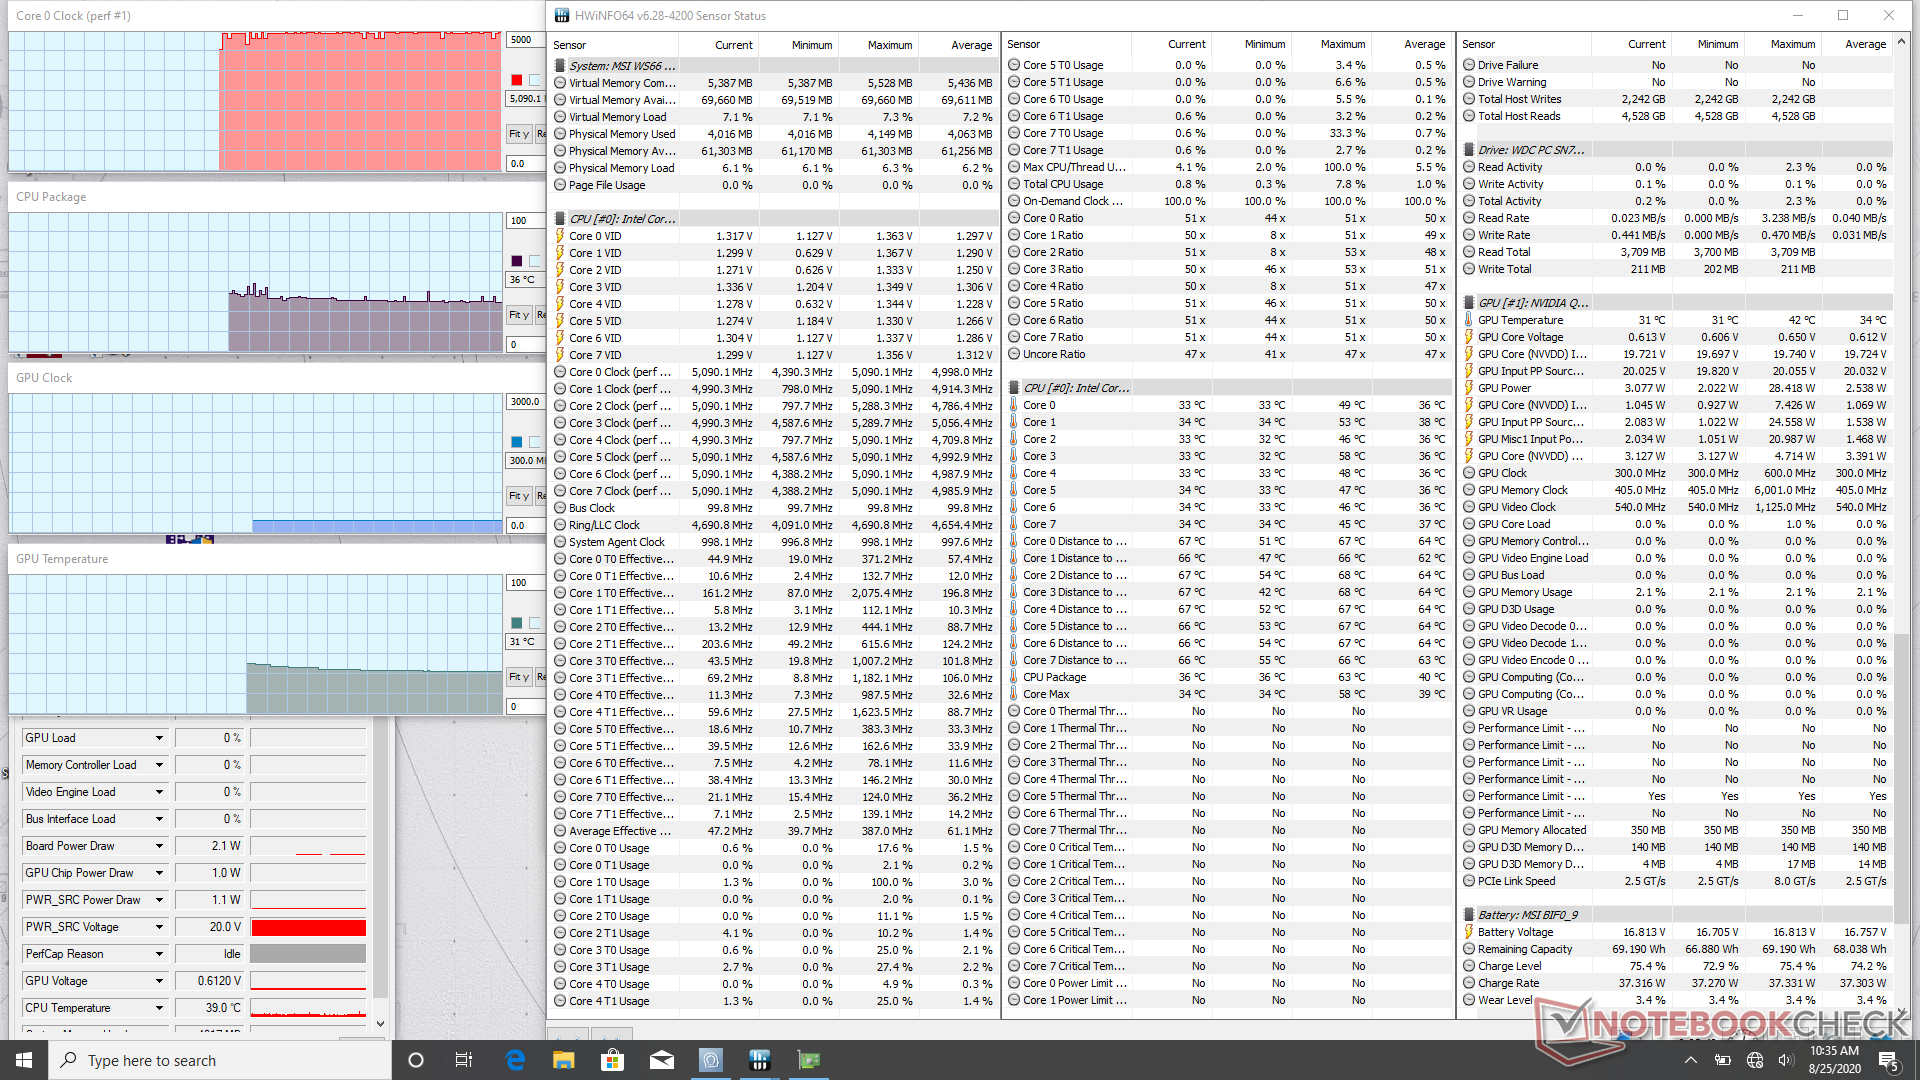
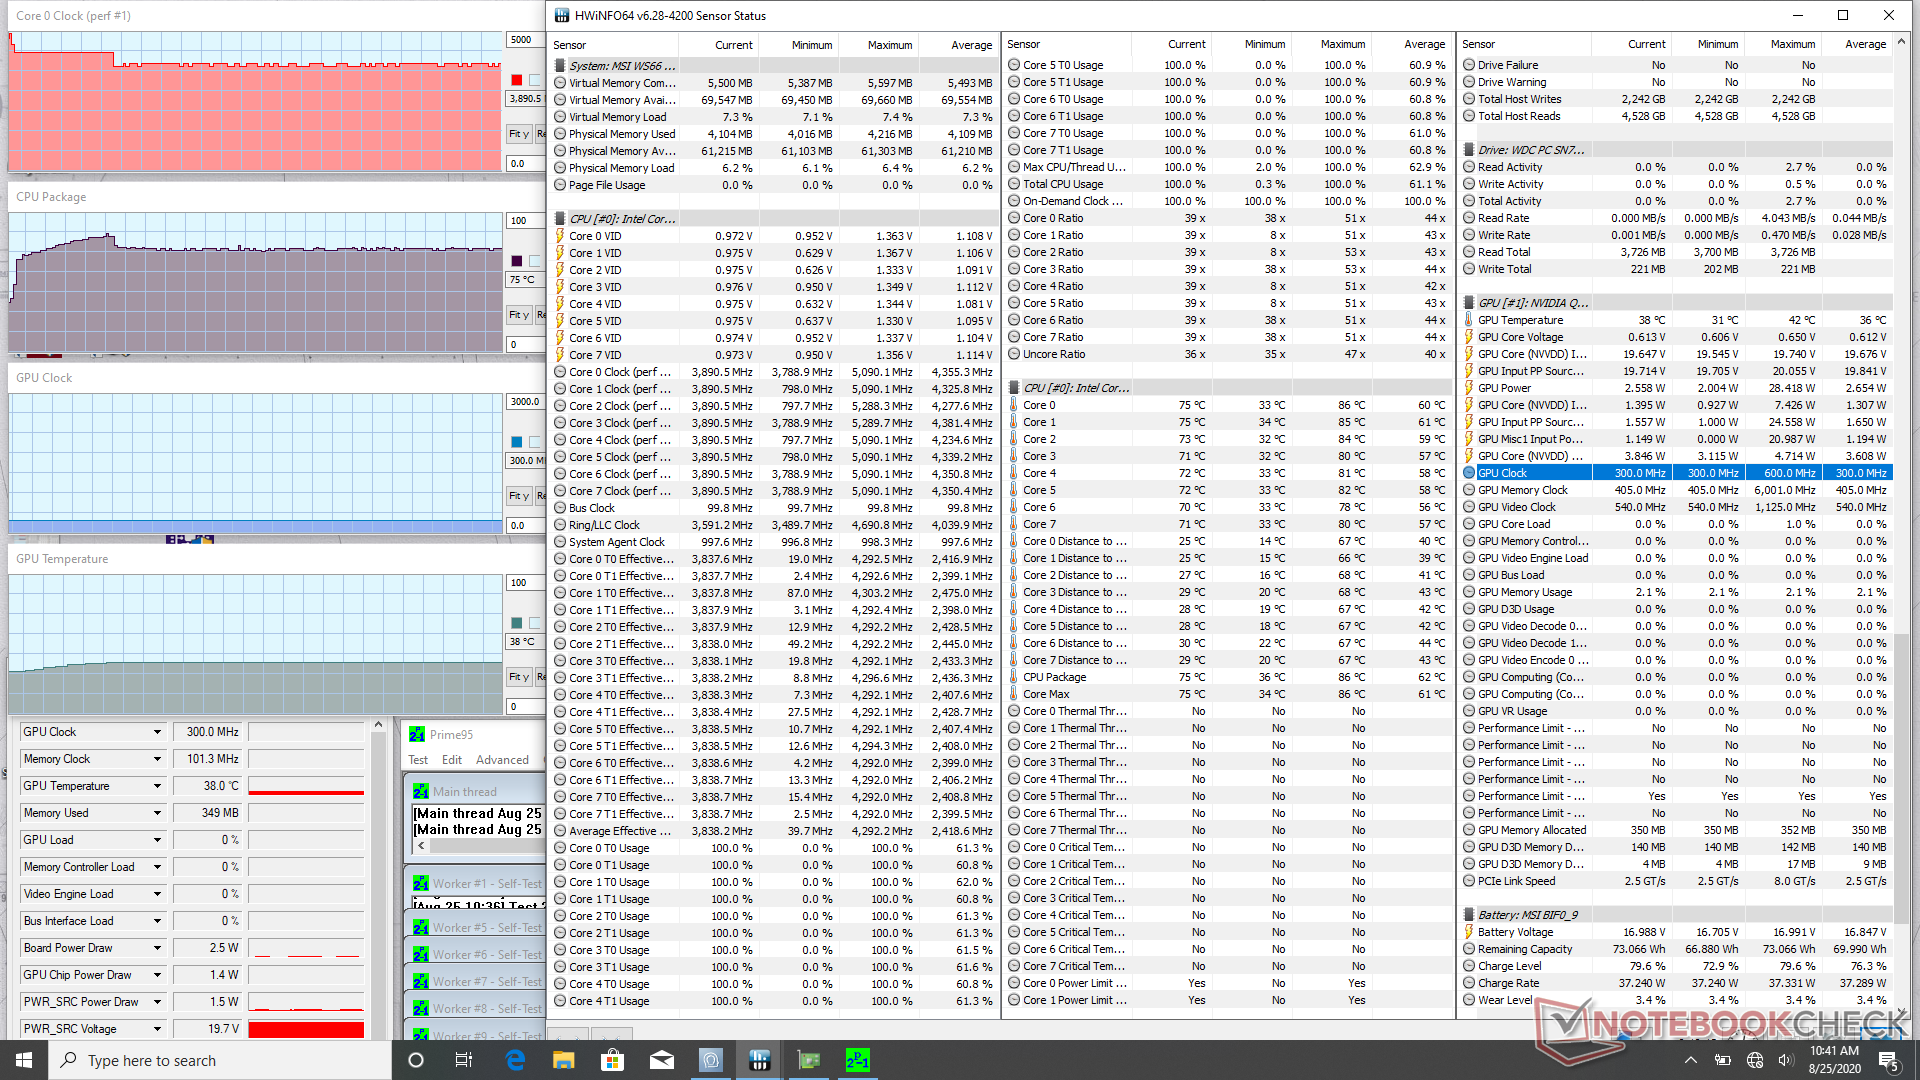
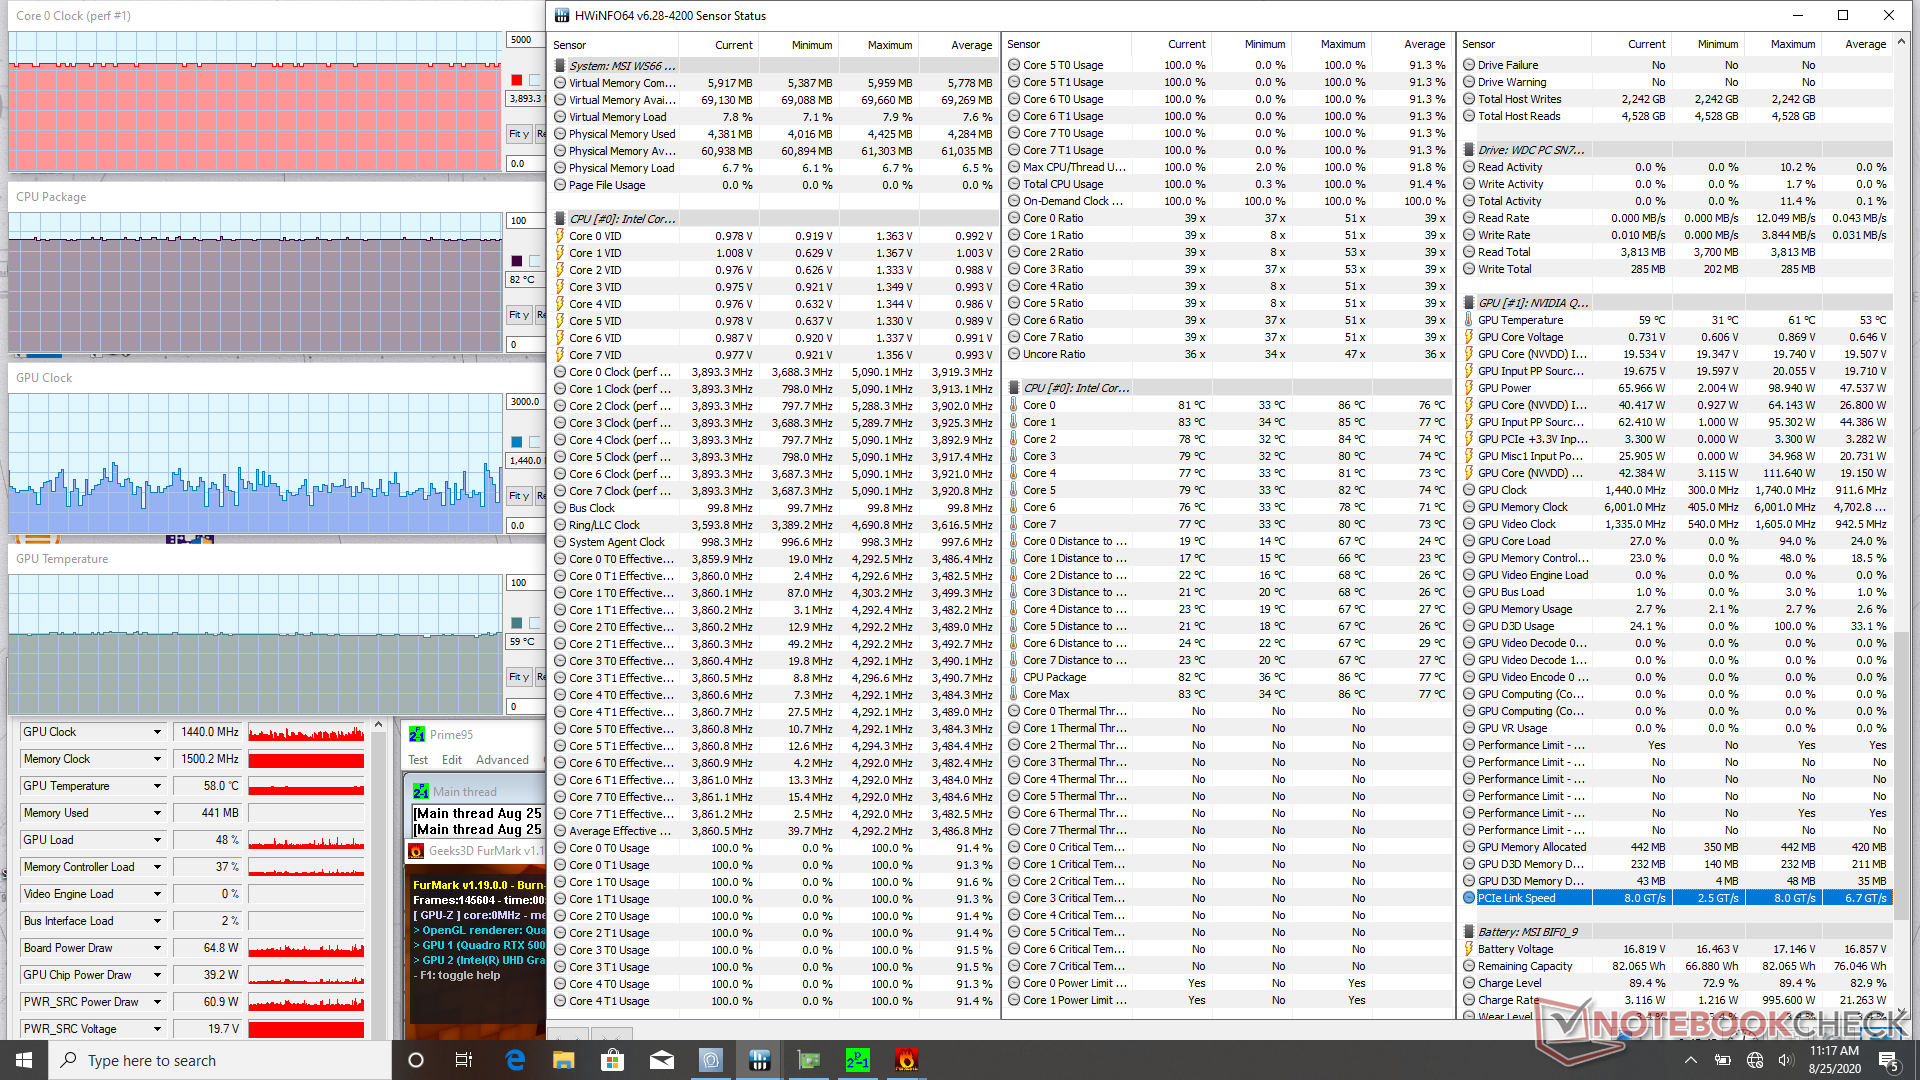
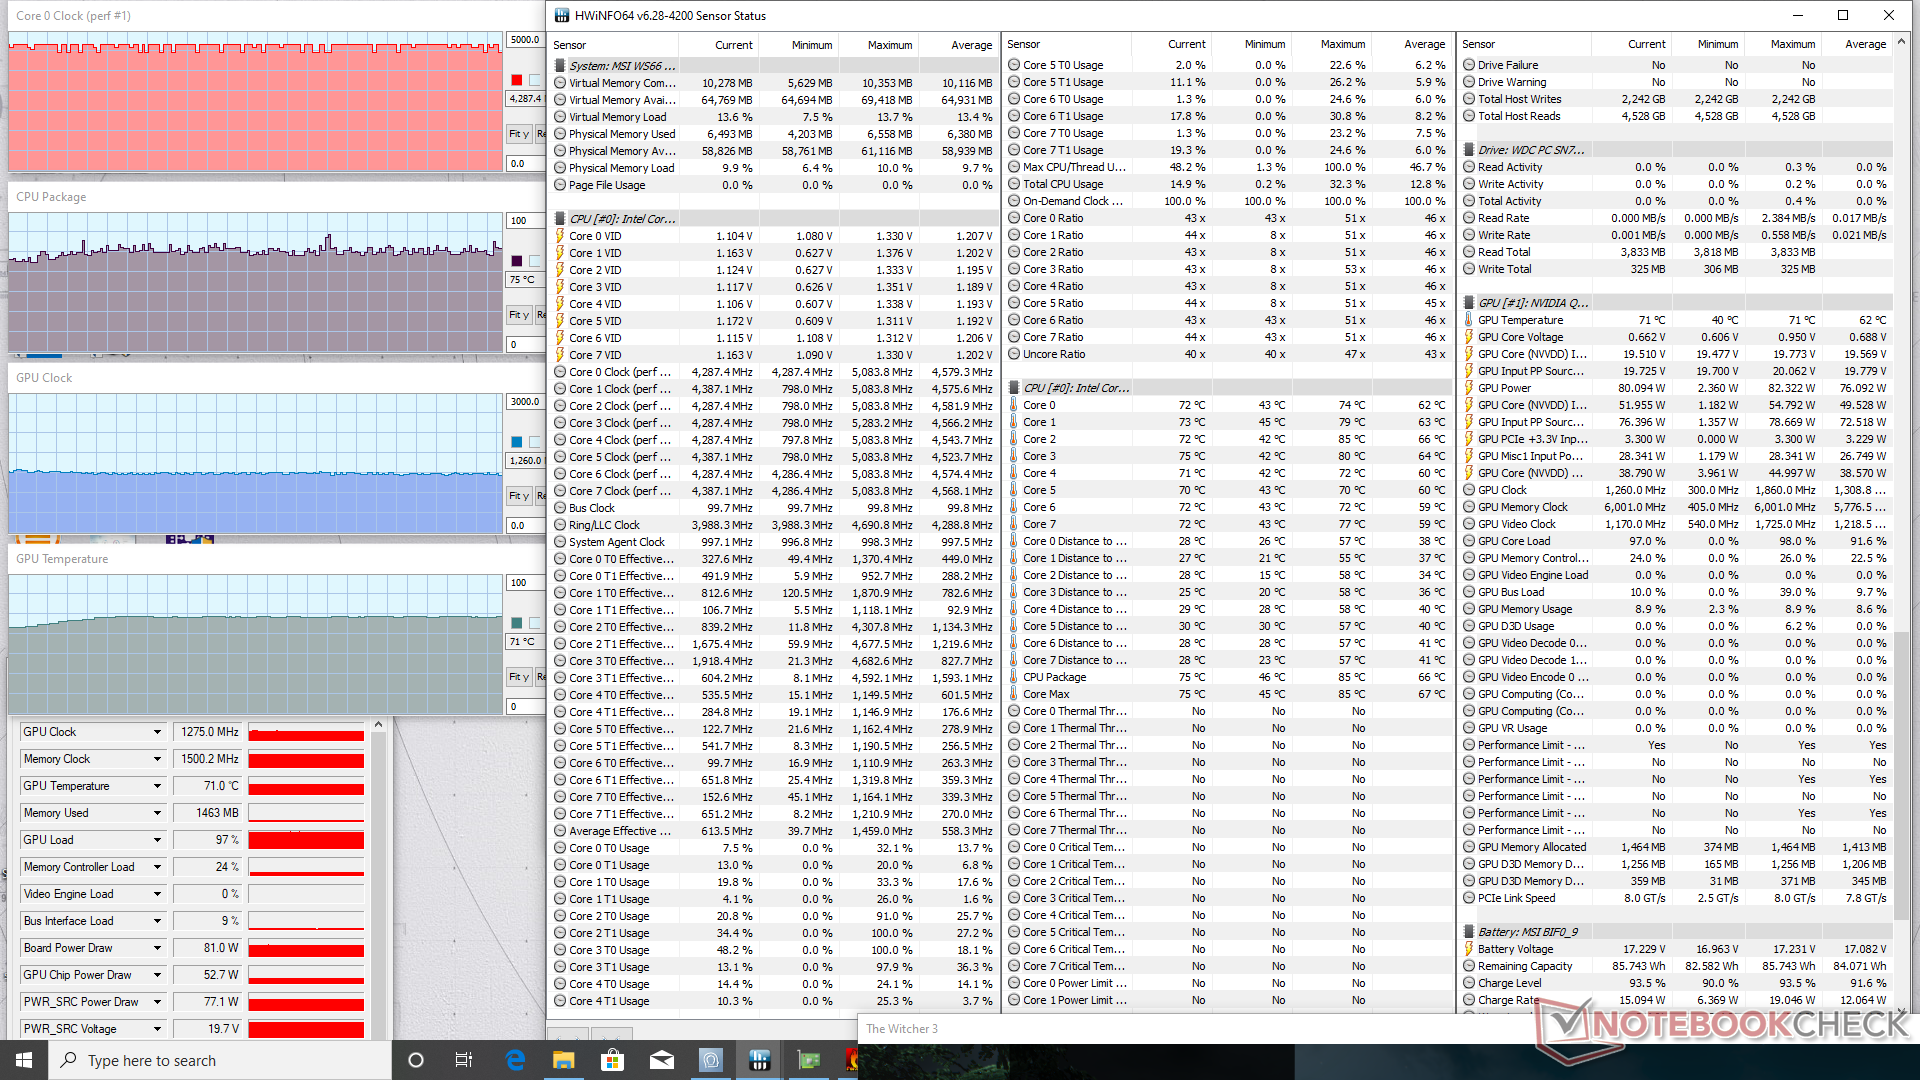
| CPU Clock (GHz) | GPU Clock (MHz) | Average CPU Temperature (°C) | Average GPU Temperature (°C) | |
| System Idle (Cooler Boost on) | -- | -- | 36 | 31 |
| Prime95 Stress (Cooler Boost on) | 3.8 - 3.9 | -- | 75 | 38 |
| Prime95 + FurMark Stress (Cooler Boost on) | 3.8 - 3.9 | ~500 - 1440 | 82 | 59 |
| Witcher 3 Stress (Cooler Boost off) | 4.3 - 4.4 | 1275 | 75 | 71 |
| Witcher 3 Stress (Cooler Boost on) | 4.6 | 1380 | 67 | 60 |
Altoparlanti


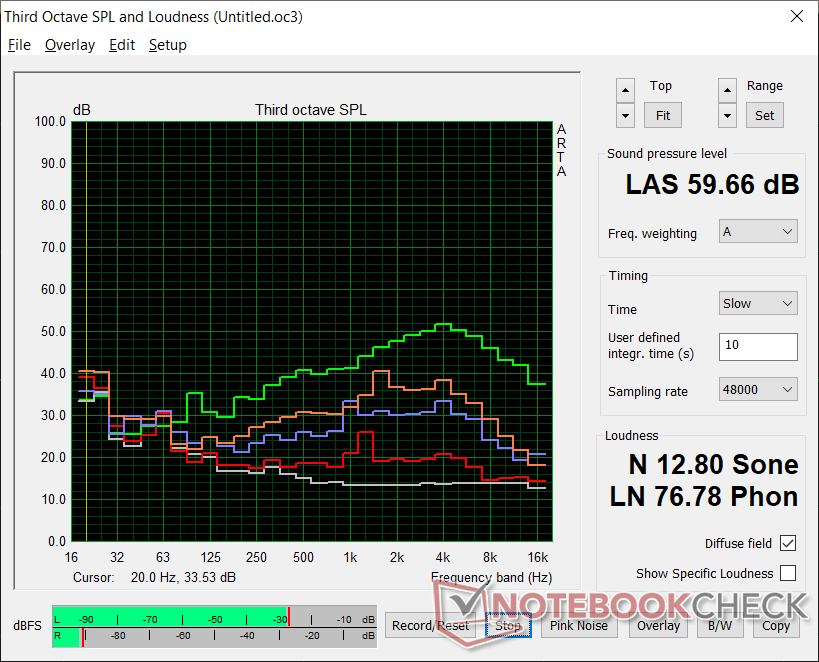
MSI WS66 10TMT-207US analisi audio
(±) | potenza degli altiparlanti media ma buona (80.5 dB)
Bassi 100 - 315 Hz
(-) | quasi nessun basso - in media 22.6% inferiori alla media
(±) | la linearità dei bassi è media (9.8% delta rispetto alla precedente frequenza)
Medi 400 - 2000 Hz
(±) | medi elevati - circa 7.5% superiore alla media
(±) | linearità dei medi adeguata (11.7% delta rispetto alla precedente frequenza)
Alti 2 - 16 kHz
(+) | Alti bilanciati - appena 3.4% dalla media
(±) | la linearità degli alti è media (8.5% delta rispetto alla precedente frequenza)
Nel complesso 100 - 16.000 Hz
(±) | la linearità complessiva del suono è media (26.1% di differenza rispetto alla media
Rispetto alla stessa classe
» 88% di tutti i dispositivi testati in questa classe è stato migliore, 6% simile, 6% peggiore
» Il migliore ha avuto un delta di 7%, medio di 17%, peggiore di 35%
Rispetto a tutti i dispositivi testati
» 80% di tutti i dispositivi testati in questa classe è stato migliore, 4% similare, 16% peggiore
» Il migliore ha avuto un delta di 4%, medio di 24%, peggiore di 134%
Apple MacBook 12 (Early 2016) 1.1 GHz analisi audio
(+) | gli altoparlanti sono relativamente potenti (83.6 dB)
Bassi 100 - 315 Hz
(±) | bassi ridotti - in media 11.3% inferiori alla media
(±) | la linearità dei bassi è media (14.2% delta rispetto alla precedente frequenza)
Medi 400 - 2000 Hz
(+) | medi bilanciati - solo only 2.4% rispetto alla media
(+) | medi lineari (5.5% delta rispetto alla precedente frequenza)
Alti 2 - 16 kHz
(+) | Alti bilanciati - appena 2% dalla media
(+) | alti lineari (4.5% delta rispetto alla precedente frequenza)
Nel complesso 100 - 16.000 Hz
(+) | suono nel complesso lineare (10.2% differenza dalla media)
Rispetto alla stessa classe
» 7% di tutti i dispositivi testati in questa classe è stato migliore, 2% simile, 91% peggiore
» Il migliore ha avuto un delta di 5%, medio di 18%, peggiore di 53%
Rispetto a tutti i dispositivi testati
» 5% di tutti i dispositivi testati in questa classe è stato migliore, 1% similare, 94% peggiore
» Il migliore ha avuto un delta di 4%, medio di 24%, peggiore di 134%
Gestione Energetica
Consumo Energetico
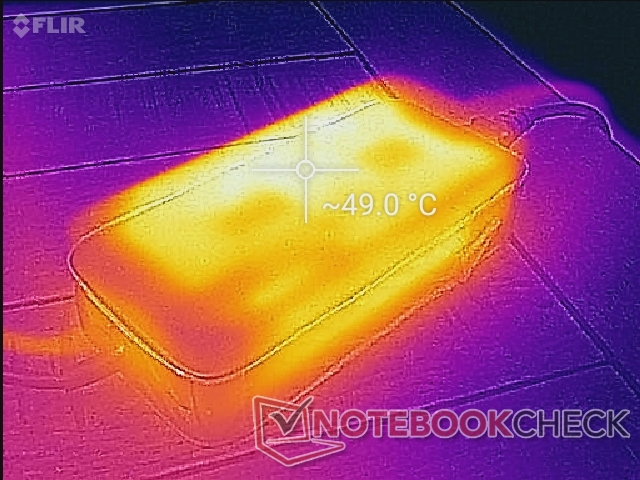
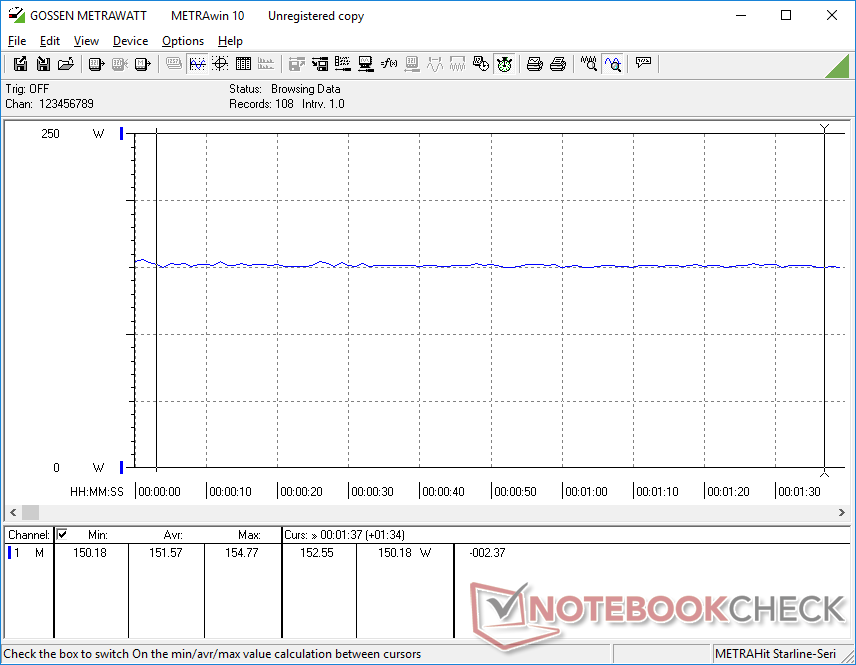
A riposo su una scrivania con l'iGPU attiva e la luminosità impostata al minimo assorbe circa 14 W. Se la luminosità è impostata al massimo, questo sale a 19 W. Il funzionamento a vuoto in modalità Ultra Performance Cooler Boost richiederà 42 W minimo, il che significa che non è la modalità ideale per compiti semplici come lo streaming video o l'invio di e-mail.
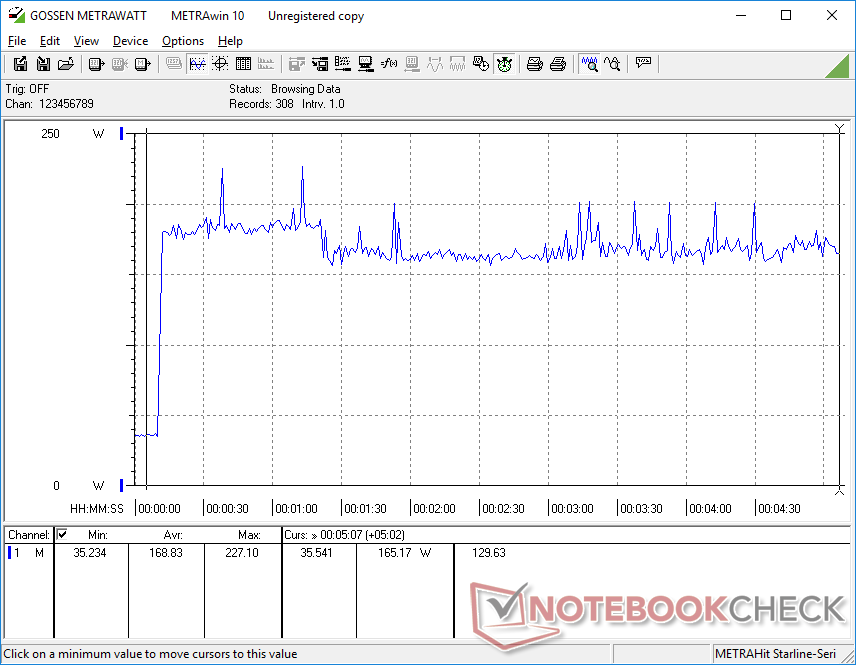
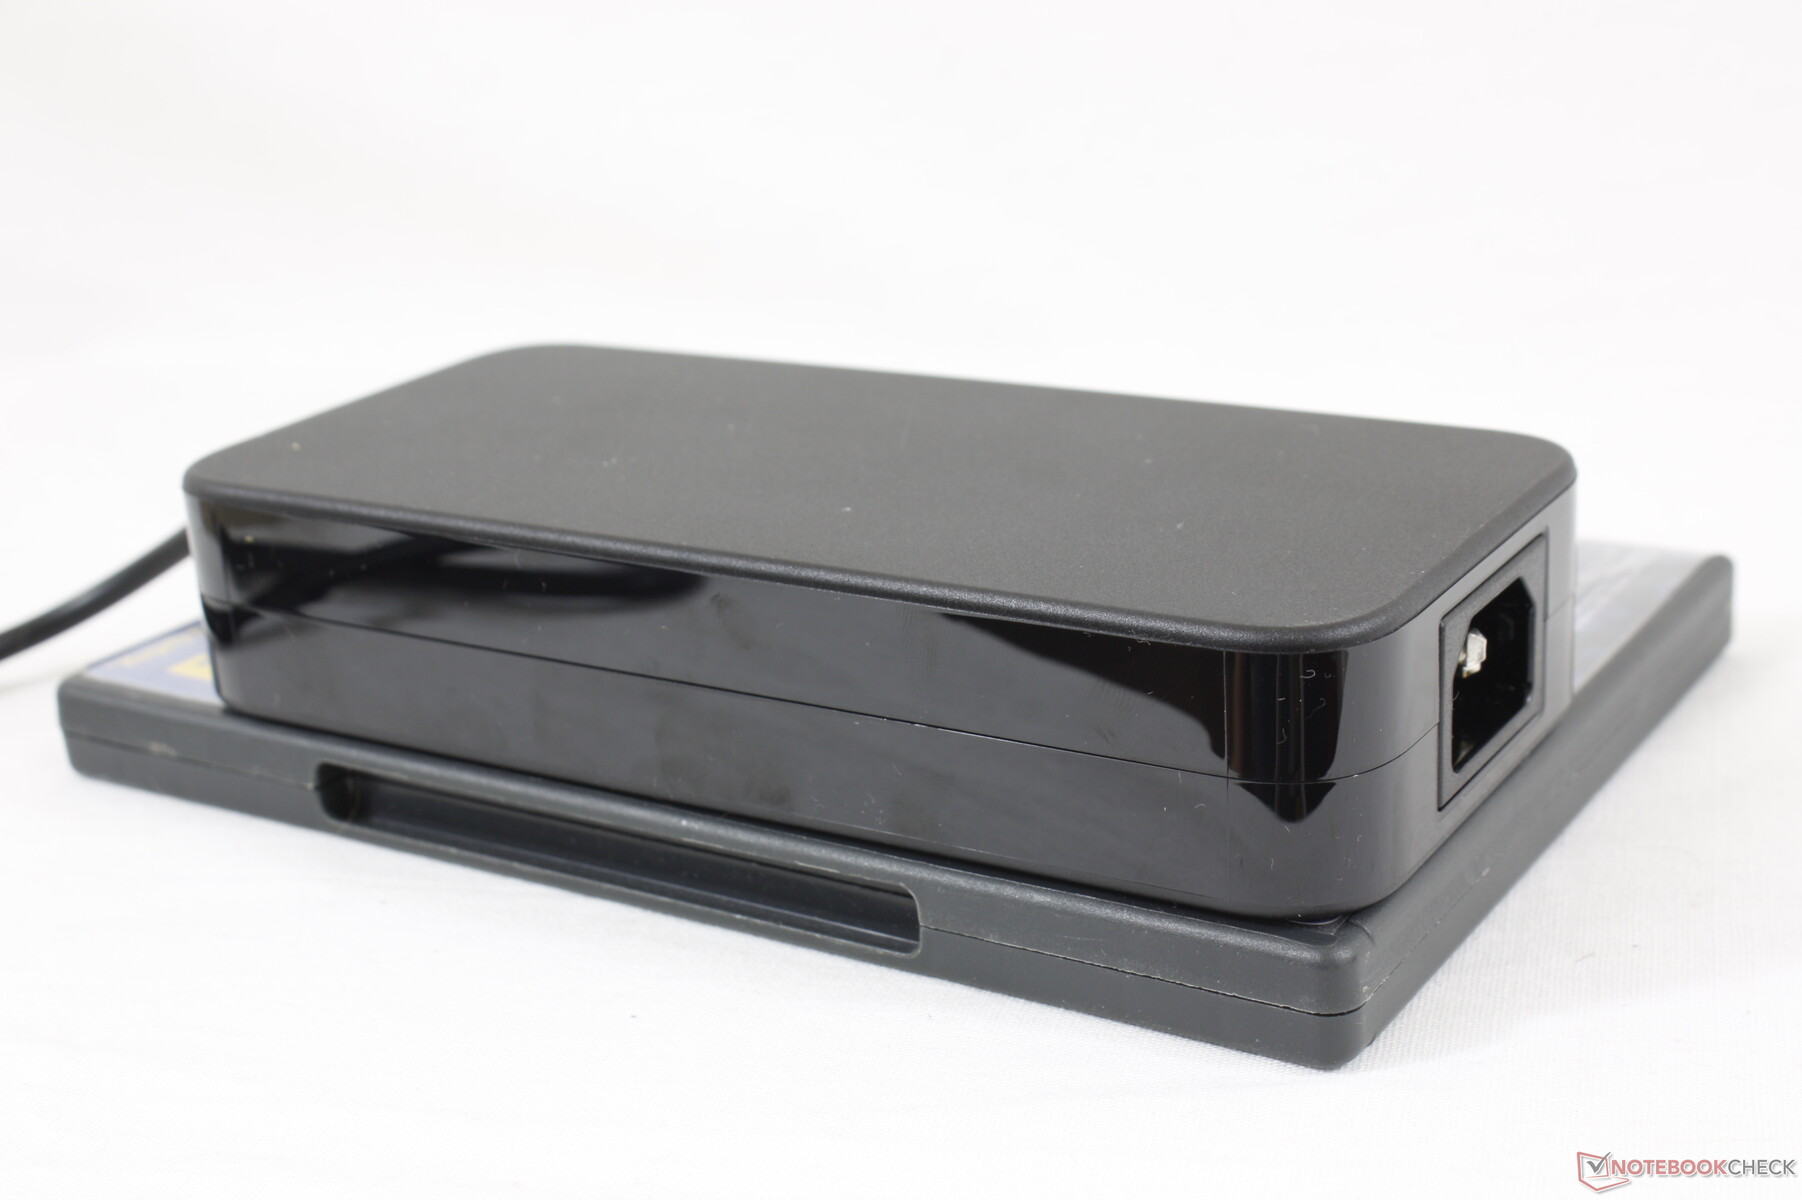
L'esecuzione di carichi stressanti come i giochi comporta un consumo di circa 152 W risultando simile a quello che abbiamo registrato su Dell Precision 7550 o Razer Blade 15 Studio, ciascuno dotato della stessa GPU Quadro RTX 5000 Max-Q. Siamo in grado di registrare picchi temporanei fino a 227 W dall'alimentatore da 230 W di medie dimensioni (16,4 x 7,5 x 3,4 cm) quando sia la CPU che la GPU sono al 100% di utilizzo. Il consumo medio sarà sempre molto più basso, il che significa che il portatile può ancora ricaricarsi a un ritmo decente anche quando si eseguono carichi estremi, a differenza del Precision 5750.

| Off / Standby | |
| Idle | |
| Sotto carico |
|
Leggenda:
min: | |
| MSI WS66 10TMT-207US i9-10980HK, Quadro RTX 5000 Max-Q, WDC PC SN730 SDBPNTY-1T00, IPS, 1920x1080, 15.6" | Dell Precision 7550 W-10885M, Quadro RTX 5000 Max-Q, SK Hynix PC601A NVMe 1TB, IPS, 3840x2160, 15.6" | Dell Precision 5550 P91F i7-10875H, Quadro T2000 Max-Q, SK Hynix PC601A NVMe 1TB, IPS, 3840x2400, 15.6" | Razer Blade 15 Studio Edition 2020 i7-10875H, Quadro RTX 5000 Max-Q, Samsung PM981a MZVLB1T0HBLR, OLED, 3840x2160, 15.6" | MSI WS63VR 7RL-023US i7-7700HQ, Quadro P4000 Max-Q, Toshiba NVMe THNSN5512GPU7, IPS, 3840x2160, 15.6" | Acer ConceptD 3 Pro CN315-71P-73W1 i7-9750H, Quadro T1000 (Laptop), WDC PC SN720 SDAPNTW-512G, IPS, 1920x1080, 15.6" | |
|---|---|---|---|---|---|---|
| Power Consumption | 13% | 40% | 12% | 29% | 58% | |
| Idle Minimum * (Watt) | 13.8 | 8.2 41% | 5.6 59% | 13.4 3% | 13.3 4% | 2.9 79% |
| Idle Average * (Watt) | 18.4 | 16.8 9% | 11.2 39% | 18 2% | 17.2 7% | 5.5 70% |
| Idle Maximum * (Watt) | 41.5 | 24.4 41% | 18.4 56% | 26.1 37% | 17.9 57% | 10.6 74% |
| Load Average * (Watt) | 110.5 | 131 -19% | 114 -3% | 115 -4% | 83.7 24% | 86 22% |
| Witcher 3 ultra * (Watt) | 151.6 | 156.6 -3% | 76.7 49% | 145 4% | 101.9 33% | 83 45% |
| Load Maximum * (Watt) | 227.1 | 201.8 11% | 134.2 41% | 165 27% | 114.3 50% | 100.7 56% |
* ... Meglio usare valori piccoli
Autonomia della batteria
L'autonomia è di appena 8 ore quando si naviga sul web, anche se si imposta il profilo di potenza della Super Batteria MSI. La ricarica della grande batteria da 99,99 Wh richiede circa 2 ore.
Il sistema può ricaricarsi solo attraverso la porta USB-C lungo il bordo sinistro.
| MSI WS66 10TMT-207US i9-10980HK, Quadro RTX 5000 Max-Q, 99.99 Wh | Dell Precision 7550 W-10885M, Quadro RTX 5000 Max-Q, 95 Wh | Dell Precision 5550 P91F i7-10875H, Quadro T2000 Max-Q, 86 Wh | Razer Blade 15 Studio Edition 2020 i7-10875H, Quadro RTX 5000 Max-Q, 80 Wh | MSI WS63VR 7RL-023US i7-7700HQ, Quadro P4000 Max-Q, 48 Wh | Acer ConceptD 3 Pro CN315-71P-73W1 i7-9750H, Quadro T1000 (Laptop), 58.7 Wh | |
|---|---|---|---|---|---|---|
| Autonomia della batteria | 10% | 68% | 15% | -47% | 4% | |
| Reader / Idle (h) | 8.3 | 11.1 34% | 22.6 172% | 8.8 6% | 3.9 -53% | |
| WiFi v1.3 (h) | 7.8 | 8.9 14% | 9 15% | 5.7 -27% | 2.9 -63% | 8.1 4% |
| Load (h) | 1.2 | 1 -17% | 1.4 17% | 2 67% | 0.9 -25% |
Pro
Contro
Giudizio Complessivo
Se volete le prestazioni più veloci possibili da un telaio super-sottile, allora l'MSI WS66 non vi deluderà. La sua CPU Core i9 è costantemente più veloce del Razer Blade 15 Studio, soprattutto perché quest'ultimo è limitato a un Core i7.
La mentalità "performance a tutti i costi" del WS66 ha la sua giusta dose di svantaggi. In particolare, il rumore delle ventole è significativamente più forte rispetto al già citato Razer e alla maggior parte delle altre workstations. Inoltre, le origini gaming del WS66 ultra-sottile fanno sì che il sistema escluda molte caratteristiche di base che hanno le workstations tradizionali. Dovrete guardare modelli più ingombranti come il Dell Precision 7550, Lenovo ThinkPad P53 o l'HP ZBook 15 se caratteristiche come i lettori di Smart Card, l'ampia gamma di colori, i pulsanti del mouse, i tasti NumPad, NFC, SIM o le opzioni del pannello opaco sono importanti per il vostro lavoro.
L'MSI WS66 è focalizzato sul laser per massimizzare le prestazioni per essere più veloce di quanto il suo design sottile possa suggerire. Le caratteristiche ausiliarie rappresentano i lati negativi e il rumore della ventola sarà molto alto se si vuole il massimo dal sistema.
MSI WS66 10TMT-207US
- 08/30/2020 v7 (old)
Allen Ngo
Price comparison
