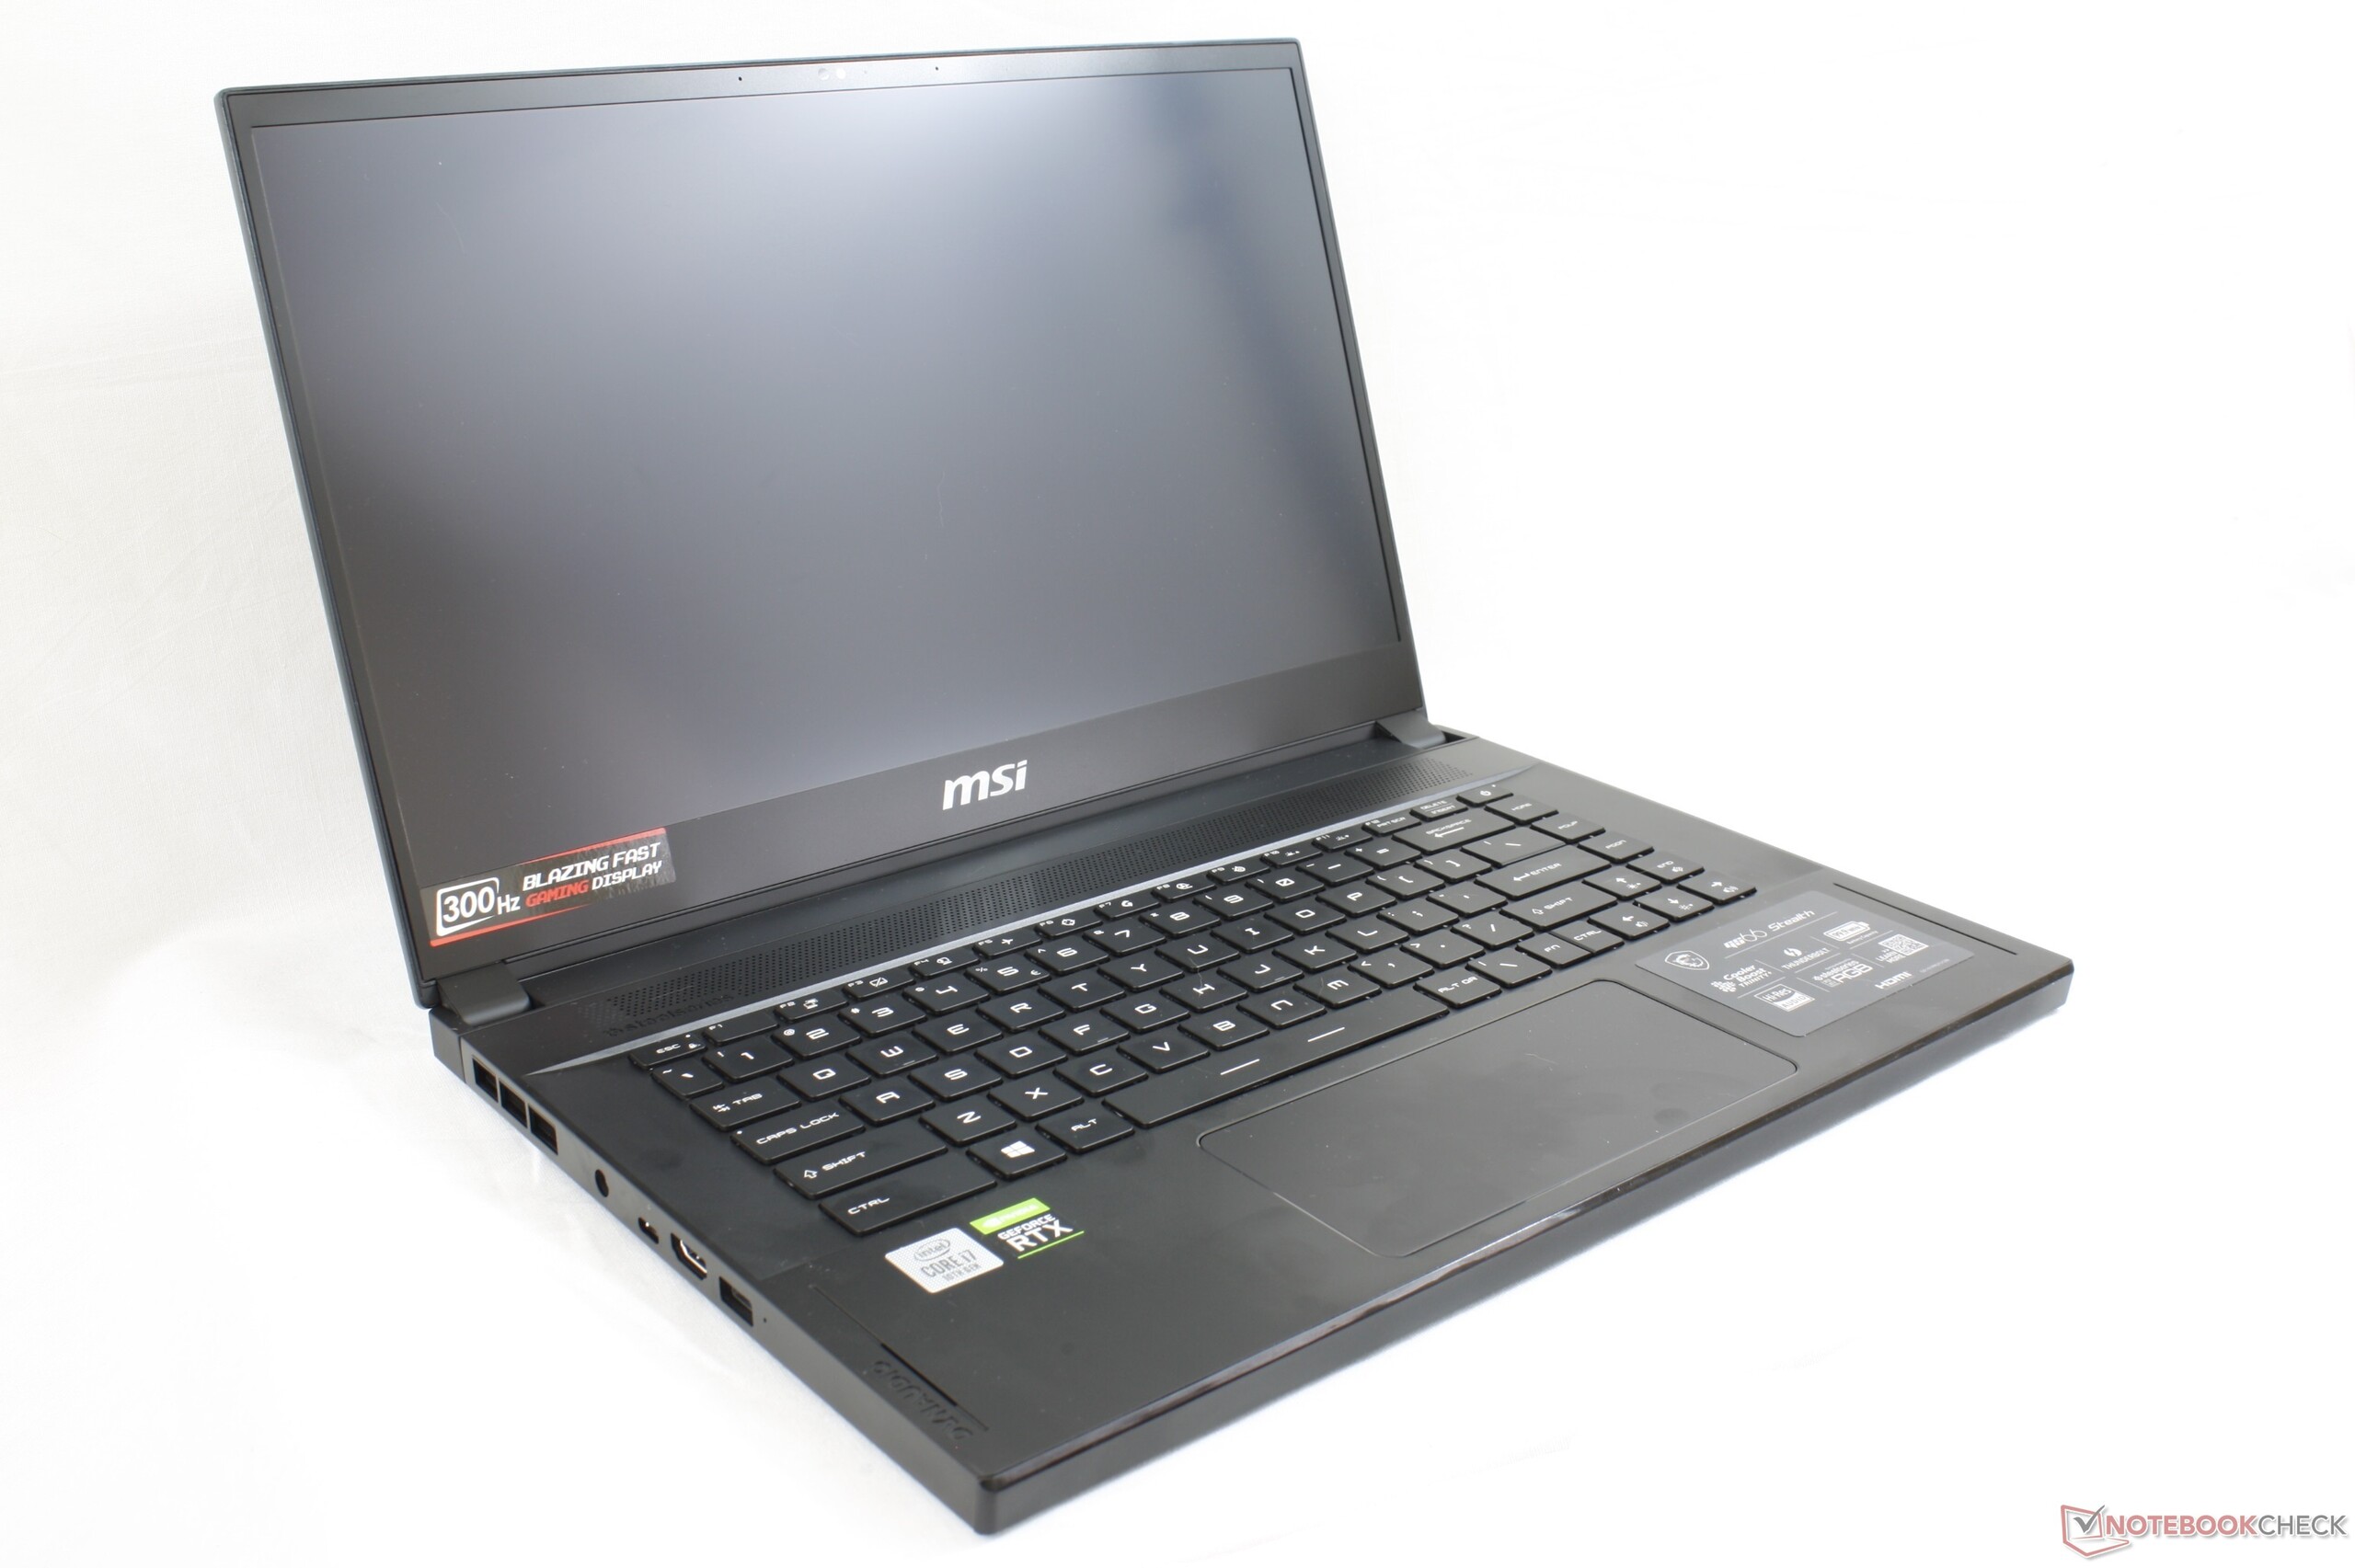
Recensione del Laptop MSI GS66 Stealth 10SGS: Core i7 o Core i9?
Ci vuole più di una sola versione per avere un'idea dell'intera serie. Dopo aver appena controllato l'MSI GS66 10SFS con la CPU Core i9-10980HK e la GPU GeForce RTX 2070 Super Max-Q, siamo ora pronti ad affrontare il GS66 10SGS configurato con il Core i7-10750H e la GeForce RTX 2080 Super Max-Q invece. Quali differenze possono aspettarsi gli utenti tra le due SKU e una è più raccomandabile dell'altra?
La configurazione testata qui sotto può essere trovata su Xotic PC per $2700 USD. Il GS66 succede direttamente al GS65 e compete direttamente con altri portatili gaming ultra-sottili di fascia alta come il Razer Blade 15, l'Asus Zephyrus S GX531, il Dell Alienware m15 R2, il Gigabyte Aorus series, il Lenovo Legion Y740-15, e l'Acer Predator Triton.
Altre recensioni MSI:
Punteggio | Data | Modello | Peso | Altezza | Dimensione | Risoluzione | Prezzo |
|---|---|---|---|---|---|---|---|
| 84 % v7 (old) | 05/2020 | MSI GS66 10SGS i7-10750H, GeForce RTX 2080 Super Max-Q | 2.2 kg | 20 mm | 15.60" | 1920x1080 | |
| 81.3 % v7 (old) | 05/2019 | Asus Zephyrus S GX502GW i7-9750H, GeForce RTX 2070 Mobile | 2.1 kg | 19 mm | 15.60" | 1920x1080 | |
| 88.8 % v6 (old) | 05/2019 | Razer Blade 15 RTX 2080 Max-Q i7-9750H, GeForce RTX 2080 Max-Q | 2.2 kg | 17.8 mm | 15.60" | 1920x1080 | |
| 84.8 % v7 (old) | 10/2019 | Lenovo Legion Y740-15ICHg i7-9750H, GeForce RTX 2070 Max-Q | 2.3 kg | 25 mm | 15.60" | 1920x1080 | |
| 83.3 % v7 (old) | 02/2020 | Schenker XMG Pro 15 i7-9750H, GeForce RTX 2070 Mobile | 2.5 kg | 30 mm | 15.60" | 1920x1080 |
Case
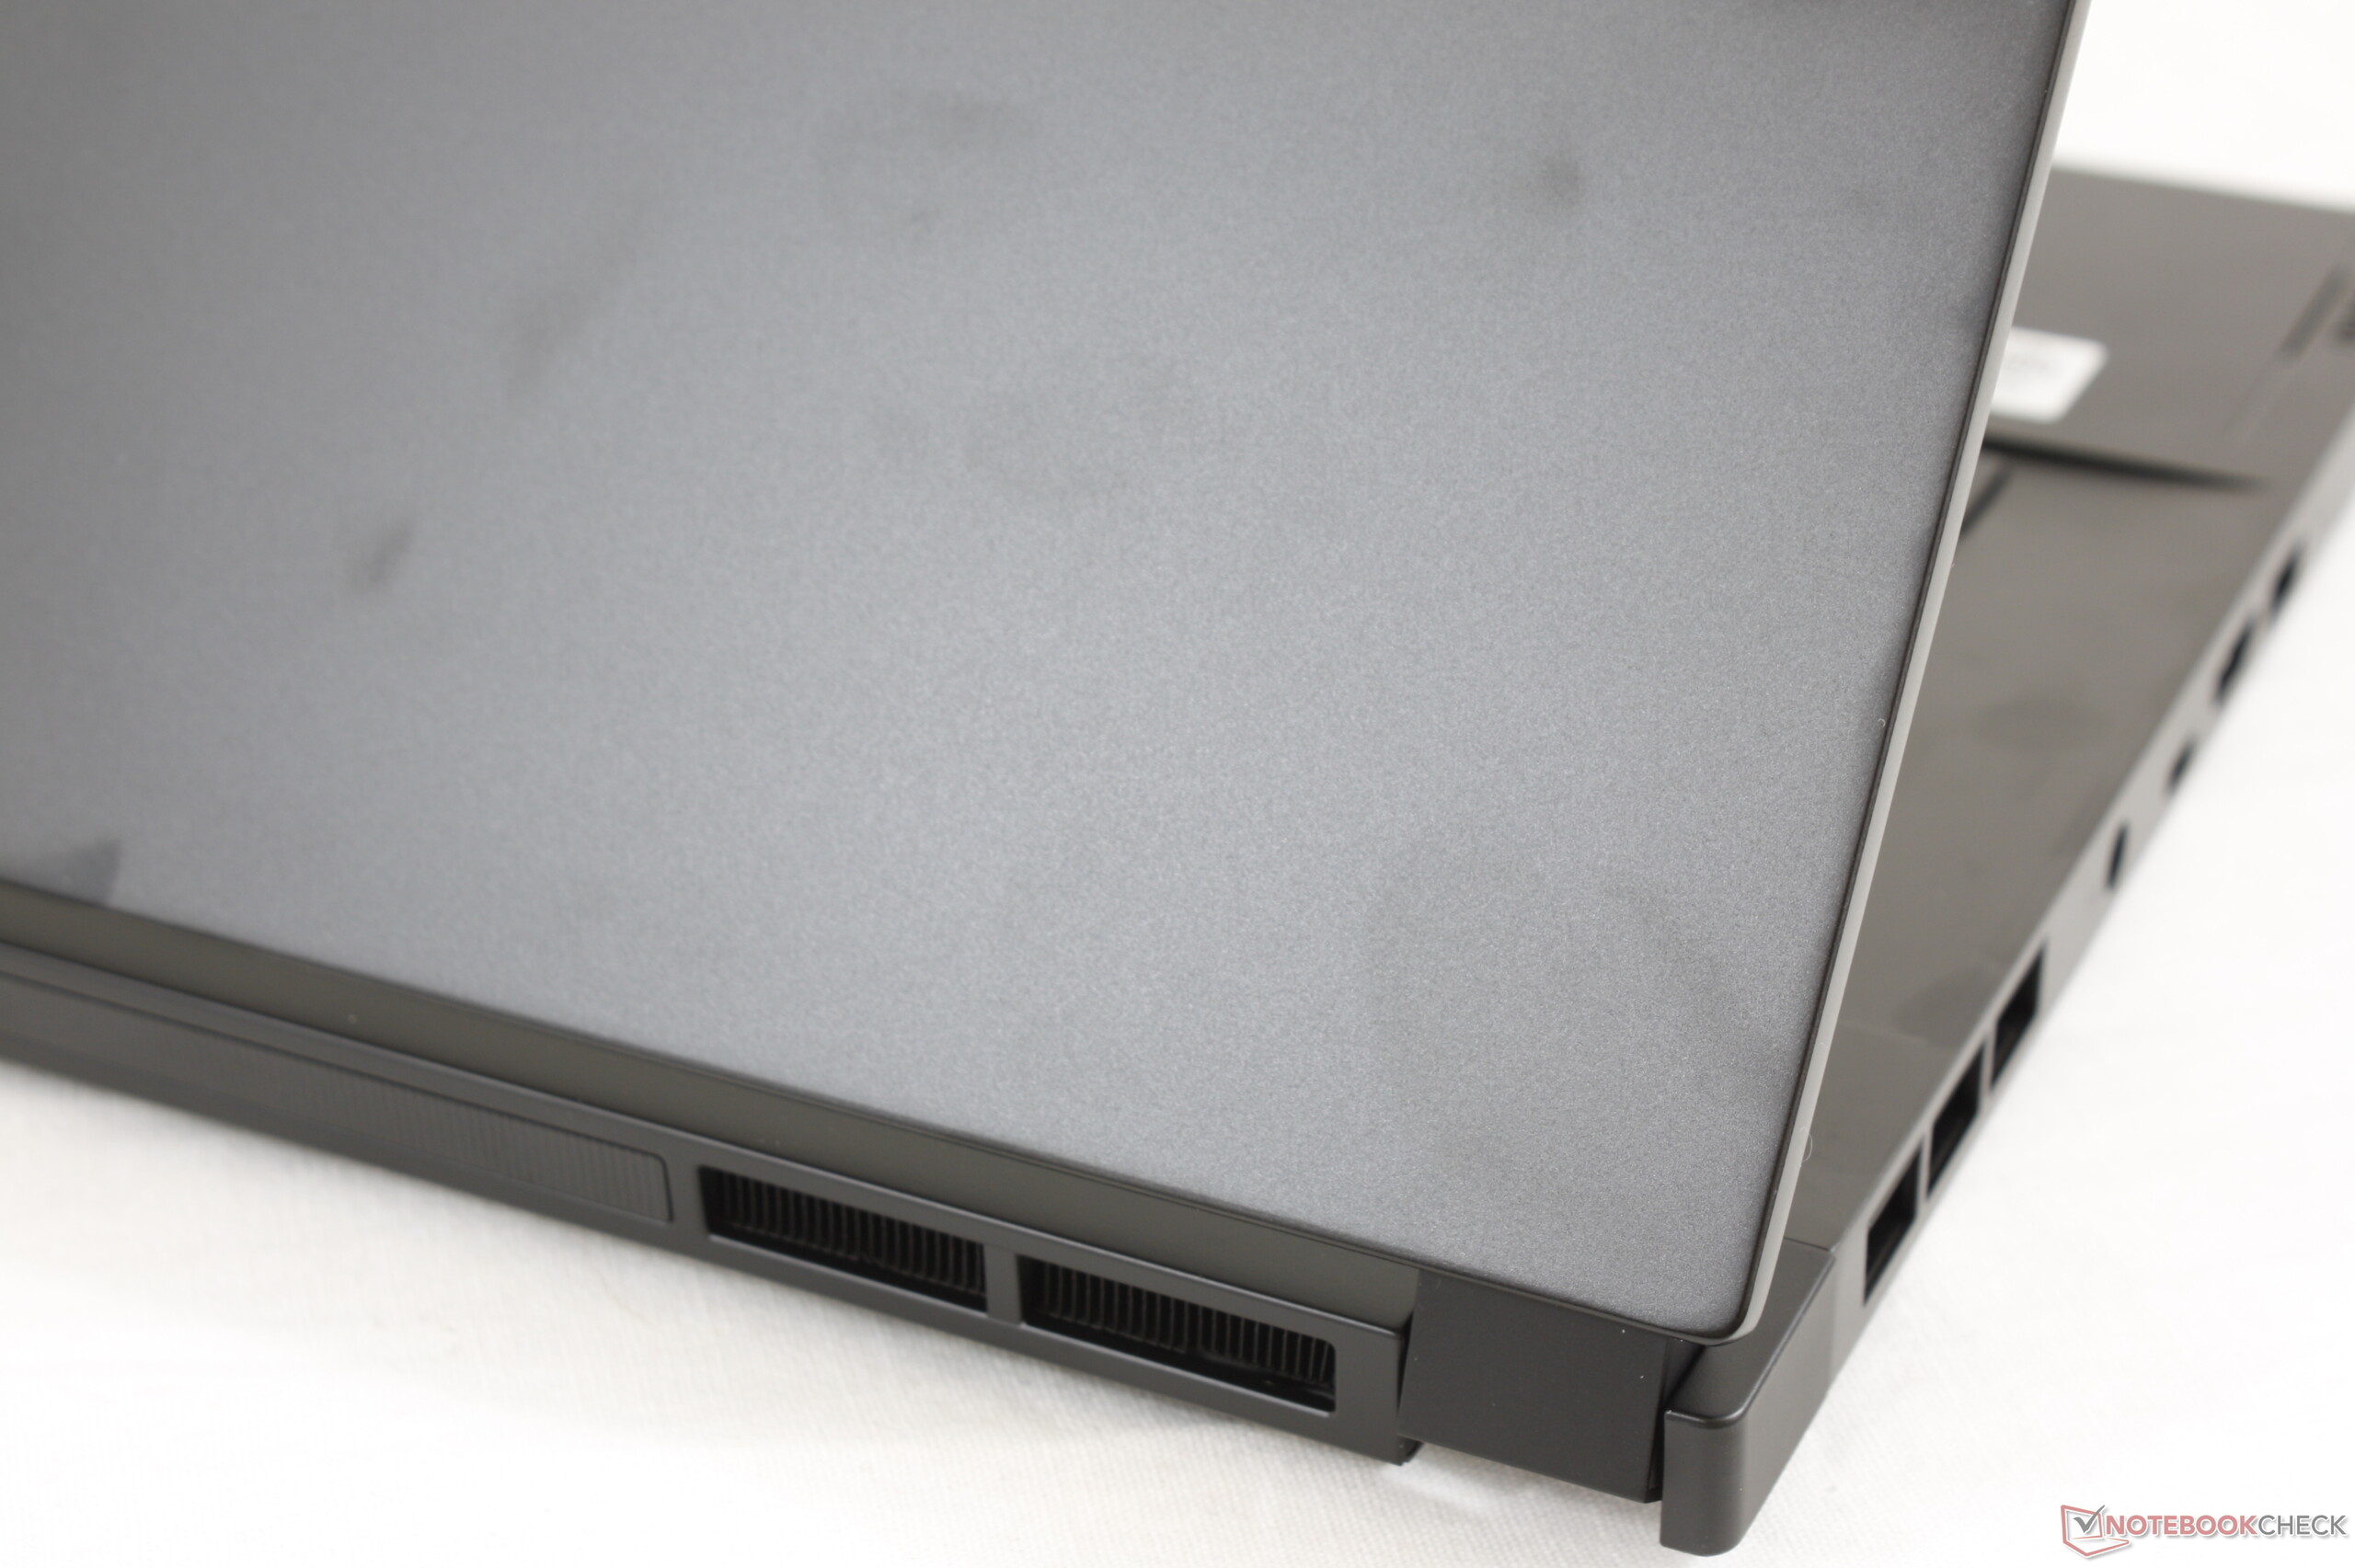
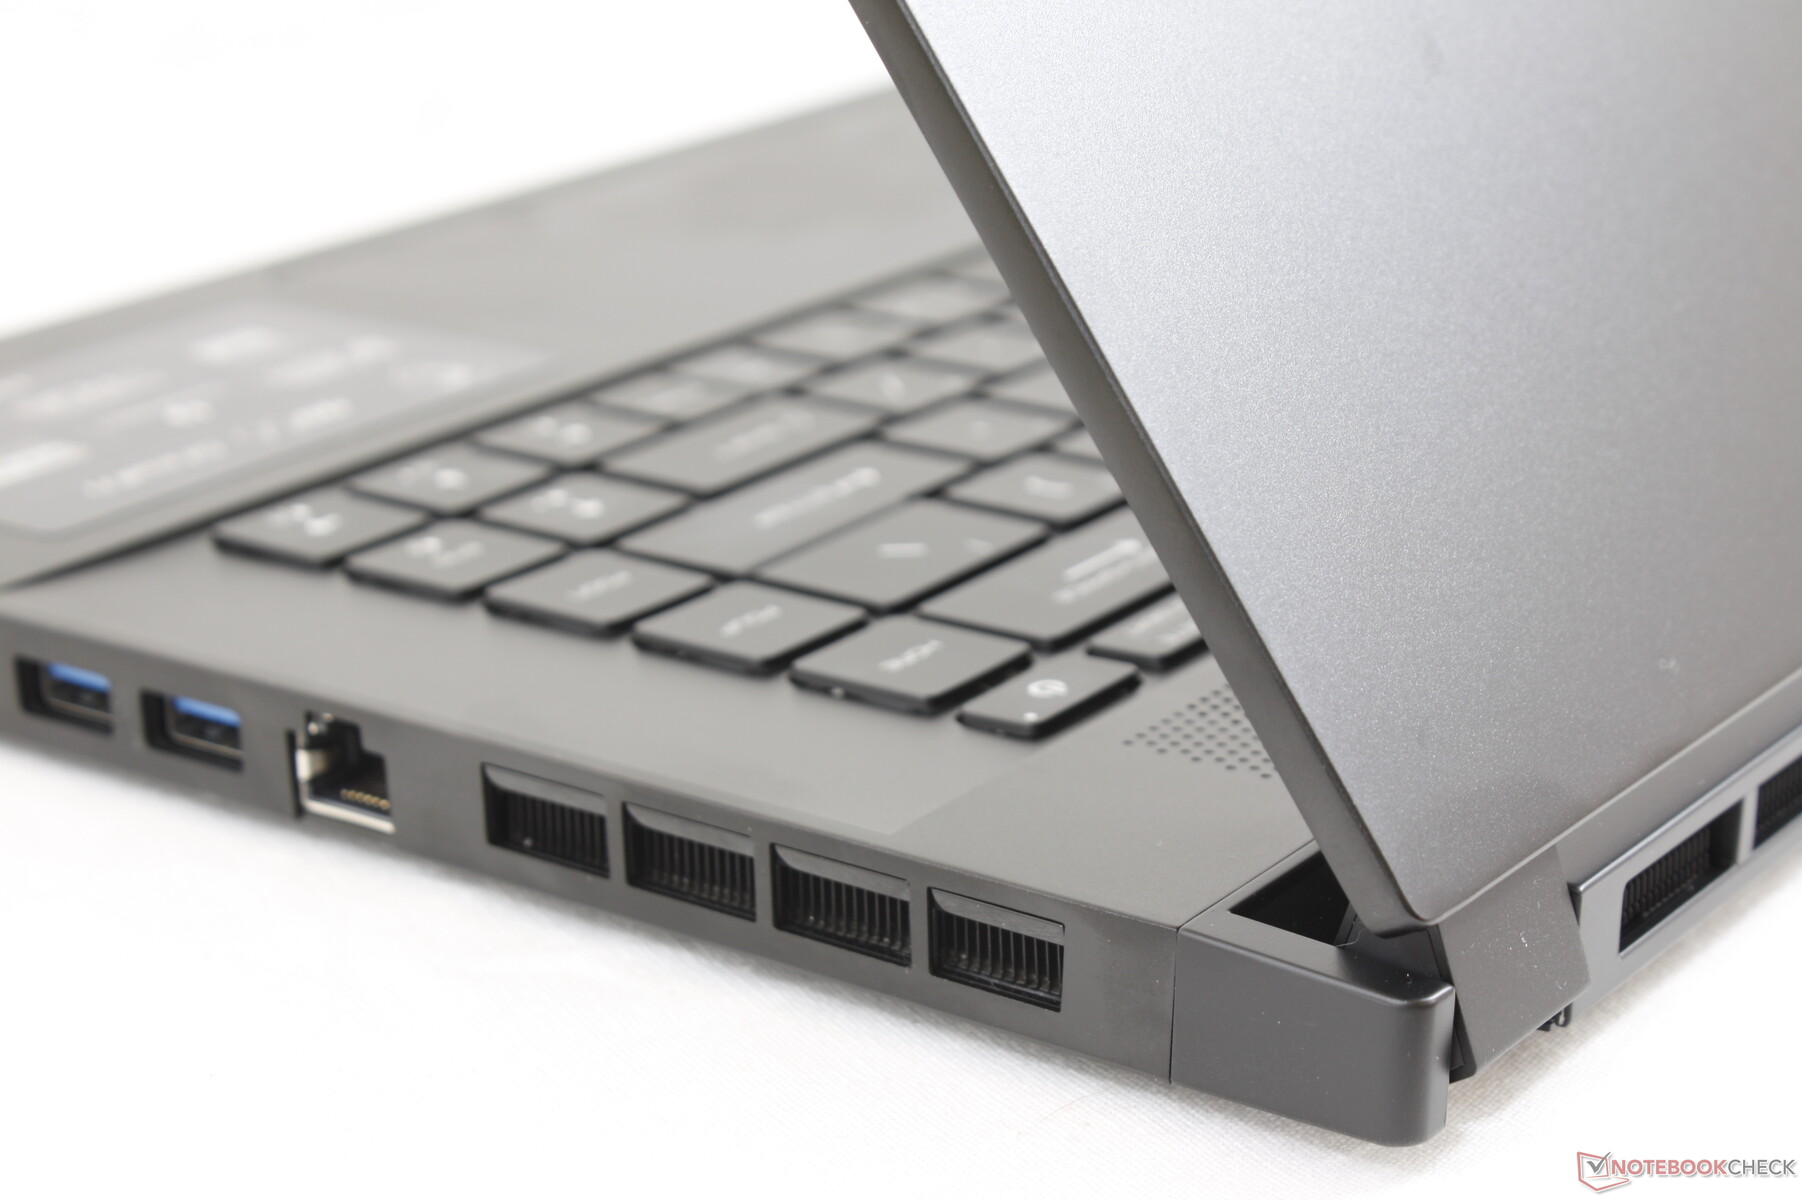
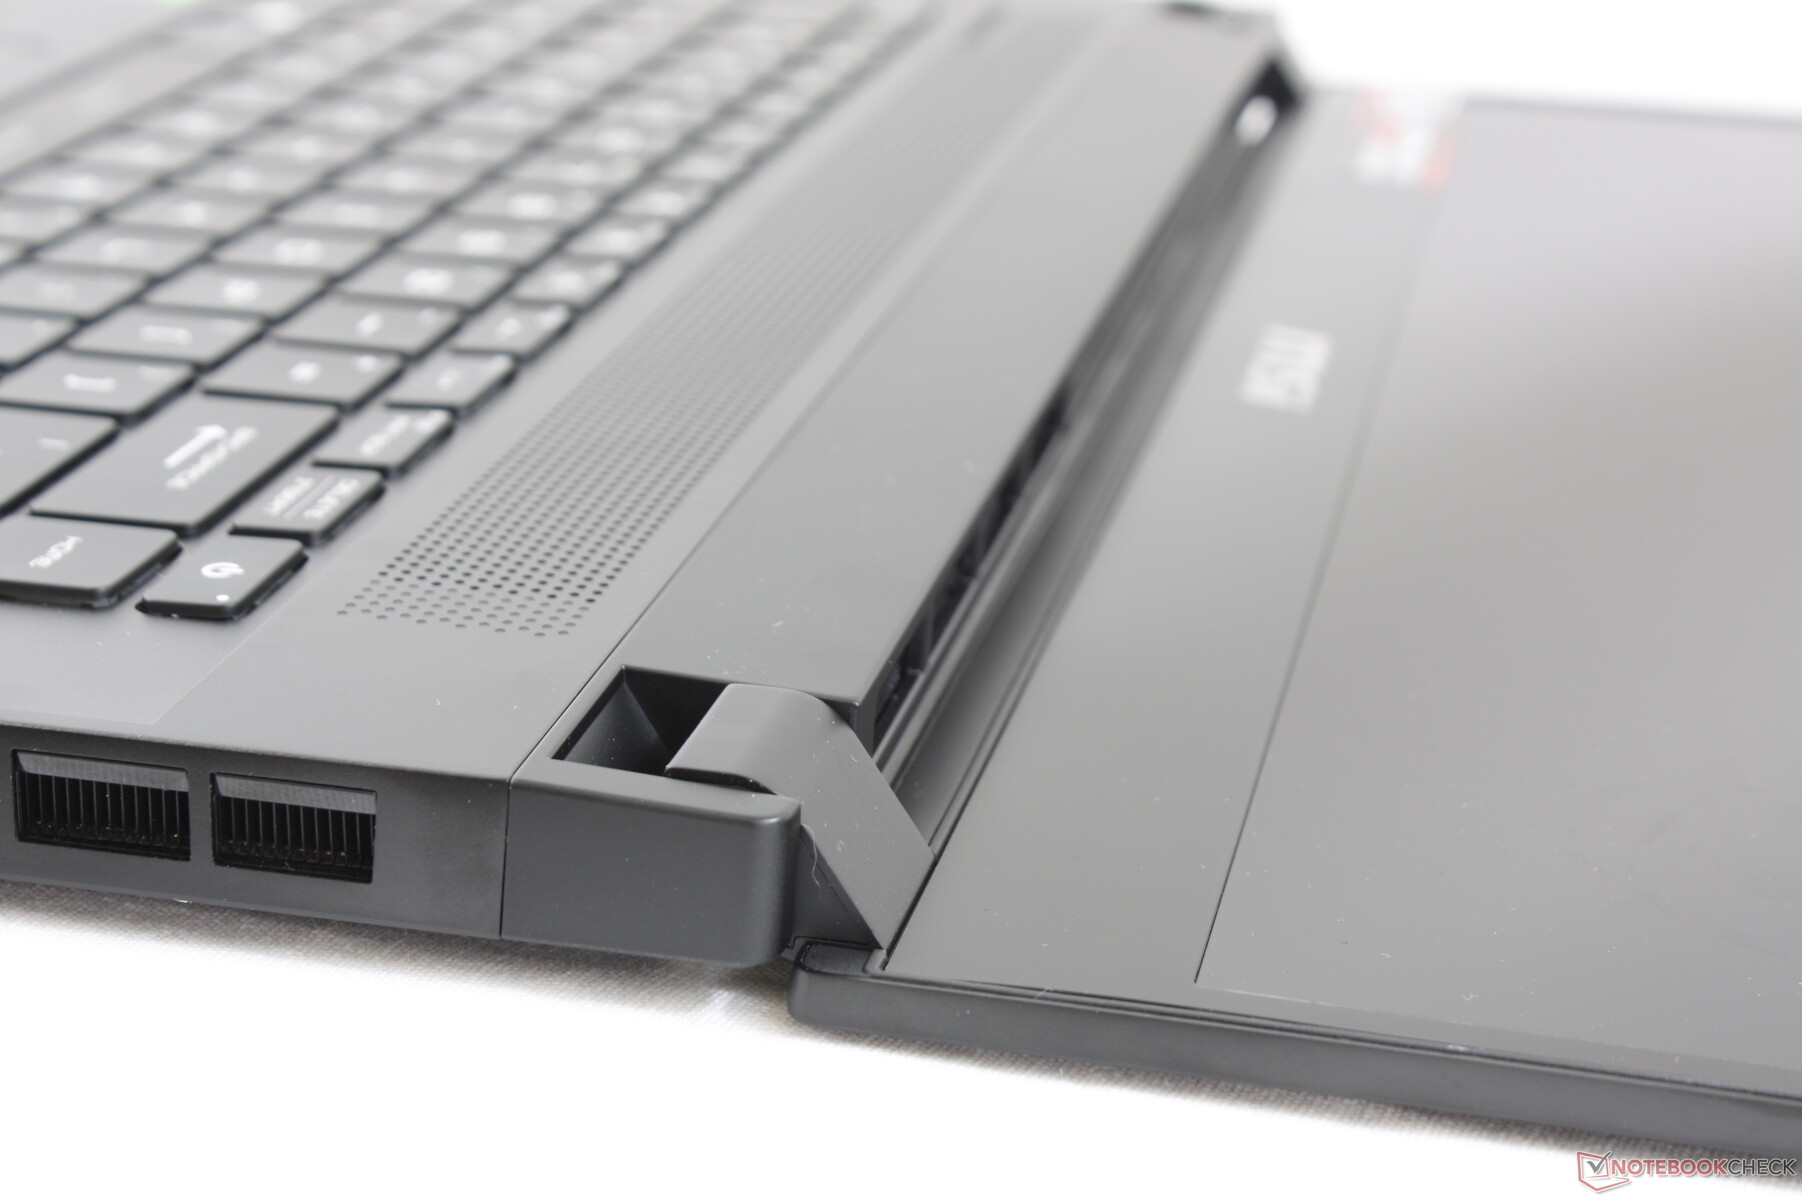
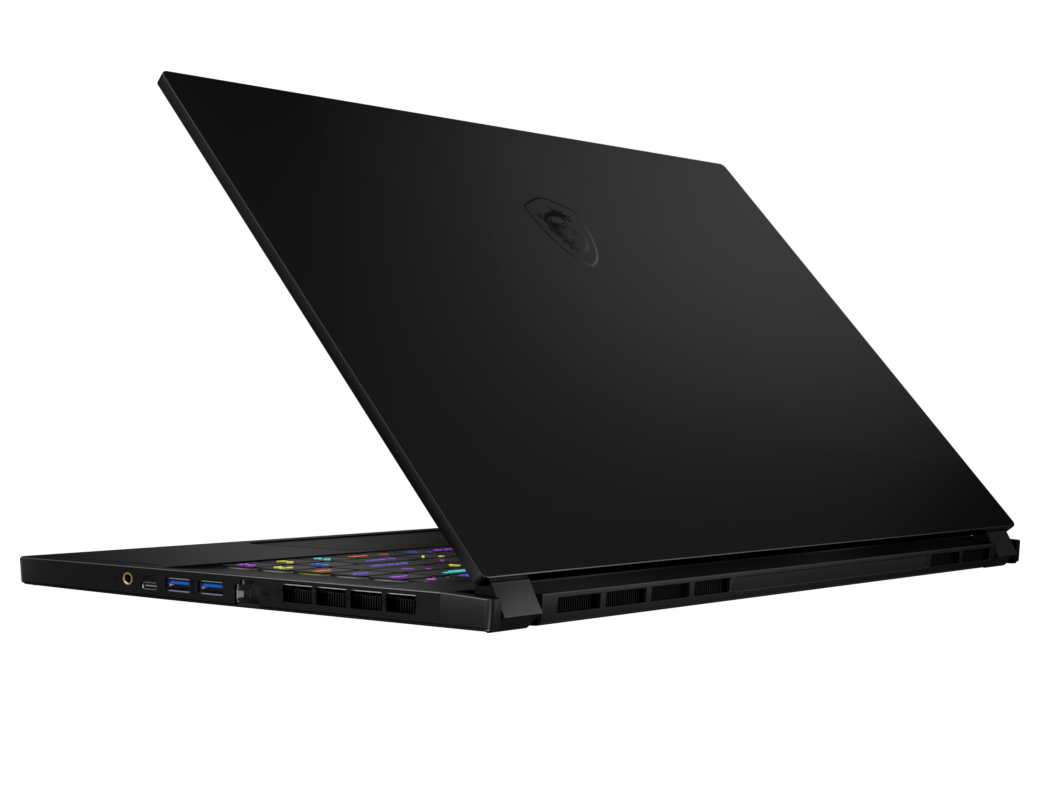
Una delle principali critiche al GS65 è stato il telaio flessibile rispetto alle alternative più robuste e rigide come il Razer Blade 15. Il GS66 affronta questo problema revisionando il telaio per renderlo più solido e meno soggetto a piegamenti. È sicuramente uno dei miglioramenti più grandi e più evidenti rispetto al GS65.
Ci sono ancora un paio di inconvenienti al nuovo design in metallo. In primo luogo, il telaio si piega ancora e scricchiola un po' di più del Razer quando lo si torce dagli angoli. In secondo luogo, non è un telaio unibody nonostante il suo elegante aspetto tutto nero; il bordo anteriore e posteriore, per esempio, sono fatti di pezzi separati, il che significa che c'è spazio per spazi vuoti e fessure irregolari tra i materiali.
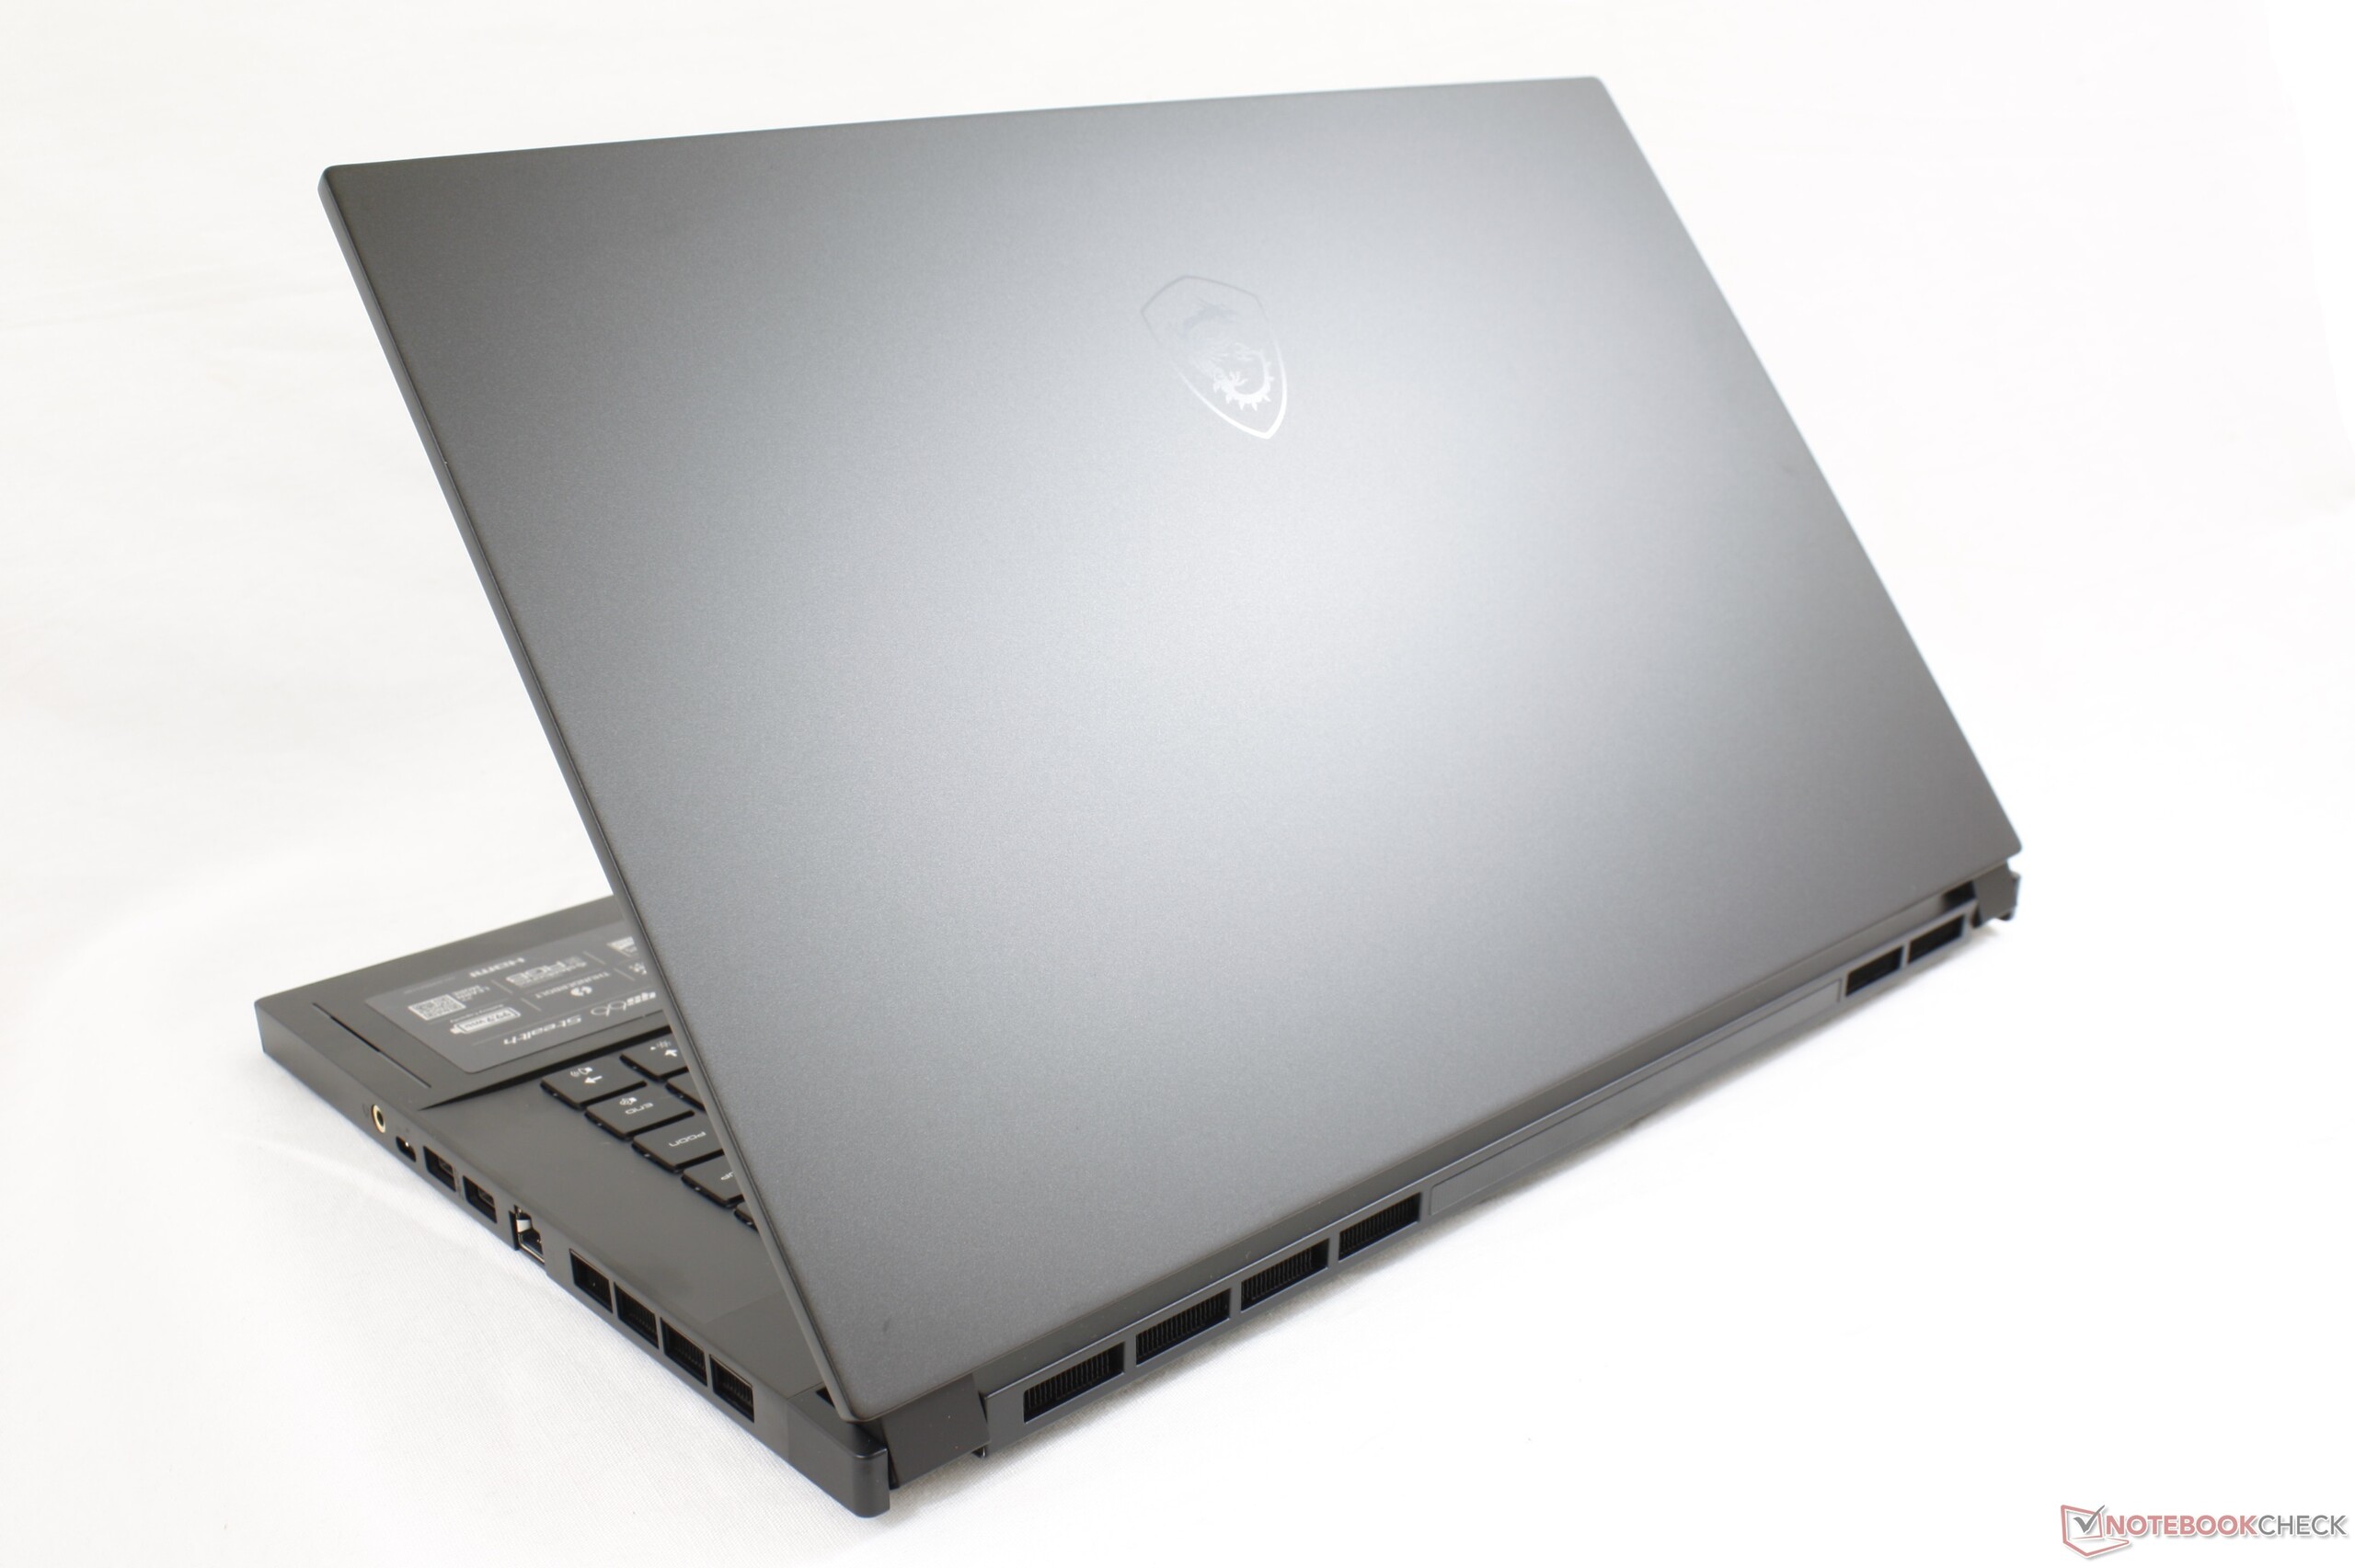
Per rinforzare il telaio e aggiungere una batteria più grande, MSI ha dovuto aumentare sia lo spessore che il peso di circa 2 mm e 200 g, rispettivamente, rispetto al vecchio modello GS65. MSI aveva uno dei laptop gaming da 15,6 pollici più leggeri sul mercato con il GS65 e quindi è un po' una seccatura che il nuovo modello sia notevolmente più pesante. Tuttavia, la mossa è probabilmente positiva in quanto il sistema risulta migliore e più duraturo rispetto al suo predecessore.
Connettività
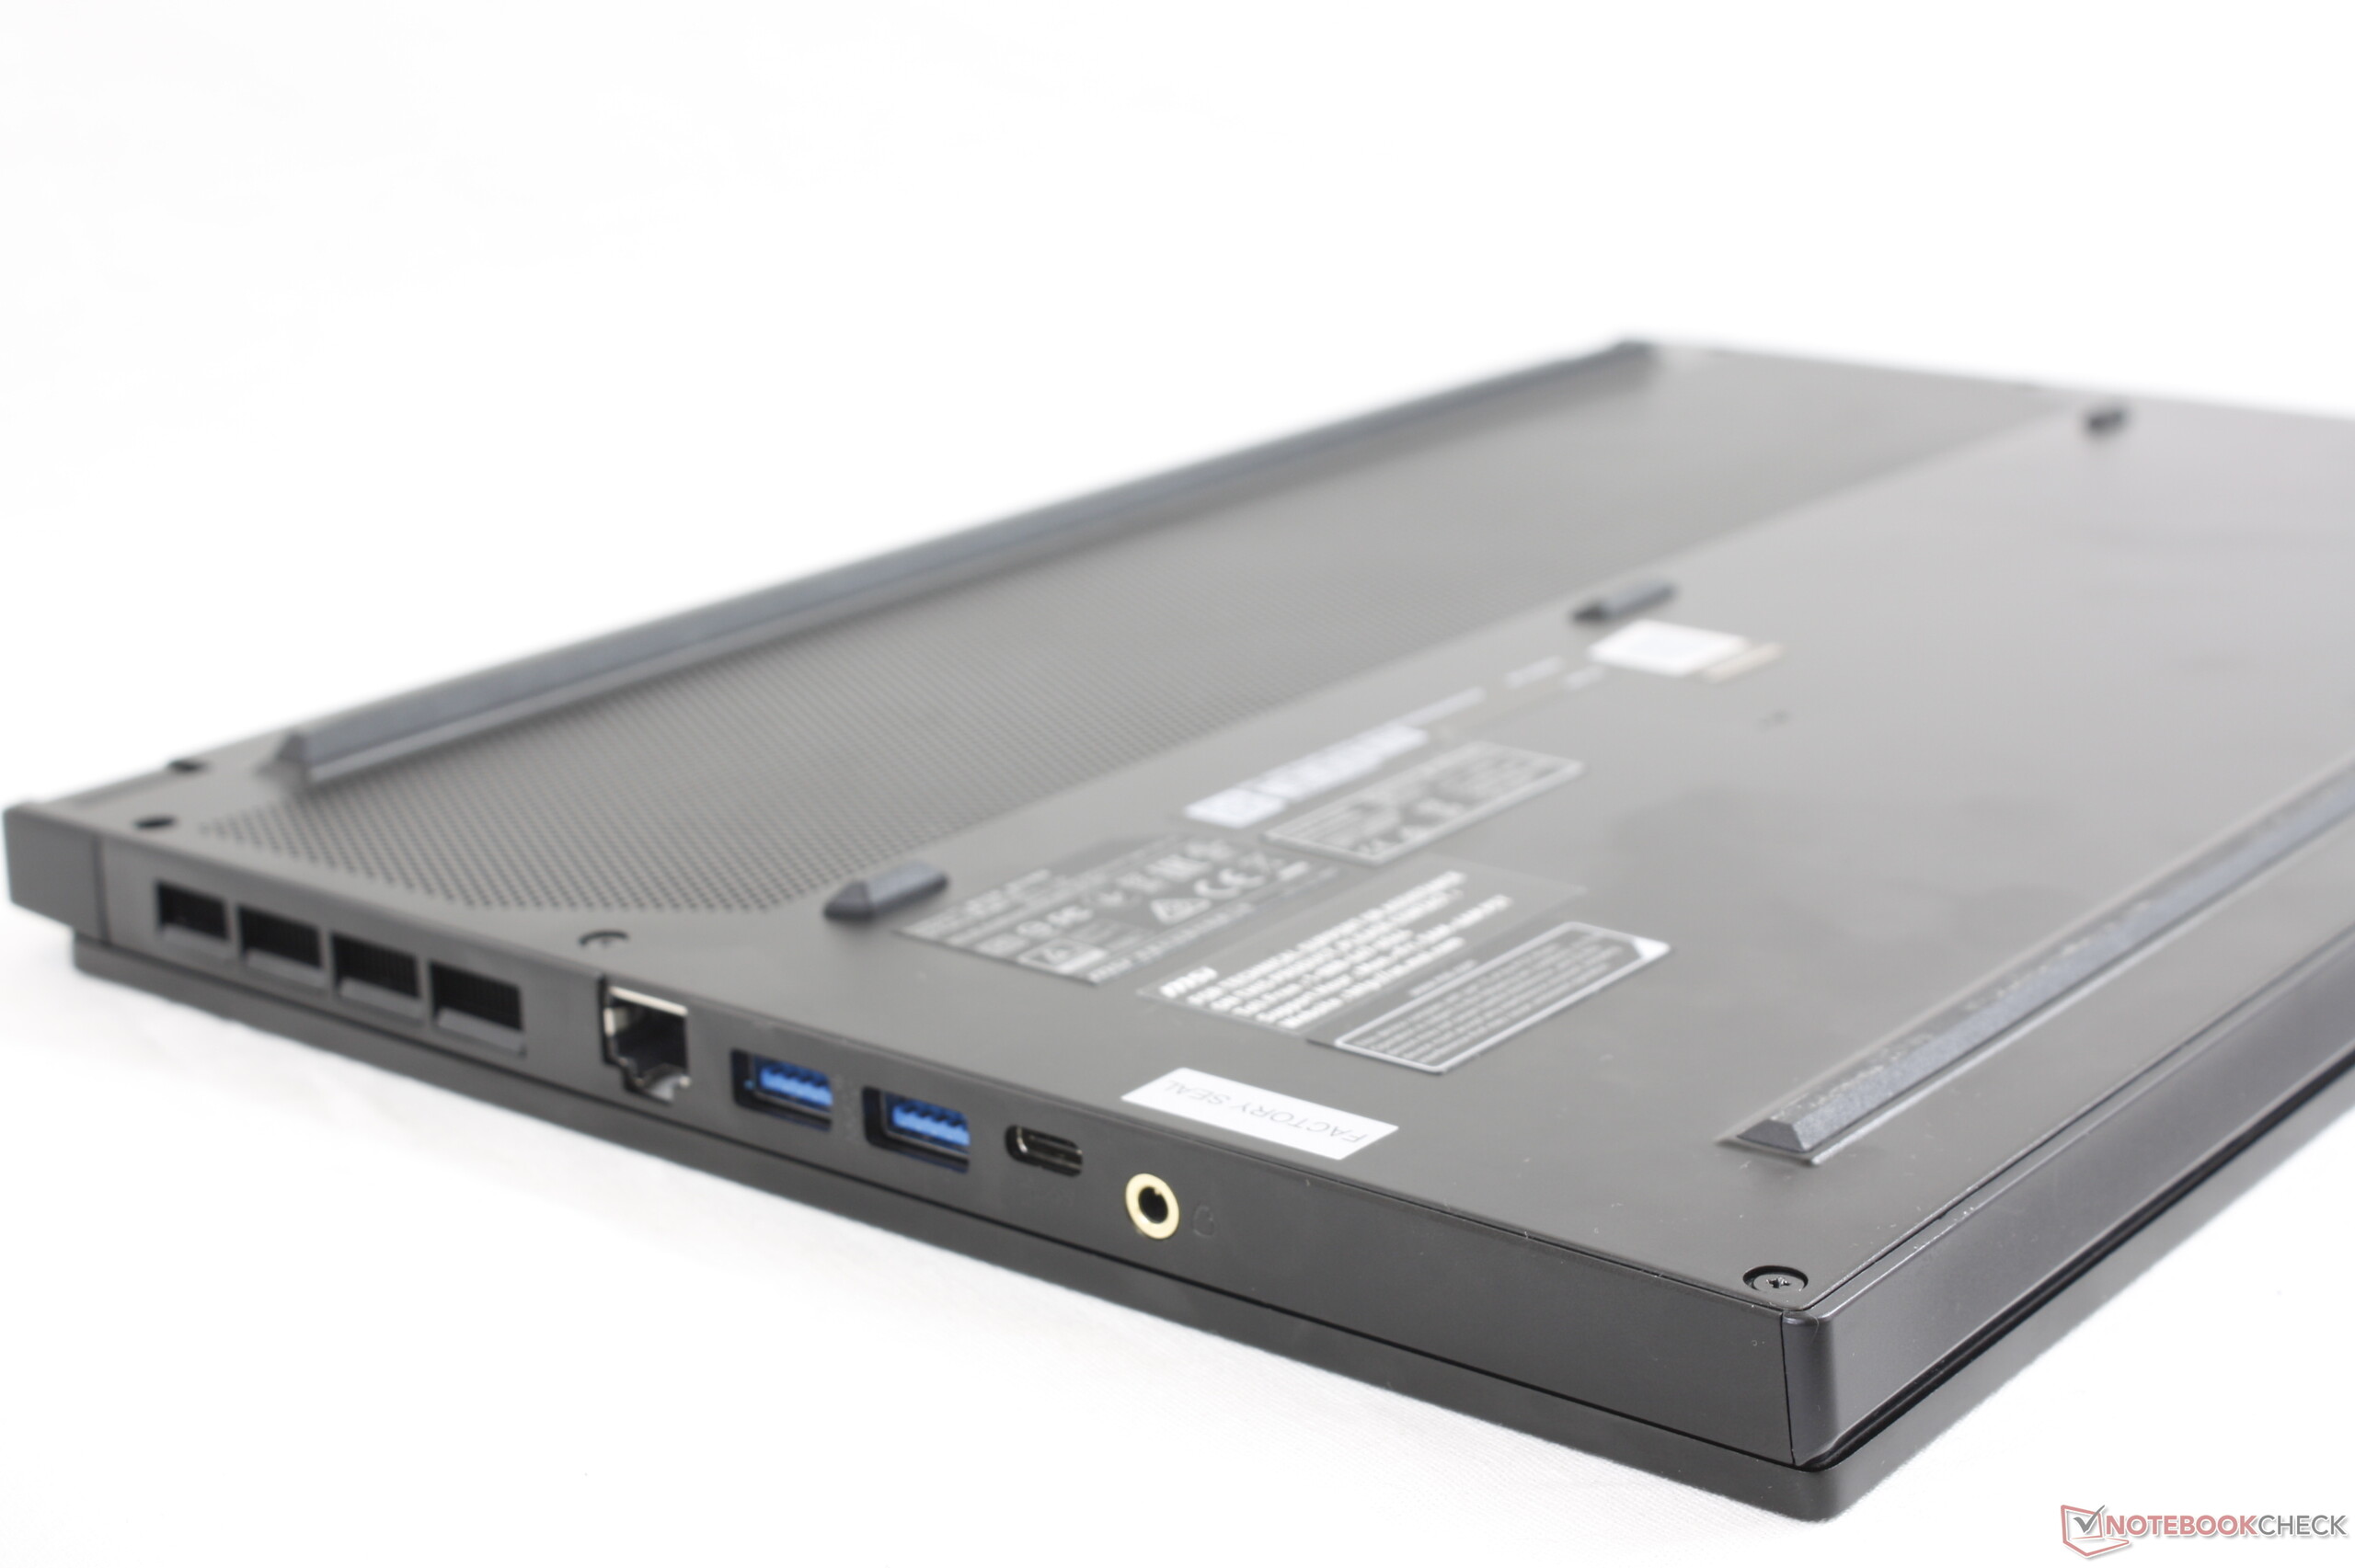
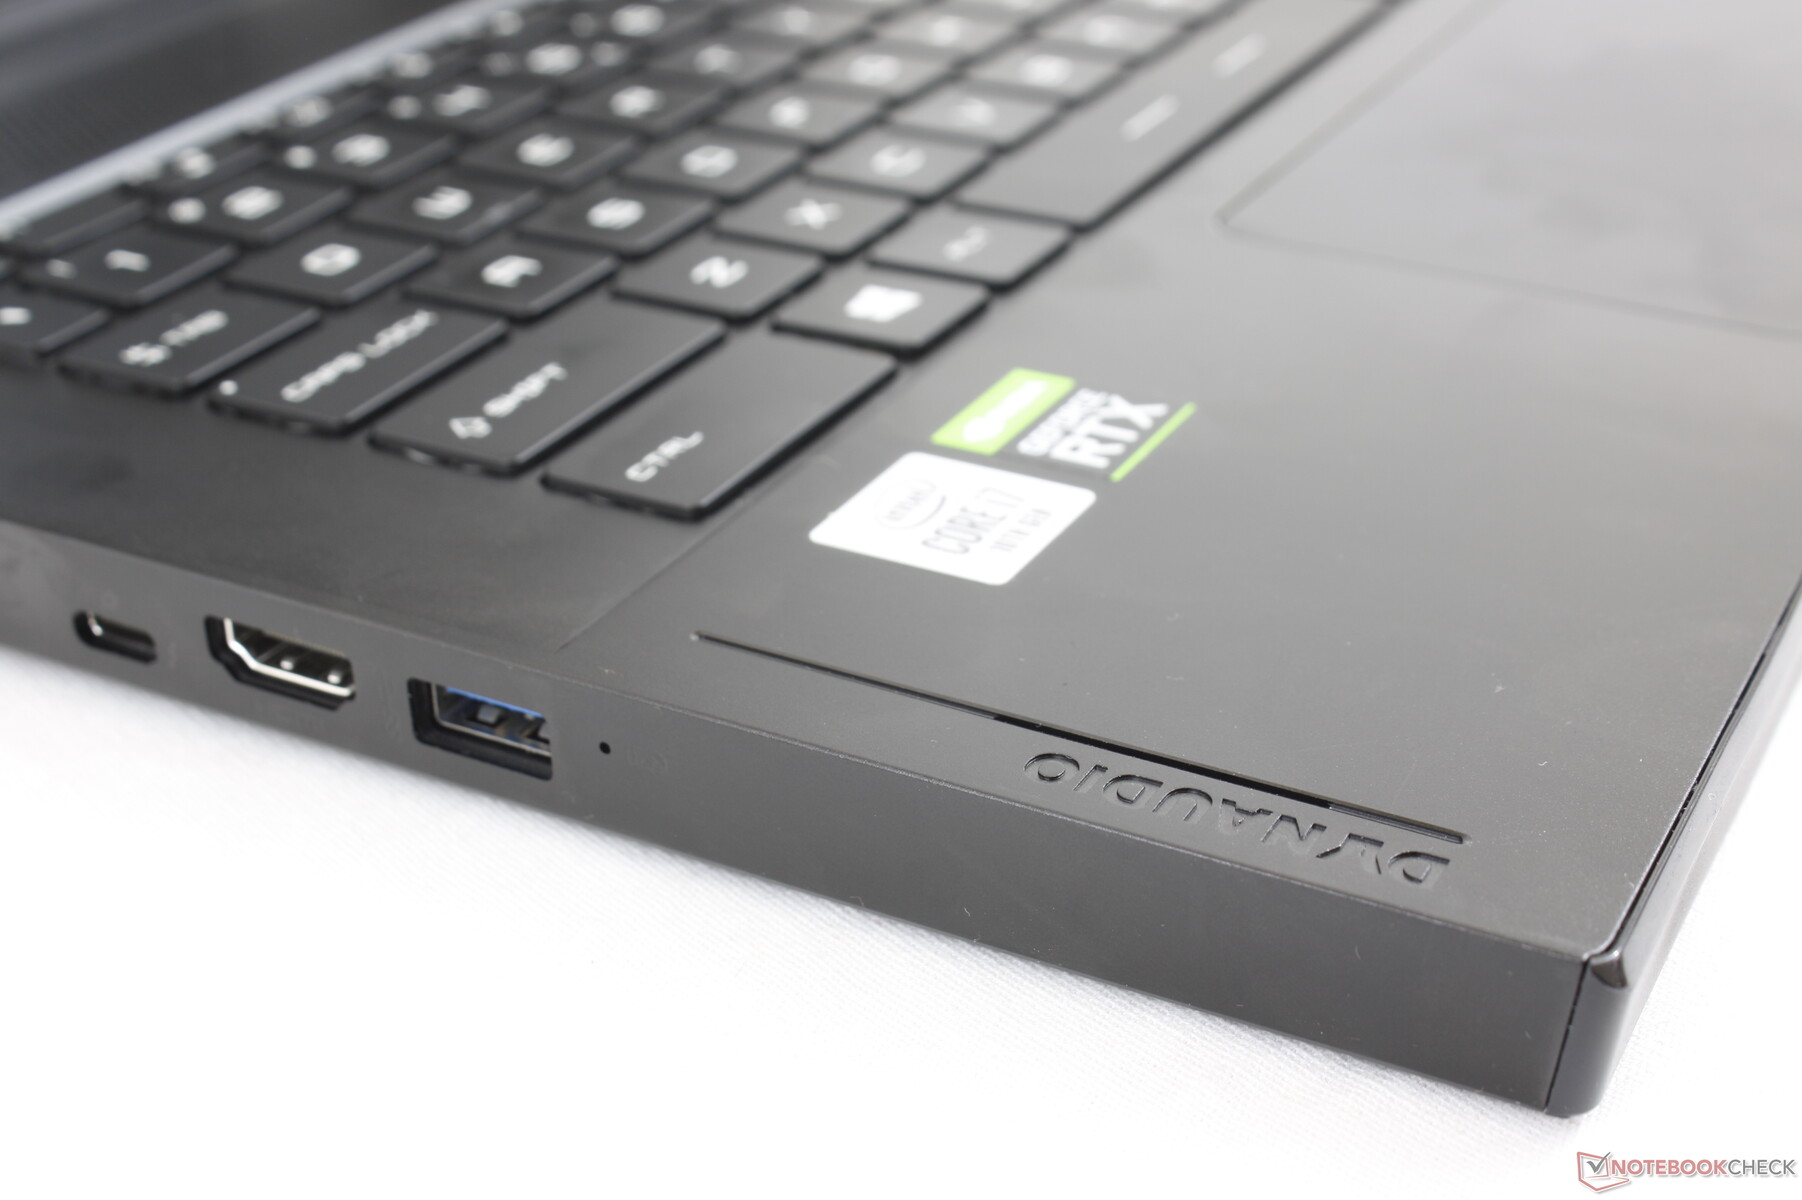
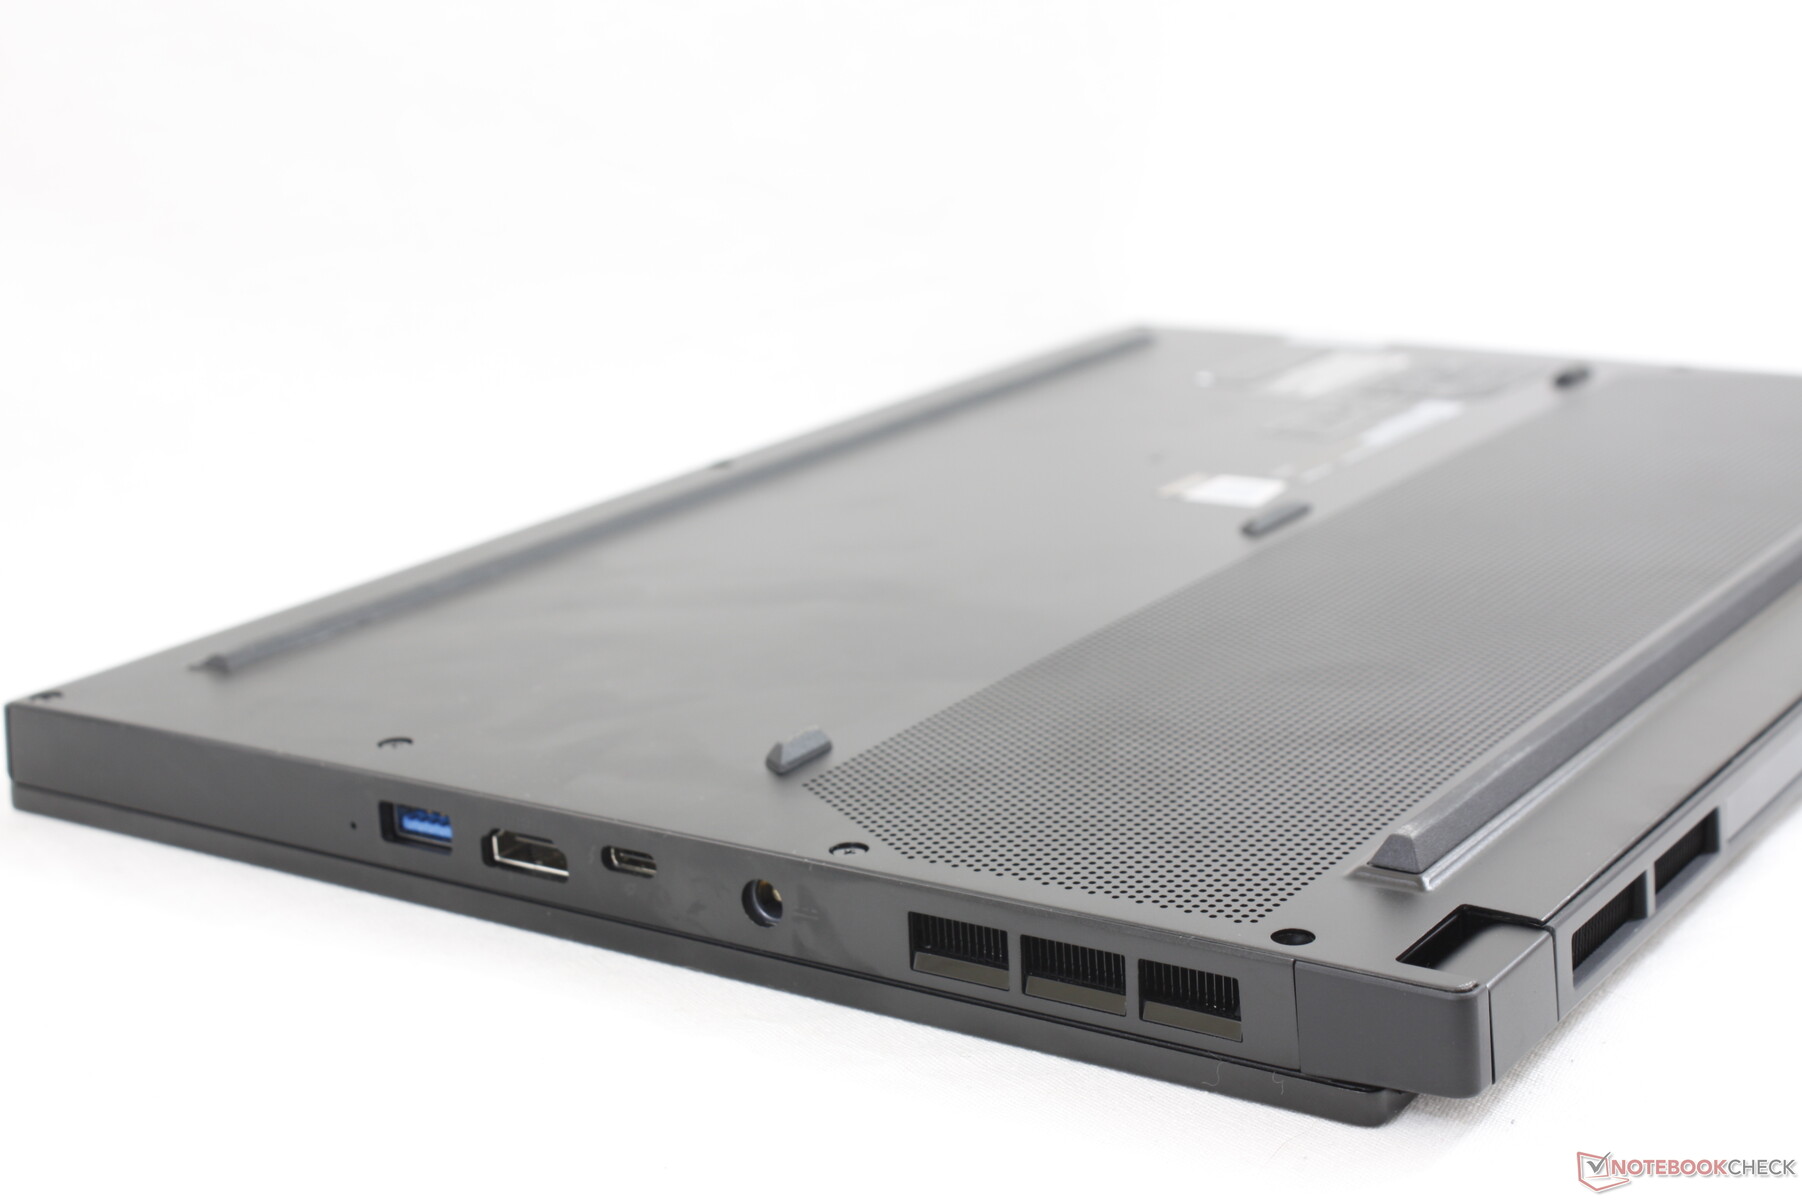
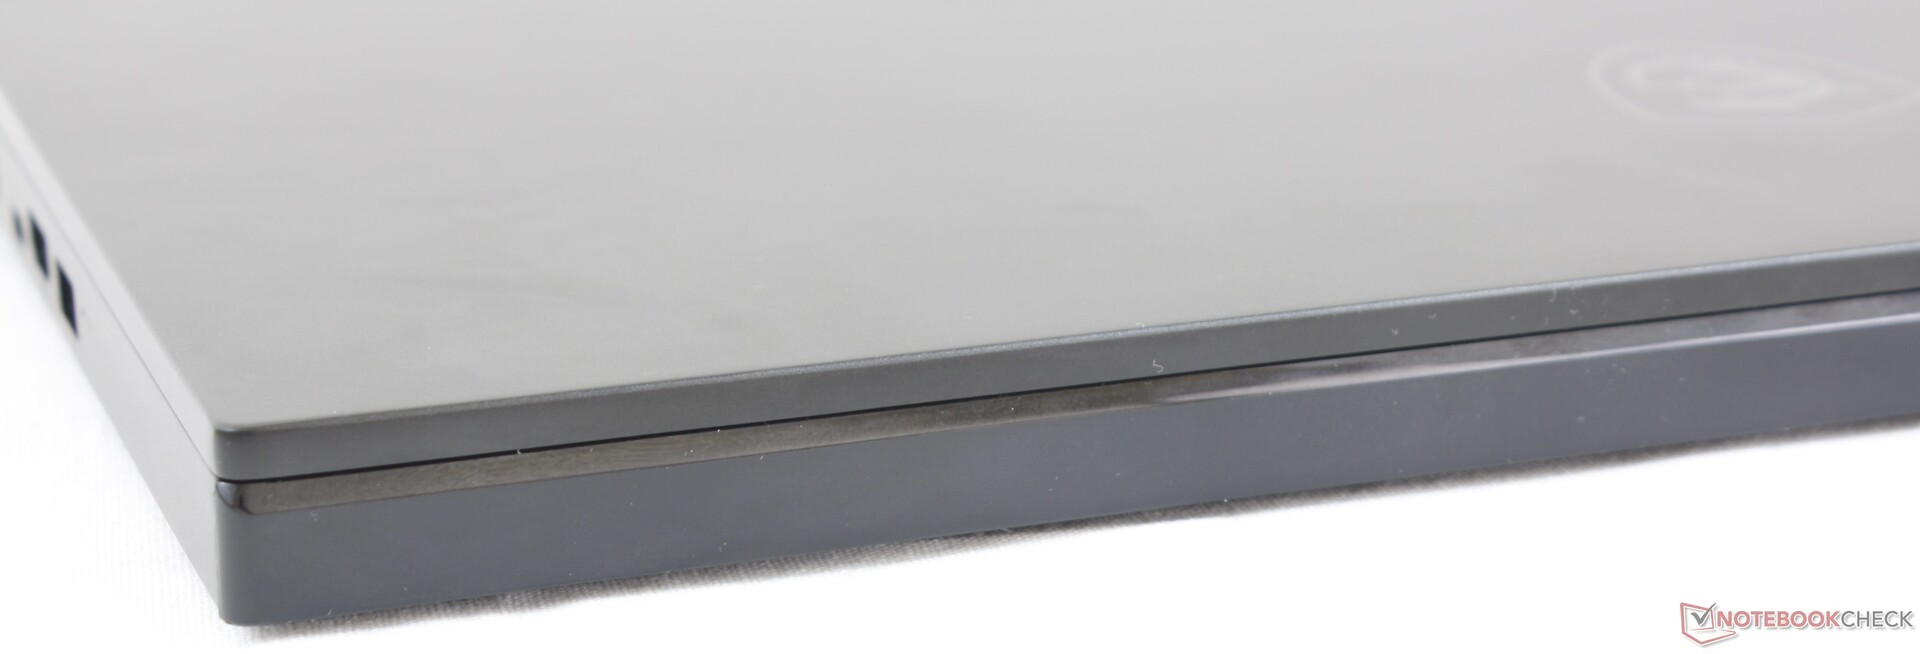
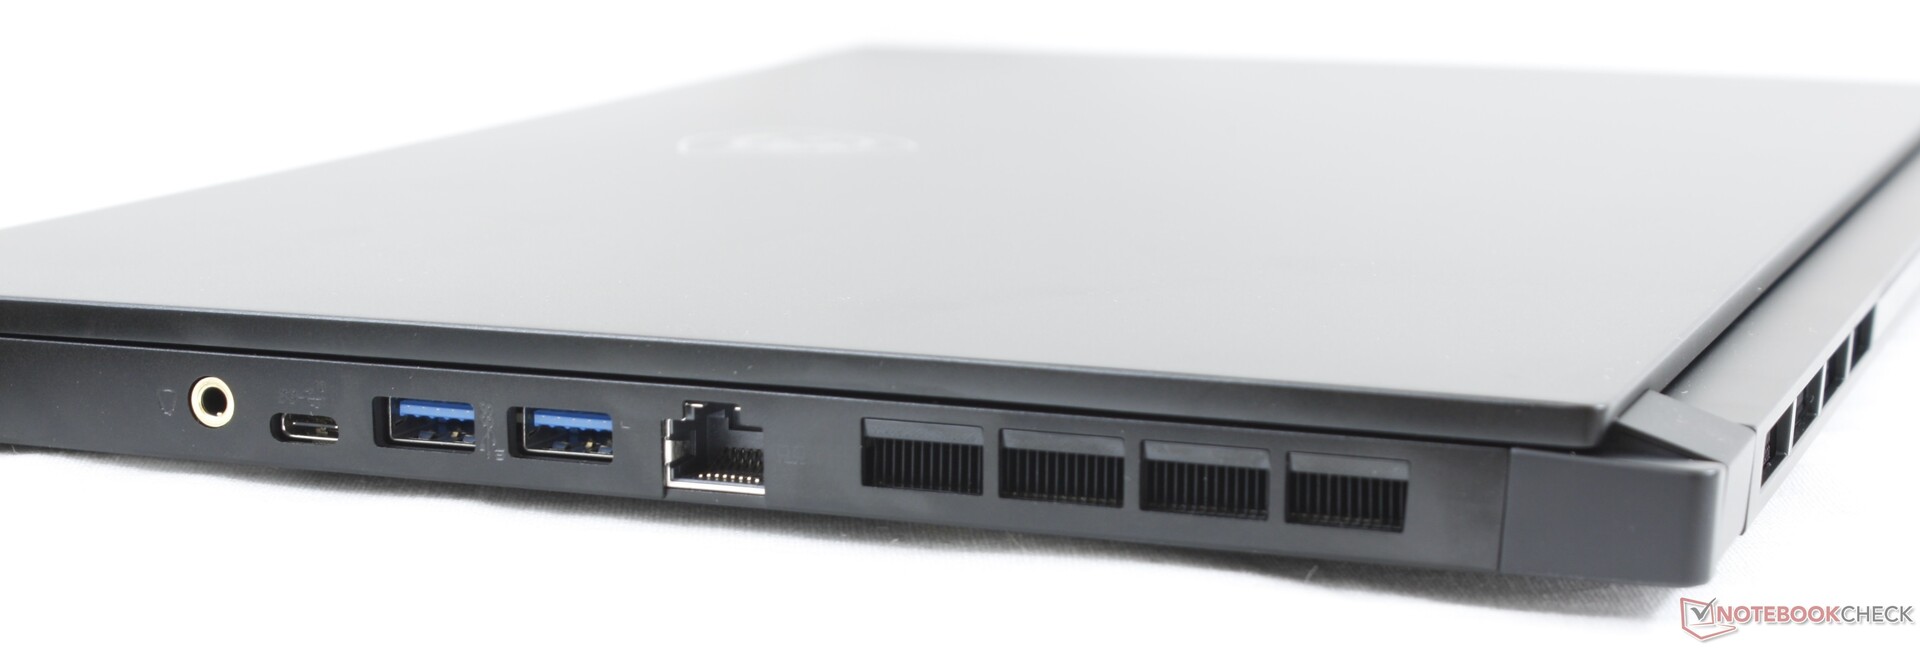
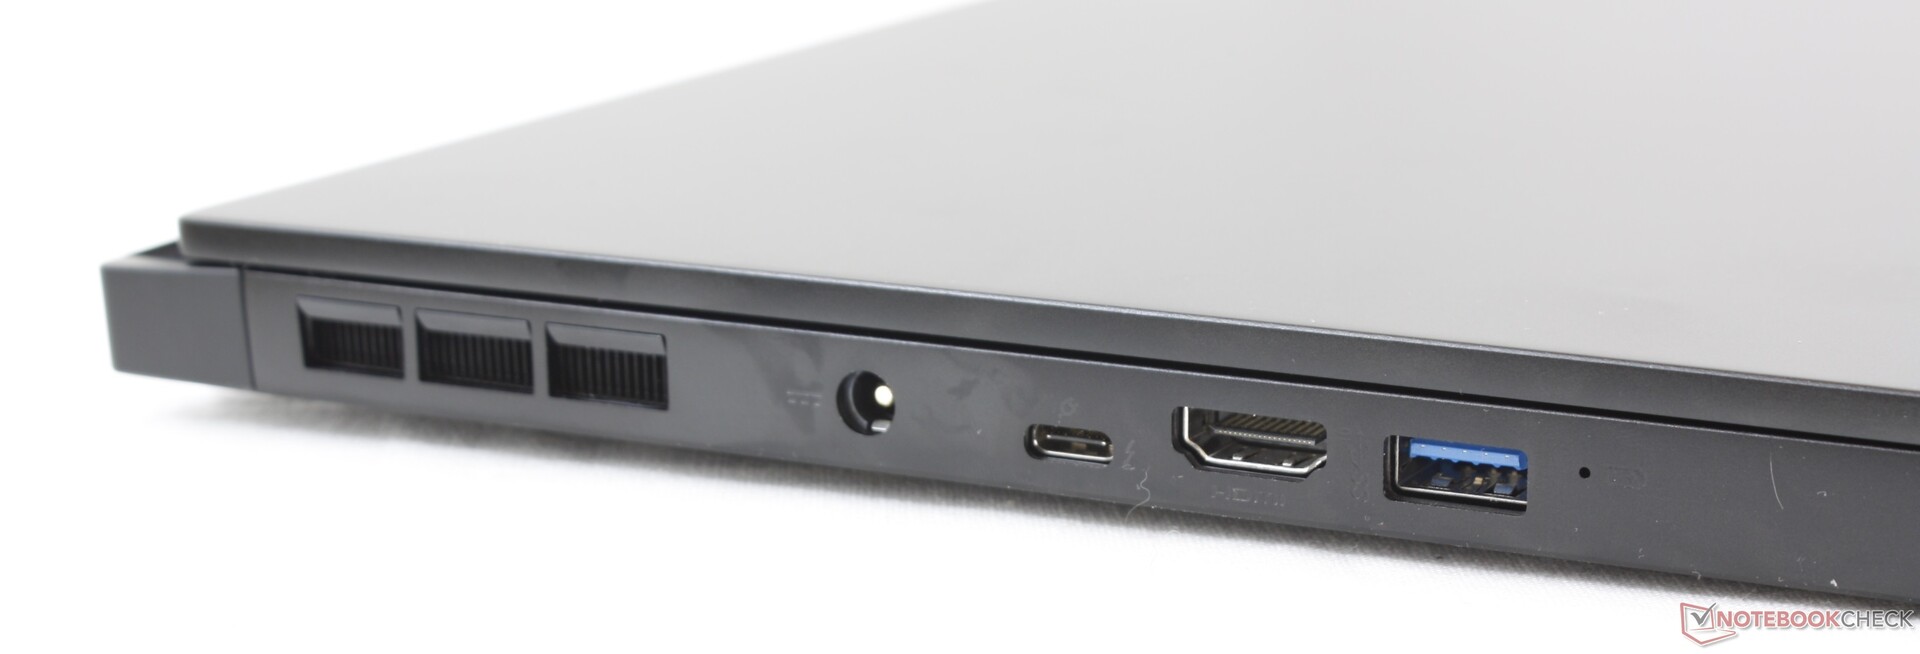
Le opzioni delle porte sono cambiate rispetto al GS65 di ultima generazione. In particolare, MSI ha sostituito la mini-DisplayPort con una seconda porta USB Type-C, mentre la porta dedicata al microfono non si trova da nessuna parte. Sospettiamo che la maggior parte degli utenti non utilizzi nemmeno queste porte che avevano spinto MSI ad abbandonarle.
Il posizionamento delle porte continua a lasciare una sensazione mista perché le porte sono molto ravvicinate e spostate verso il bordo anteriore. In confronto, il Blade 15 ha le sue porte più verso il retro, dove i cavi hanno meno probabilità di essere d'intralcio.
Comunicazioni
L'Intel AX201 viene fornito di serie con Wi-Fi 6 e Buetooth 5.1. Non abbiamo riscontrato alcun problema quando ci siamo collegati al nostro router di prova Netgear RAX200. Gli utenti possono effettuare l'aggiornamento alla Killer 1650s per le features software aggiuntive, ma per il resto sarà quasi lo stesso.
| Networking | |
| iperf3 transmit AX12 | |
| Asus ZenBook Duo UX481FL | |
| MSI GP65 10SFK-047US | |
| MSI GS66 Stealth 10SFS | |
| MSI GS66 10SGS | |
| MSI GF75 Thin 10SCXR | |
| iperf3 receive AX12 | |
| Asus ZenBook Duo UX481FL | |
| MSI GS66 10SGS | |
| MSI GS66 Stealth 10SFS | |
| MSI GP65 10SFK-047US | |
| MSI GF75 Thin 10SCXR | |
Webcam


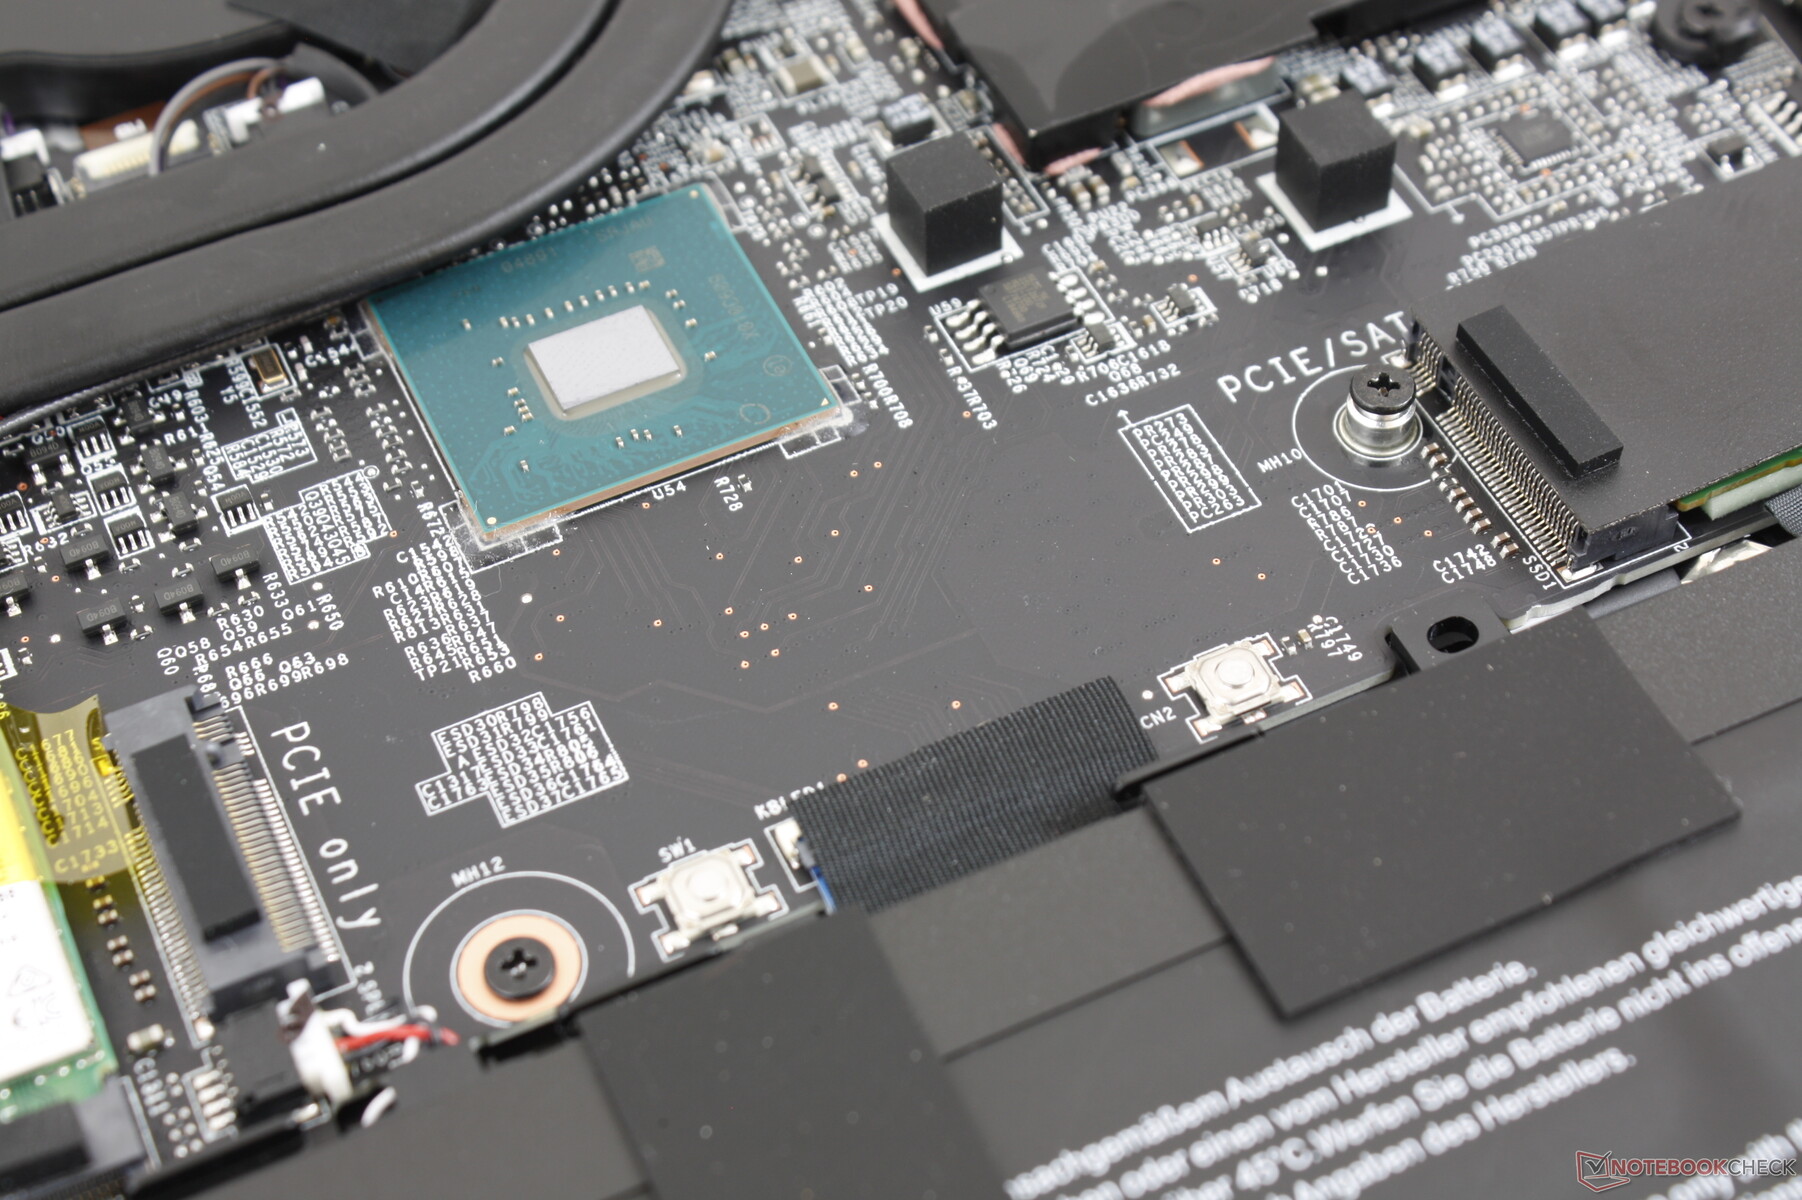
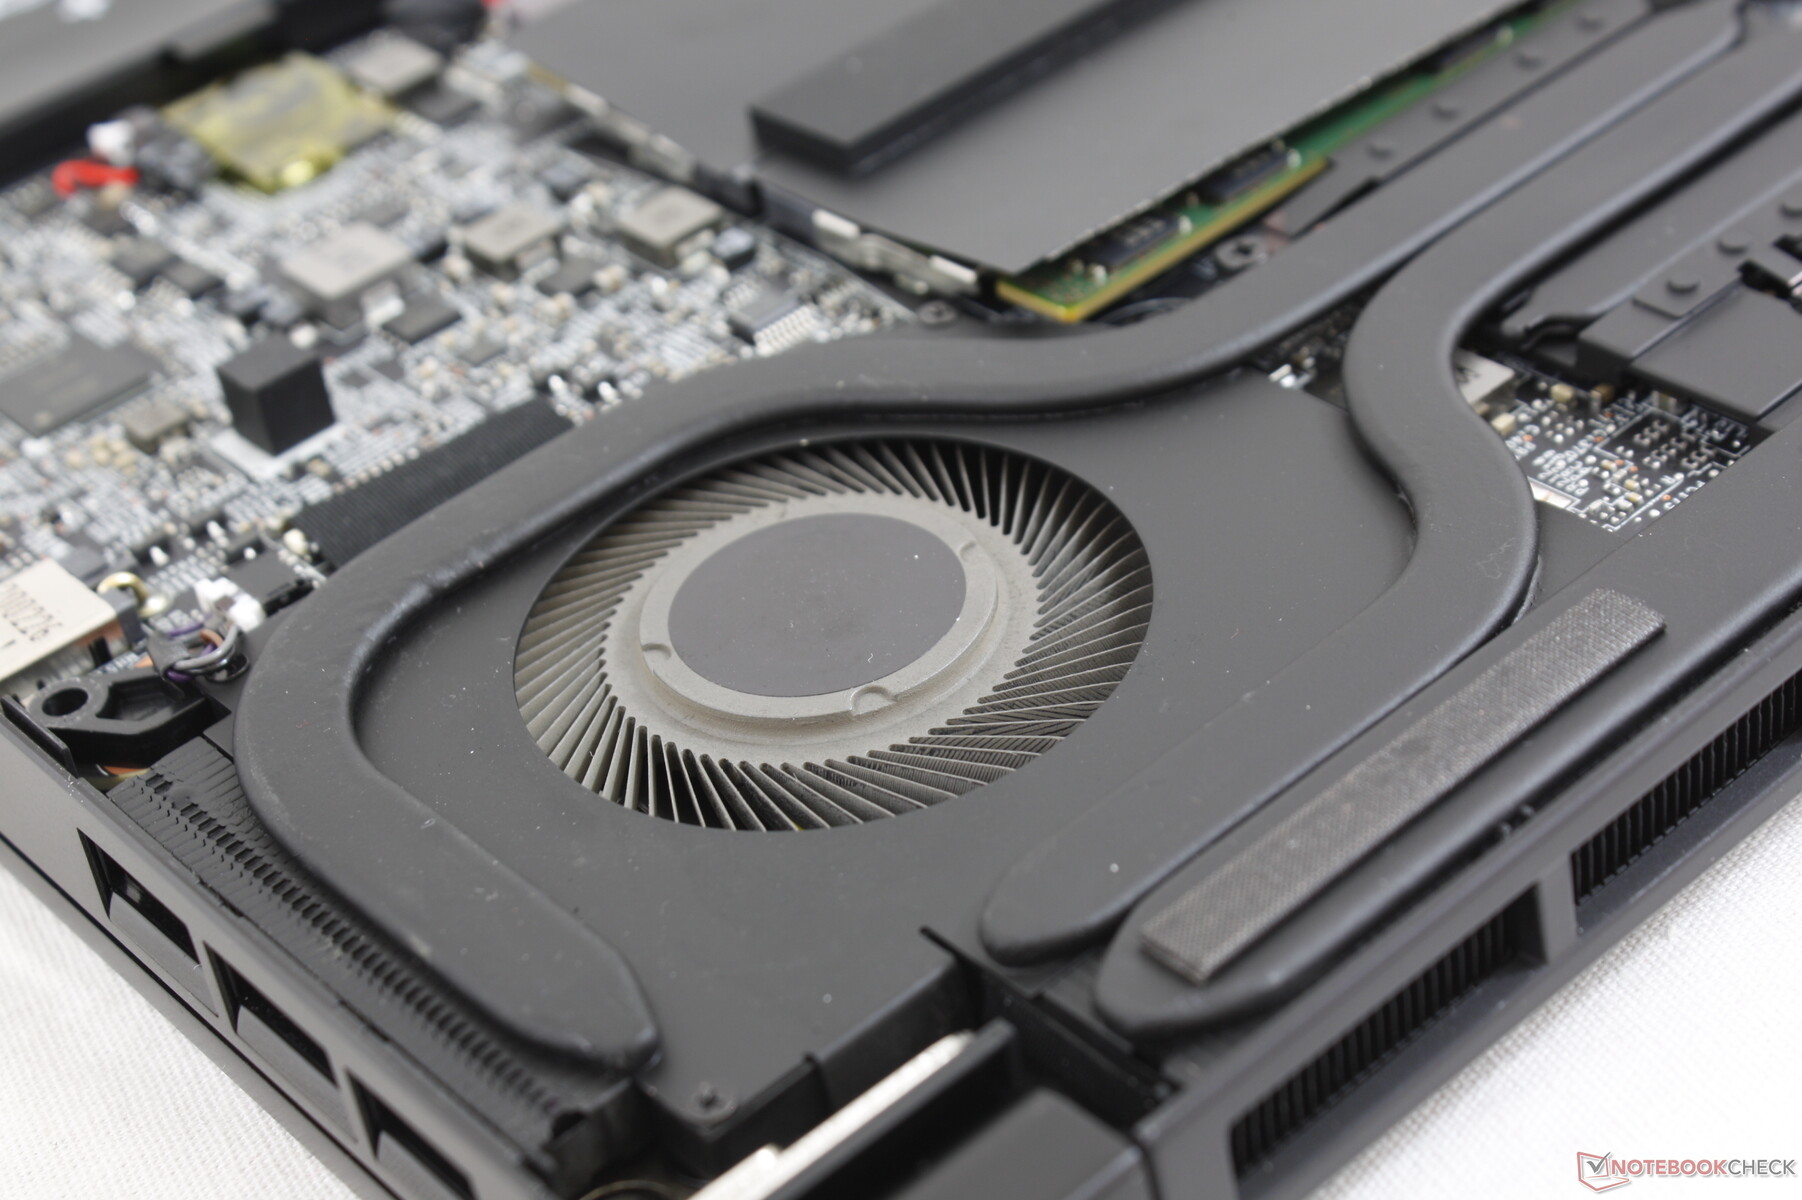
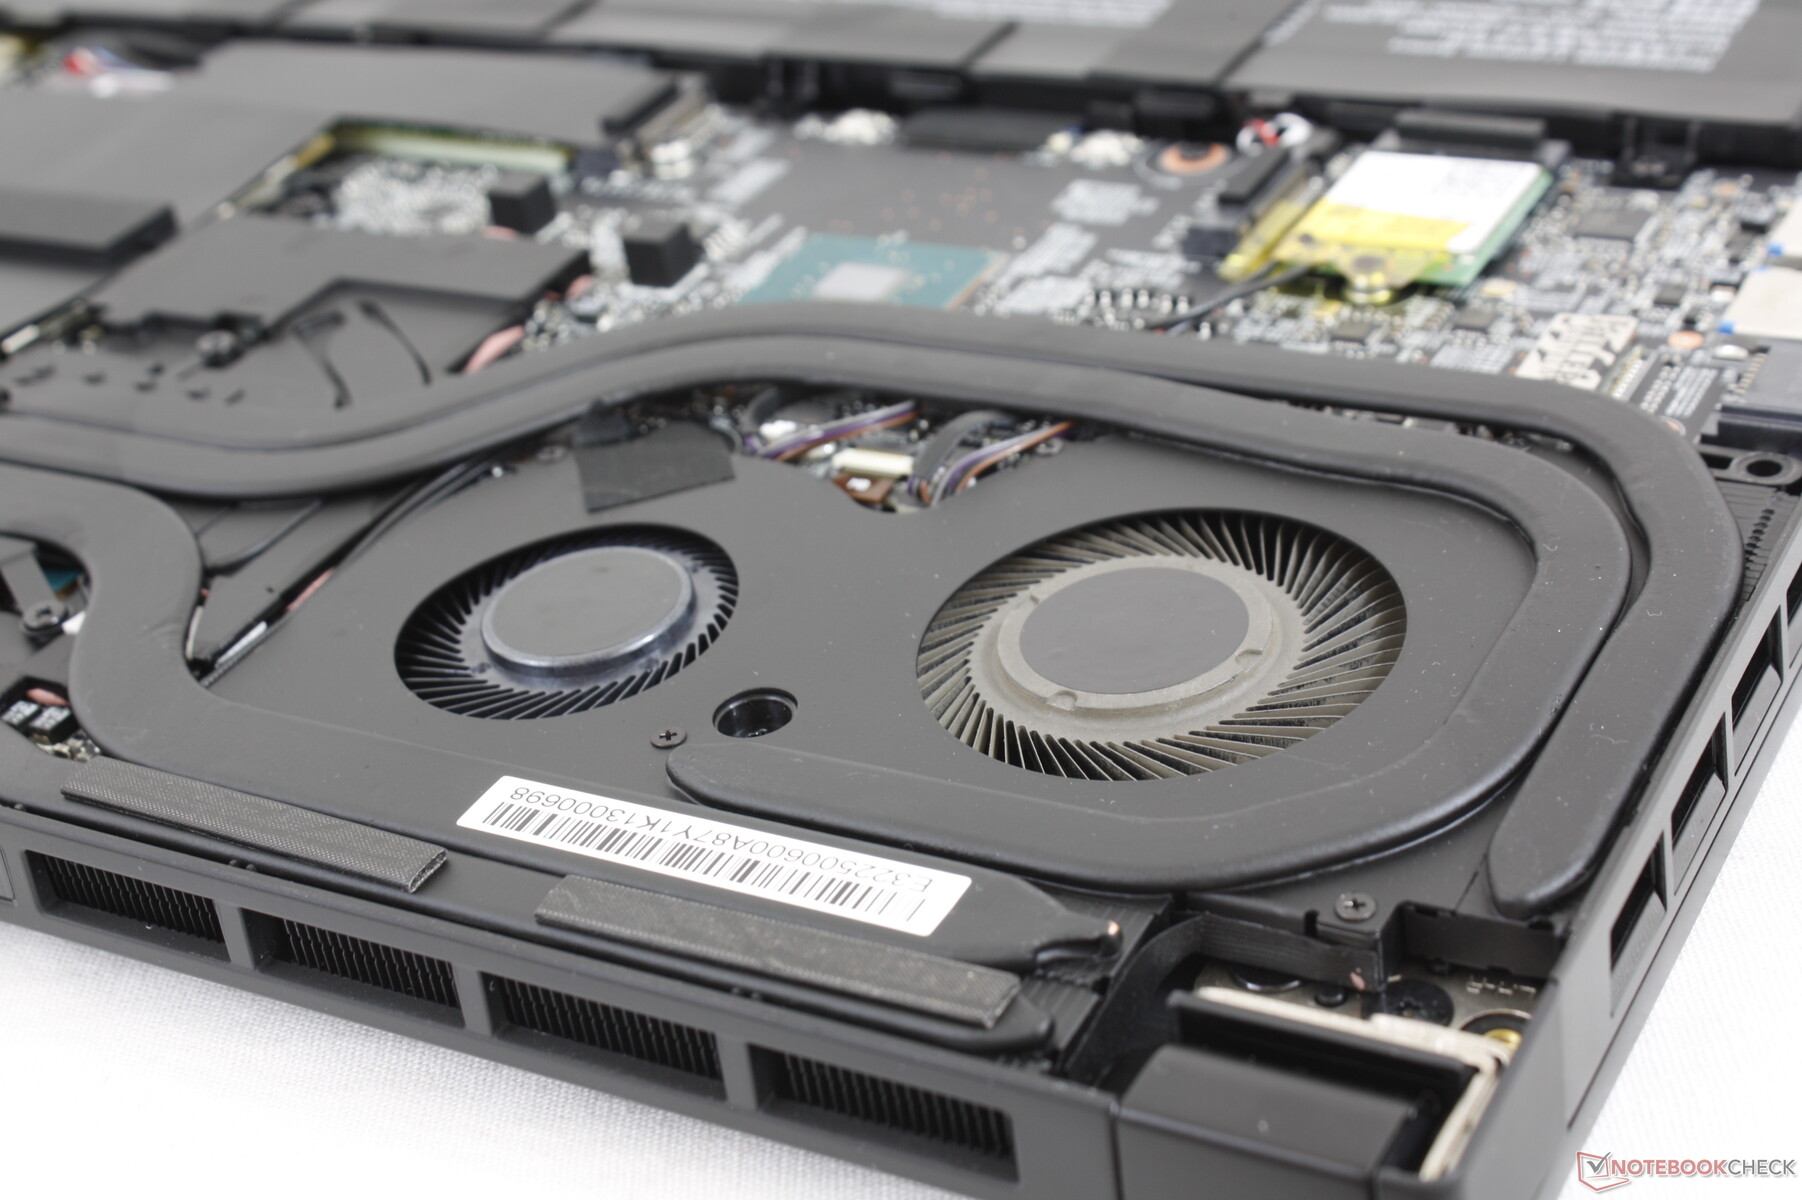
Manutenzione
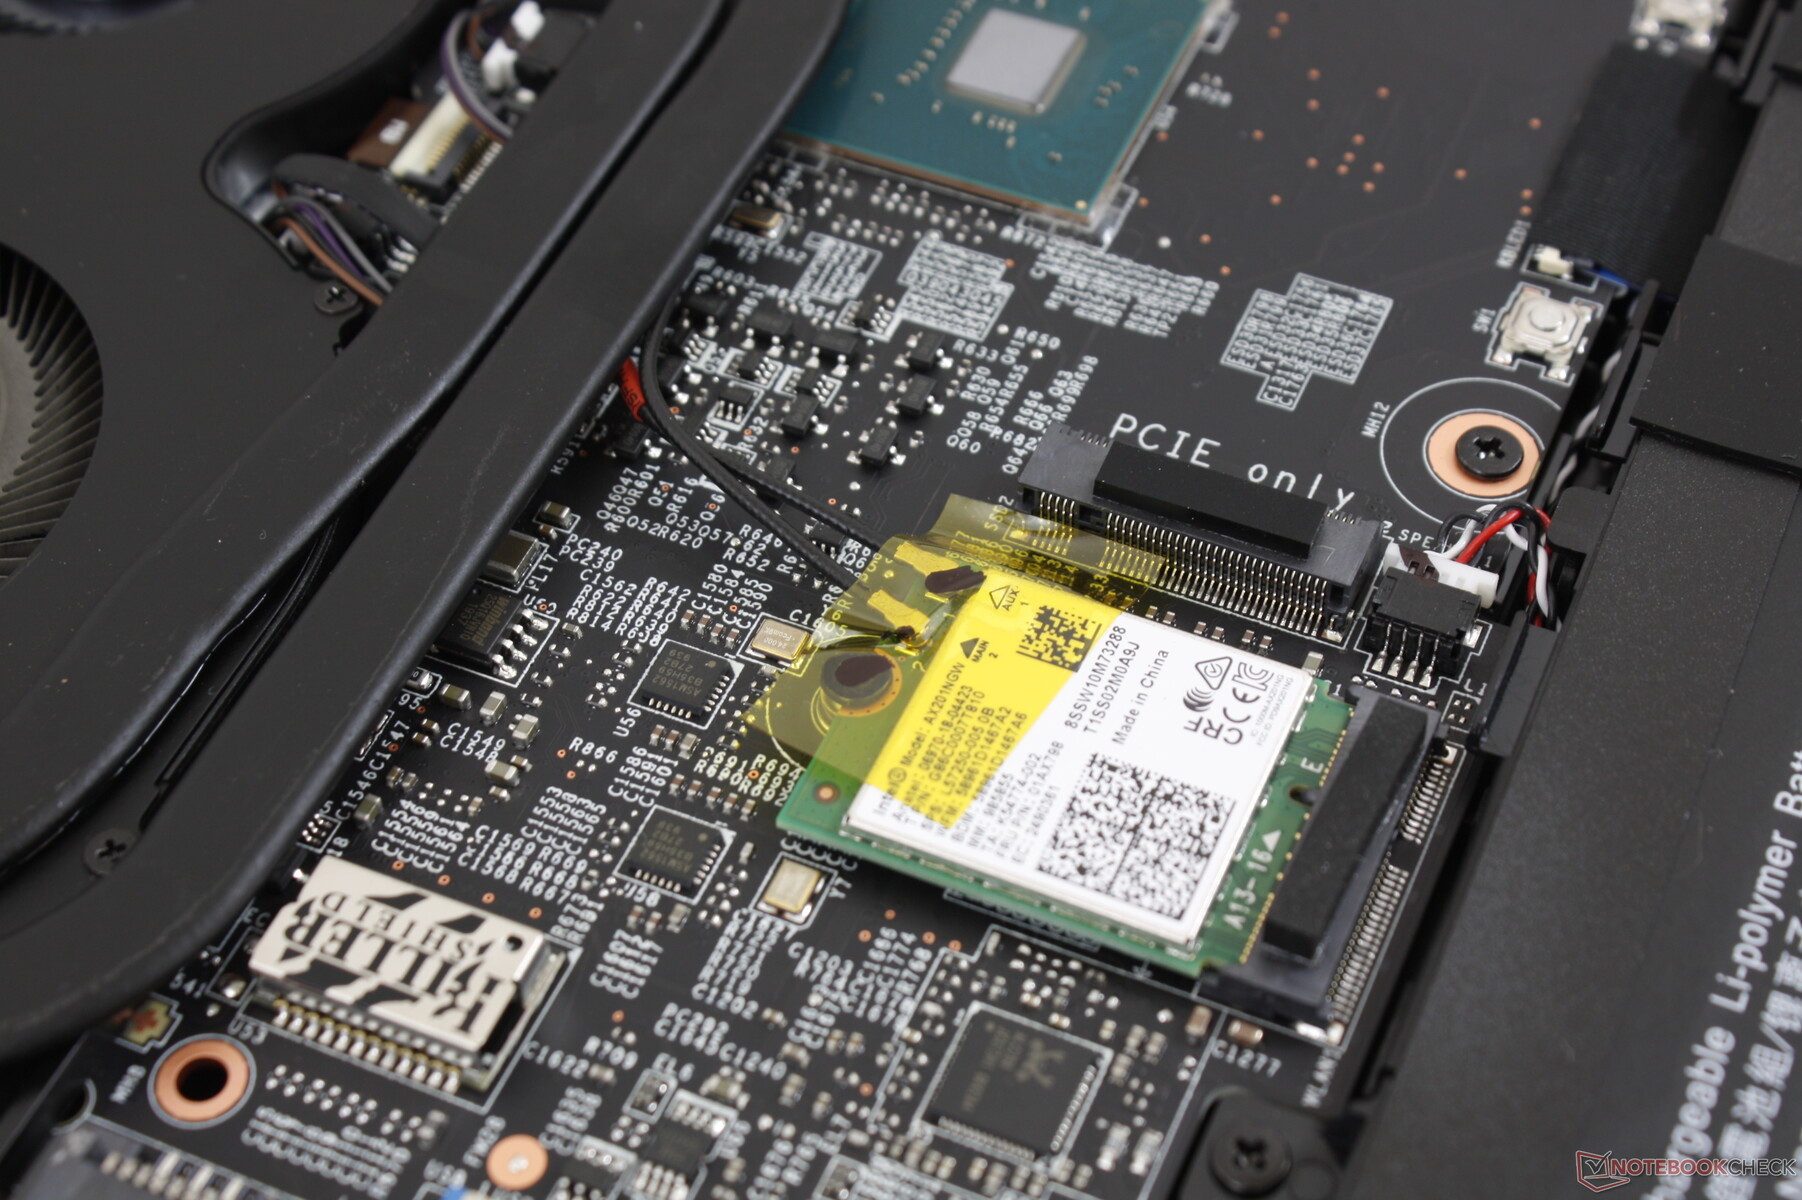
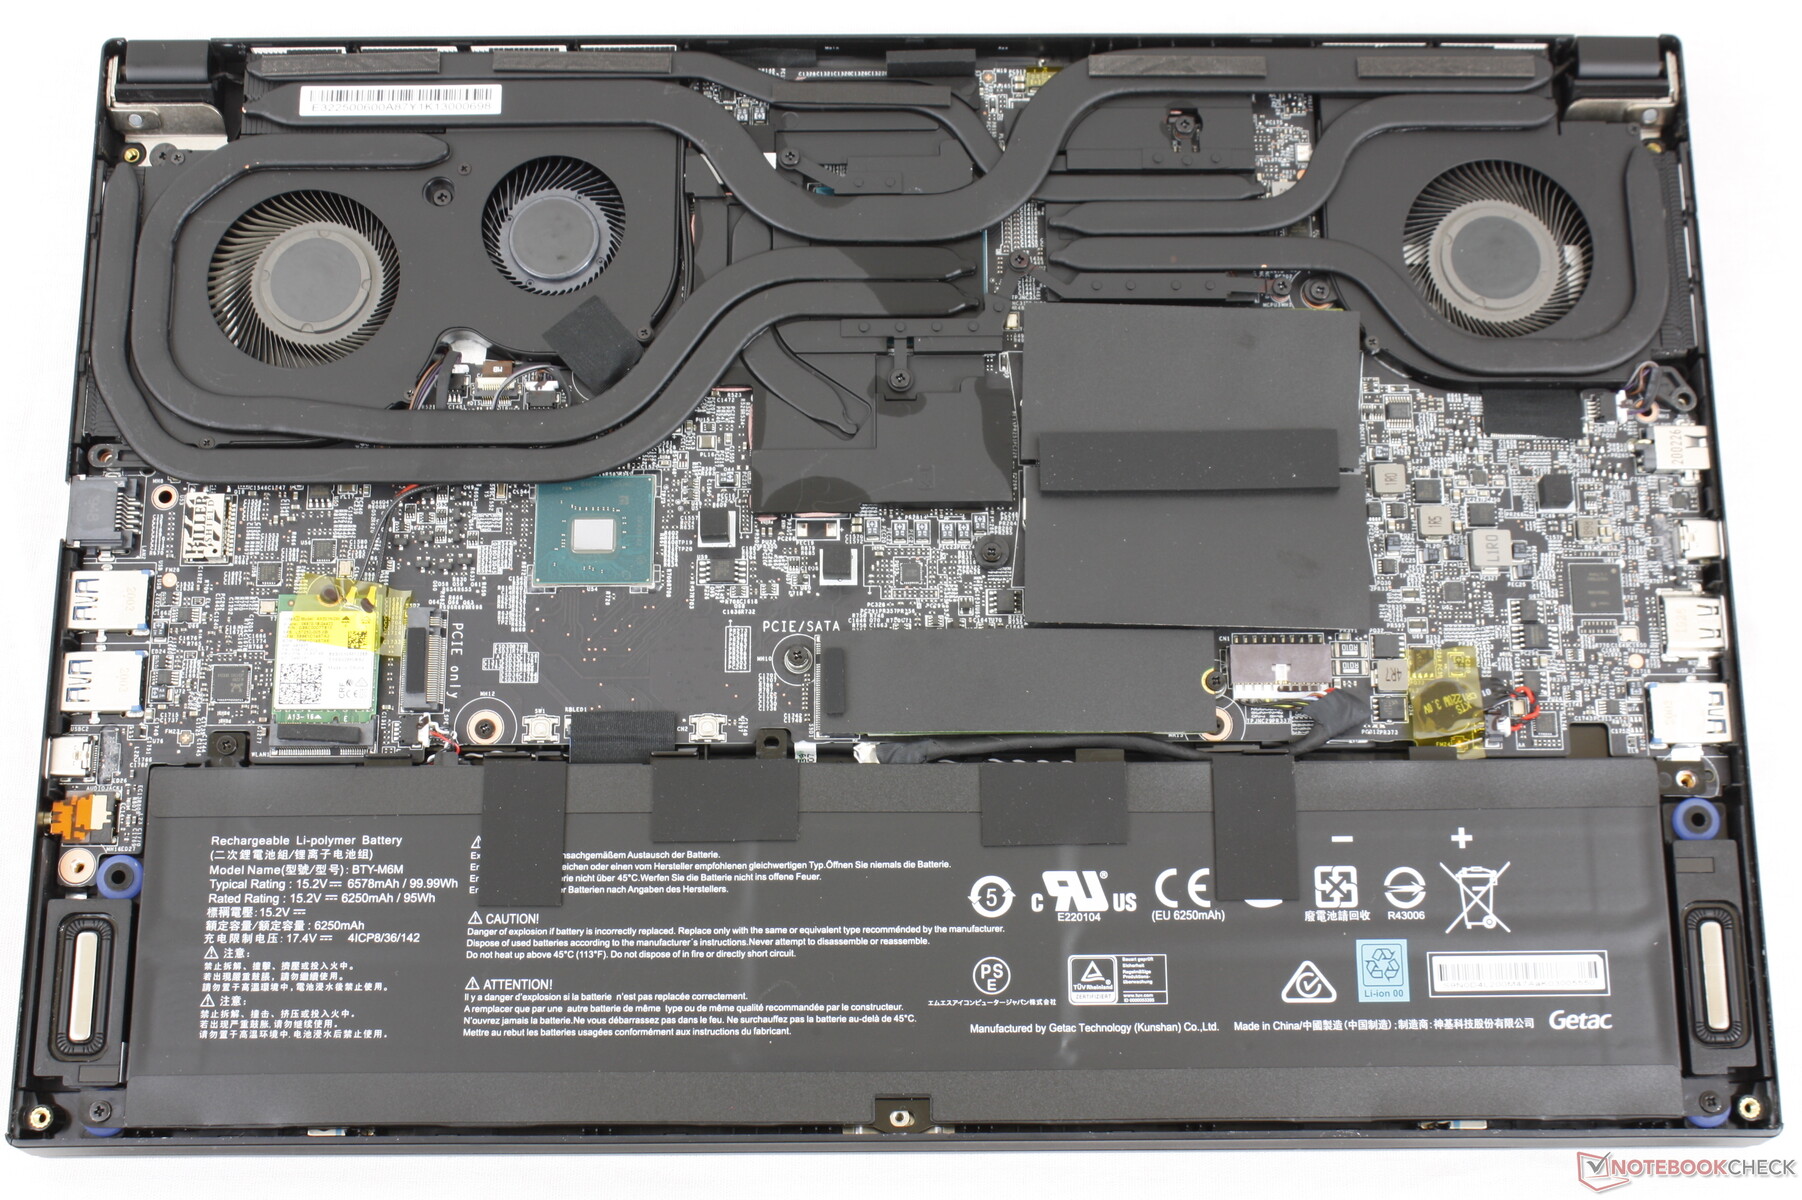
Il pannello inferiore è fissato da 9 viti Philips e i proprietari dovranno strappare un adesivo 'Factory Seal' per accedere. Il pannello inferiore è più difficile da rimuovere rispetto ai pannelli inferiori del GS65 o del Razer Blade 15 e quindi si consiglia di usare mani attente e uno strumento affilato per eseguire il lavoro.
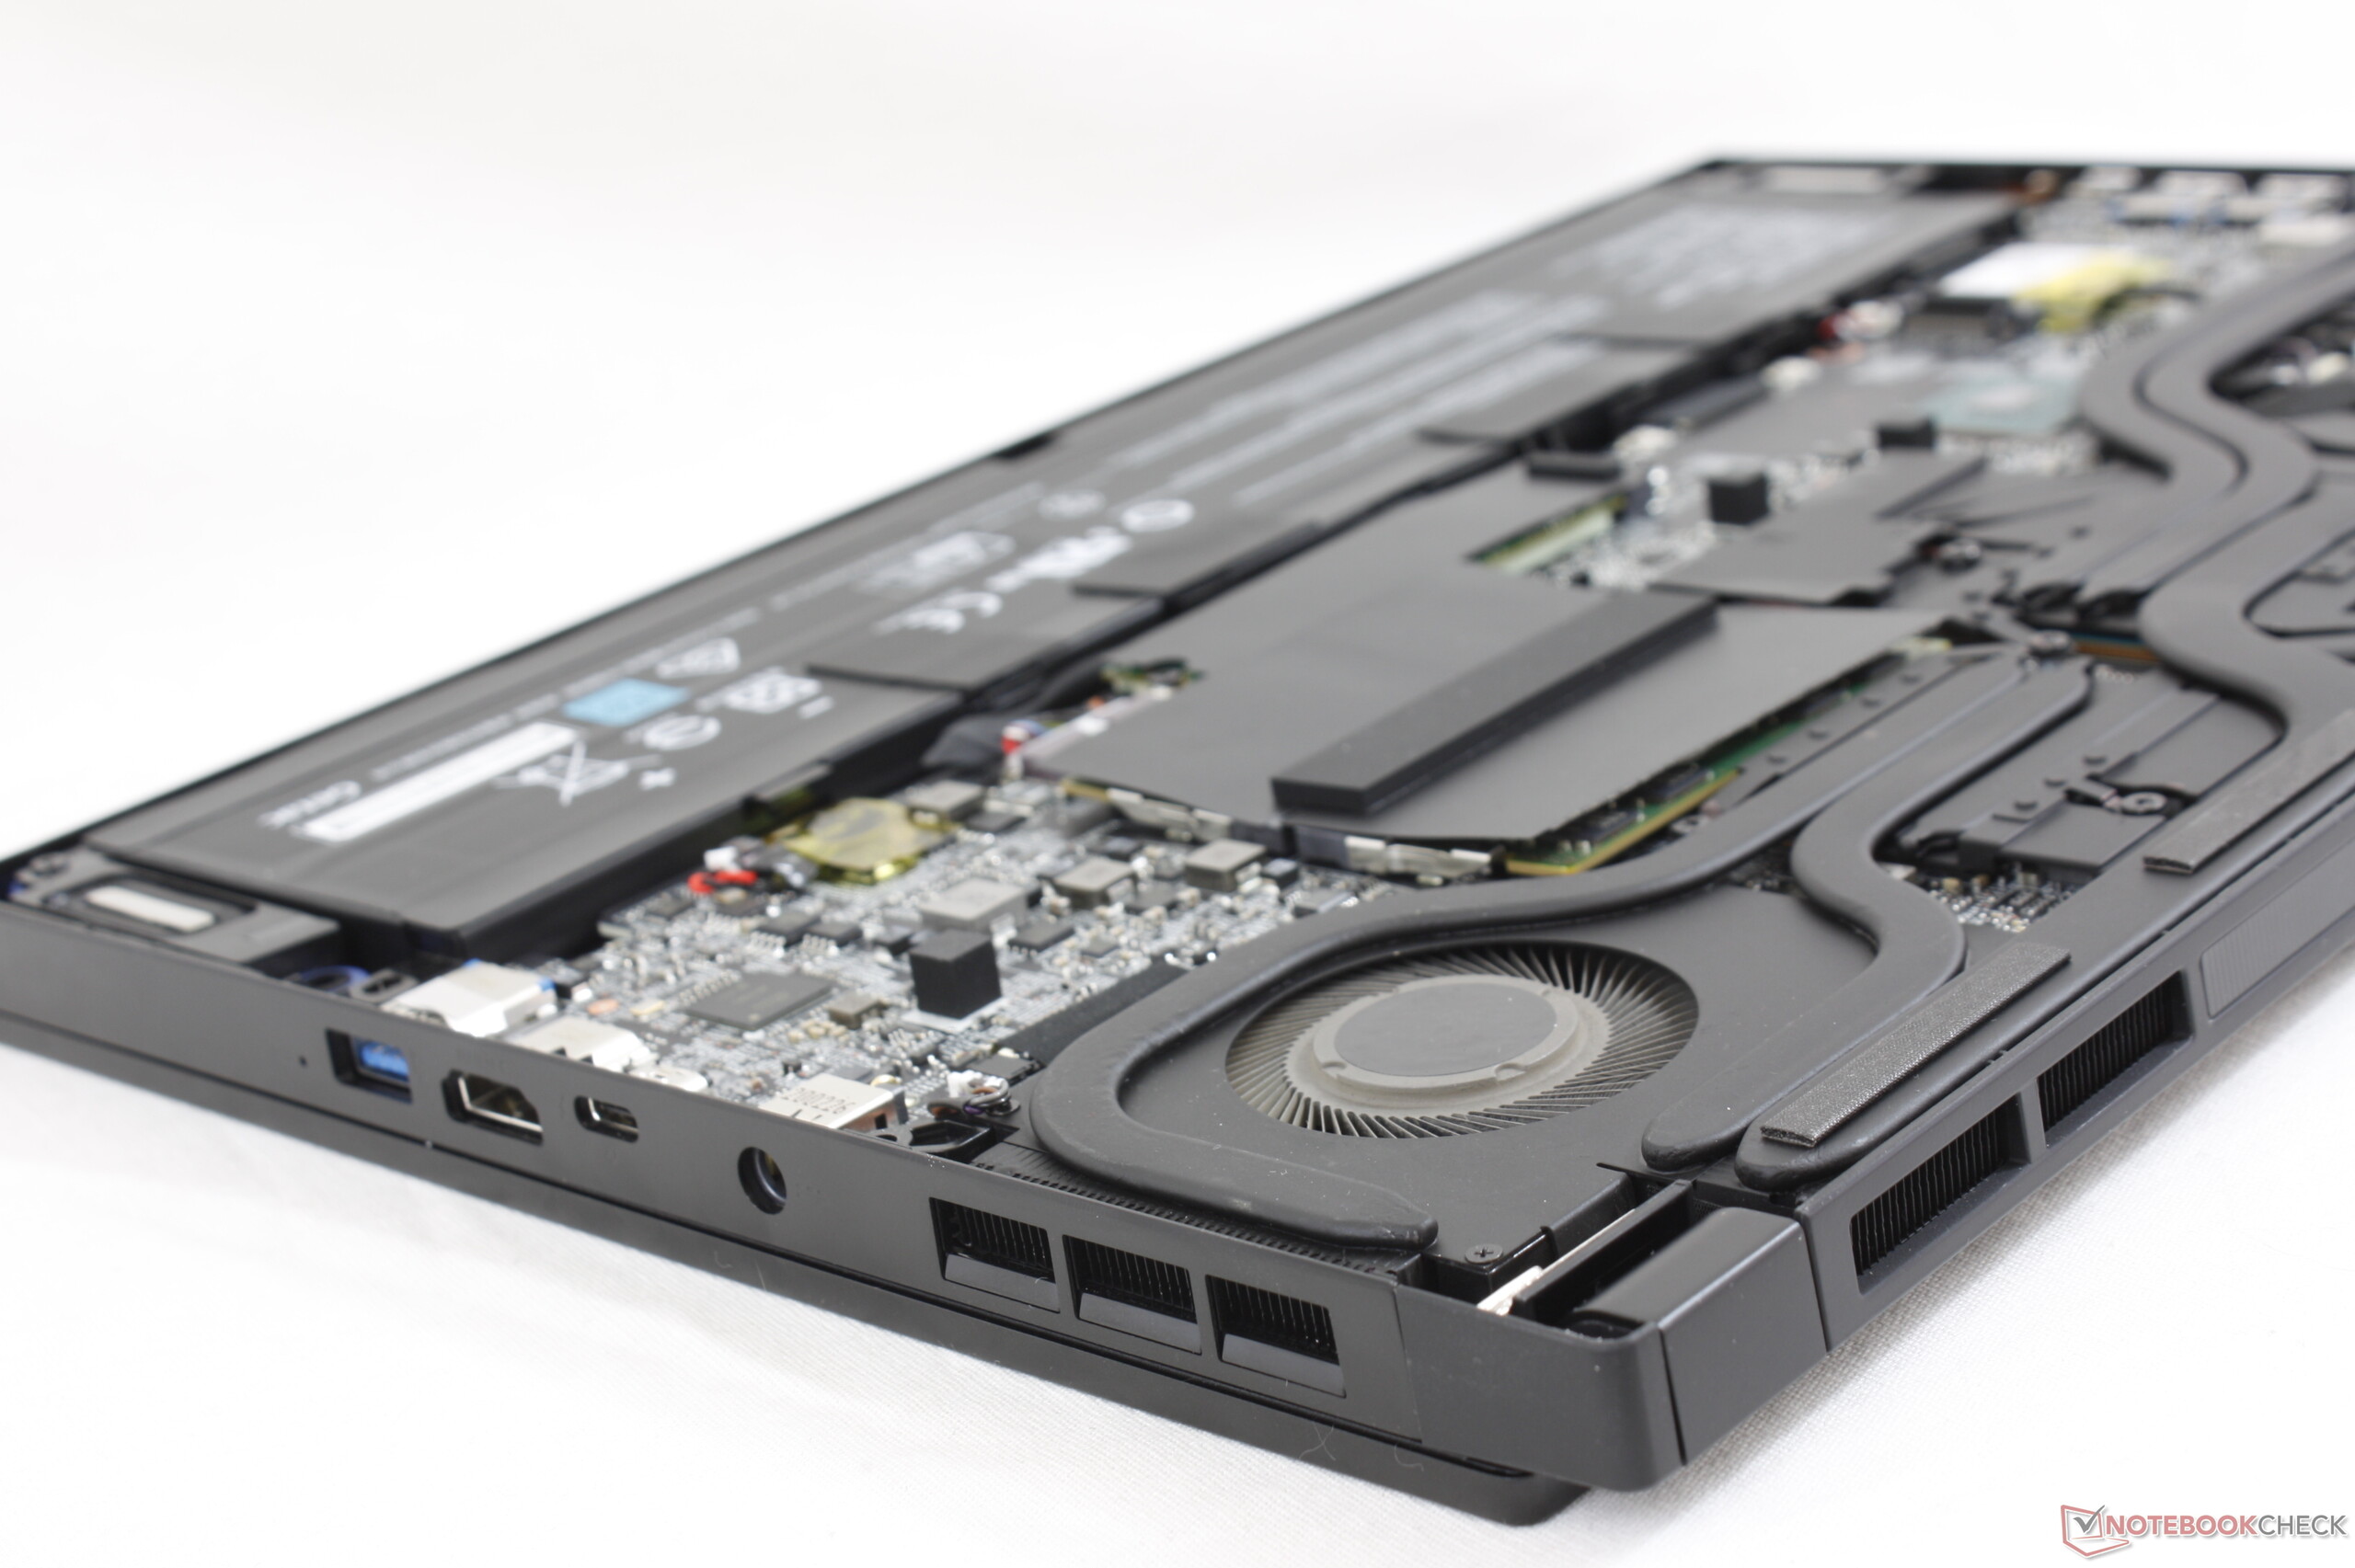
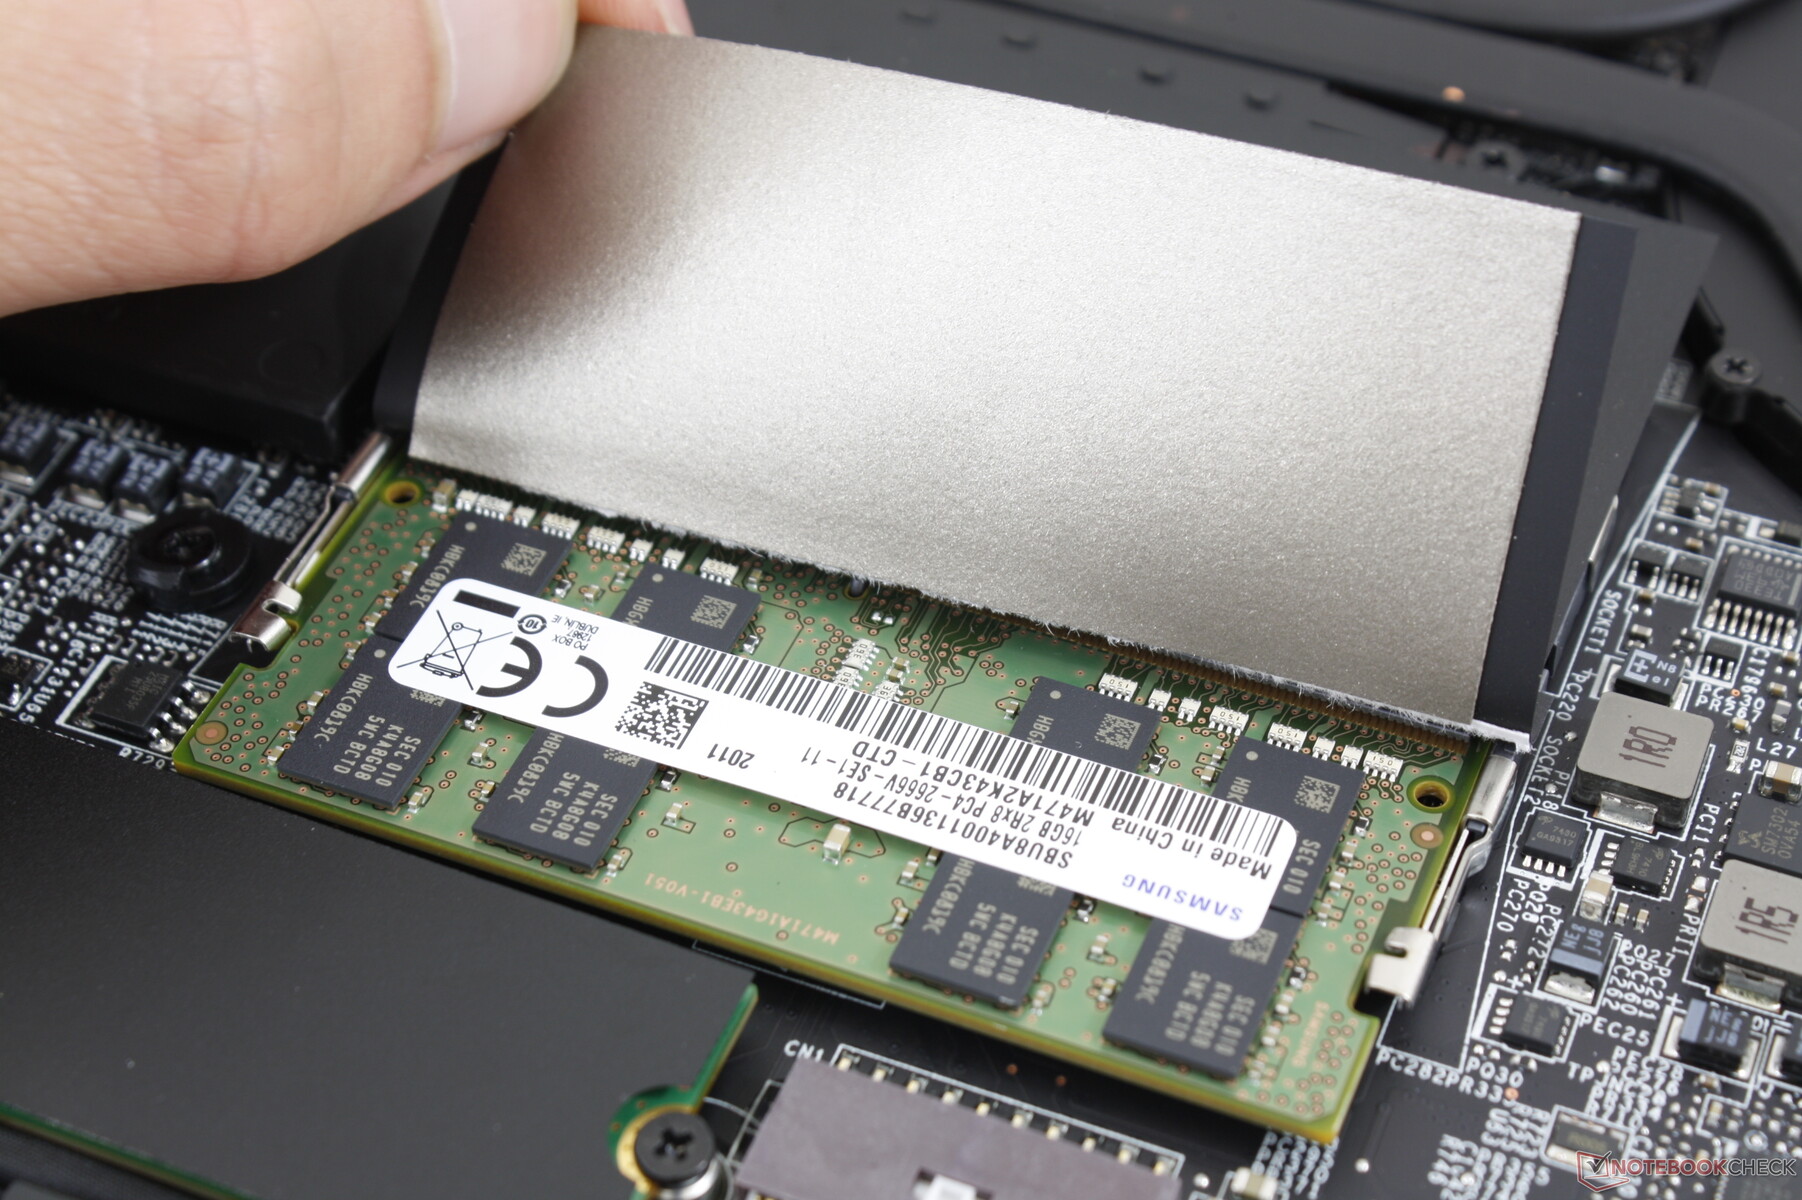
Fortunatamente, MSI ha eliminato il layout della scheda madre capovolta che rendeva gli aggiornamenti del GS65 più difficili del necessario. I proprietari hanno accesso diretto a due alloggiamenti, due slot SODIMM, il modulo WLAN e la batteria interna.
Accessori e Garanzia
Non ci sono extra degni di nota nella confezione, il che è un po' deludente perché il GS65 è stato spedito con un pratico panno di velluto per la pulizia. La garanzia standard di un anno del produttore si applica con opzioni aggiuntive se acquistata da rivenditori come Xotic PC.
Dispositivi di Input
Tastiera e Touchpad
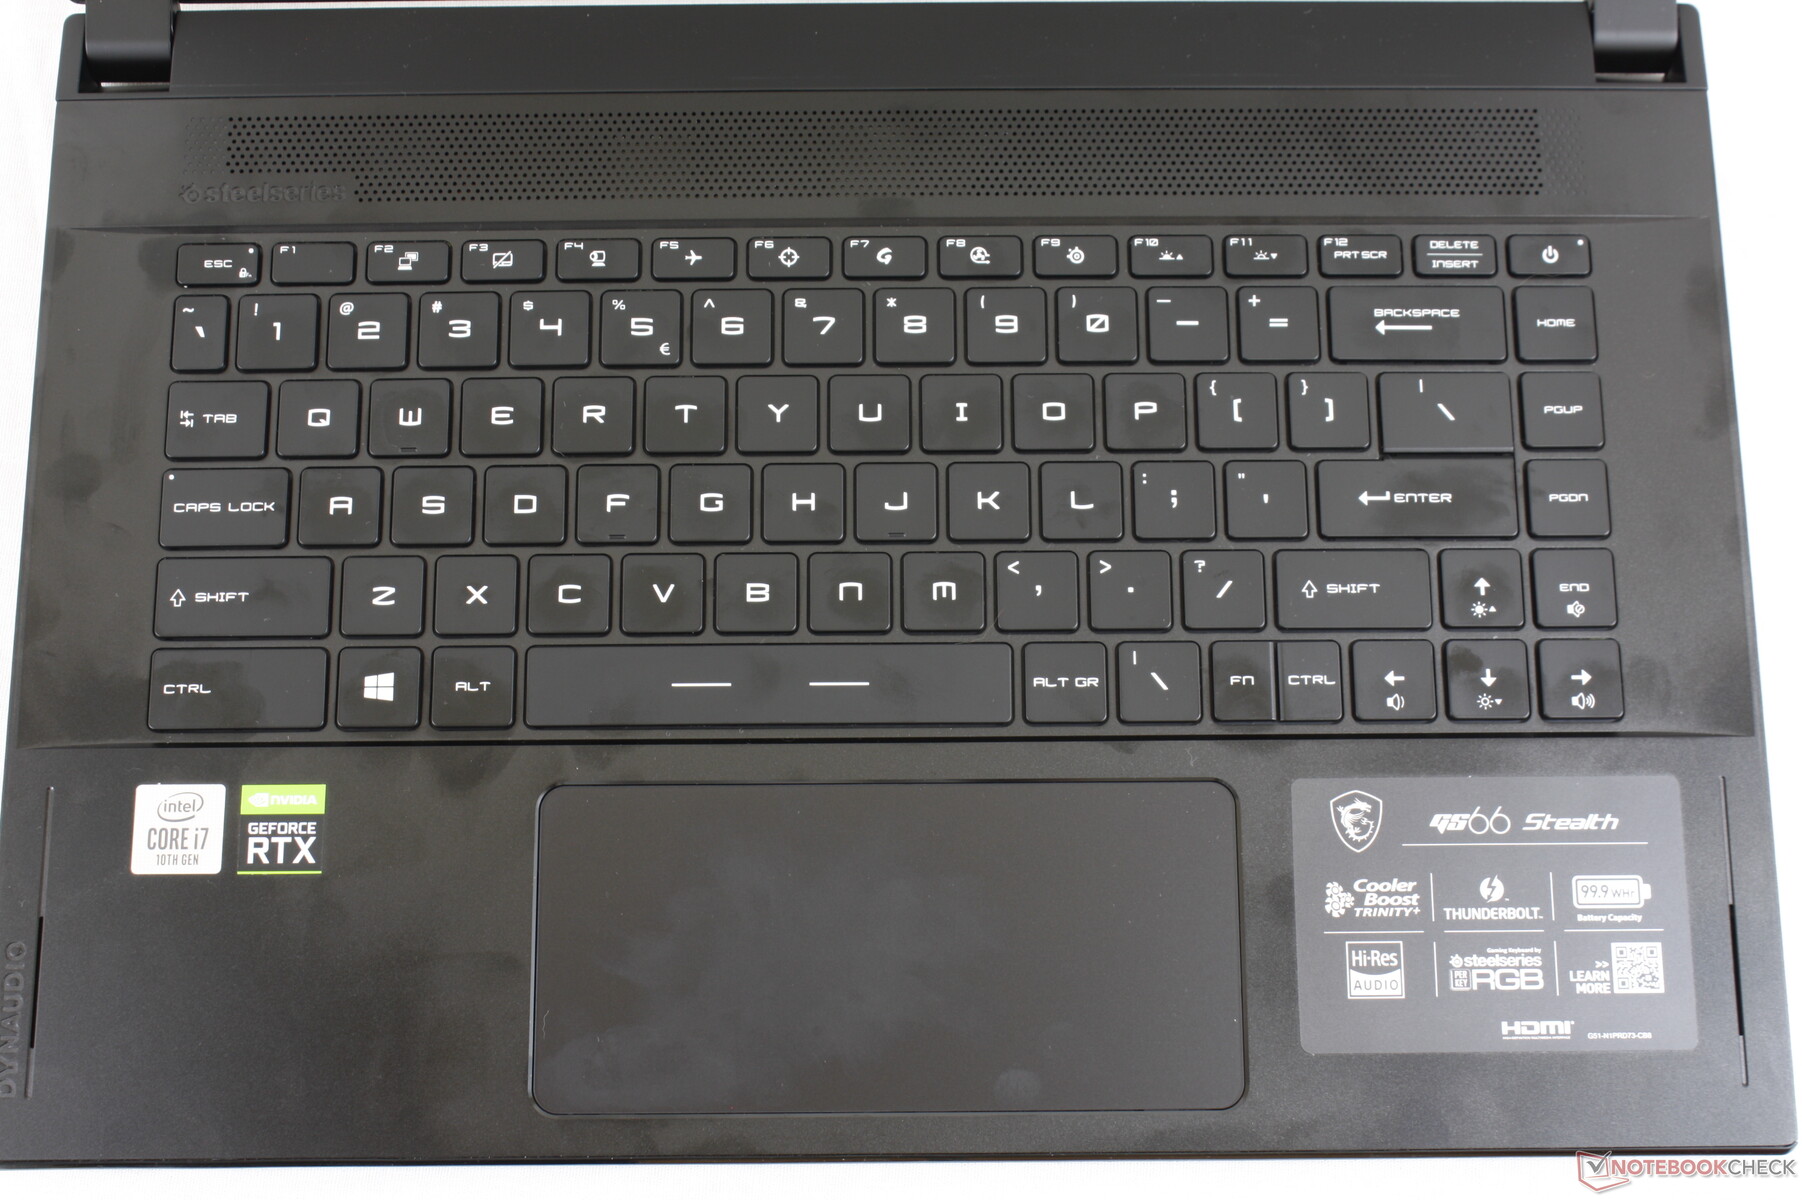
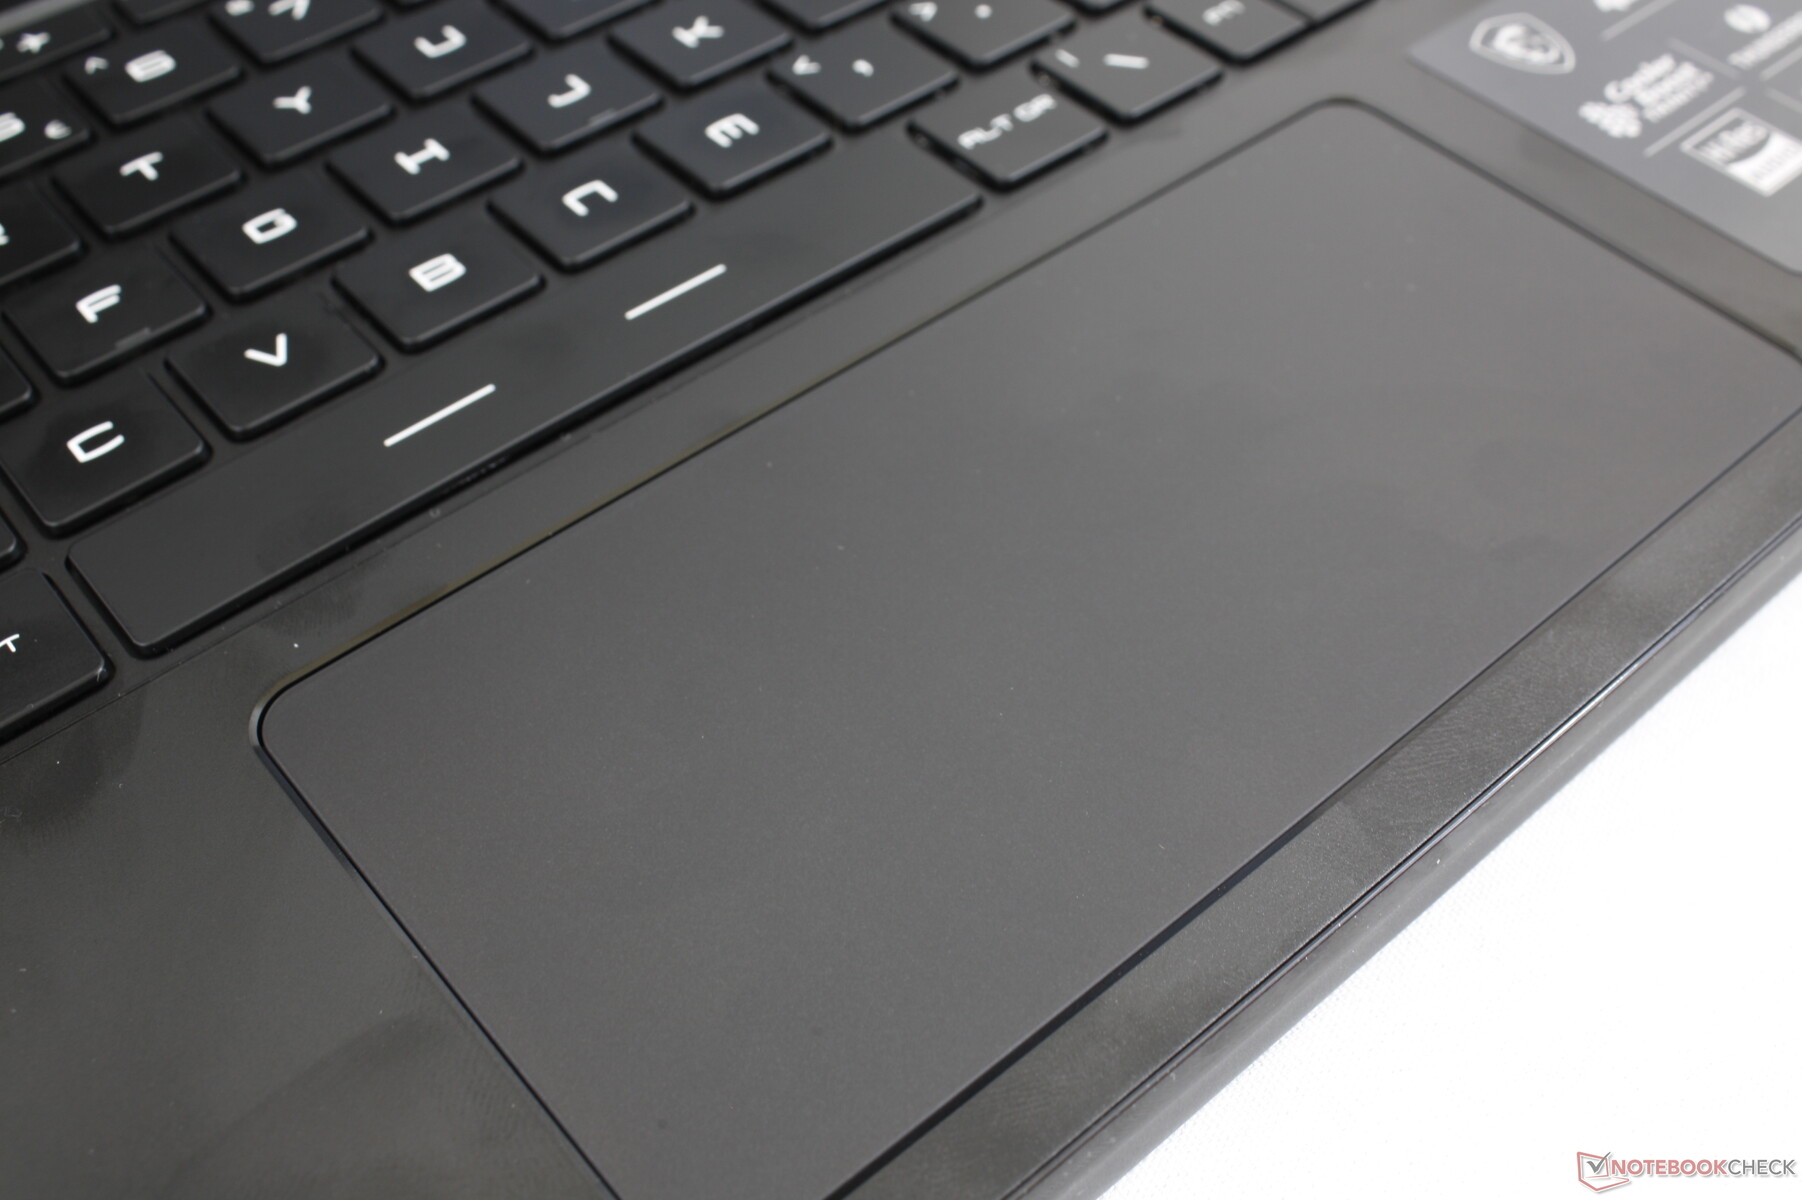
Consultate la nostra recensione qui per la nostra valutazione della tastiera e del touchpad. In generale, non riteniamo che l'esperienza di digitazione sia migliore o peggiore di quella del GS65 dell'anno scorso, anche se MSI ha rivisto il layout e il design. Il clickpad, tuttavia, è più grande e più solido questa volta per essere più facile da usare.
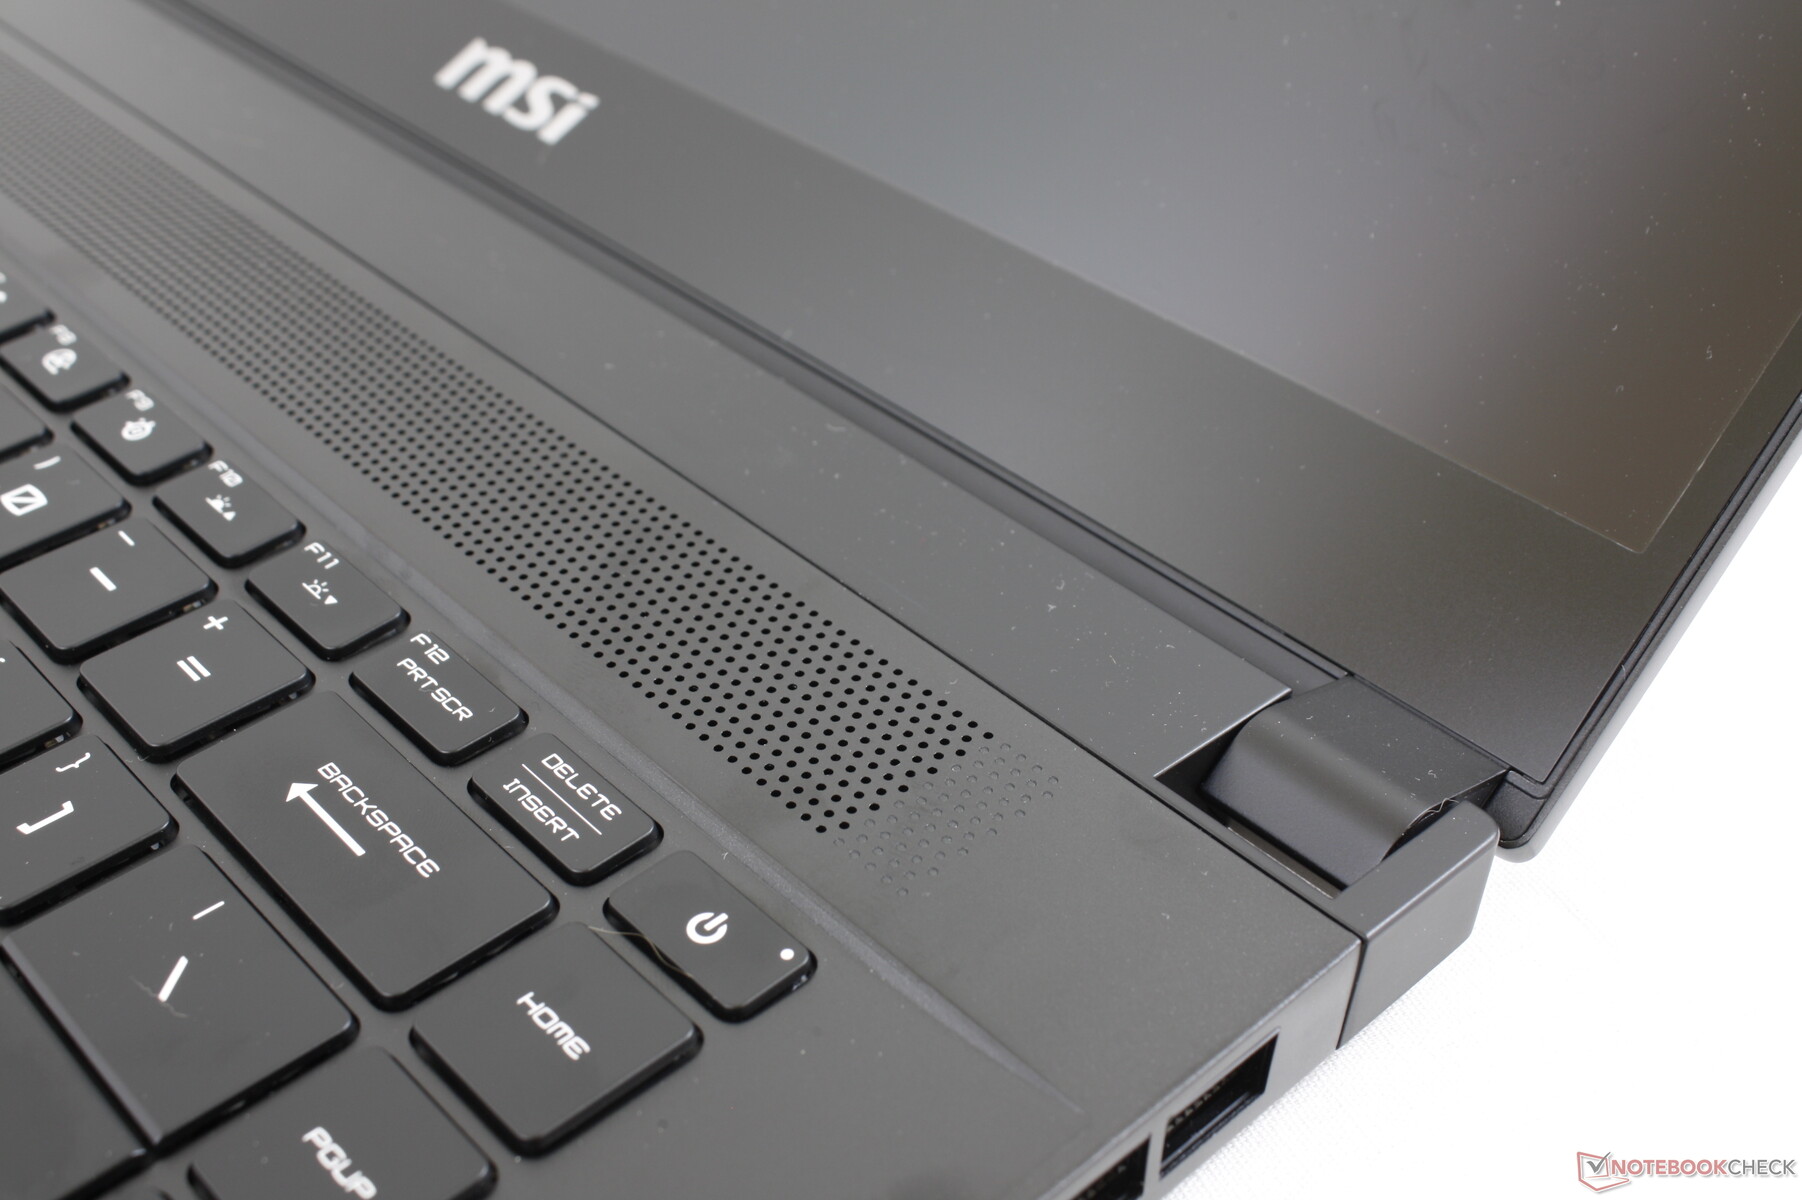
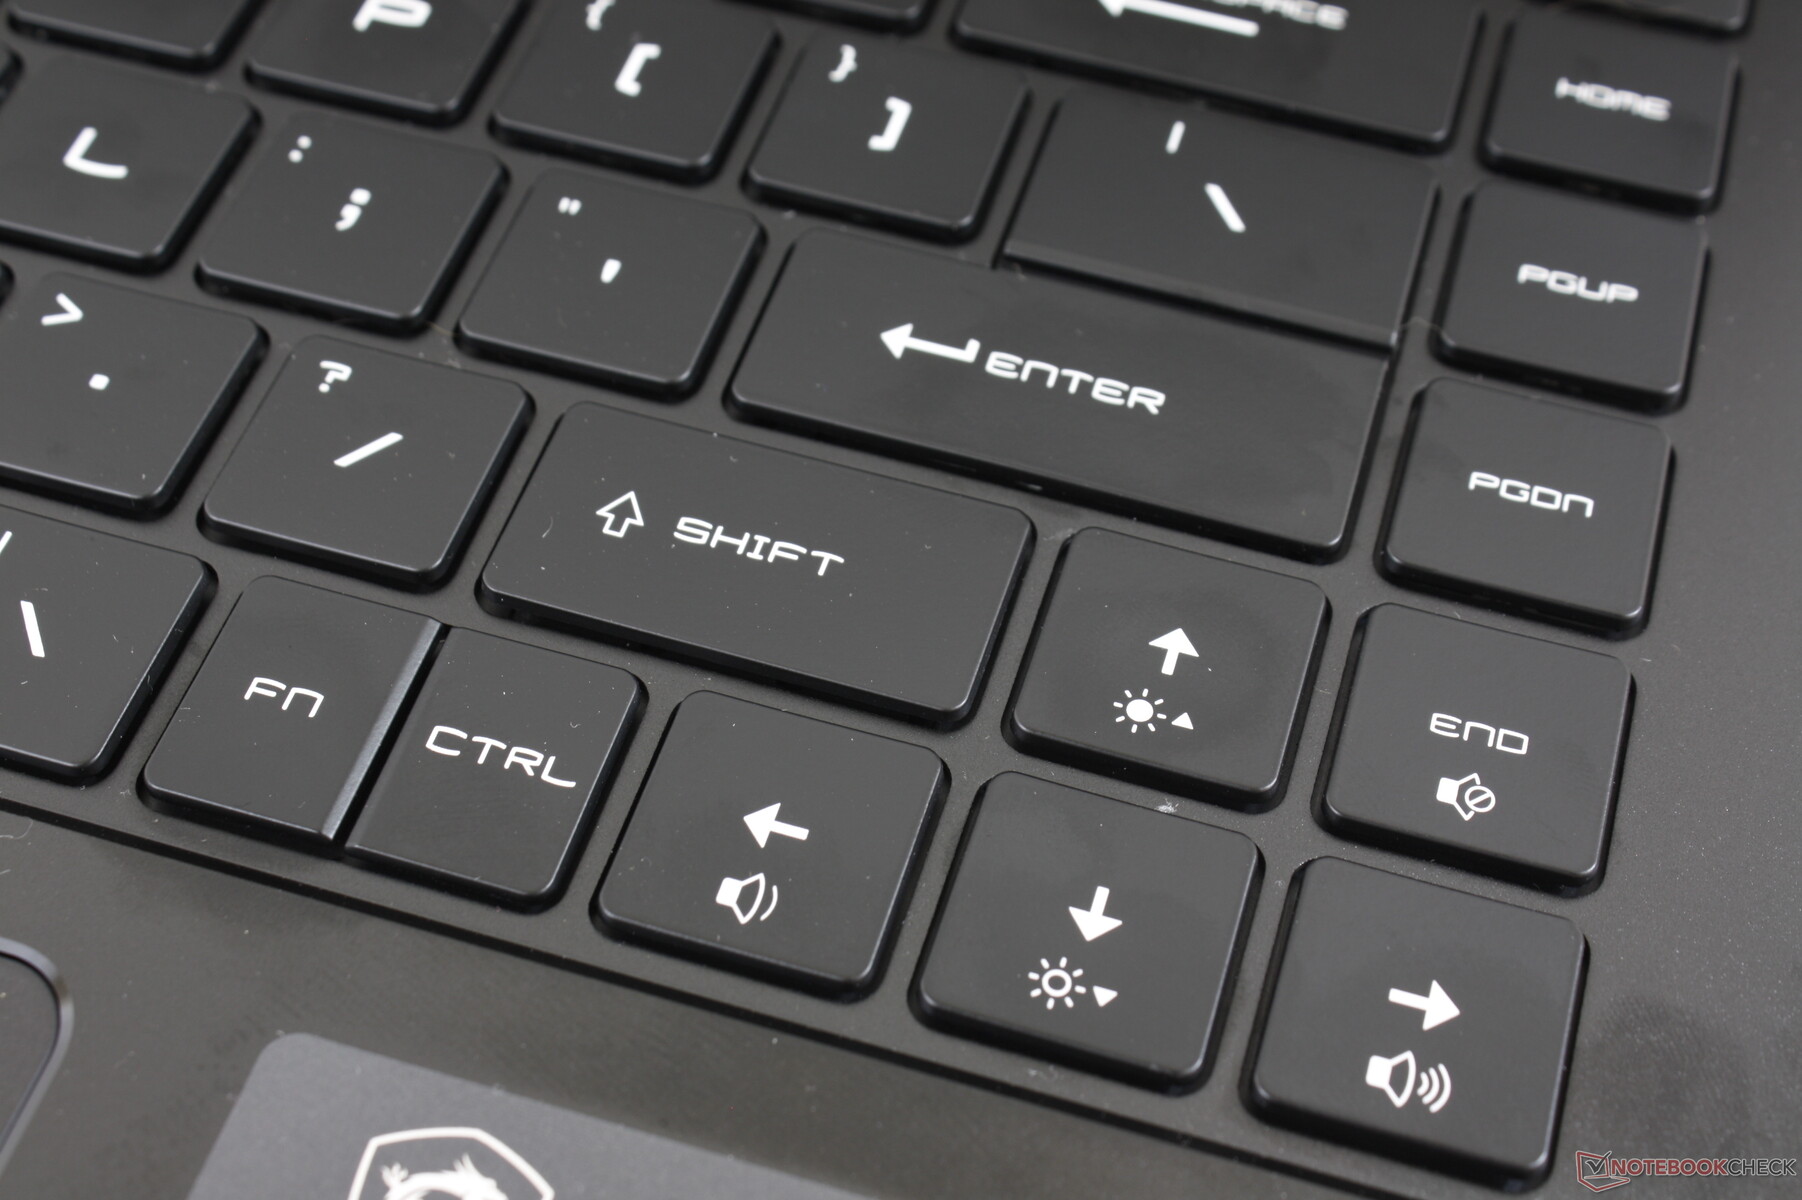
Purtroppo i controlli della luminosità sono inspiegabilmente scambiati sulla tastiera.

Display
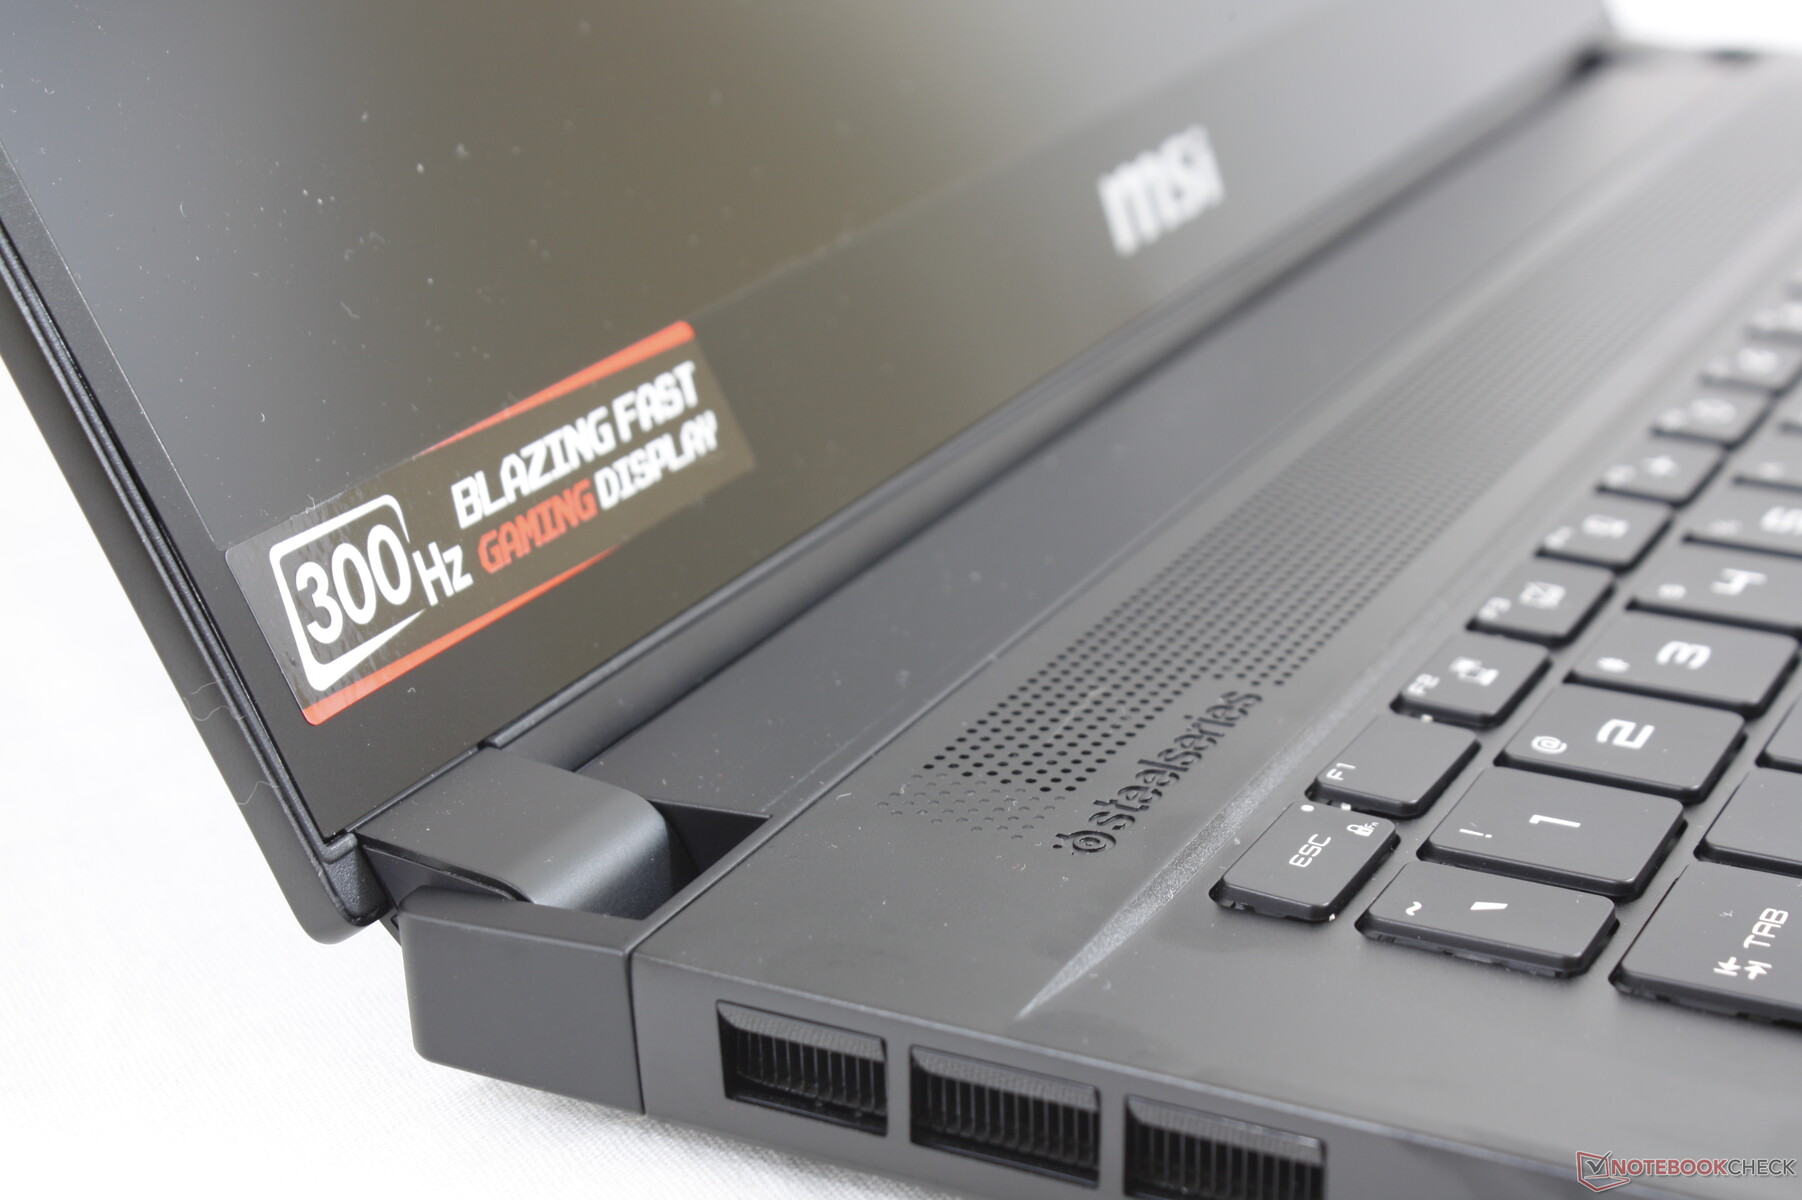
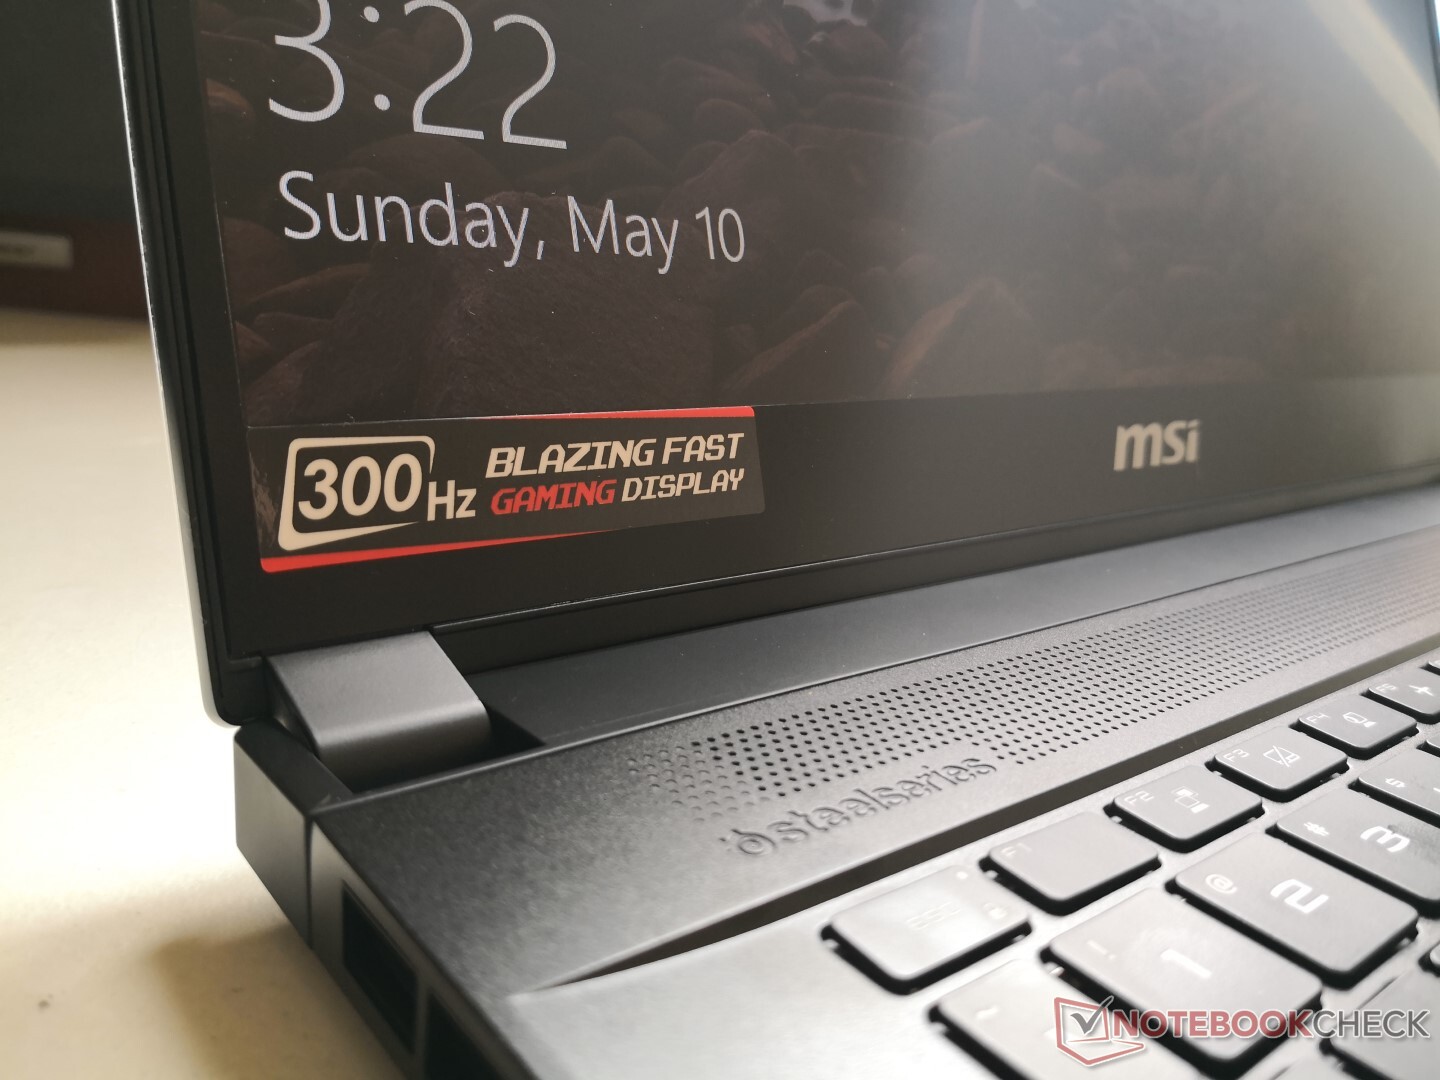
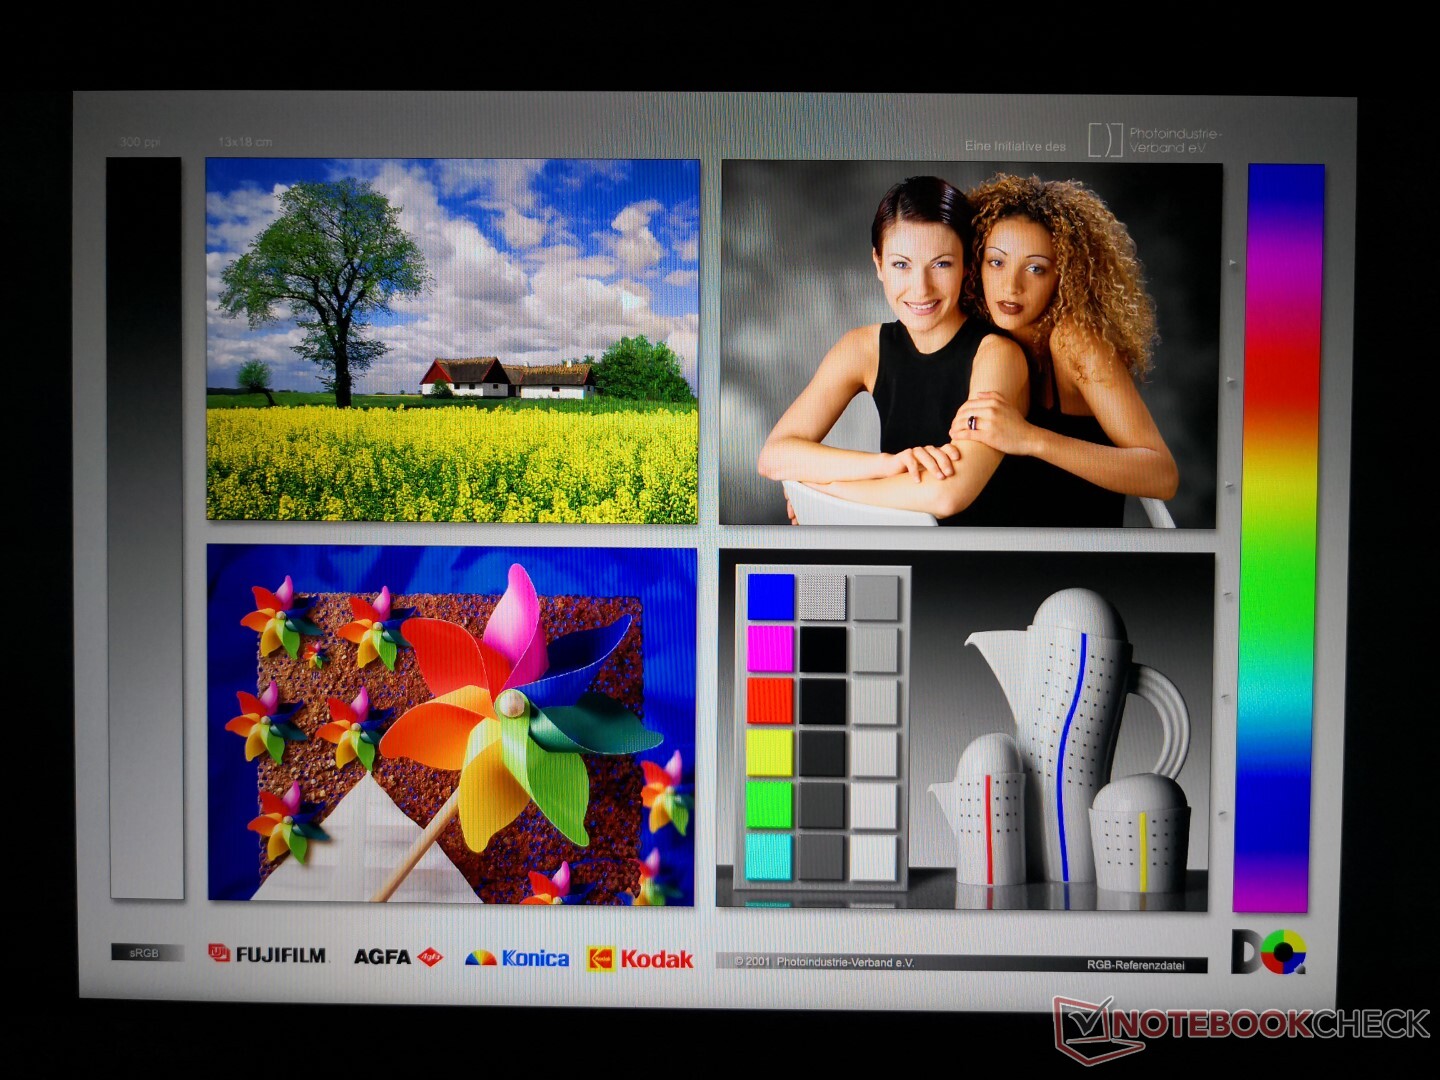
Tutte le SKU attuali sono dotate di display 1080p a 240 Hz o 300 Hz. La nostra seconda unità di prova GS66 utilizza lo stesso pannello IPS AUO B156HAN12.0 IPS a 300 Hz che si trova sulla nostra prima unità di prova. Il rapporto di contrasto profondo (~1500:1), l'ampio spazio colore (~100% sRGB) e i tempi di risposta molto veloci (da 3 ms a 5 ms) rimangono intatti per rappresentare un display di alta qualità adatto ad un portatile gaming di punta. Razer sta per lanciare la propria opzione di display a 300 Hz anche per il Blade 15 che probabilmente utilizzerà questo stesso pannello AU Optronics.
Tenete presente che non è necessario raggiungere i 300 FPS nei giochi per poter usufruire di un display a 300 Hz. Anche così, ci piacerebbe vedere le opzioni QHD o 4K UHD in futuro.

| |||||||||||||||||||||||||
Distribuzione della luminosità: 92 %
Al centro con la batteria: 339.4 cd/m²
Contrasto: 1414:1 (Nero: 0.24 cd/m²)
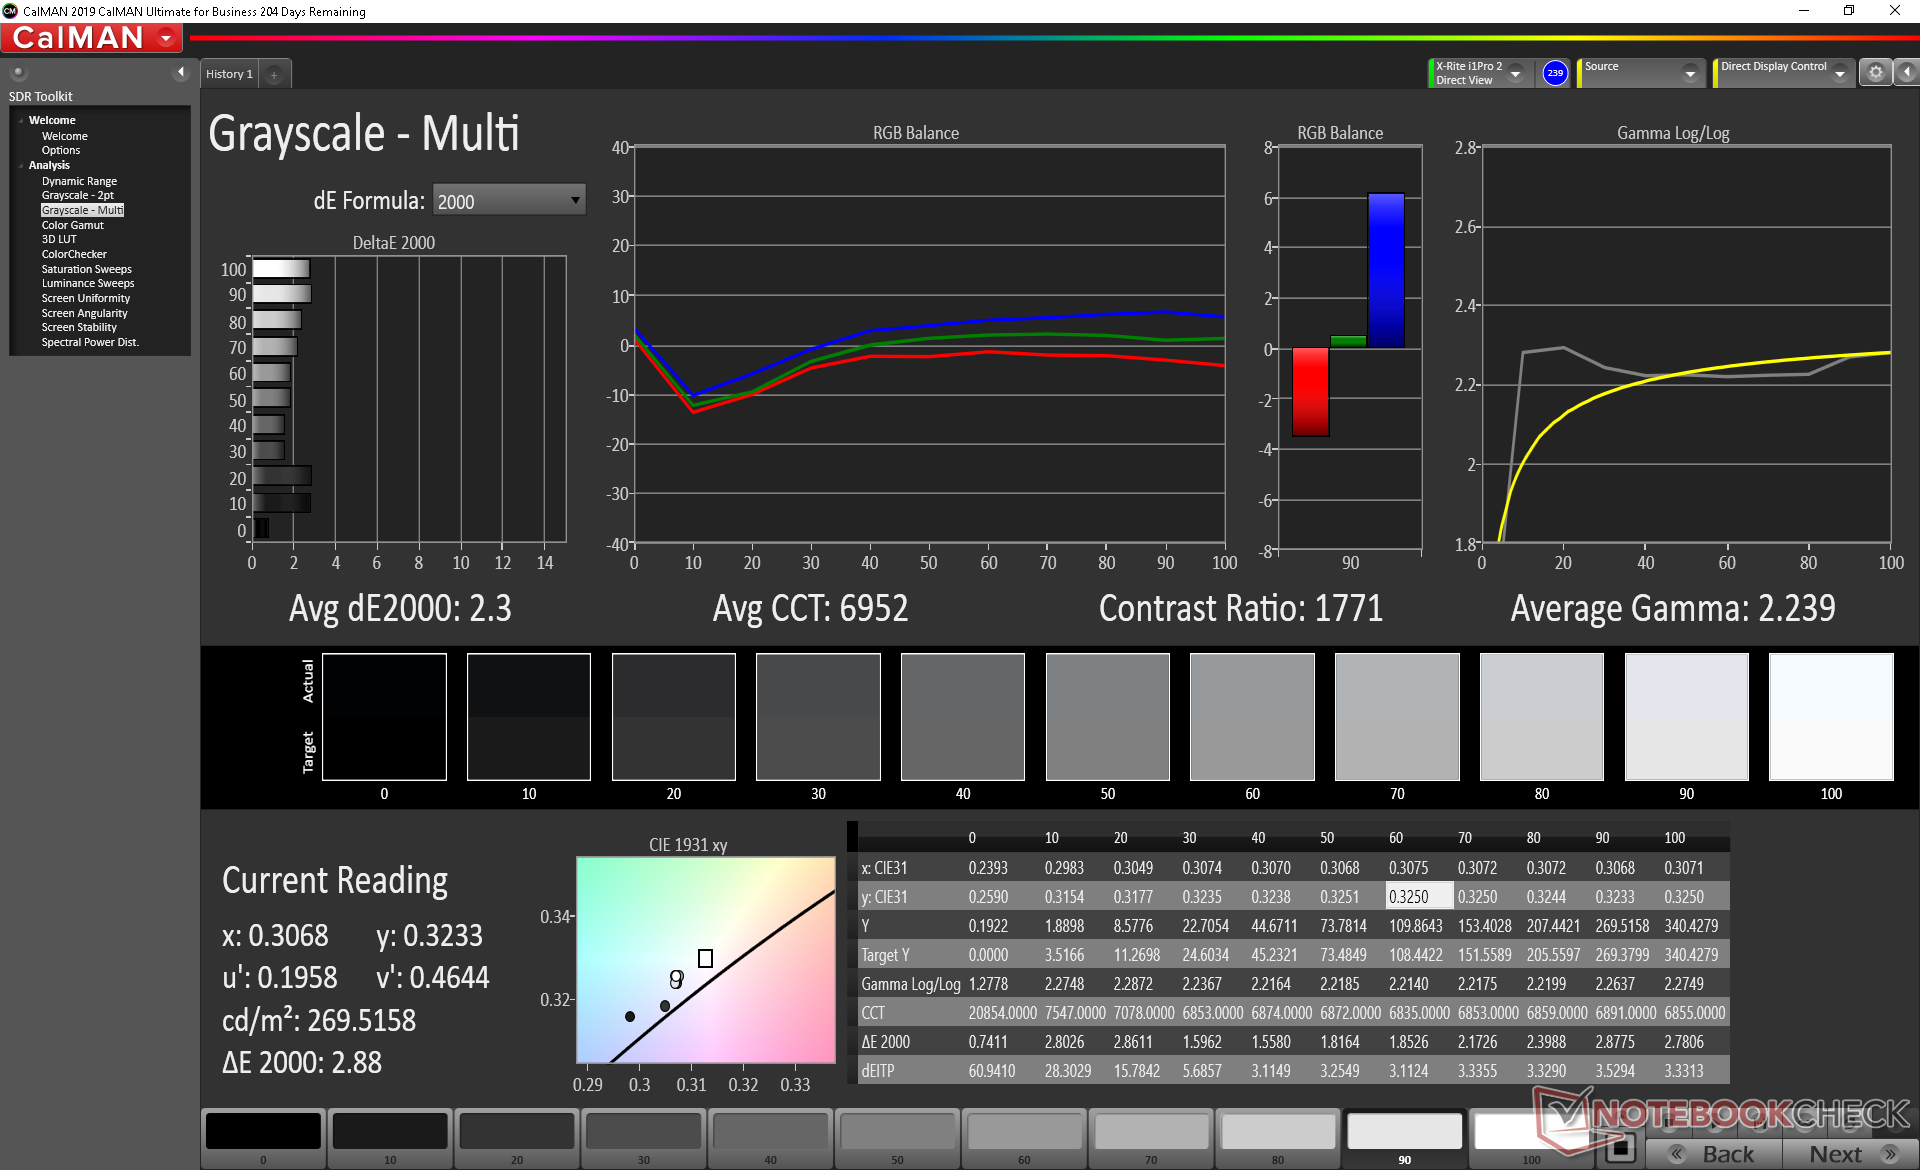
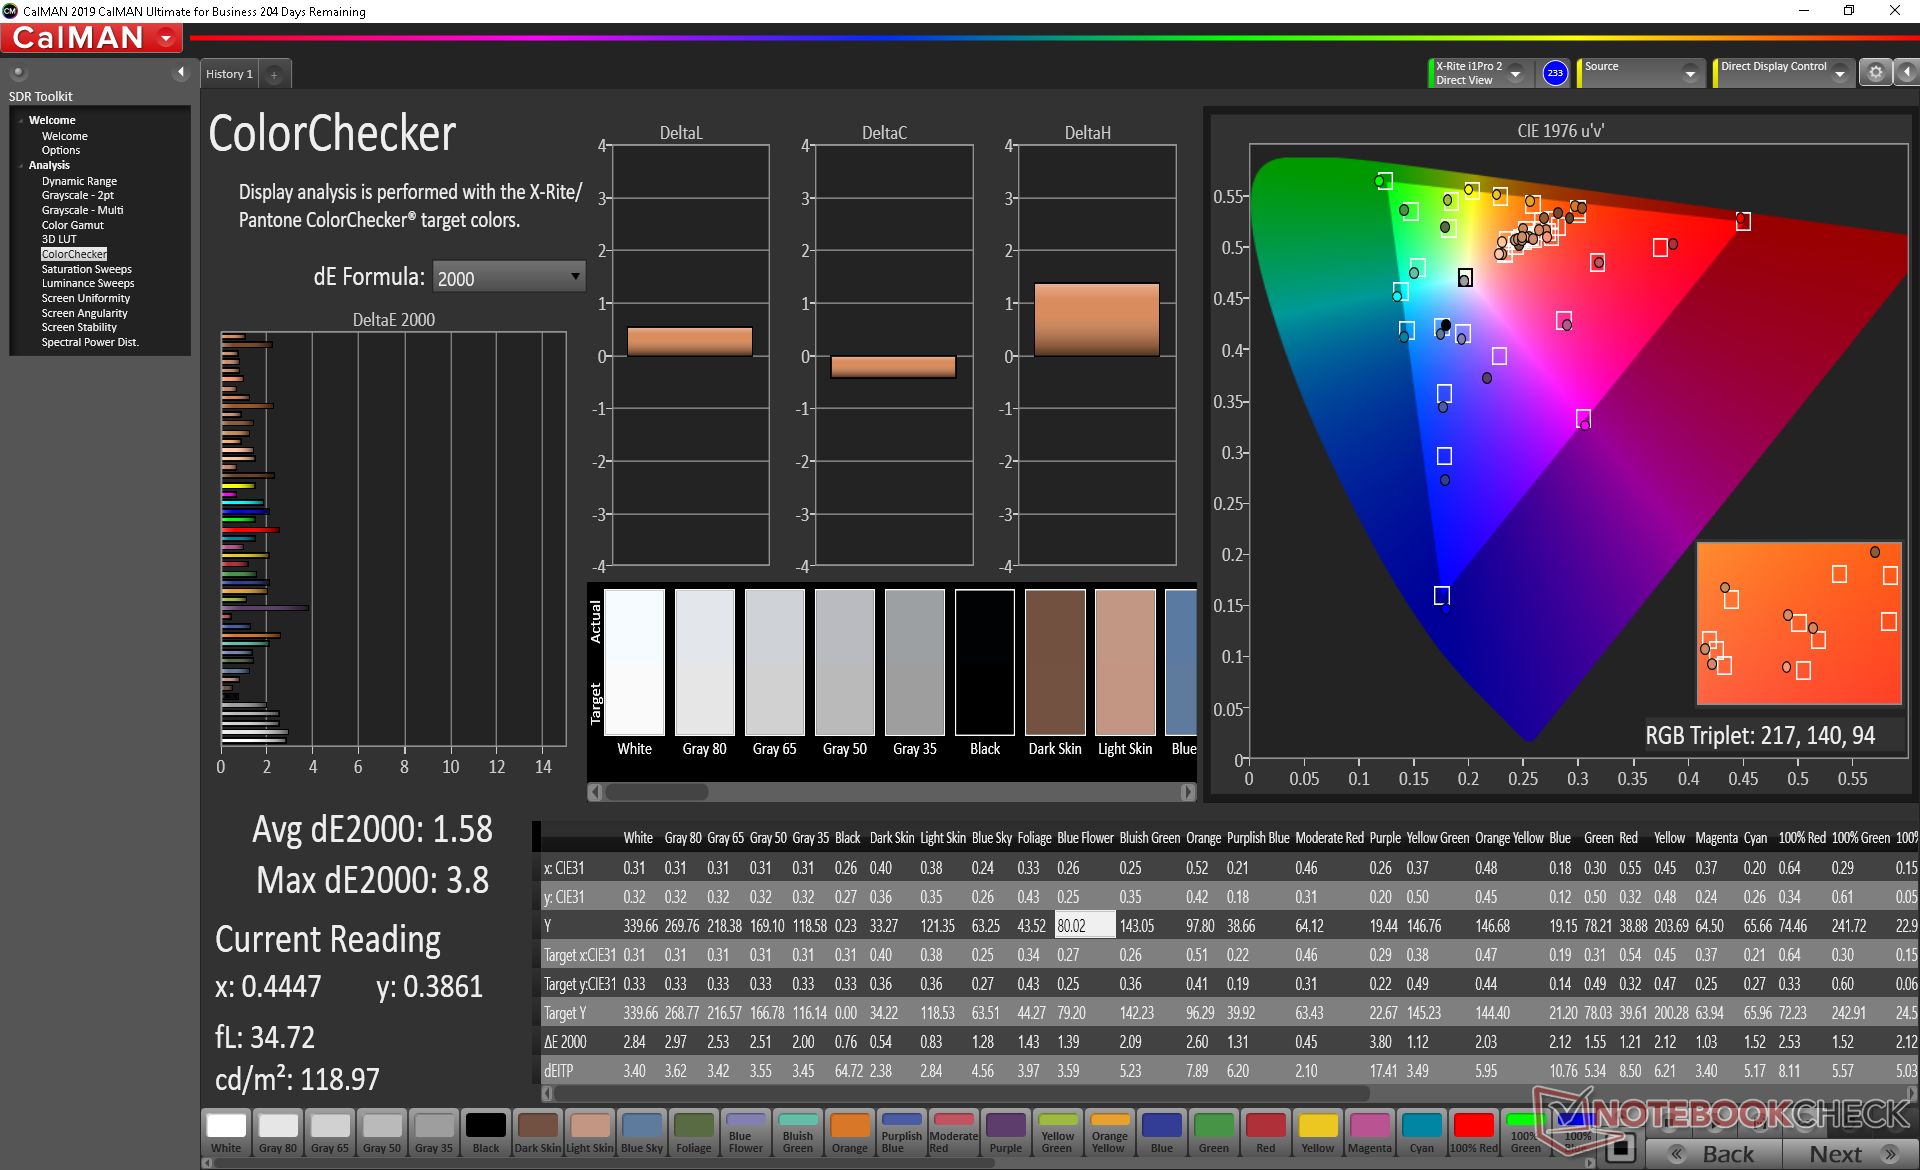
ΔE ColorChecker Calman: 1.58 | ∀{0.5-29.43 Ø4.71}
calibrated: 1.47
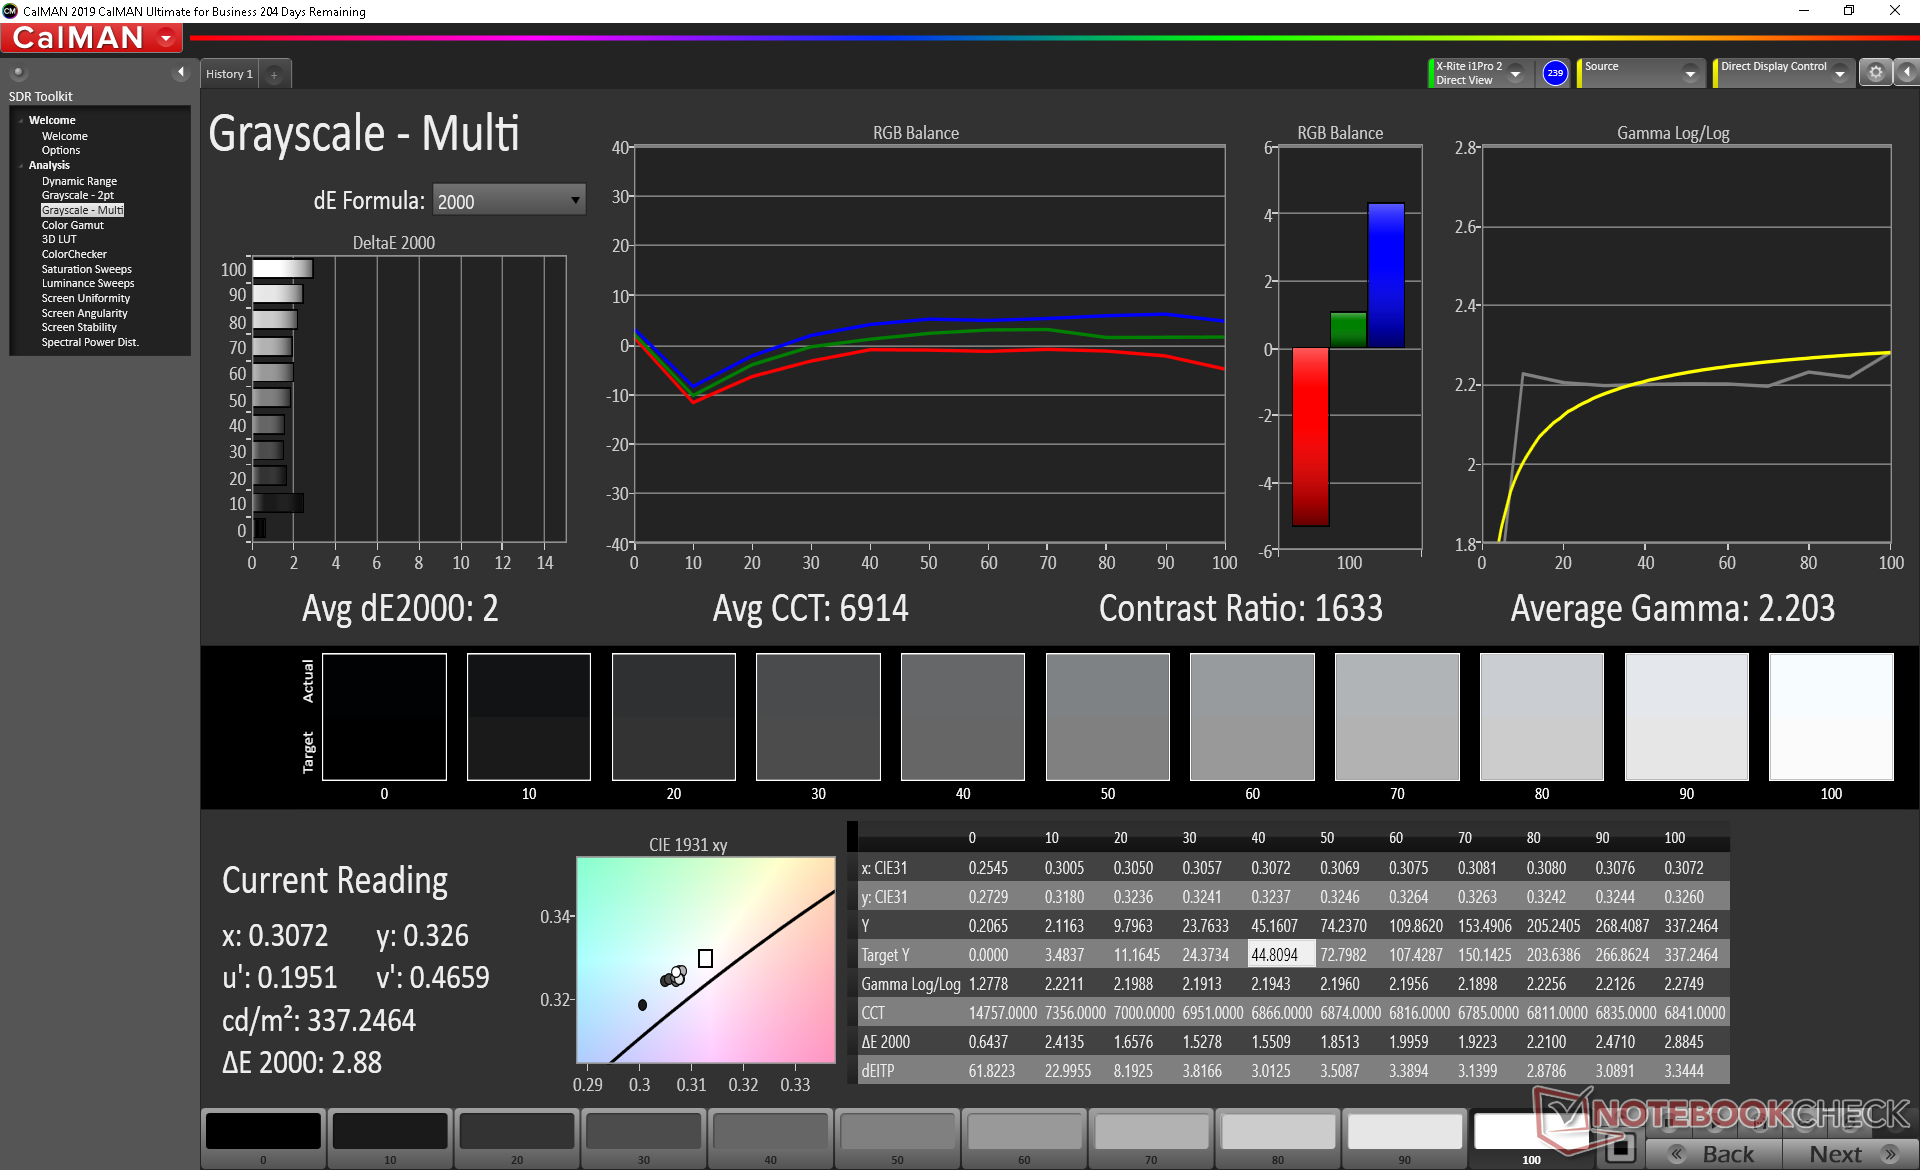
ΔE Greyscale Calman: 2.3 | ∀{0.09-98 Ø4.96}
99.4% sRGB (Argyll 1.6.3 3D)
64.8% AdobeRGB 1998 (Argyll 1.6.3 3D)
71.1% AdobeRGB 1998 (Argyll 3D)
99.1% sRGB (Argyll 3D)
69.9% Display P3 (Argyll 3D)
Gamma: 2.24
CCT: 6952 K
| MSI GS66 10SGS AU Optronics B156HAN12.0, IPS, 15.6", 1920x1080 | MSI GS65 Stealth 9SG Sharp LQ156M1JW03 (SHP14C5), IPS, 15.6", 1920x1080 | Asus Zephyrus S GX502GW AU Optronics B156HAN08.2 (AUO82ED), IPS, 15.6", 1920x1080 | Razer Blade 15 RTX 2080 Max-Q Sharp LQ156M1JW03 (SHP14C5), IPS, 15.6", 1920x1080 | HP Omen X 2S 15-dg0075cl AU Optronics AUO82ED, IPS, 15.6", 1920x1080 | Lenovo Legion Y740-15ICHg BOE NV156FHM-N4J, IPS, 15.6", 1920x1080 | |
|---|---|---|---|---|---|---|
| Display | -3% | -7% | -3% | -6% | -6% | |
| Display P3 Coverage (%) | 69.9 | 67.6 -3% | 64.9 -7% | 66.9 -4% | 66.2 -5% | 67.7 -3% |
| sRGB Coverage (%) | 99.1 | 97.5 -2% | 91 -8% | 98.1 -1% | 92.3 -7% | 91.6 -8% |
| AdobeRGB 1998 Coverage (%) | 71.1 | 68.9 -3% | 65.9 -7% | 68.5 -4% | 67.2 -5% | 67.1 -6% |
| Response Times | -21% | 24% | -9% | -22% | -35% | |
| Response Time Grey 50% / Grey 80% * (ms) | 11.2 ? | 13.6 ? -21% | 7.2 ? 36% | 12.8 ? -14% | 15.2 ? -36% | 19 ? -70% |
| Response Time Black / White * (ms) | 10 ? | 12 ? -20% | 8.8 ? 12% | 10.4 ? -4% | 10.8 ? -8% | 10 ? -0% |
| PWM Frequency (Hz) | 23260 ? | 23810 ? | ||||
| Screen | -0% | -23% | -6% | -58% | -18% | |
| Brightness middle (cd/m²) | 339.4 | 282.3 -17% | 286 -16% | 293 -14% | 324.8 -4% | 477 41% |
| Brightness (cd/m²) | 331 | 269 -19% | 275 -17% | 270 -18% | 316 -5% | 431 30% |
| Brightness Distribution (%) | 92 | 90 -2% | 90 -2% | 87 -5% | 84 -9% | 84 -9% |
| Black Level * (cd/m²) | 0.24 | 0.32 -33% | 0.37 -54% | 0.29 -21% | 0.26 -8% | 0.175 27% |
| Contrast (:1) | 1414 | 882 -38% | 773 -45% | 1010 -29% | 1249 -12% | 2726 93% |
| Colorchecker dE 2000 * | 1.58 | 1.17 26% | 2.19 -39% | 1.69 -7% | 4.96 -214% | 4.17 -164% |
| Colorchecker dE 2000 max. * | 3.8 | 3.29 13% | 4.4 -16% | 3.37 11% | 8.95 -136% | 6.97 -83% |
| Colorchecker dE 2000 calibrated * | 1.47 | 1.06 28% | 2.27 -54% | 1.24 16% | 3.23 -120% | 2.51 -71% |
| Greyscale dE 2000 * | 2.3 | 1.3 43% | 2.2 4% | 2.3 -0% | 5 -117% | 3.49 -52% |
| Gamma | 2.24 98% | 2.2 100% | 2.41 91% | 2.3 96% | 2.21 100% | 2.5 88% |
| CCT | 6952 93% | 6643 98% | 6405 101% | 6758 96% | 7742 84% | 7076 92% |
| Color Space (Percent of AdobeRGB 1998) (%) | 64.8 | 63.8 -2% | 59 -9% | 63 -3% | 59.8 -8% | 60 -7% |
| Color Space (Percent of sRGB) (%) | 99.4 | 97.5 -2% | 91 -8% | 98.5 -1% | 91.8 -8% | 91 -8% |
| Media totale (Programma / Settaggio) | -8% /
-3% | -2% /
-14% | -6% /
-6% | -29% /
-44% | -20% /
-18% |
* ... Meglio usare valori piccoli
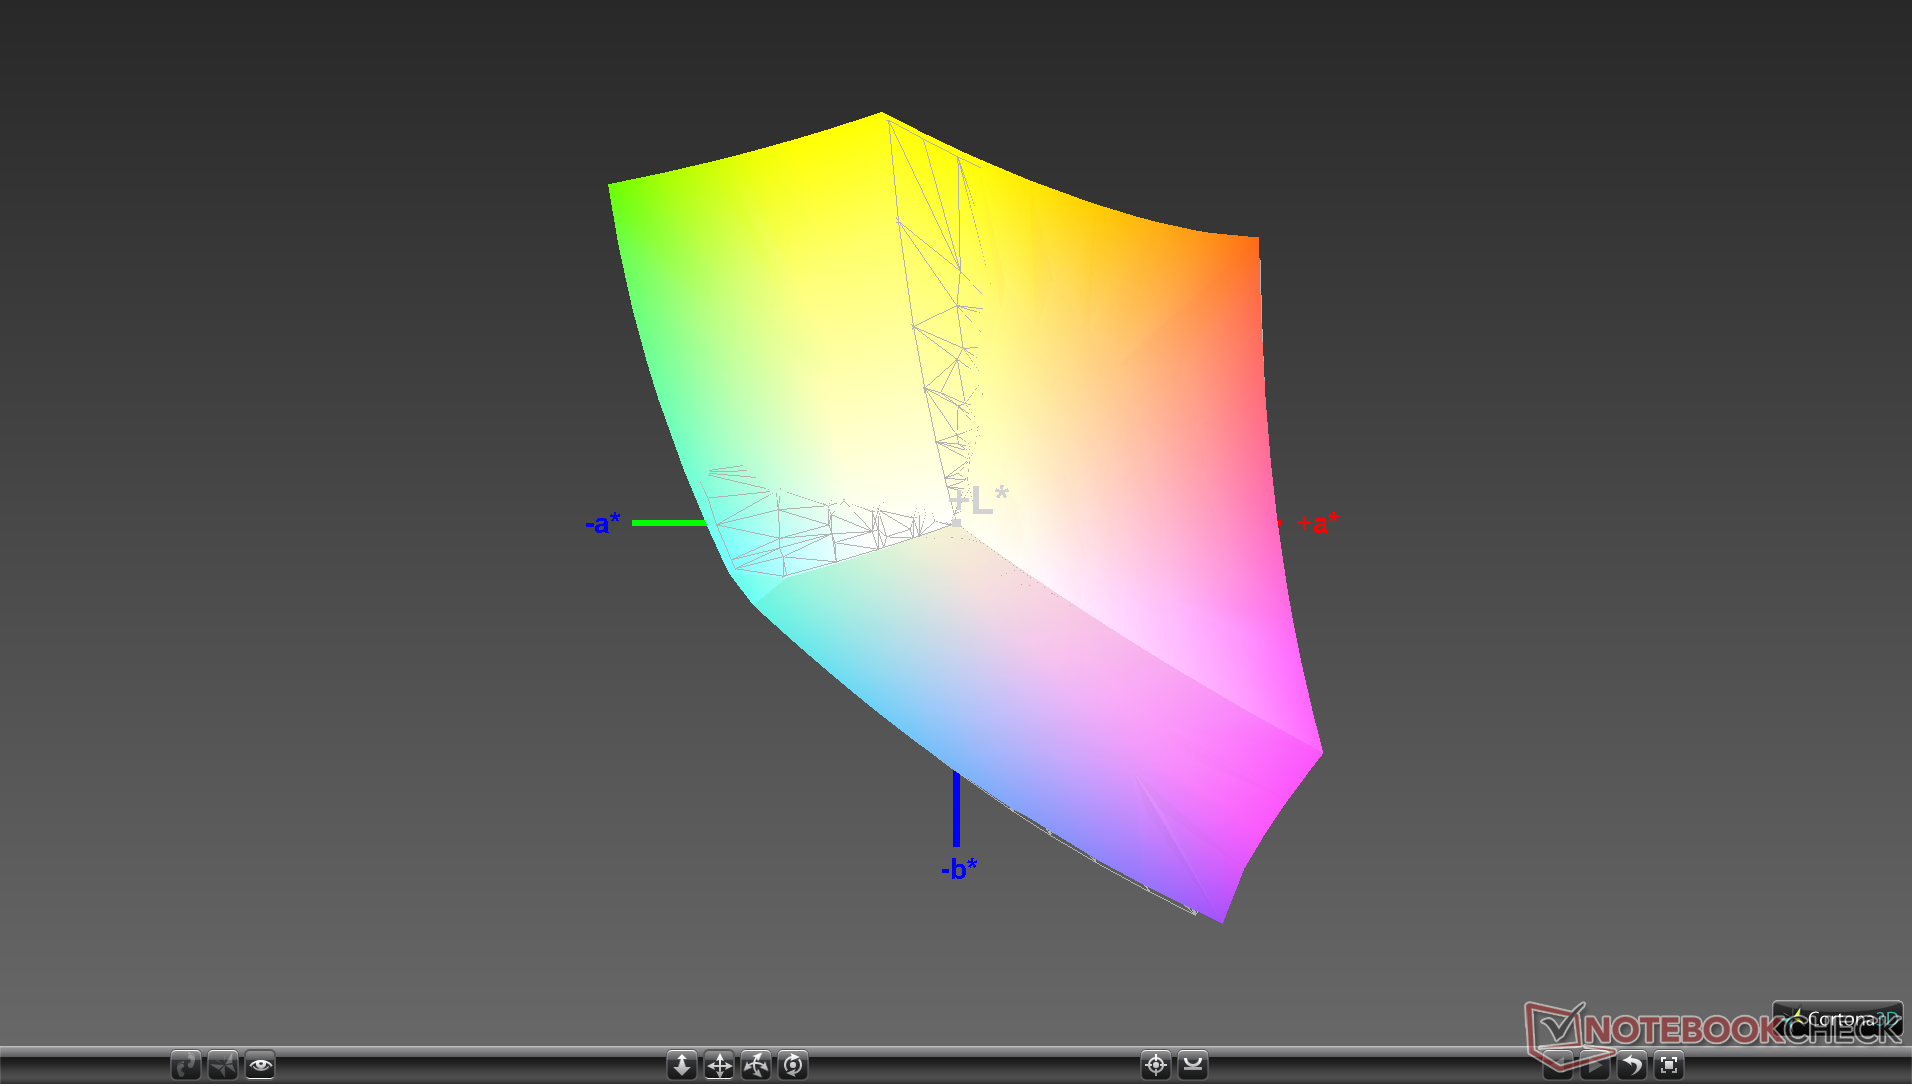
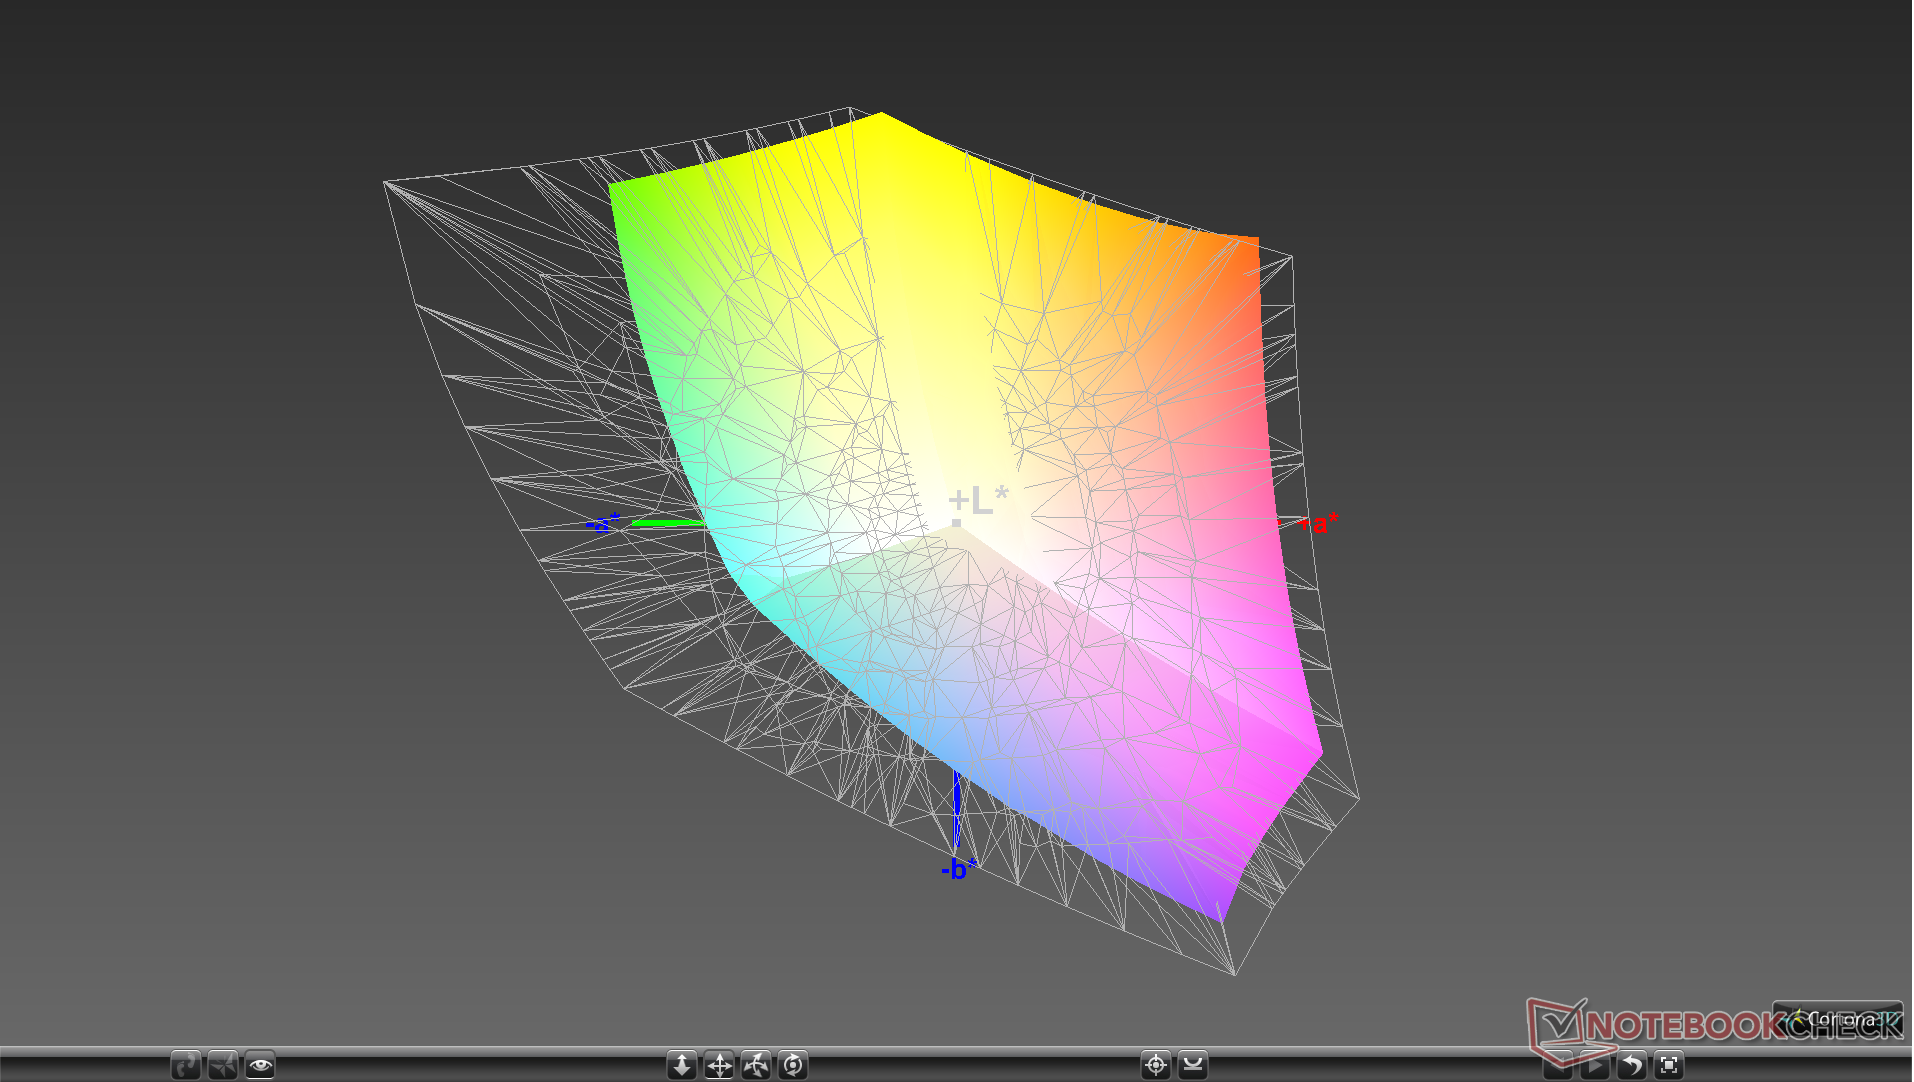
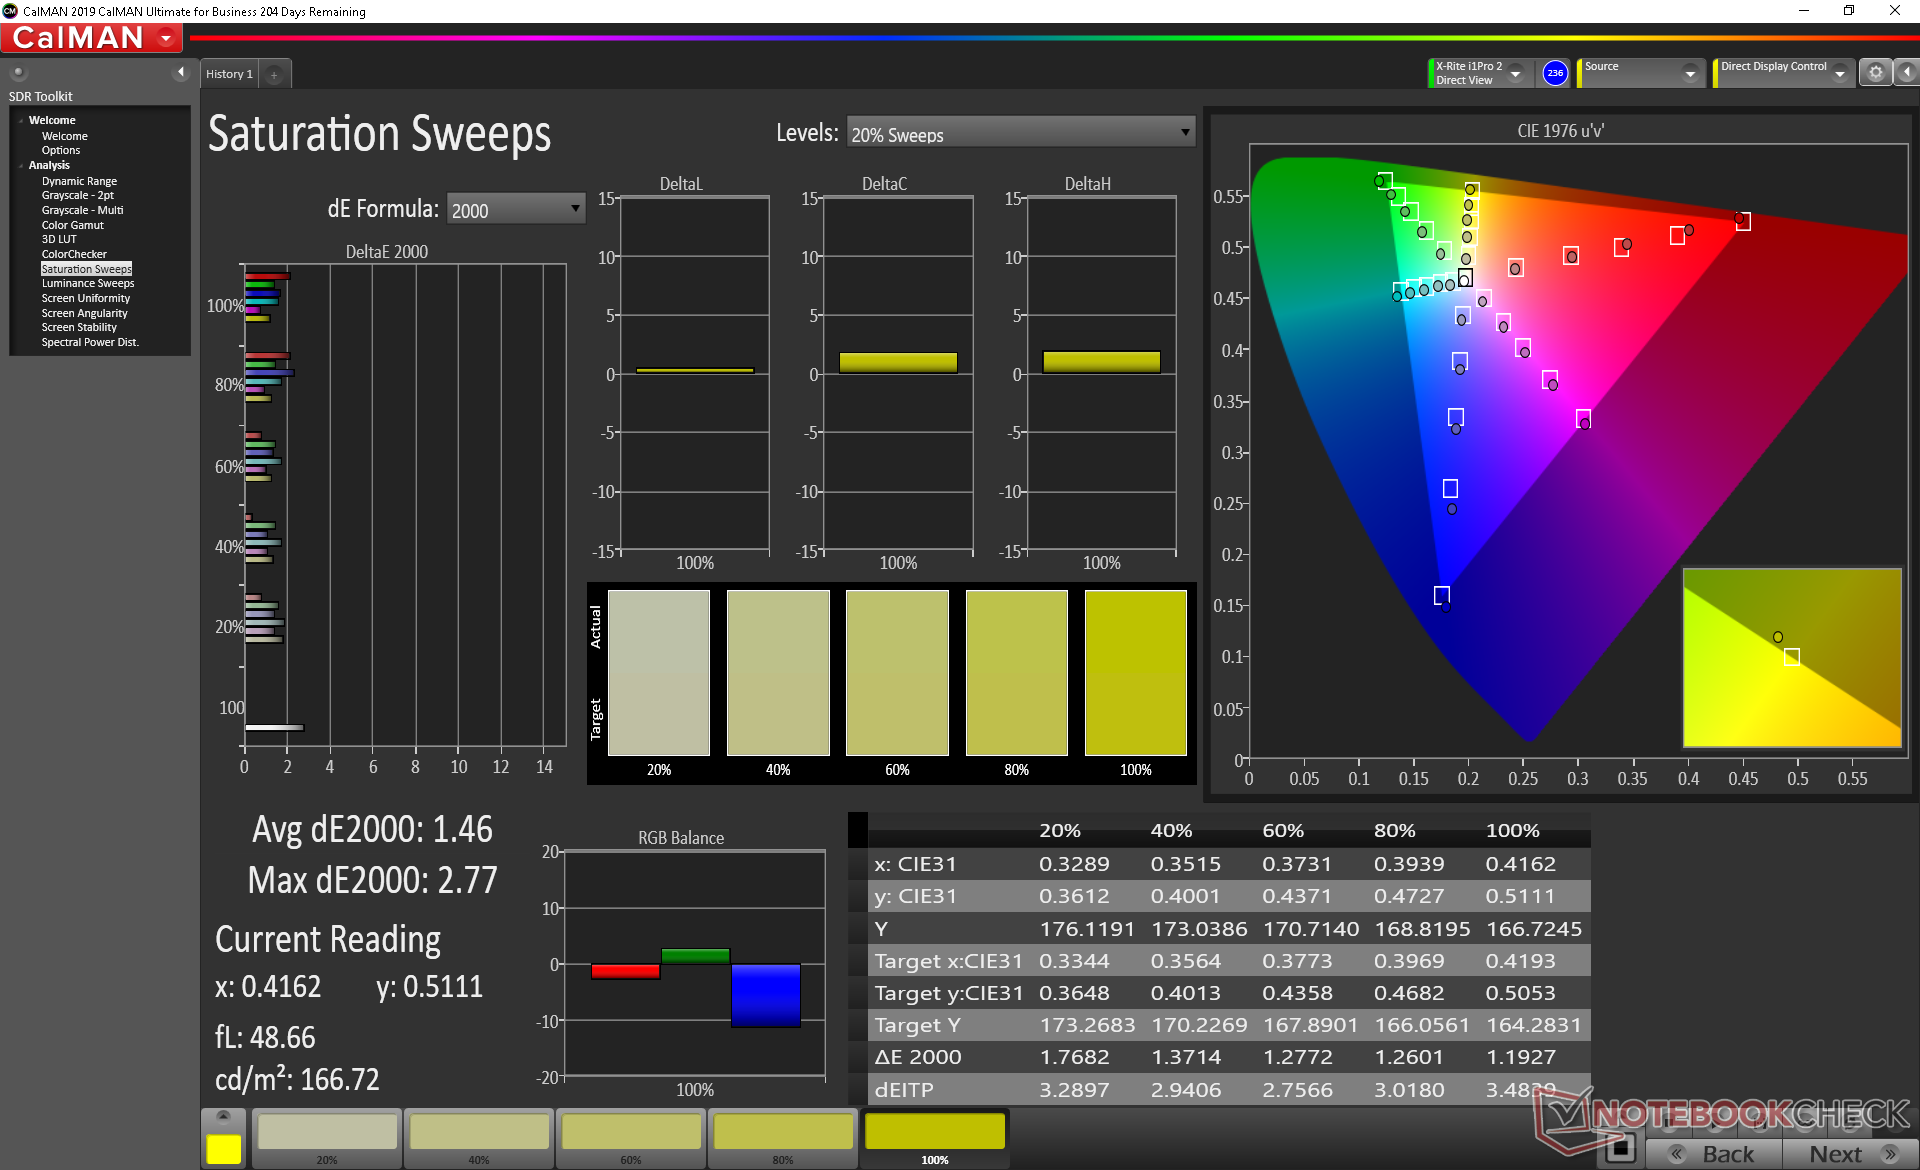
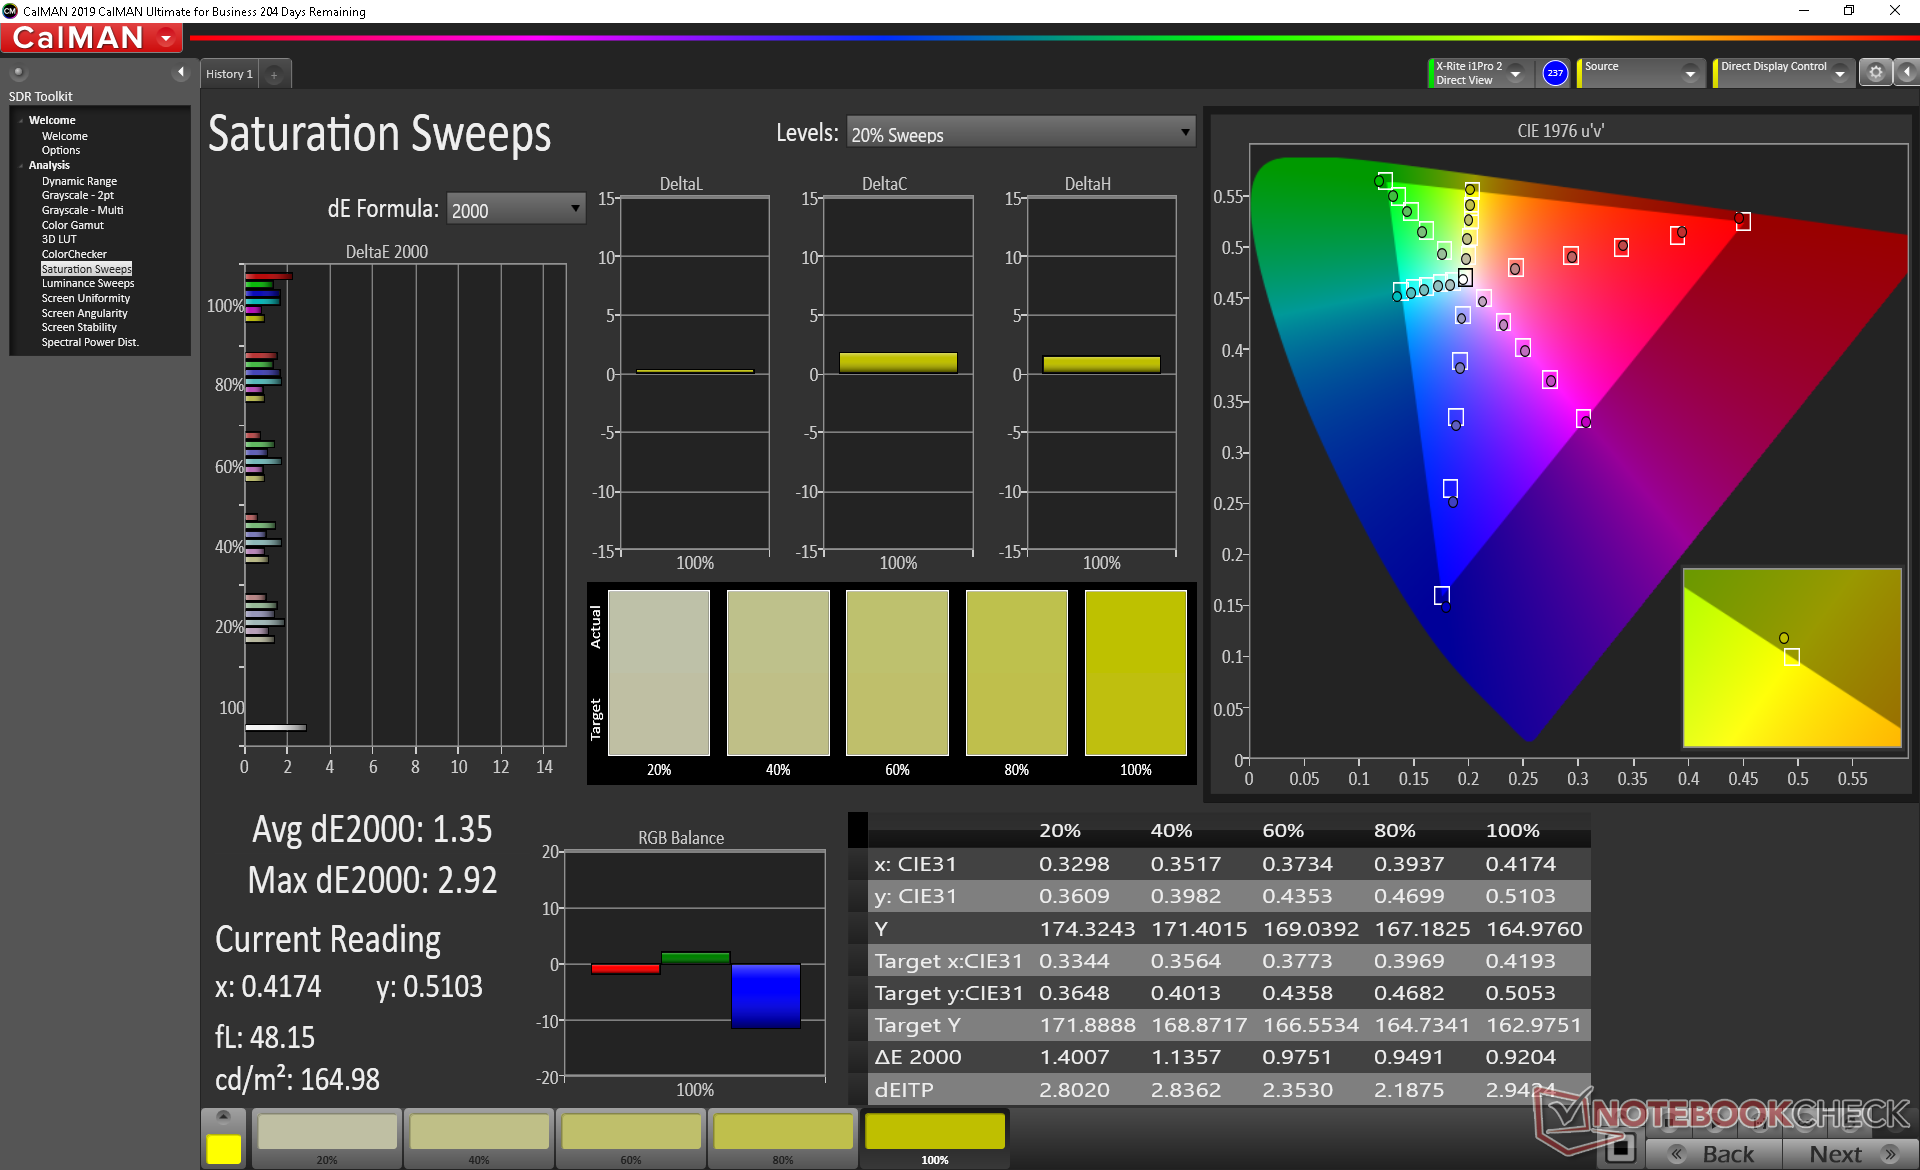
Le misurazioni del colorimetro X-Rite mostrano un display ben calibrato al primo utilizzo e il nostro tentativo di calibrare ulteriormente il display non porterebbe ad alcun miglioramento significativo. I valori medi della scala di grigi DeltaE e del ColorChecker sono già eccellenti rispettivamente a 2,3 e 1,58. Il software MSI True Color preinstallato permette una facile messa a punto dei colori e della temperatura del colore.

Tempi di risposta del Display
| ↔ Tempi di risposta dal Nero al Bianco | ||
|---|---|---|
| 10 ms ... aumenta ↗ e diminuisce ↘ combinato | ↗ 5.2 ms Incremento | 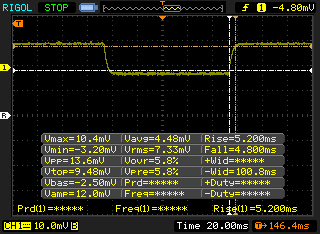 |
| ↘ 4.8 ms Calo | ||
| Lo schermo mostra buoni tempi di risposta durante i nostri tests, ma potrebbe essere troppo lento per i gamers competitivi. In confronto, tutti i dispositivi di test variano da 0.1 (minimo) a 240 (massimo) ms. » 27 % di tutti i dispositivi è migliore. Questo significa che i tempi di risposta rilevati sono migliori rispettto alla media di tutti i dispositivi testati (19.8 ms). | ||
| ↔ Tempo di risposta dal 50% Grigio all'80% Grigio | ||
| 11.2 ms ... aumenta ↗ e diminuisce ↘ combinato | ↗ 6 ms Incremento | 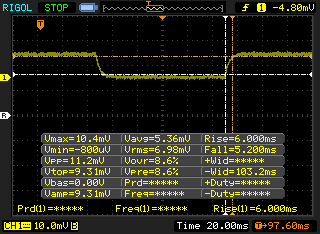 |
| ↘ 5.2 ms Calo | ||
| Lo schermo mostra buoni tempi di risposta durante i nostri tests, ma potrebbe essere troppo lento per i gamers competitivi. In confronto, tutti i dispositivi di test variano da 0.165 (minimo) a 636 (massimo) ms. » 25 % di tutti i dispositivi è migliore. Questo significa che i tempi di risposta rilevati sono migliori rispettto alla media di tutti i dispositivi testati (30.9 ms). | ||
Sfarfallio dello schermo / PWM (Pulse-Width Modulation)
| flickering dello schermo / PWM non rilevato | 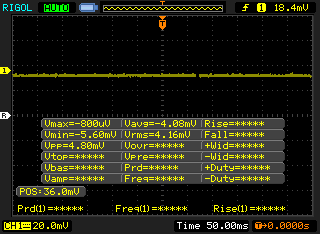 | ||
In confronto: 52 % di tutti i dispositivi testati non utilizza PWM per ridurre la luminosita' del display. Se è rilevato PWM, una media di 7741 (minimo: 5 - massimo: 343500) Hz è stata rilevata. | |||
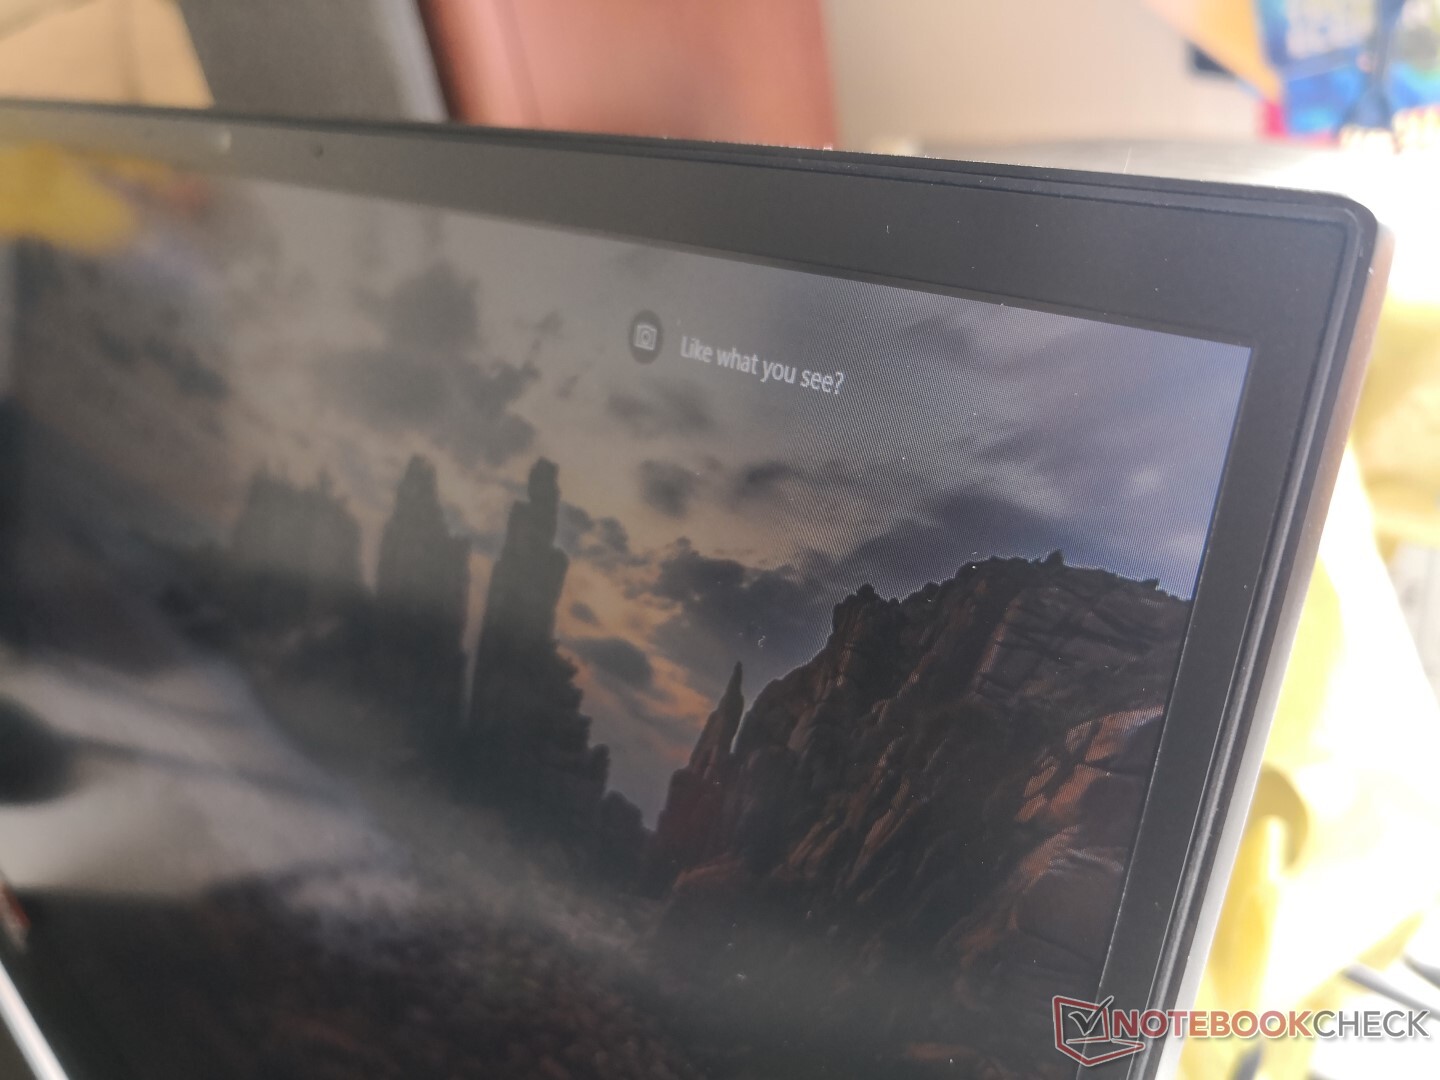
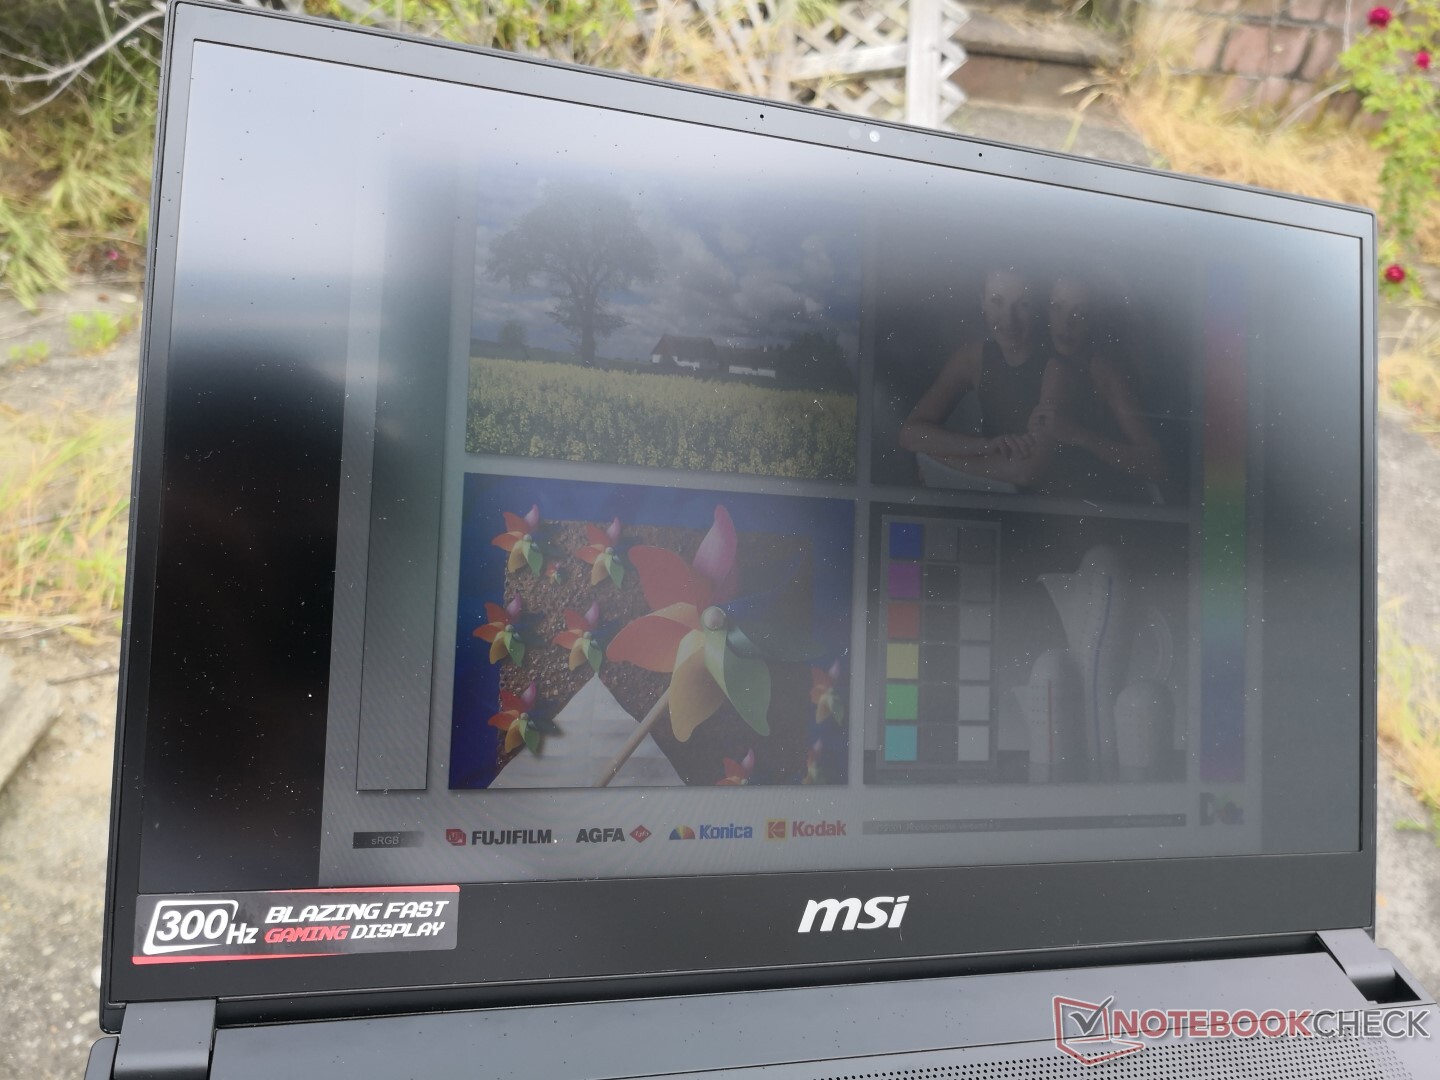
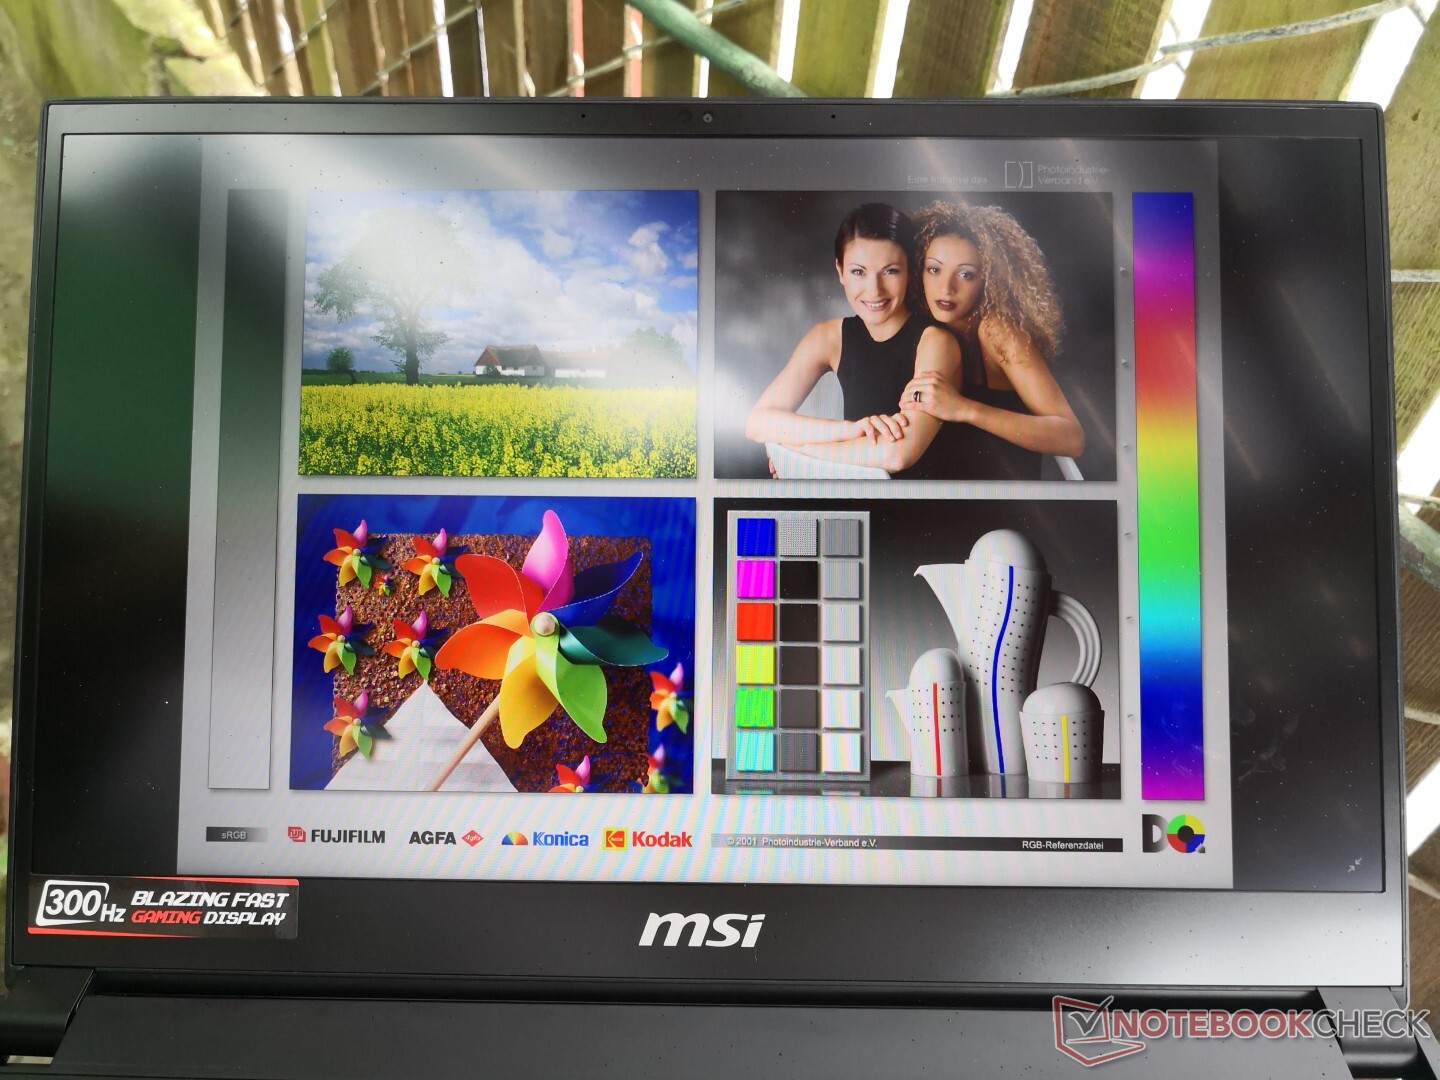
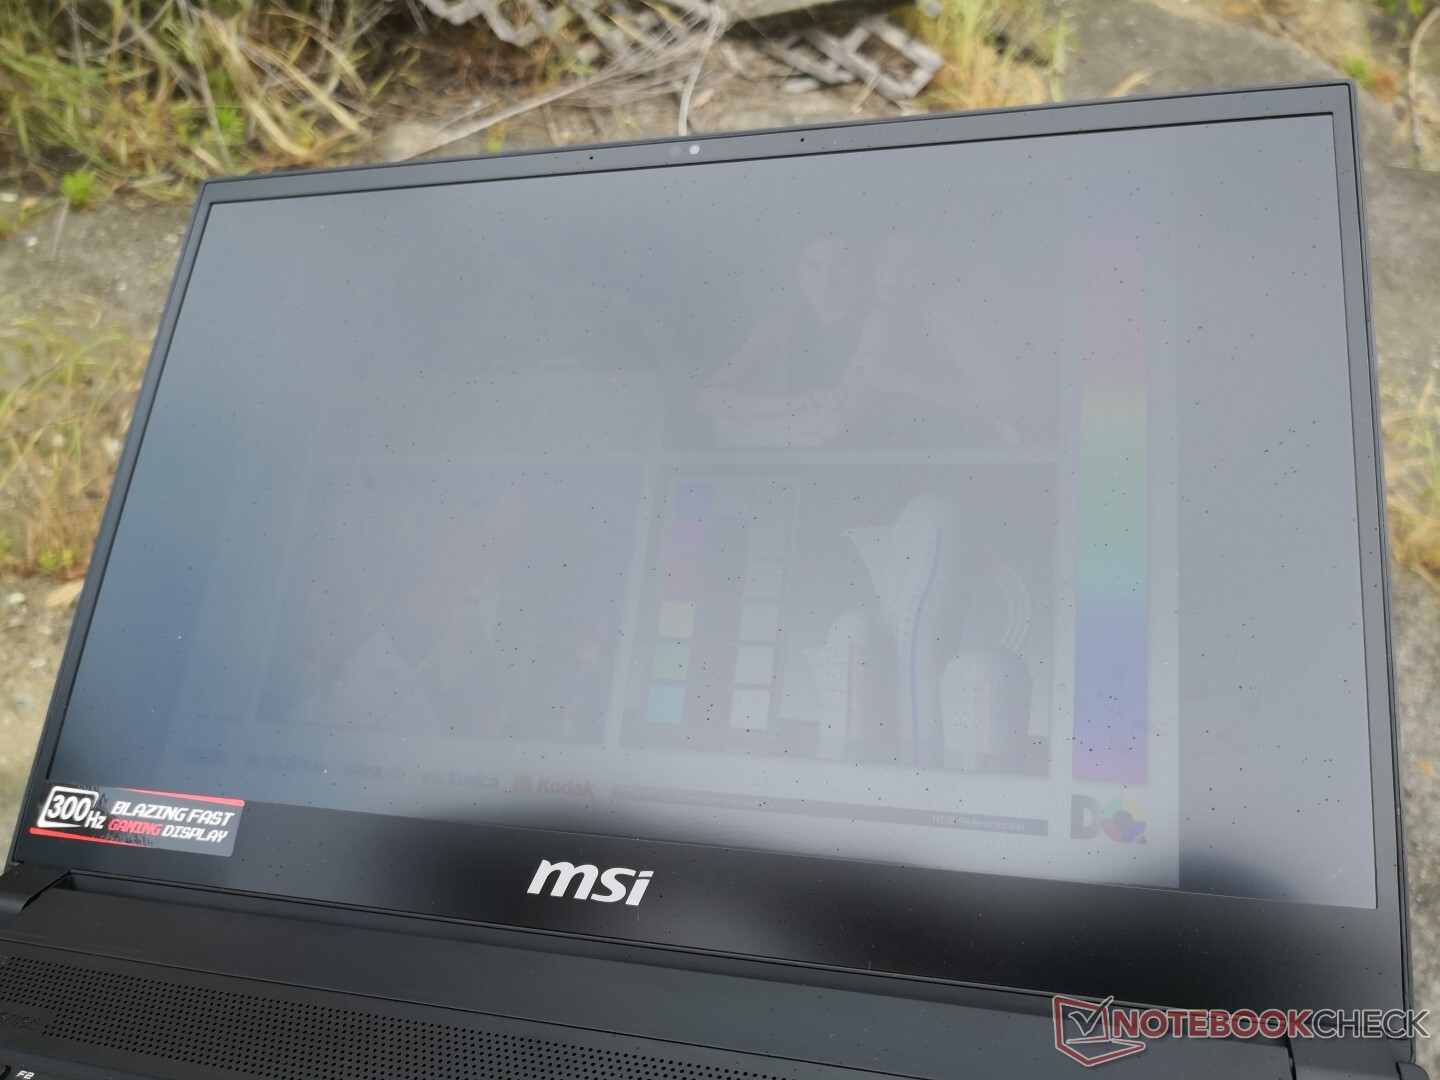
La visibilità all'aperto non è migliore o peggiore della maggior parte dei portatili da gioco in circolazione, poiché la luminosità del display di 300 nits è tipica della categoria. MSI ha ancora il leggero vantaggio in questo caso grazie alle cerniere a 180 gradi per una più facile riduzione dei riflessi.
Prestazioni
Processore
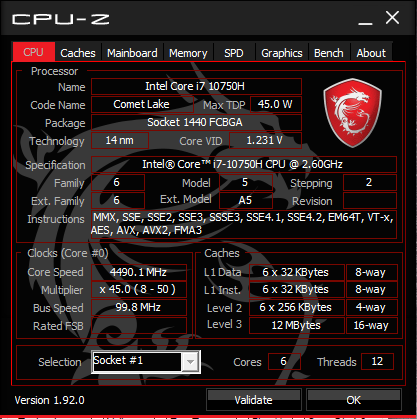
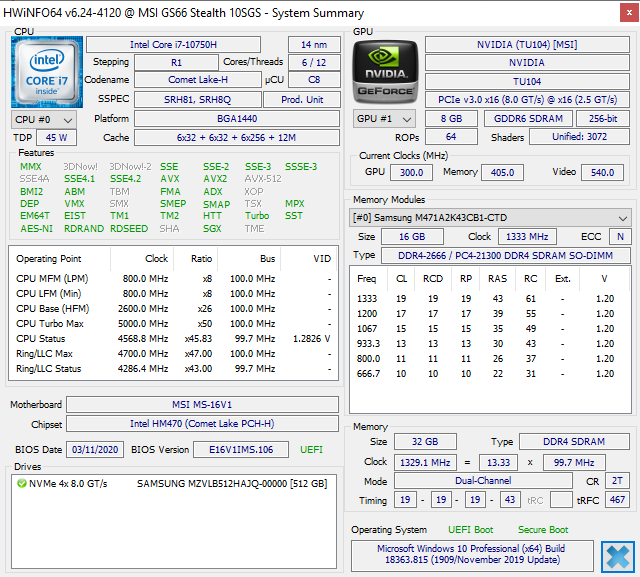
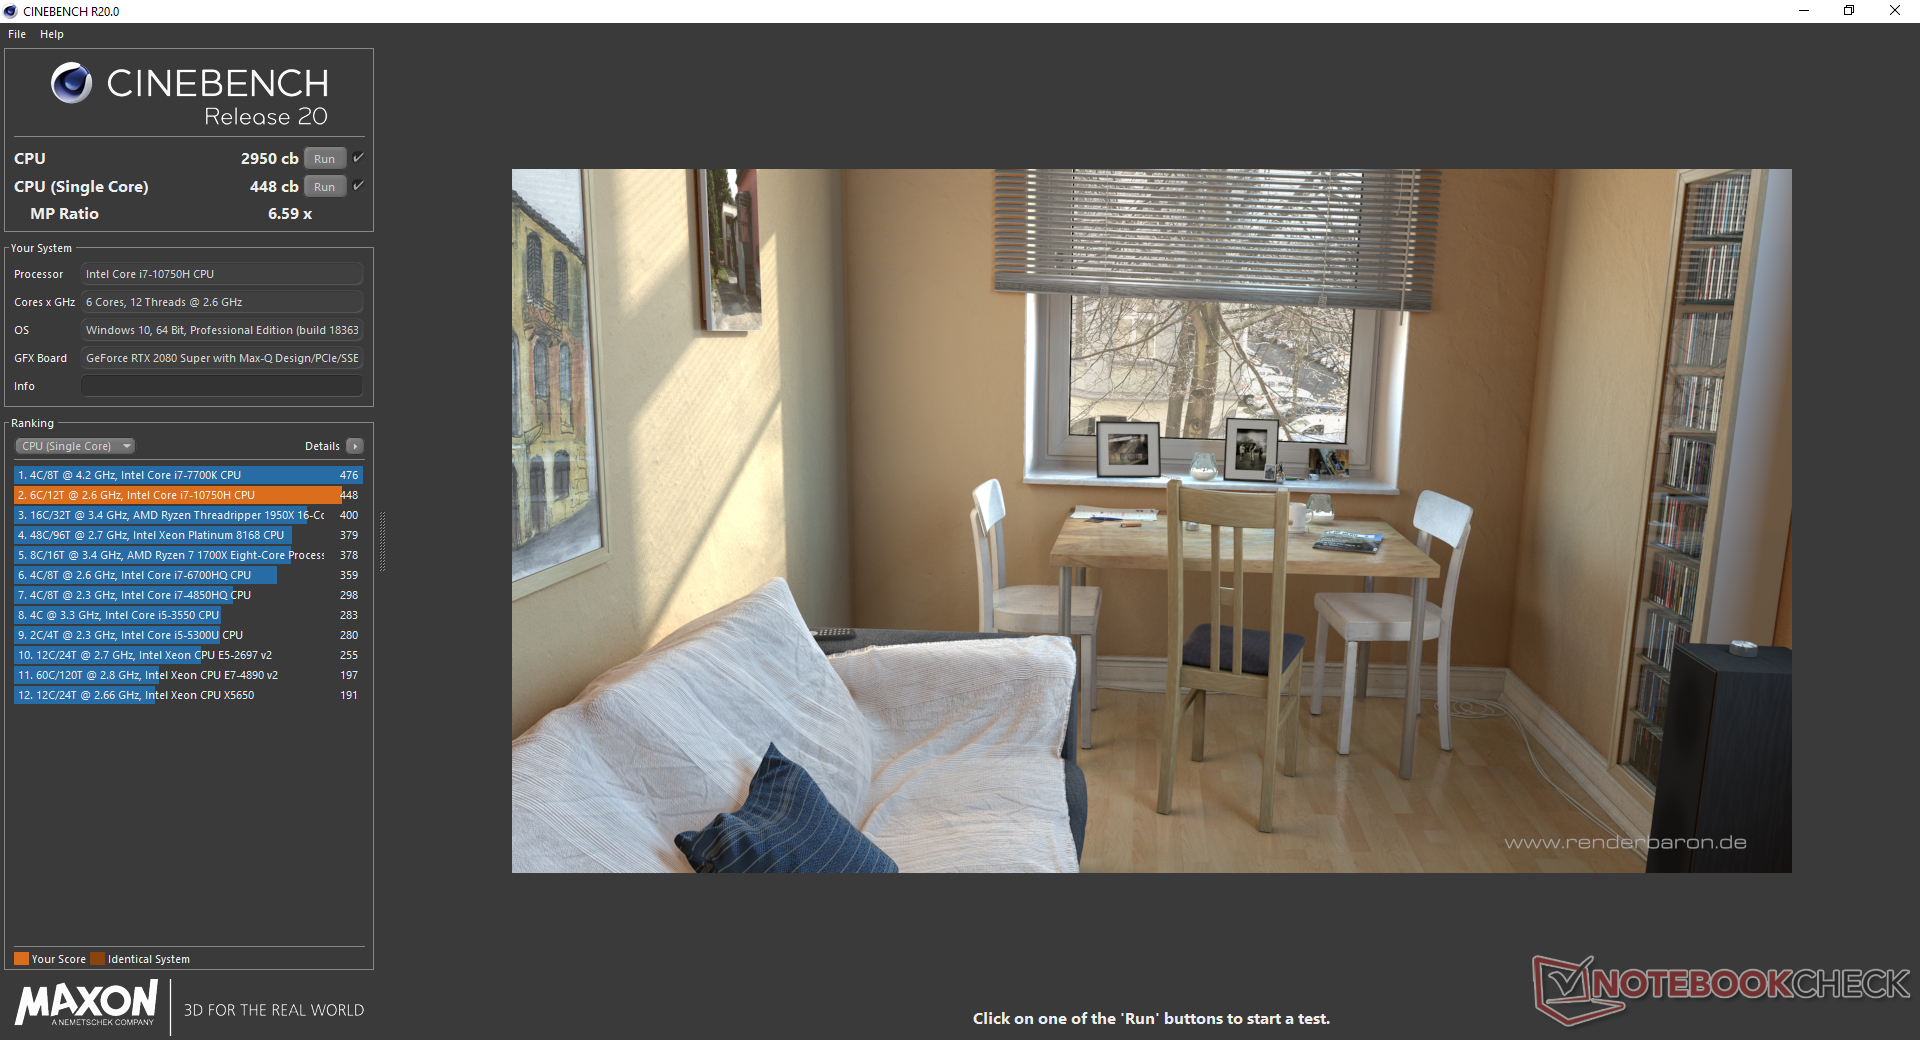
Il Core i7-10750H di 10a generazione sostituisce il Core i7-9750H di 9a generazione che si trova su quasi tutti i portatili gaming del 2019. Le prestazioni complessive sono più simili al Core i9-8950HK o circa il 15% più veloce rispetto alla media dei portatili Core i7-9750H. Gli utenti che passano dal molto più vecchio Core i7-7700HQ o Core i7-8750H vedranno i maggiori benefici. Naturalmente, le soluzioni octa-core come Core i9-9880H, Core i7-10875H, o Core i9-10980HK continueranno a superare il Core i7-10750H. MSI offre quest'ultimo per circa il 27-34% di prestazioni multi-thread più veloci.
L'esecuzione di CineBench R15 Multi-Thread in loop mostra un punteggio iniziale di 1271 punti prima di scendere dal 4 al 5% nel tempo a causa di limitazioni termiche molto simili a quelle che abbiamo osservato su MSI GP65 10SFK.
Consultate la nostra pagina dedicata al Core i7-10750H per maggiori informazioni tecniche e confronti di benchmarks.

Cinebench R15: CPU Multi 64Bit | CPU Single 64Bit
Blender: v2.79 BMW27 CPU
7-Zip 18.03: 7z b 4 -mmt1 | 7z b 4
Geekbench 5.5: Single-Core | Multi-Core
HWBOT x265 Benchmark v2.2: 4k Preset
LibreOffice : 20 Documents To PDF
R Benchmark 2.5: Overall mean
| Cinebench R20 / CPU (Multi Core) | |
| Asus Zephyrus G14 GA401IV | |
| Gigabyte Aero 15 OLED XB-8DE51B0SP | |
| MSI GS66 Stealth 10SFS | |
| MSI GE65 Raider 9SF-049US | |
| MSI GS66 10SGS | |
| Medion Erazer X15805 | |
| Media Intel Core i7-10750H (1749 - 3325, n=43) | |
| Media Intel Core i7-9750H (2017 - 3133, n=55) | |
| Schenker XMG Pro 15 | |
| MSI GE63 Raider 8SG | |
| MSI GF75 Thin 10SCXR | |
| MSI GF63 Thin 9SC | |
| Cinebench R20 / CPU (Single Core) | |
| Gigabyte Aero 15 OLED XB-8DE51B0SP | |
| Medion Erazer X15805 | |
| Asus Zephyrus G14 GA401IV | |
| MSI GS66 Stealth 10SFS | |
| MSI GE65 Raider 9SF-049US | |
| Media Intel Core i7-10750H (431 - 504, n=43) | |
| MSI GS66 10SGS | |
| Media Intel Core i7-9750H (416 - 486, n=55) | |
| MSI GF75 Thin 10SCXR | |
| Schenker XMG Pro 15 | |
| MSI GF63 Thin 9SC | |
| MSI GE63 Raider 8SG | |
| Cinebench R15 / CPU Multi 64Bit | |
| Asus Zephyrus G14 GA401IV | |
| Gigabyte Aero 15 OLED XB-8DE51B0SP | |
| MSI GS66 Stealth 10SFS | |
| MSI GE65 Raider 9SF-049US | |
| MSI GS66 10SGS | |
| Media Intel Core i7-10750H (804 - 1418, n=50) | |
| Medion Erazer X15805 | |
| Media Intel Core i7-9750H (952 - 1306, n=85) | |
| Schenker XMG Pro 15 | |
| MSI GE63 Raider 8SG | |
| MSI GF75 Thin 10SCXR | |
| MSI GF63 Thin 9SC | |
| Cinebench R15 / CPU Single 64Bit | |
| Gigabyte Aero 15 OLED XB-8DE51B0SP | |
| Medion Erazer X15805 | |
| MSI GS66 Stealth 10SFS | |
| MSI GE65 Raider 9SF-049US | |
| Media Intel Core i7-10750H (184 - 213, n=45) | |
| Asus Zephyrus G14 GA401IV | |
| MSI GS66 10SGS | |
| Media Intel Core i7-9750H (170 - 194, n=82) | |
| MSI GF75 Thin 10SCXR | |
| Schenker XMG Pro 15 | |
| MSI GF63 Thin 9SC | |
| MSI GE63 Raider 8SG | |
| Blender / v2.79 BMW27 CPU | |
| MSI GF75 Thin 10SCXR | |
| Schenker XMG Pro 15 | |
| Media Intel Core i7-9750H (342 - 495, n=21) | |
| Media Intel Core i7-10750H (322 - 587, n=43) | |
| MSI GS66 10SGS | |
| Asus Zephyrus G14 GA401IV | |
| MSI GS66 Stealth 10SFS | |
| Gigabyte Aero 15 OLED XB-8DE51B0SP | |
| 7-Zip 18.03 / 7z b 4 -mmt1 | |
| Gigabyte Aero 15 OLED XB-8DE51B0SP | |
| MSI GS66 Stealth 10SFS | |
| Media Intel Core i7-10750H (4504 - 5470, n=43) | |
| MSI GS66 10SGS | |
| Media Intel Core i7-9750H (4580 - 5090, n=21) | |
| MSI GF75 Thin 10SCXR | |
| Asus Zephyrus G14 GA401IV | |
| Schenker XMG Pro 15 | |
| 7-Zip 18.03 / 7z b 4 | |
| Asus Zephyrus G14 GA401IV | |
| Gigabyte Aero 15 OLED XB-8DE51B0SP | |
| MSI GS66 Stealth 10SFS | |
| MSI GS66 10SGS | |
| Media Intel Core i7-10750H (26040 - 37345, n=43) | |
| Schenker XMG Pro 15 | |
| Media Intel Core i7-9750H (28512 - 35174, n=21) | |
| MSI GF75 Thin 10SCXR | |
| Geekbench 5.5 / Single-Core | |
| Gigabyte Aero 15 OLED XB-8DE51B0SP | |
| MSI GS66 Stealth 10SFS | |
| Media Intel Core i7-10750H (1114 - 1333, n=43) | |
| Asus Zephyrus G14 GA401IV | |
| MSI GS66 10SGS | |
| Media Intel Core i7-9750H (1117 - 1251, n=13) | |
| MSI GF75 Thin 10SCXR | |
| Schenker XMG Pro 15 | |
| Geekbench 5.5 / Multi-Core | |
| Gigabyte Aero 15 OLED XB-8DE51B0SP | |
| Asus Zephyrus G14 GA401IV | |
| MSI GS66 Stealth 10SFS | |
| MSI GS66 10SGS | |
| Media Intel Core i7-10750H (4443 - 6674, n=43) | |
| Schenker XMG Pro 15 | |
| Media Intel Core i7-9750H (4859 - 6262, n=13) | |
| MSI GF75 Thin 10SCXR | |
| HWBOT x265 Benchmark v2.2 / 4k Preset | |
| Gigabyte Aero 15 OLED XB-8DE51B0SP | |
| MSI GS66 Stealth 10SFS | |
| Asus Zephyrus G14 GA401IV | |
| MSI GS66 10SGS | |
| Media Intel Core i7-10750H (5.54 - 11.6, n=43) | |
| Schenker XMG Pro 15 | |
| Media Intel Core i7-9750H (7.1 - 10.7, n=21) | |
| MSI GF75 Thin 10SCXR | |
| LibreOffice / 20 Documents To PDF | |
| Media Intel Core i7-9750H (54.5 - 64.7, n=9) | |
| MSI GF75 Thin 10SCXR | |
| MSI GS66 10SGS | |
| Media Intel Core i7-10750H (43.1 - 99.2, n=43) | |
| MSI GS66 Stealth 10SFS | |
| Gigabyte Aero 15 OLED XB-8DE51B0SP | |
| R Benchmark 2.5 / Overall mean | |
| MSI GF75 Thin 10SCXR | |
| Schenker XMG Pro 15 | |
| Media Intel Core i7-9750H (0.608 - 0.695, n=14) | |
| MSI GS66 10SGS | |
| Media Intel Core i7-10750H (0.578 - 0.708, n=42) | |
| MSI GS66 Stealth 10SFS | |
| Gigabyte Aero 15 OLED XB-8DE51B0SP | |
* ... Meglio usare valori piccoli
Prestazioni di sistema
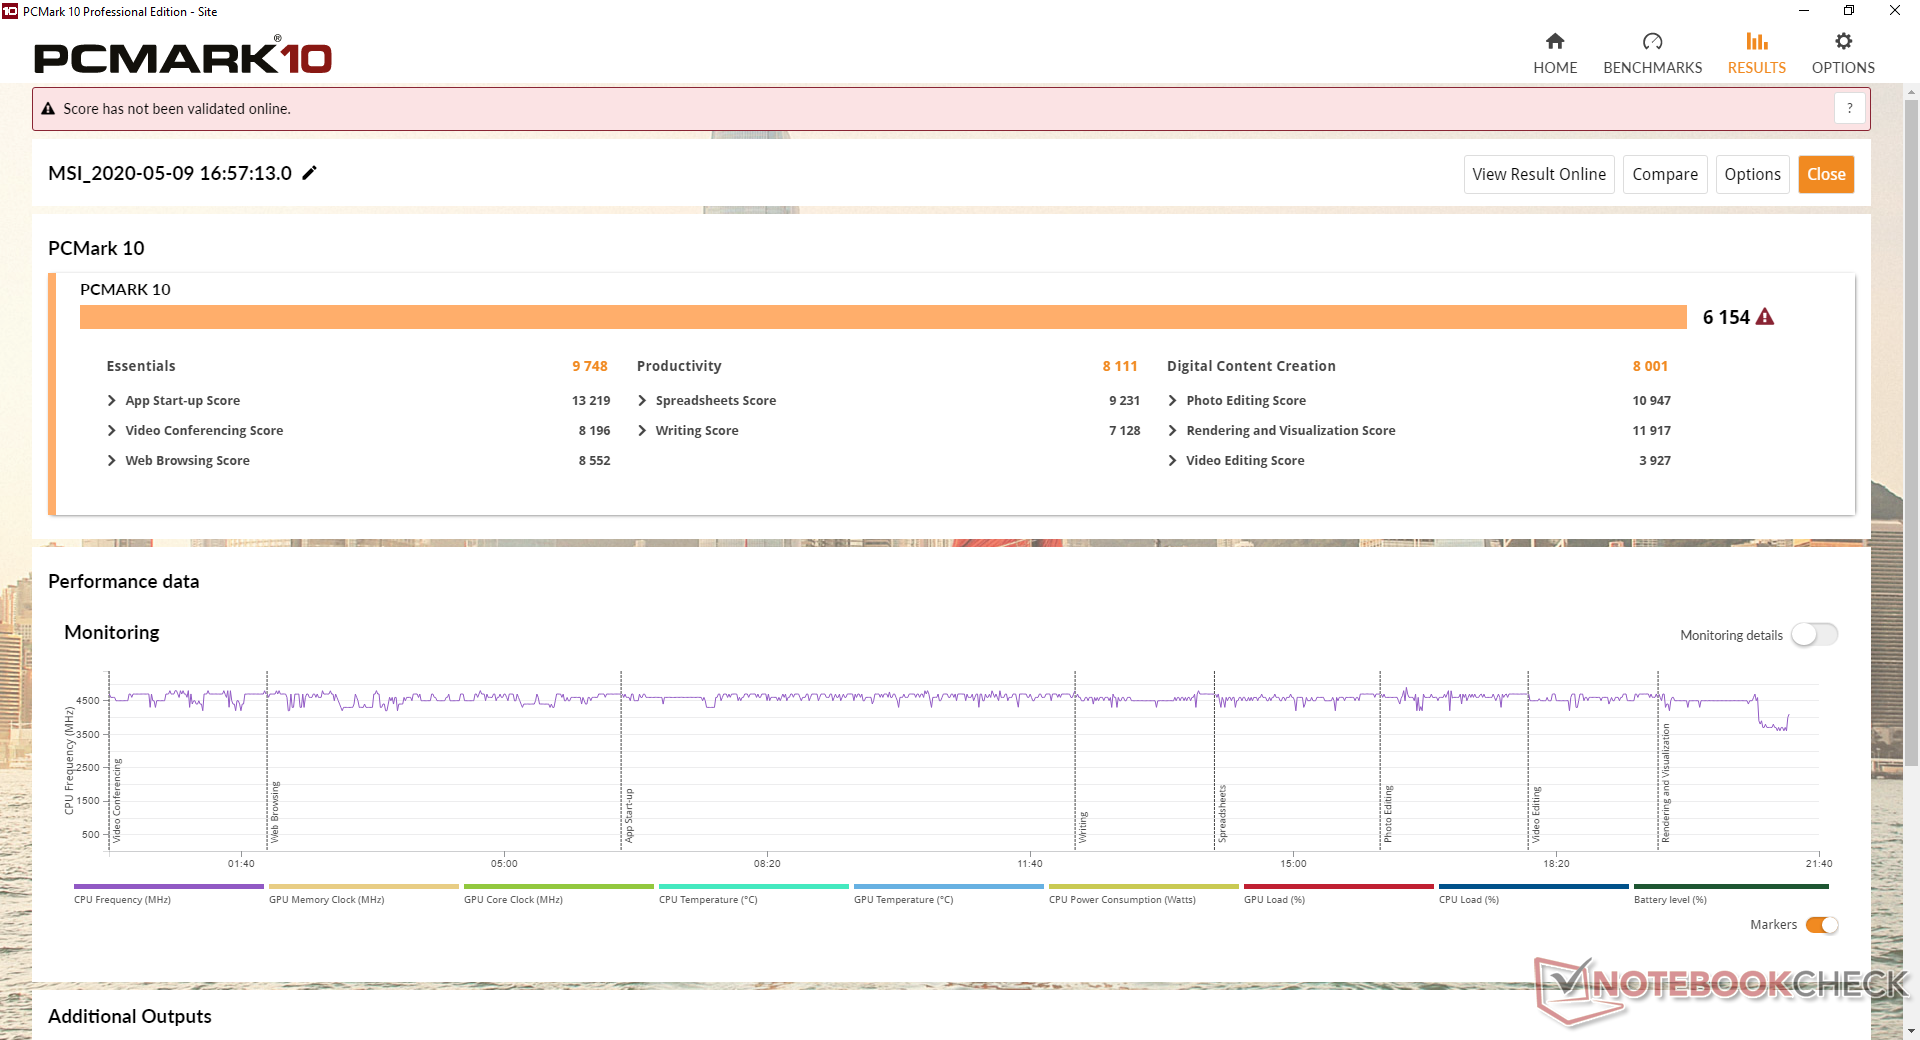
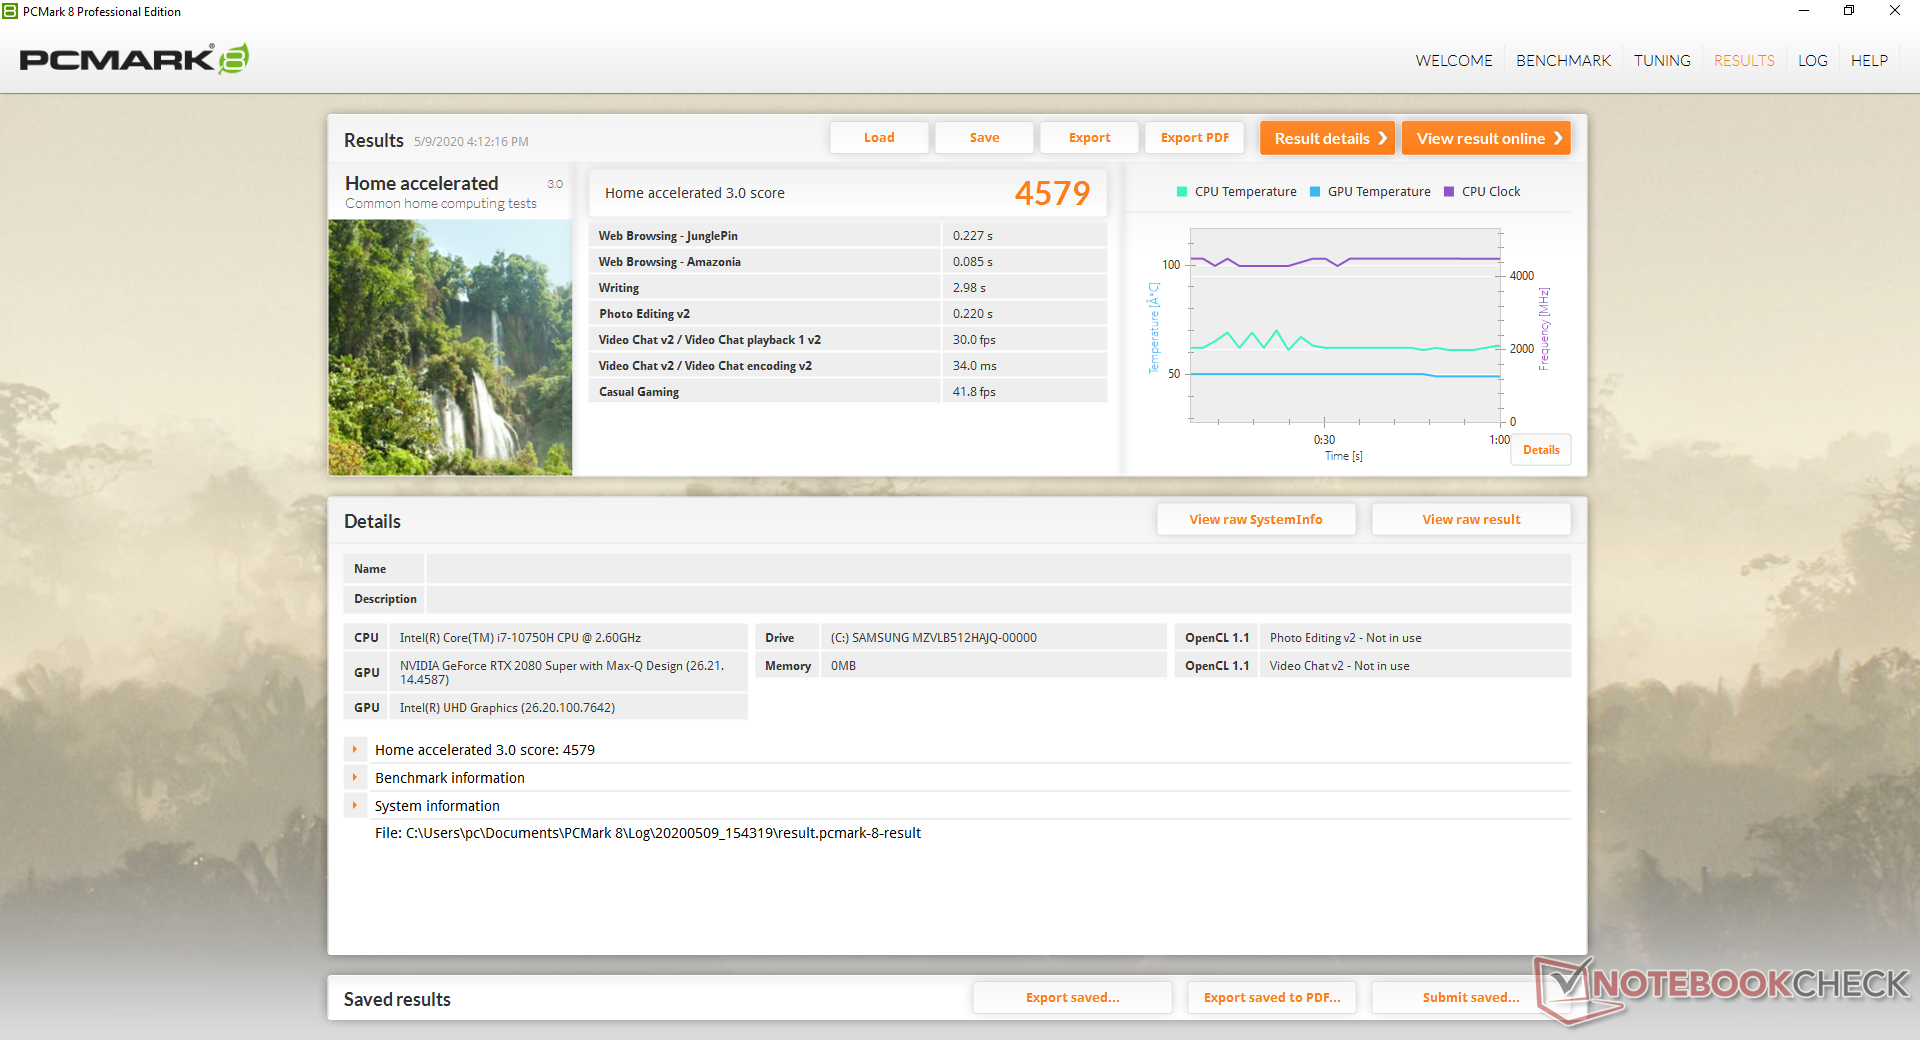
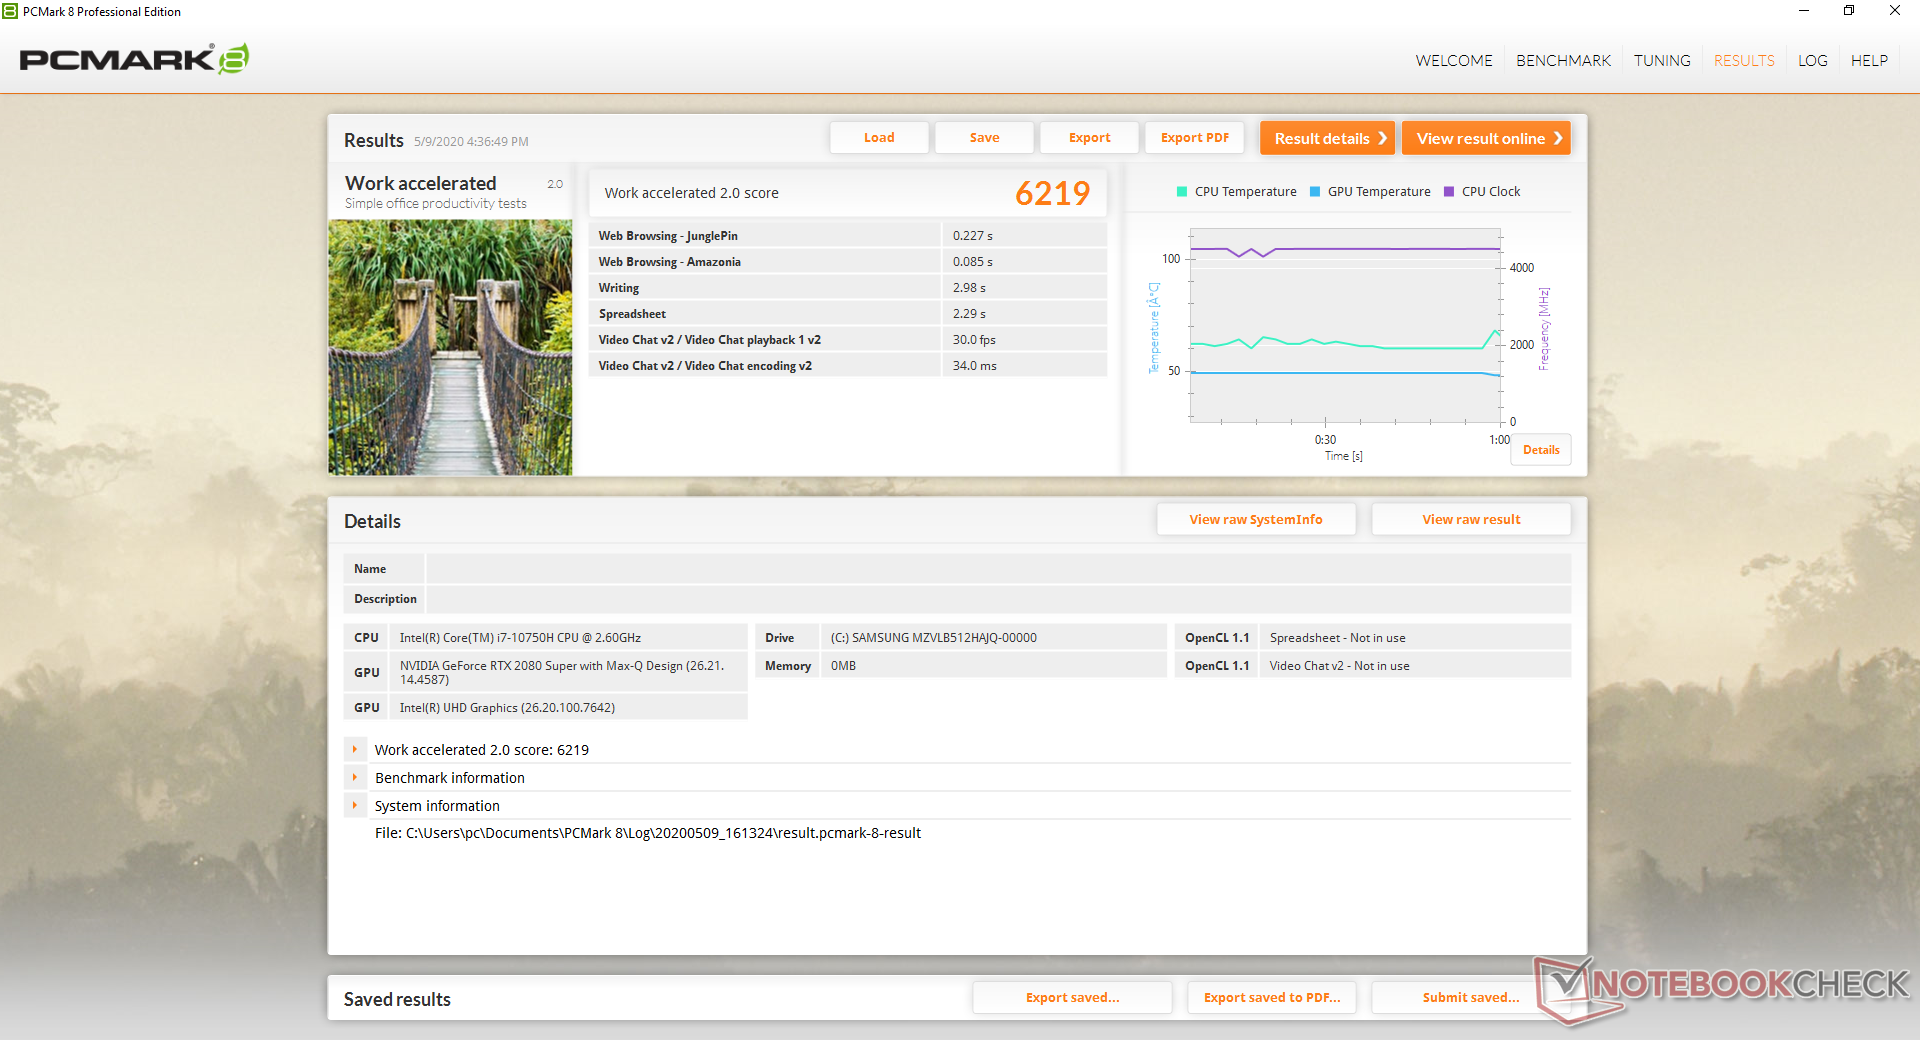
I benchmarks PCMark sono costantemente al di sotto del GS66 10SFS con il Core i9-10980HK di fascia più alta, ma con la GPU GeForce RTX 2070 Super Max-Q più lenta. Quindi, il più veloce RTX 2080 Super Max-Q del nostro GS66 10SGS non è sufficiente a compensare il deficit di CPU almeno per questo tipo di scenari.
| PCMark 8 | |
| Home Score Accelerated v2 | |
| Lenovo Legion Y740-15ICHg | |
| MSI GS66 10SGS | |
| MSI GS65 Stealth 9SG | |
| Razer Blade 15 RTX 2080 Max-Q | |
| Work Score Accelerated v2 | |
| MSI GS66 10SGS | |
| Lenovo Legion Y740-15ICHg | |
| MSI GS65 Stealth 9SG | |
| Razer Blade 15 RTX 2080 Max-Q | |
| PCMark 8 Home Score Accelerated v2 | 4579 punti | |
| PCMark 8 Work Score Accelerated v2 | 6219 punti | |
| PCMark 10 Score | 6154 punti | |
Aiuto | ||
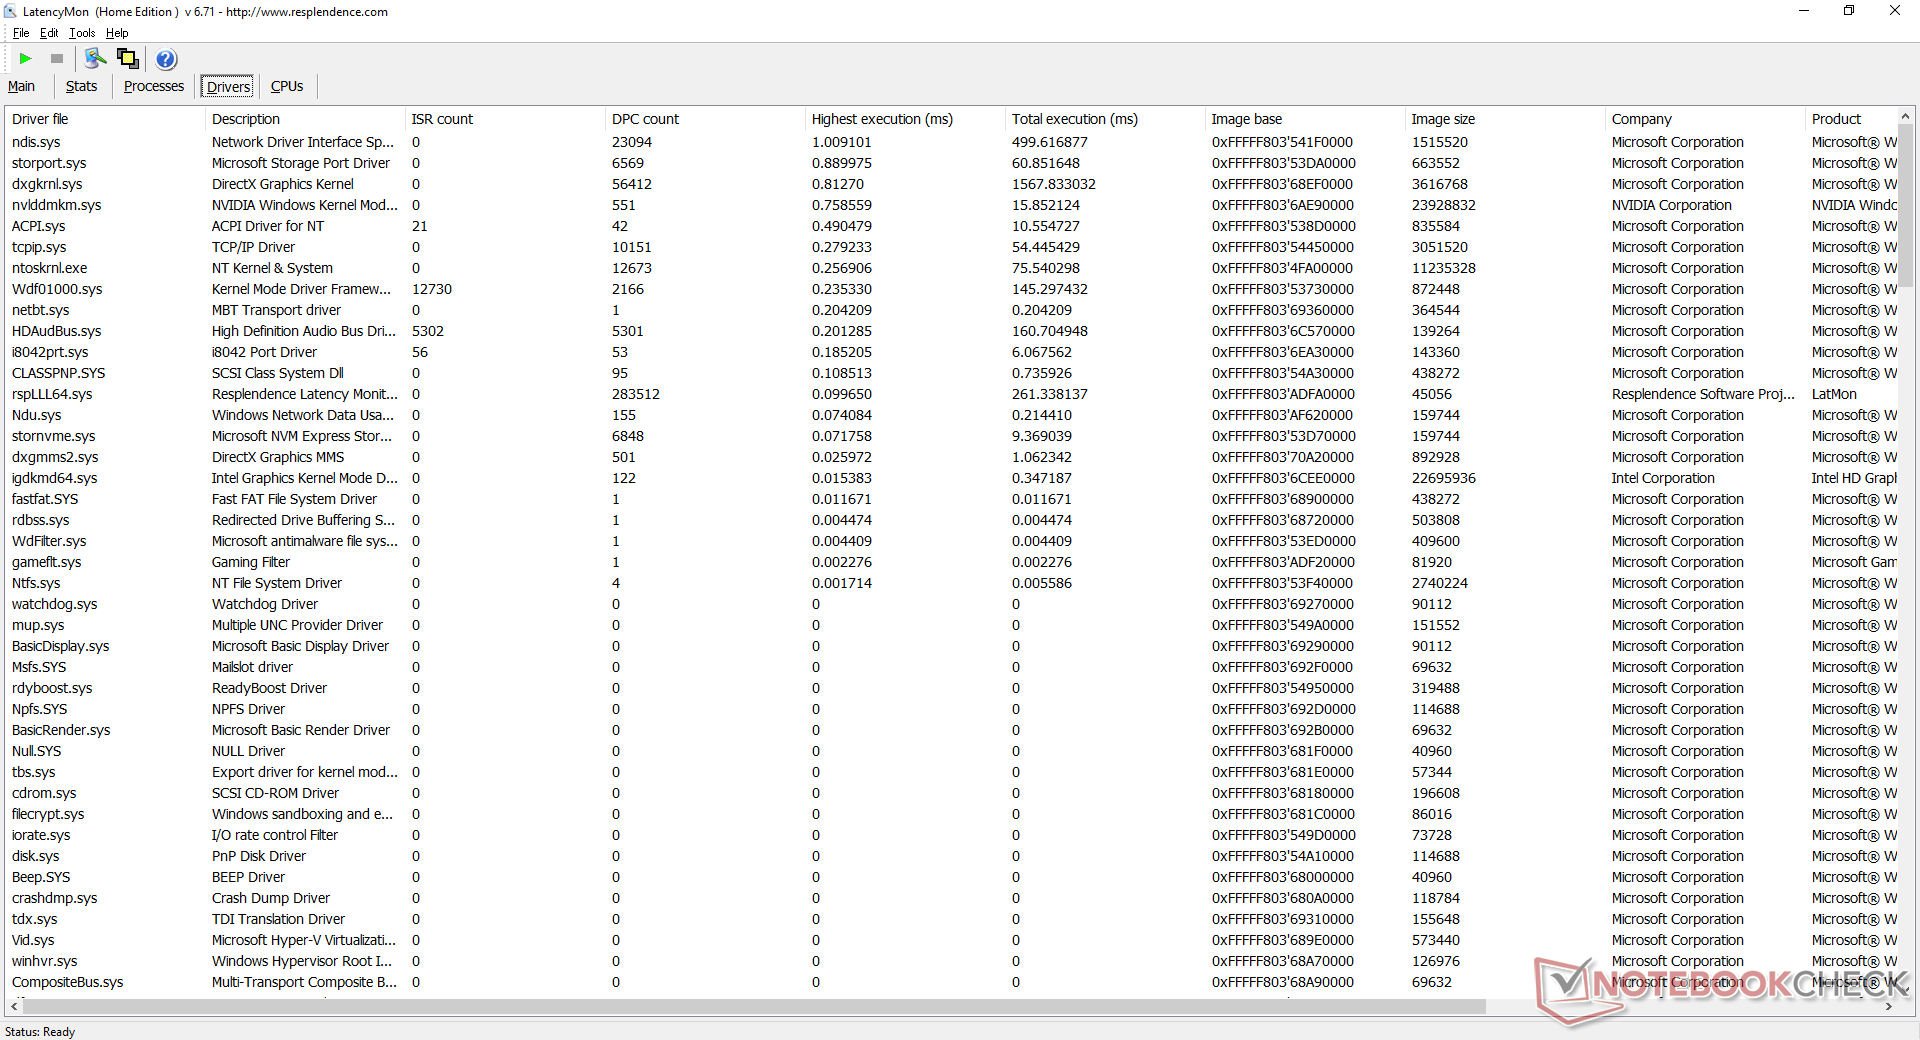
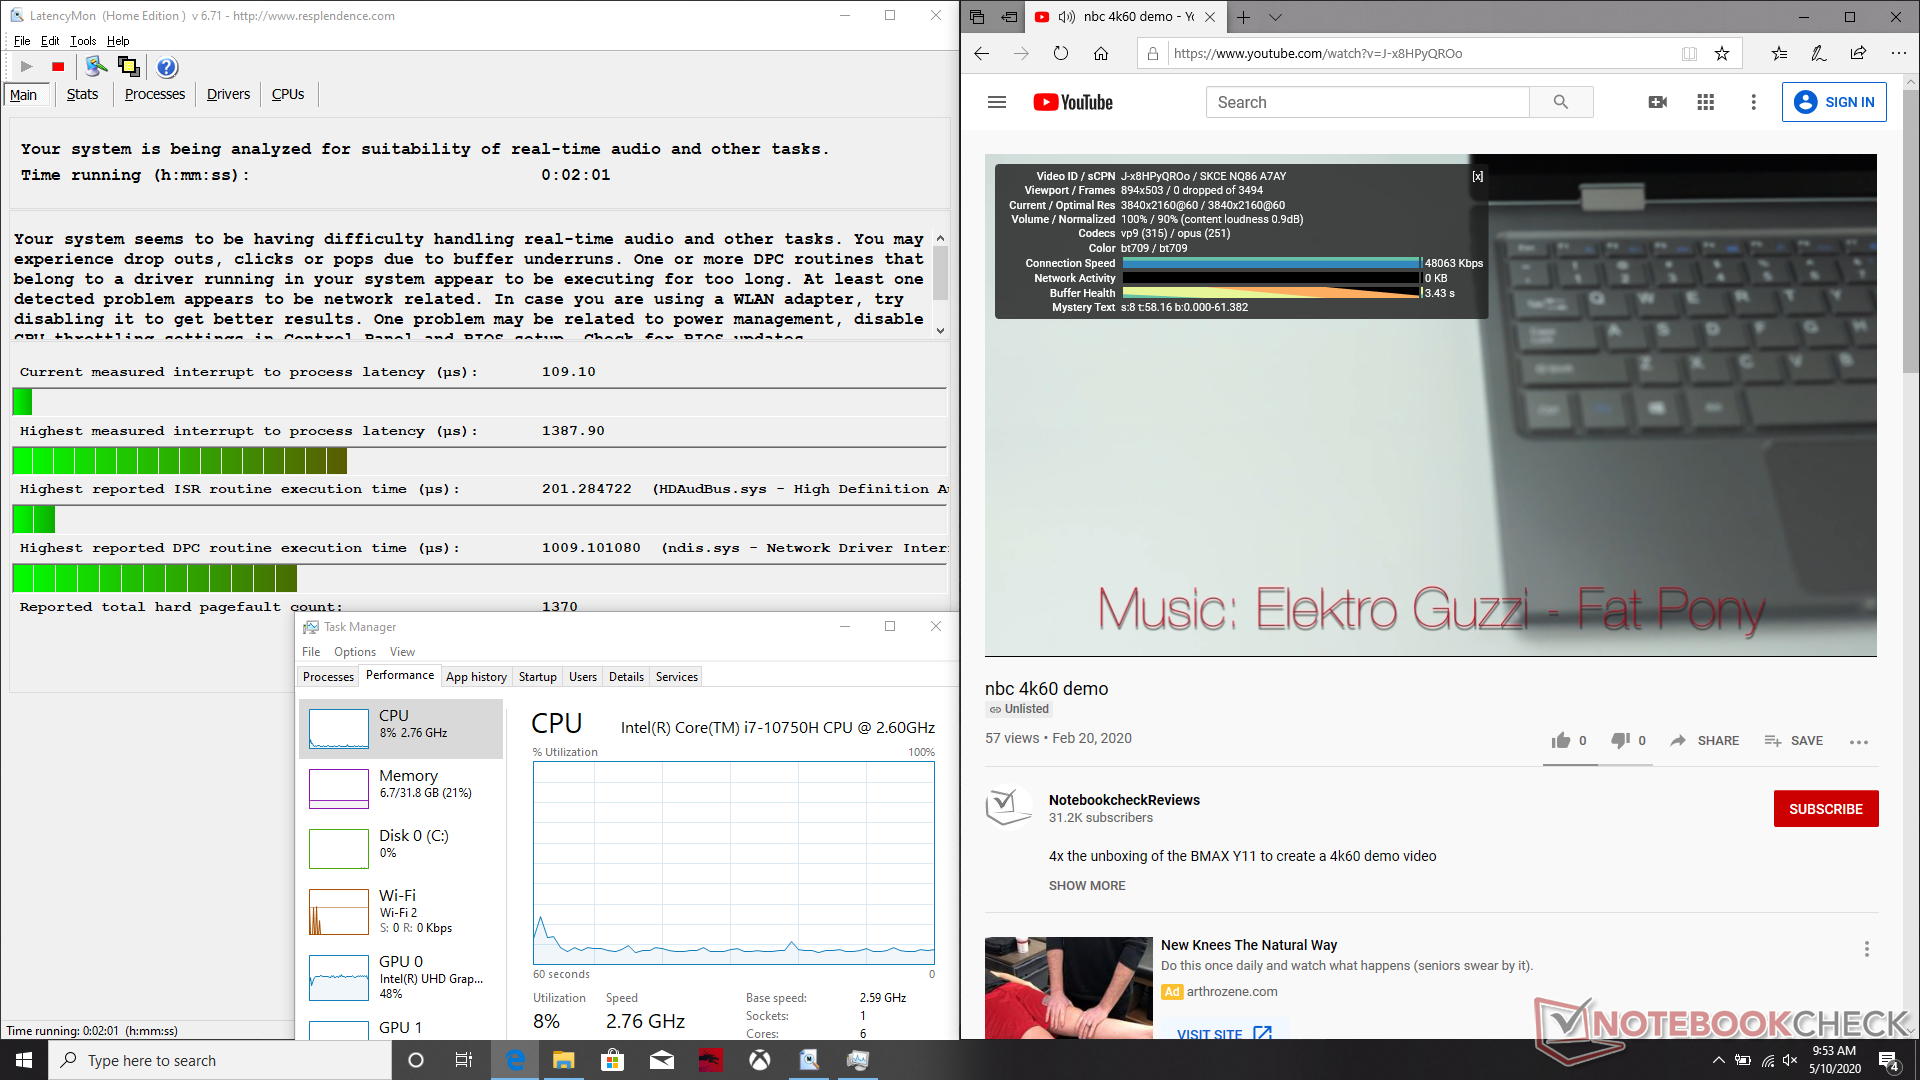
DPC Latency
LatencyMon mostra i problemi di latenza del DPC quando si aprono più schede del browser. La riproduzione video 4K è per il resto fluida e senza cadute di fotogrammi.
| DPC Latencies / LatencyMon - interrupt to process latency (max), Web, Youtube, Prime95 | |
| MSI GS66 10SGS | |
* ... Meglio usare valori piccoli
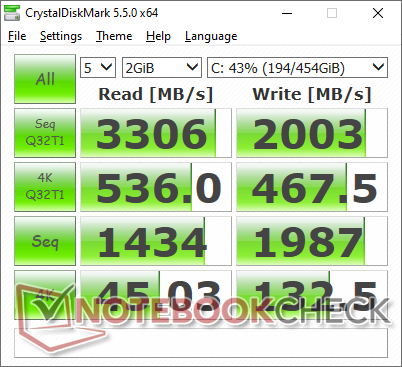
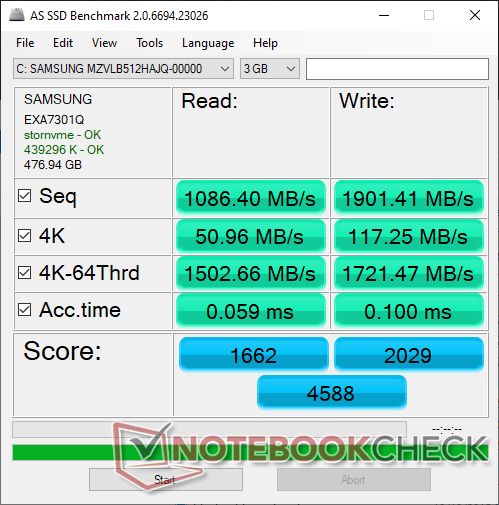
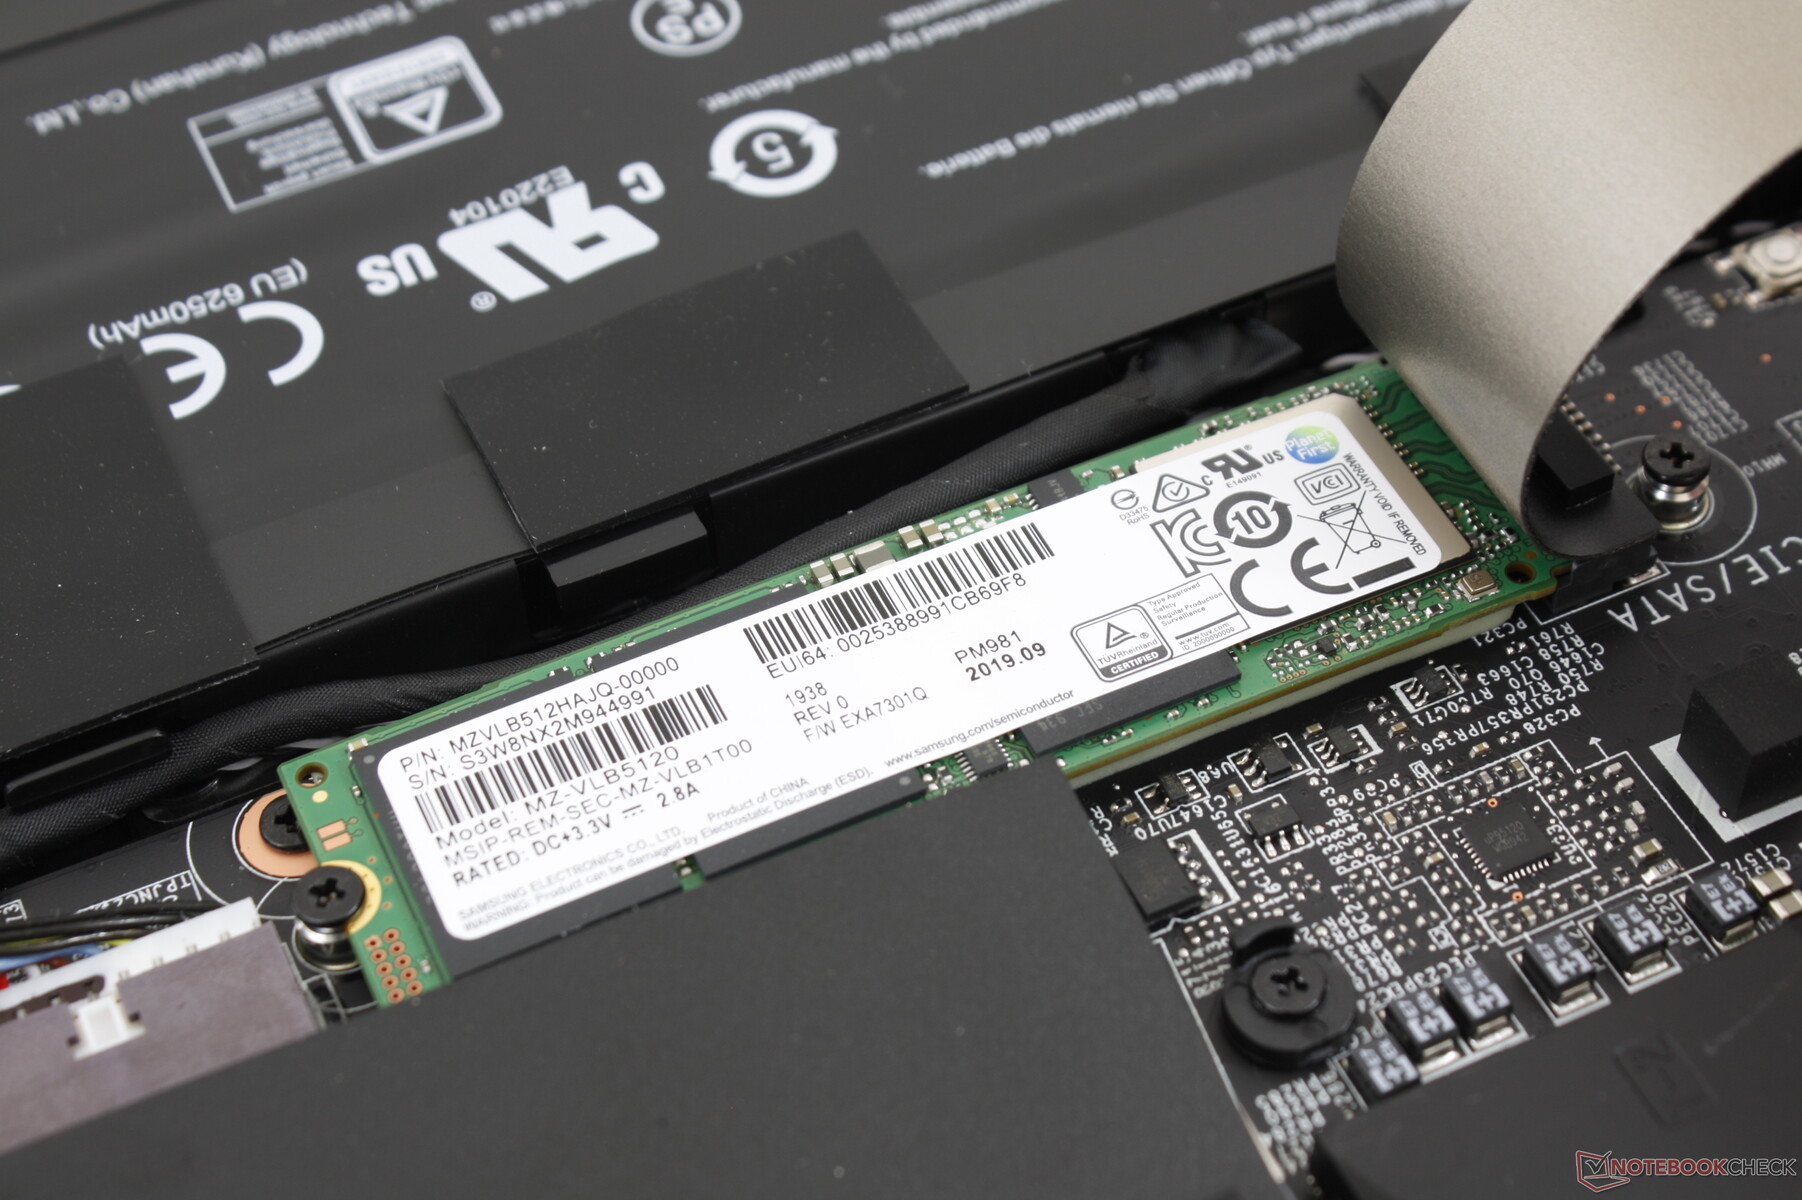
Dispositivi di archiviazione
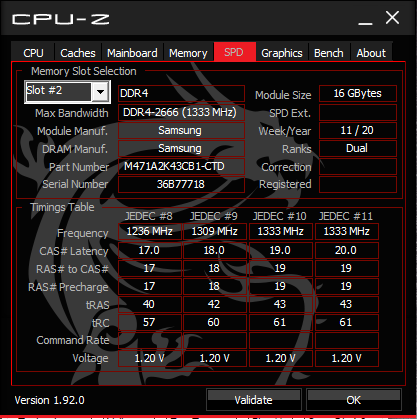
Il nostro GS66 utilizza ancora lo stesso SSD NVMe Samsung PM981 MZVLB512HAJQ che si trovava sul GS65 dell'anno scorso. Un importante cambiamento da gen a gen, tuttavia, è che i due alloggiamenti M.2 sono ora più facilmente accessibili mentre erano nascosti sotto la scheda madre sul design del GS65.
Consultate la nostra tabella di HDD ed SSD per ulteriori confronti di benchmarks. Possono essere possibili unità diverse a seconda del rivenditore.
| MSI GS66 10SGS Samsung SSD PM981 MZVLB512HAJQ | MSI GS65 Stealth 9SG Samsung SSD PM981 MZVLB512HAJQ | Asus Zephyrus S GX502GW 2x Intel SSD 660p SSDPEKNW512G8 (RAID 0) | Razer Blade 15 RTX 2080 Max-Q Samsung SSD PM981 MZVLB512HAJQ | Lenovo Legion Y740-15ICHg WDC PC SN520 SDAPMUW-128G | MSI GS66 Stealth 10SFS Samsung SSD PM981 MZVLB1T0HALR | |
|---|---|---|---|---|---|---|
| AS SSD | 9% | -6% | 3% | -49% | 9% | |
| Seq Read (MB/s) | 1086 | 2005 85% | 2506 131% | 1832 69% | 1372 26% | 1065 -2% |
| Seq Write (MB/s) | 1901 | 1580 -17% | 1712 -10% | 1864 -2% | 746 -61% | 2360 24% |
| 4K Read (MB/s) | 51 | 49.33 -3% | 48.32 -5% | 52.1 2% | 35.42 -31% | 48.09 -6% |
| 4K Write (MB/s) | 117.3 | 103.8 -12% | 103.6 -12% | 108.3 -8% | 99.9 -15% | 110.7 -6% |
| 4K-64 Read (MB/s) | 1503 | 1241 -17% | 624 -58% | 1159 -23% | 302.1 -80% | 1635 9% |
| 4K-64 Write (MB/s) | 1721 | 1730 1% | 1253 -27% | 1807 5% | 191.4 -89% | 1829 6% |
| Access Time Read * (ms) | 0.059 | 0.054 8% | 0.08 -36% | 0.05 15% | 0.132 -124% | 0.071 -20% |
| Access Time Write * (ms) | 0.1 | 0.036 64% | 0.04 60% | 0.034 66% | 0.037 63% | 0.034 66% |
| Score Read (Points) | 1662 | 1490 -10% | 923 -44% | 1394 -16% | 475 -71% | 1790 8% |
| Score Write (Points) | 2029 | 1991 -2% | 1528 -25% | 2102 4% | 366 -82% | 2176 7% |
| Score Total (Points) | 4588 | 4230 -8% | 2896 -37% | 4221 -8% | 1065 -77% | 4950 8% |
| Copy ISO MB/s (MB/s) | 2155 | 3025 40% | 2083 -3% | 1062 -51% | ||
| Copy Program MB/s (MB/s) | 715 | 713 0% | 496.5 -31% | 426 -40% | ||
| Copy Game MB/s (MB/s) | 1506 | 1554 3% | 977 -35% | 650 -57% | ||
| CrystalDiskMark 5.2 / 6 | -7% | -4% | -3% | -41% | 6% | |
| Write 4K (MB/s) | 132.5 | 91.3 -31% | 97 -27% | 137.2 4% | 134.2 1% | 131.3 -1% |
| Read 4K (MB/s) | 45.03 | 40.73 -10% | 49.58 10% | 46.82 4% | 37.72 -16% | 45.84 2% |
| Write Seq (MB/s) | 1987 | 1915 -4% | 1838 -7% | 1221 -39% | 389.2 -80% | 2370 19% |
| Read Seq (MB/s) | 1434 | 2051 43% | 2421 69% | 1217 -15% | 1030 -28% | 1509 5% |
| Write 4K Q32T1 (MB/s) | 467.5 | 308.3 -34% | 326.9 -30% | 527 13% | 238.9 -49% | 481.5 3% |
| Read 4K Q32T1 (MB/s) | 536 | 417.4 -22% | 372.9 -30% | 614 15% | 343.9 -36% | 560 4% |
| Write Seq Q32T1 (MB/s) | 2003 | 1922 -4% | 1894 -5% | 1986 -1% | 789 -61% | 2392 19% |
| Read Seq Q32T1 (MB/s) | 3306 | 3395 3% | 2828 -14% | 3234 -2% | 1502 -55% | 3232 -2% |
| Write 4K Q8T8 (MB/s) | 293.4 | |||||
| Read 4K Q8T8 (MB/s) | 405.8 | |||||
| Media totale (Programma / Settaggio) | 1% /
3% | -5% /
-5% | 0% /
1% | -45% /
-46% | 8% /
8% |
* ... Meglio usare valori piccoli

Throttling del disco: DiskSpd Read Loop, Queue Depth 8
Prestazioni GPU
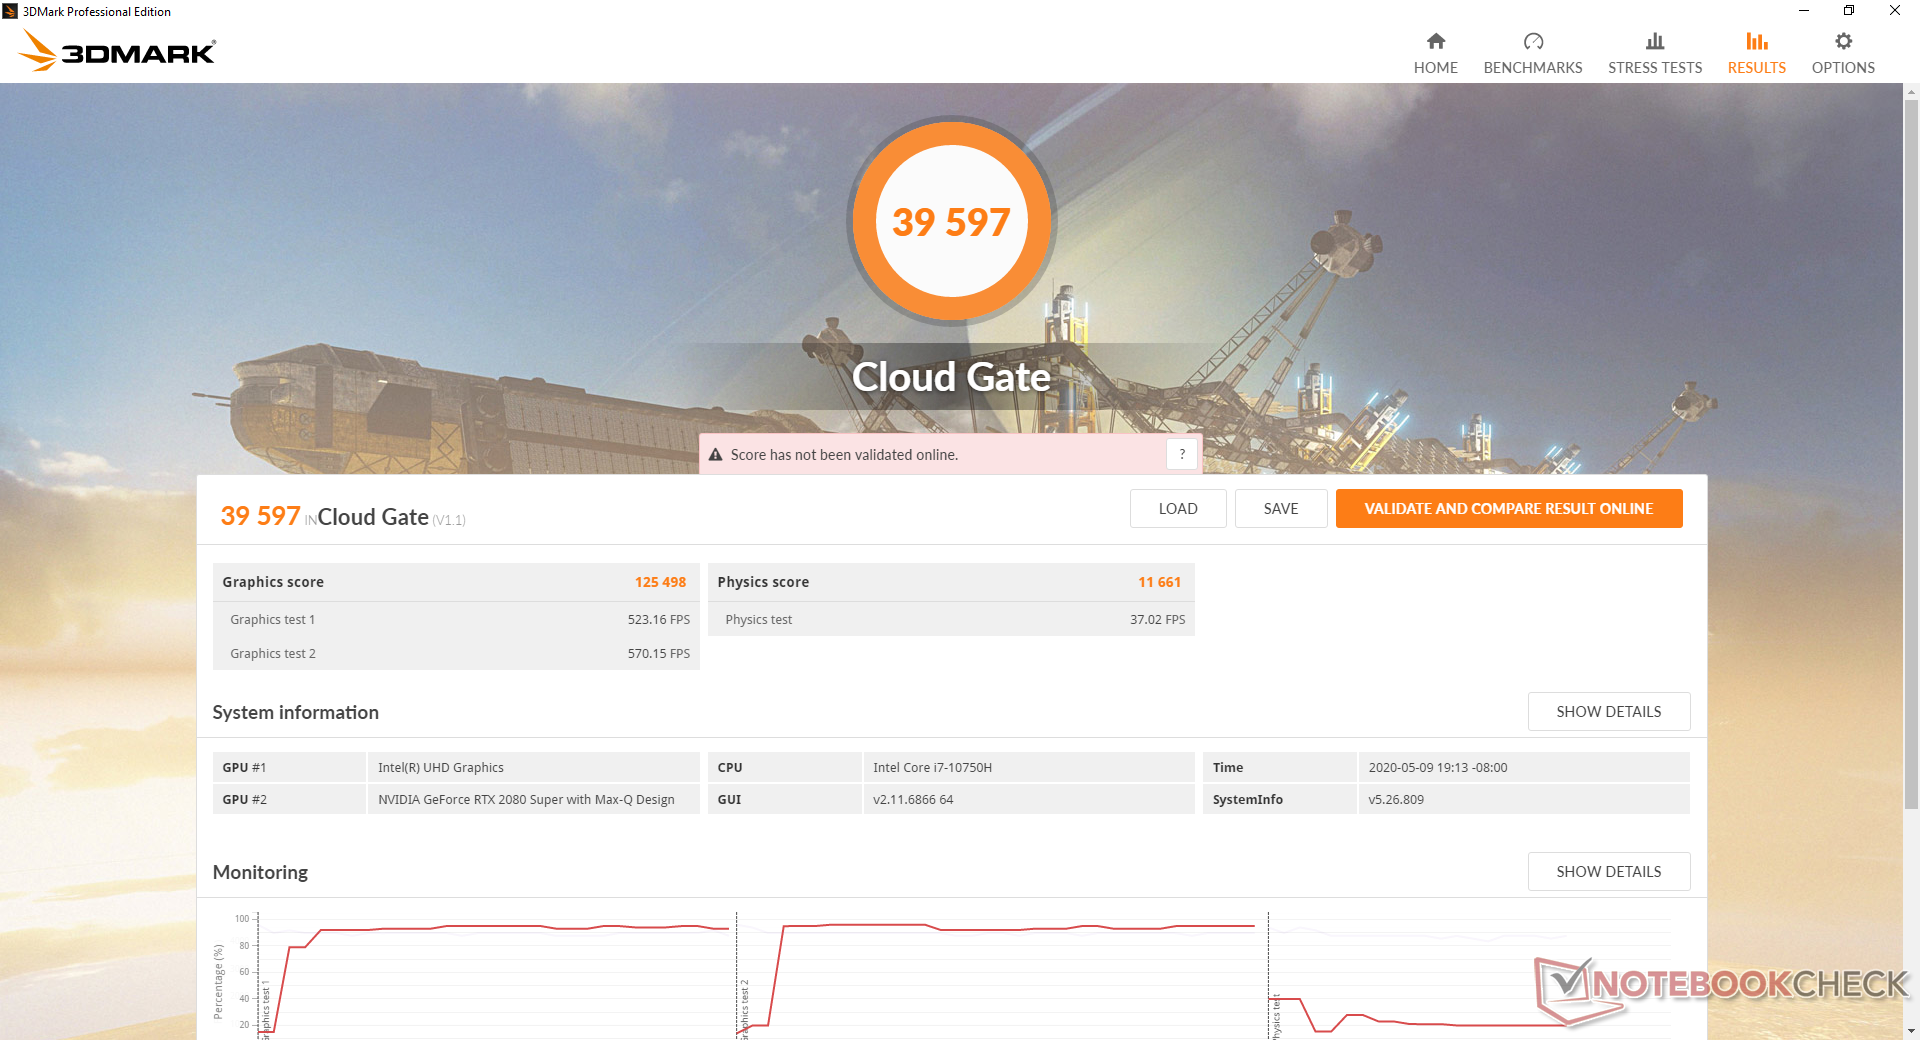
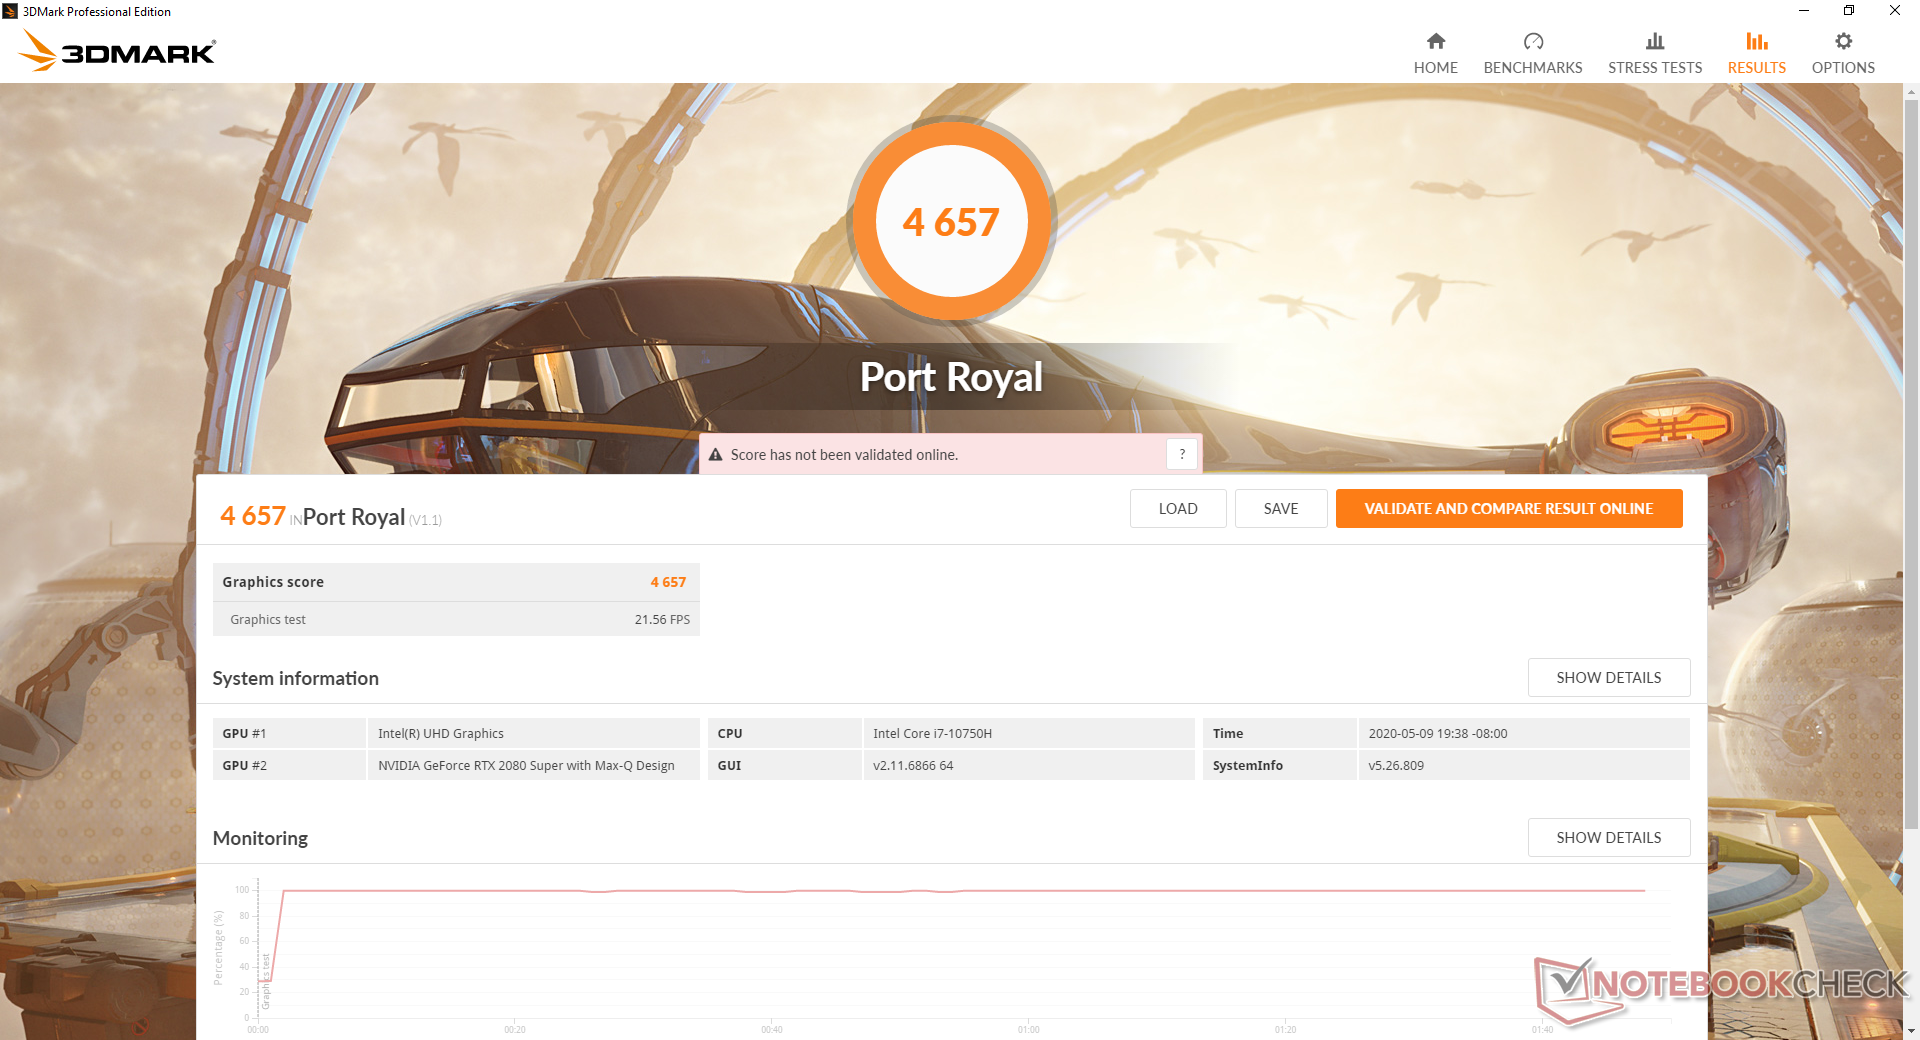
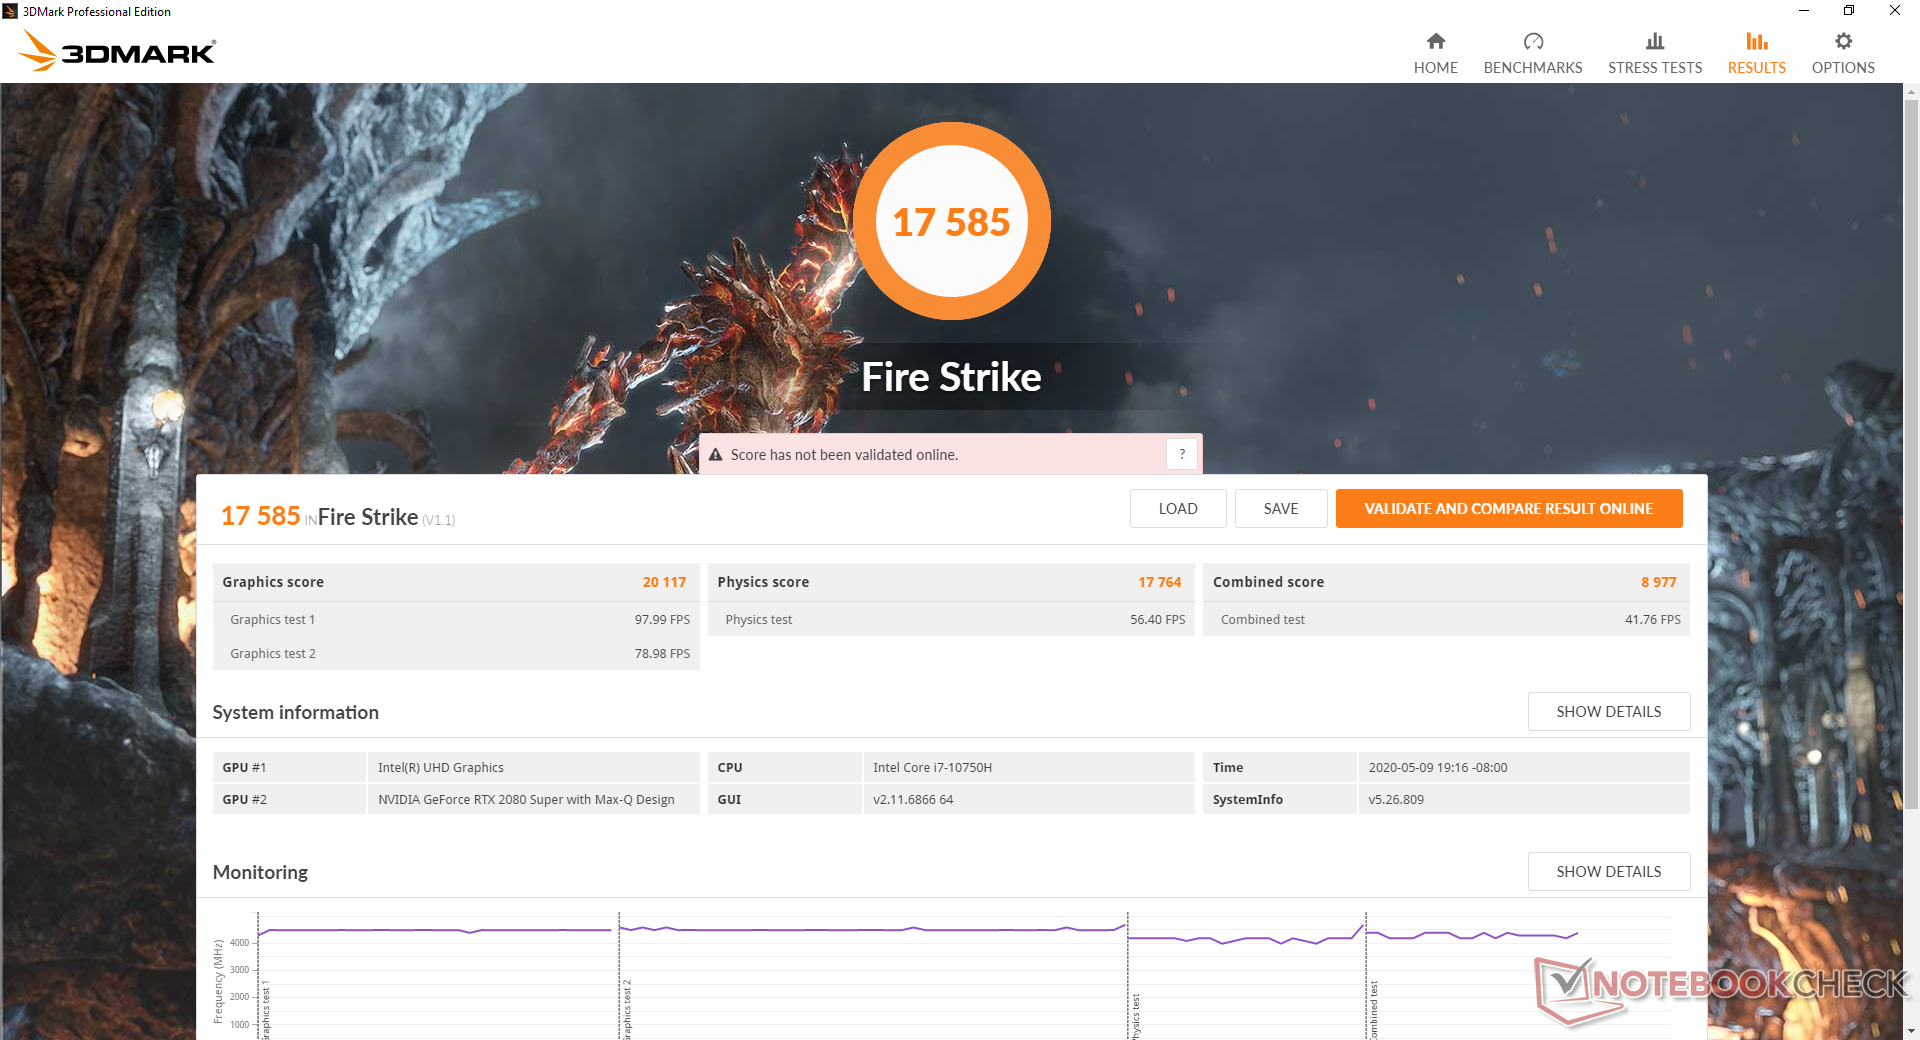
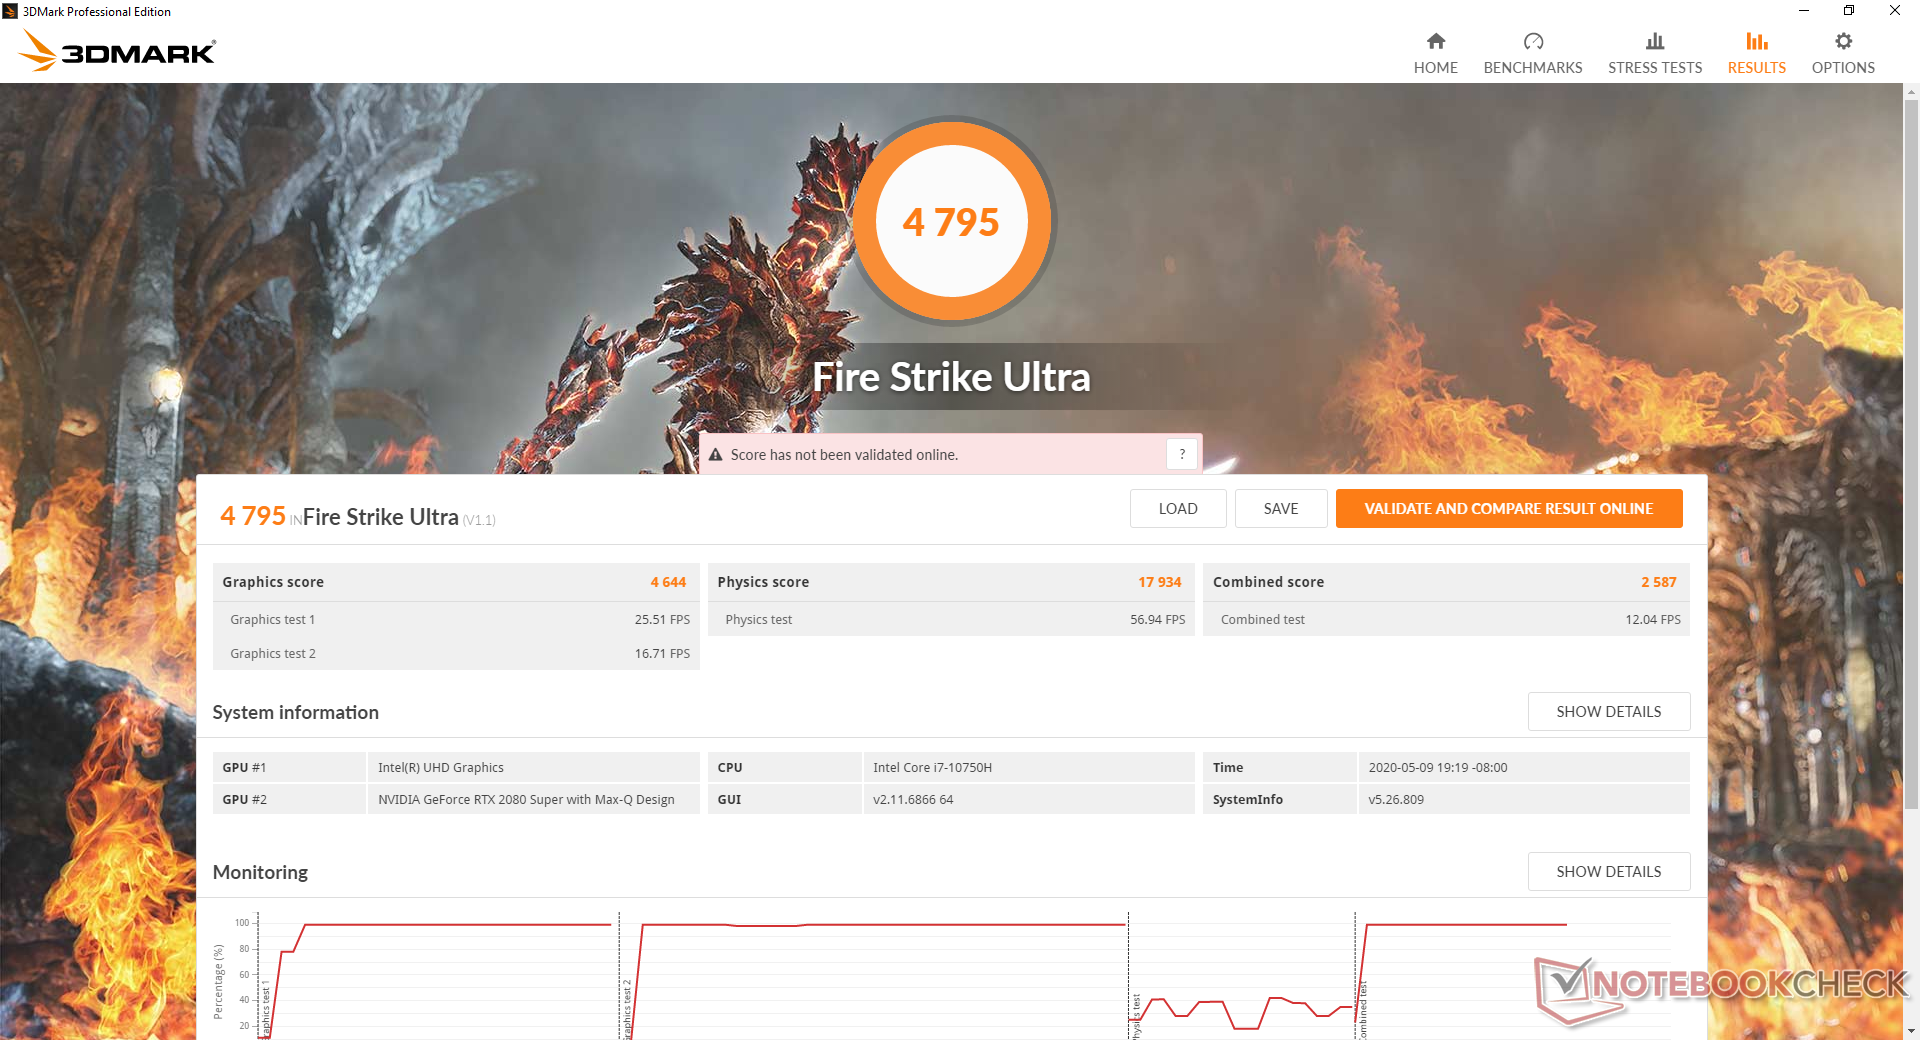
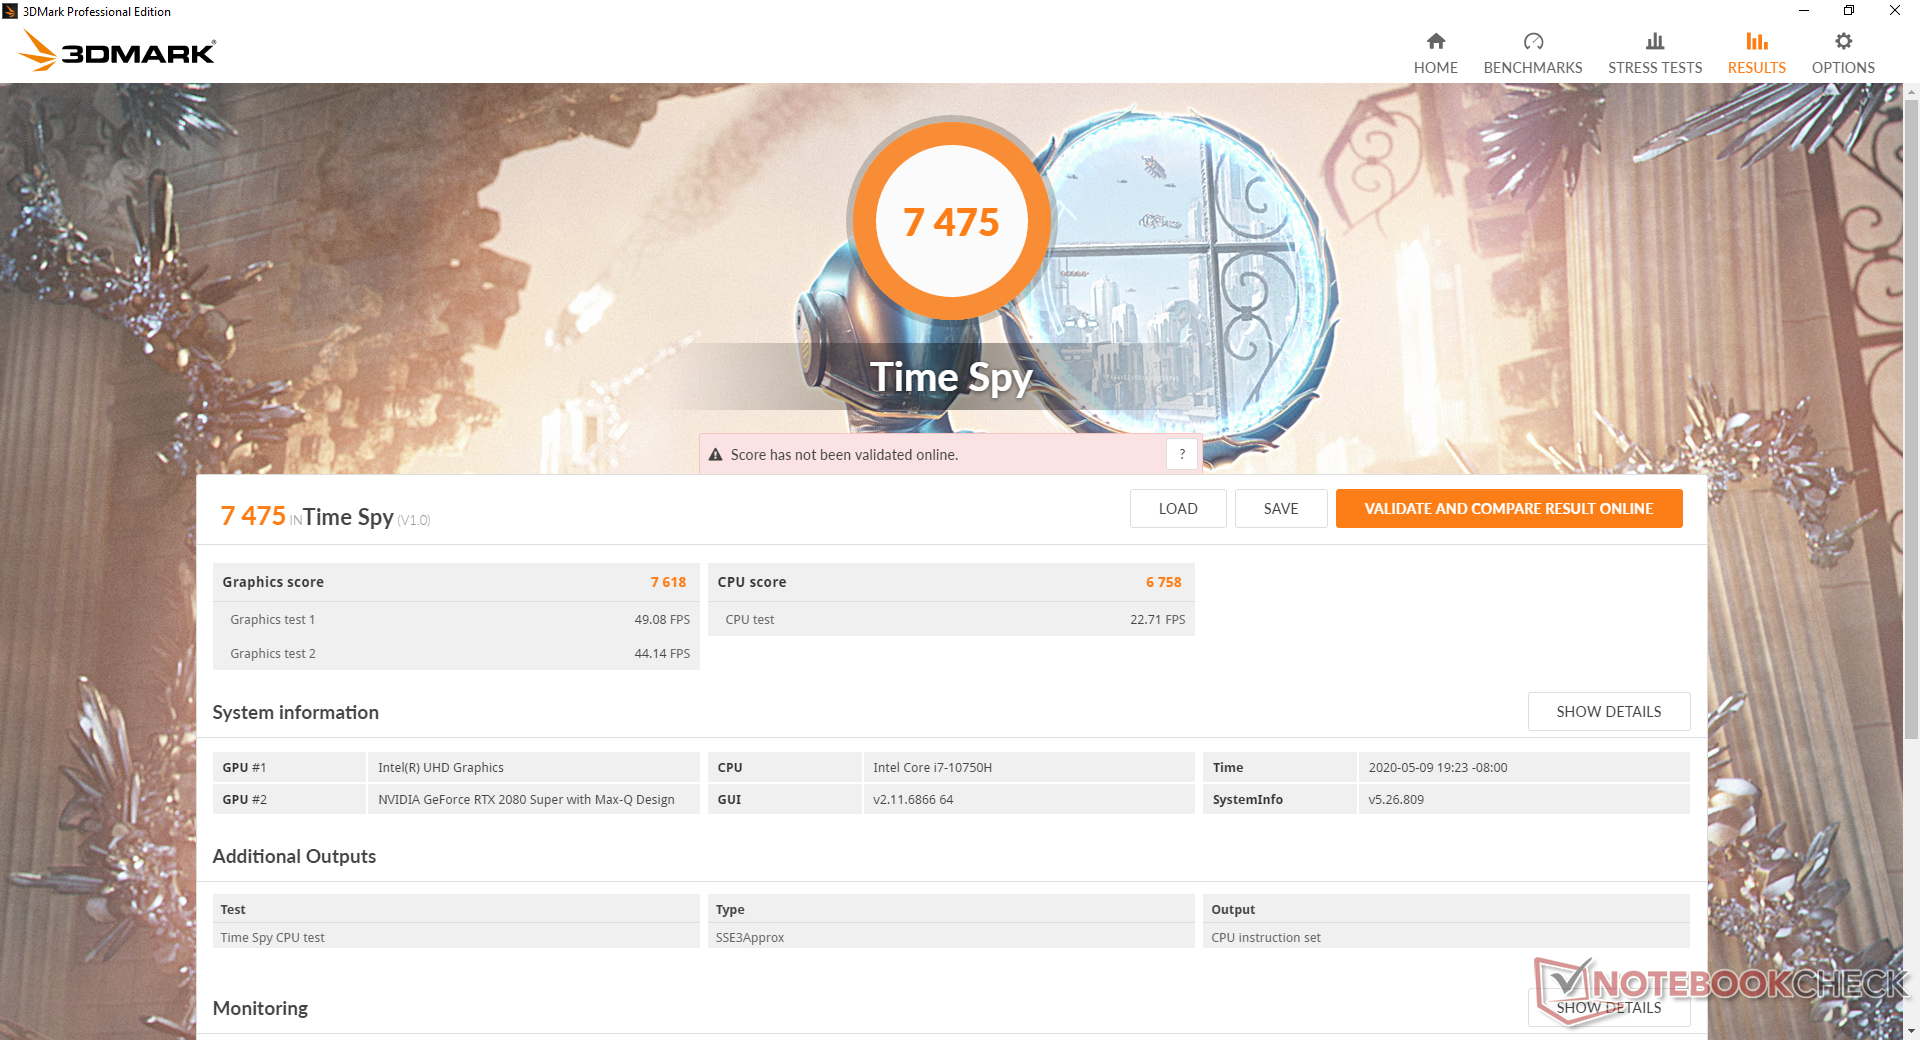
I benchmarks 3DMark sono leggermente inferiori all'Acer Triton 500 con la stessa GPU GeForce RTX 2080 Super Max-Q. Se si guarda al quadro generale, alcuni vecchi portatili con la GeForce RTX 2080 Max-Q sono in grado di superare il nostro MSI di circa il 10%, tra cui Dell Alienware m17 R2 e Asus ROG Zephyrus S GX701GXR. Gli utenti dovrebbero quindi aspettarsi quasi le stesse prestazioni di gioco della GeForce RTX 2080 Max-Q di un anno fa. Infatti, l'aggiornamento dalla configurazione GeForce RTX 2070 Super Max-Q porterà solo dal 5 al 10% in più di potenza grafica.
L'abilitazione di Cooler Boost aumenterà le prestazioni della GPU di pochissimo. Un'esecuzione di 3DMark Fire Strike con Cooler Boost attivo restituisce un punteggio di Graphics di 20784 punti rispetto a 20117 punti quando la funzione è disattivata.
Si noti che G-Sync non è supportato in quanto il laptop utilizza Optimus al suo posto. Non possiamo dire di aver perso la funzione perché il display a 300 Hz diminuirà naturalmente la distorsione dello schermo.
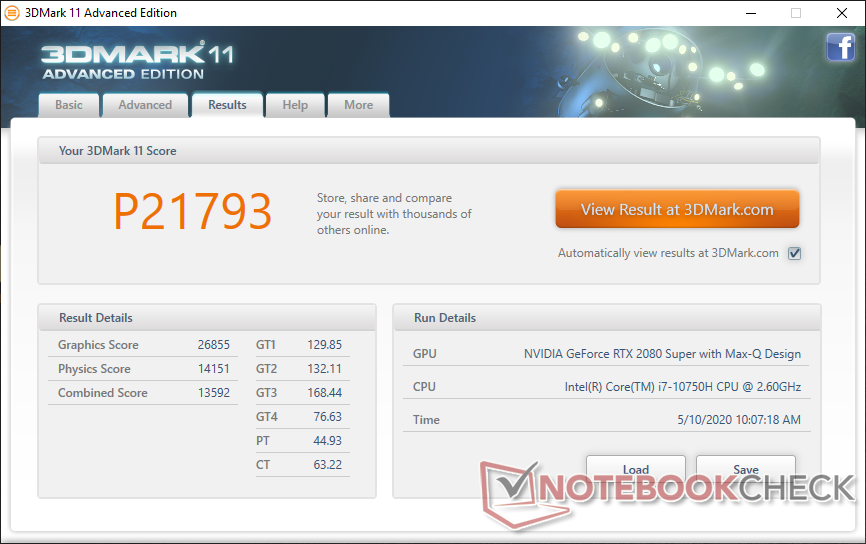
| 3DMark 11 Performance | 21793 punti | |
| 3DMark Cloud Gate Standard Score | 39597 punti | |
| 3DMark Fire Strike Score | 17585 punti | |
| 3DMark Time Spy Score | 7475 punti | |
Aiuto | ||
Prestazioni Gaming
I frame rate sono costantemente più elevati rispetto al GS66 10SFS quando si gioca con impostazioni High o Extreme, dove è più probabile che i giochi siano legati alle GPU. Le differenze sono minori al 10% o meno, come previsto dai risultati di 3DMark di cui sopra.
È interessante notare che ci sono casi in cui la GeForce RTX 2070 Super Max-Q può superare il nostro MSI. L'Aorus 17G XB, per esempio, ha un leggero vantaggio sul nostro sistema su Shadow of the Tomb Raider, mentre resta indietro rispetto al nostro sistema durante l'esecuzione di Borderlands 3. La più veloce CPU Core i7-10875H del portatile Gigabyte è probabilmente responsabile della discrepanza.
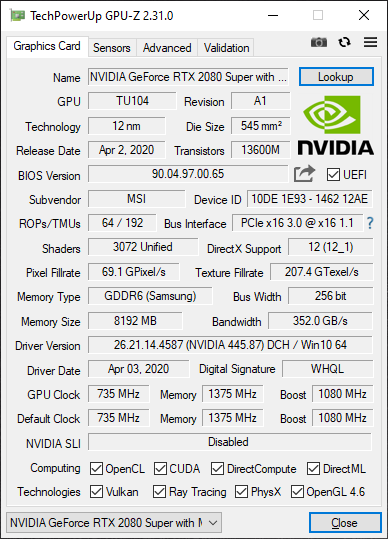
Consultate la nostra pagina dedicata alla GeForce RTX 2080 Super Max-Q per maggiori informazioni tecniche e confronti di benchmarks.
| The Witcher 3 | |
| 1920x1080 Ultra Graphics & Postprocessing (HBAO+) | |
| Nvidia GeForce RTX 2080 Super | |
| MSI GE75 9SG | |
| Media NVIDIA GeForce RTX 2080 Super Max-Q (74.3 - 96, n=11) | |
| MSI GP65 10SFK-047US | |
| Alienware m17 R2 P41E | |
| MSI GS66 10SGS | |
| Aorus 17G XB | |
| MSI GS66 Stealth 10SFS | |
| Walmart EVOO Gaming 17 | |
| Asus Zephyrus G14 GA401IV | |
| 1920x1080 High Graphics & Postprocessing (Nvidia HairWorks Off) | |
| Nvidia GeForce RTX 2080 Super | |
| MSI GE75 9SG | |
| MSI GP65 10SFK-047US | |
| Alienware m17 R2 P41E | |
| Media NVIDIA GeForce RTX 2080 Super Max-Q (138 - 160, n=7) | |
| MSI GS66 10SGS | |
| Aorus 17G XB | |
| Walmart EVOO Gaming 17 | |
| MSI GS66 Stealth 10SFS | |
| Asus Zephyrus G14 GA401IV | |
| Borderlands 3 | |
| 1920x1080 Badass Overall Quality (DX11) | |
| Media NVIDIA GeForce RTX 2080 Super Max-Q (62.5 - 71.6, n=4) | |
| MSI GS66 10SGS | |
| MSI GS66 Stealth 10SFS | |
| Aorus 17G XB | |
| Asus Zephyrus G14 GA401IV | |
| 1920x1080 High Overall Quality (DX11) | |
| MSI GS66 10SGS | |
| Media NVIDIA GeForce RTX 2080 Super Max-Q (78.2 - 84.3, n=4) | |
| Aorus 17G XB | |
| MSI GS66 Stealth 10SFS | |
| Asus Zephyrus G14 GA401IV | |
| basso | medio | alto | ultra | |
|---|---|---|---|---|
| The Witcher 3 (2015) | 310.3 | 239.5 | 142.7 | 74.3 |
| Dota 2 Reborn (2015) | 147 | 132 | 122 | 116 |
| X-Plane 11.11 (2018) | 102 | 90.9 | 76.8 | |
| Shadow of the Tomb Raider (2018) | 138 | 109 | 104 | 96 |
| Assassin´s Creed Odyssey (2018) | 102 | 87 | 75 | 54 |
| Apex Legends (2019) | 299 | 196 | 148.8 | 147.6 |
| Metro Exodus (2019) | 143.3 | 96.2 | 74.4 | 59 |
| Dirt Rally 2.0 (2019) | 252 | 168.4 | 158.5 | 90 |
| The Division 2 (2019) | 165 | 117 | 96 | 73 |
| Anno 1800 (2019) | 159 | 98.2 | 76.7 | 44.4 |
| Total War: Three Kingdoms (2019) | 233 | 127.8 | 88.5 | 64.1 |
| F1 2019 (2019) | 205 | 168 | 147 | 142 |
| Borderlands 3 (2019) | 132.5 | 105.7 | 81.1 | 63.5 |
| Ghost Recon Breakpoint (2019) | 117 | 96 | 86 | 65 |
| GRID 2019 (2019) | 174.8 | 125 | 111 | 74 |
| Need for Speed Heat (2019) | 101.9 | 92 | 84 | 76.9 |
| Escape from Tarkov (2020) | 121 | 121 | 120 | 120 |
| Hunt Showdown (2020) | 207.4 | 121.4 | 102 | |
| Doom Eternal (2020) | 256 | 167.6 | 147.1 | 140 |
Emissioni
Rumorosità di sistema
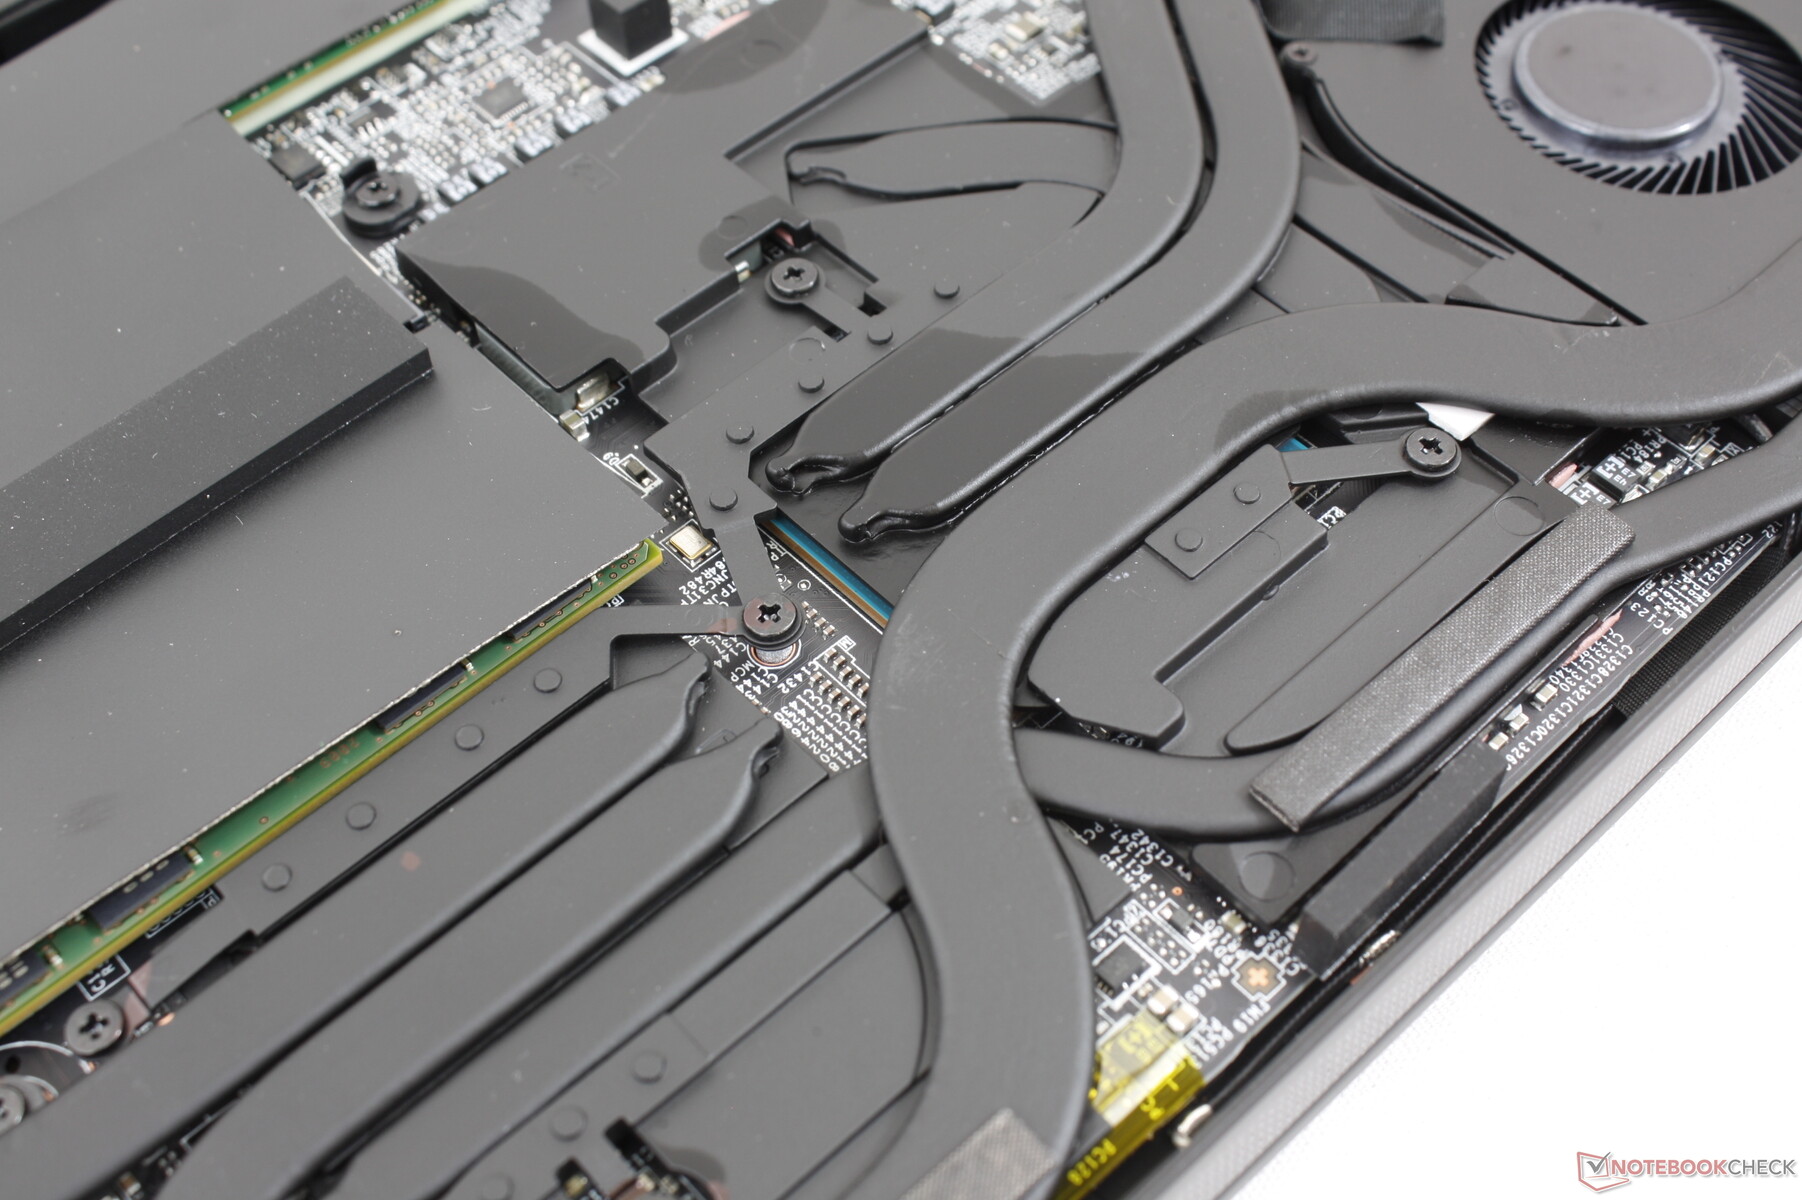
La soluzione di raffreddamento è composta da due ventole da ~50 mm e una più piccola da ~40 mm con sette tubi di calore tra loro. Il rumore delle ventole sarà sempre presente a circa 30 - 30,9 dB(A), indipendentemente dall'impostazione o dal carico sullo schermo, anche se sul profilo di potenza MSI preimpostato "Silenzioso". Anche se udibile, non lo troviamo fastidioso durante la navigazione o lo streaming video. Tuttavia, si consiglia di utilizzare il portatile in modalità Power Saver o Silent se non si gioca, altrimenti le ventole pulseranno frequentemente.
Parlando di pulsazioni delle ventole, il nostro GS66 10SGS è in grado di rimanere più silenzioso del GS66 10SFS per un tempo maggiore prima di raggiungere lo stesso valore finale di decibel. Per esempio, il rumore della ventola quando si esegue la prima scena di benchmark del 3DMark 06 raggiunge il massimo a 53 dB(A) sul 10SFS mentre il 10SGS restituisce un rumore della ventola inferiore di 39,5 dB(A). Se si considera il maggiore potenziale di Turbo Boost del Core i9 nel 10SGS, i risultati hanno senso. Quando si esegue The Witcher 3, il rumore della ventola si stabilizza a 48 dB(A) su entrambi i portatili. I risultati complessivi sono alla pari con il GS66 nonostante la struttura più spessa e pesante del GS66.
Il rumore della ventola si stabilizza a circa 53 dB(A) quando è sottoposto a carichi più estremi come il Prime95 e il FurMark. Se il Cooler Boost è abilitato, il rumore della ventola aumenterà fino a 59,4 dB(A). Preferiamo mantenere Cooler Boost spento quando si gioca, perché non aumenterà le prestazioni di tutto ciò che è in relazione all'estremo aumento del rumore della ventola.
| MSI GS66 10SGS GeForce RTX 2080 Super Max-Q, i7-10750H, Samsung SSD PM981 MZVLB512HAJQ | MSI GS65 Stealth 9SG GeForce RTX 2080 Max-Q, i7-9750H, Samsung SSD PM981 MZVLB512HAJQ | Asus Zephyrus S GX502GW GeForce RTX 2070 Mobile, i7-9750H, 2x Intel SSD 660p SSDPEKNW512G8 (RAID 0) | Razer Blade 15 RTX 2080 Max-Q GeForce RTX 2080 Max-Q, i7-9750H, Samsung SSD PM981 MZVLB512HAJQ | HP Omen X 2S 15-dg0075cl GeForce RTX 2070 Max-Q, i7-9750H, WDC PC SN720 SDAPNTW-1T00 | Lenovo Legion Y740-15ICHg GeForce RTX 2070 Max-Q, i7-9750H, WDC PC SN520 SDAPMUW-128G | MSI GS66 Stealth 10SFS GeForce RTX 2070 Super Max-Q, i9-10980HK, Samsung SSD PM981 MZVLB1T0HALR | |
|---|---|---|---|---|---|---|---|
| Noise | 2% | -10% | 9% | -1% | 2% | -11% | |
| off /ambiente * (dB) | 28.5 | 28.3 1% | 30 -5% | 28.3 1% | 29 -2% | 30 -5% | 30 -5% |
| Idle Minimum * (dB) | 30 | 30.4 -1% | 31 -3% | 28.8 4% | 30.5 -2% | 31.3 -4% | 32 -7% |
| Idle Average * (dB) | 30 | 30.5 -2% | 33 -10% | 28.8 4% | 31.5 -5% | 31.3 -4% | 34 -13% |
| Idle Maximum * (dB) | 30.9 | 30.6 1% | 38 -23% | 29 6% | 31.5 -2% | 31.3 -1% | 39 -26% |
| Load Average * (dB) | 39.5 | 37.6 5% | 50 -27% | 33.5 15% | 40.6 -3% | 42 -6% | 53 -34% |
| Witcher 3 ultra * (dB) | 48 | 46 4% | 53 -10% | 45 6% | 49.5 -3% | 42.1 12% | 48 -0% |
| Load Maximum * (dB) | 59.4 | 55.1 7% | 56 6% | 45.2 24% | 53.4 10% | 46.5 22% | 53 11% |
* ... Meglio usare valori piccoli
Rumorosità
| Idle |
| 30 / 30 / 30.9 dB(A) |
| Sotto carico |
| 39.5 / 59.4 dB(A) |
 | ||
30 dB silenzioso 40 dB(A) udibile 50 dB(A) rumoroso |
||
min: | ||
Temperature
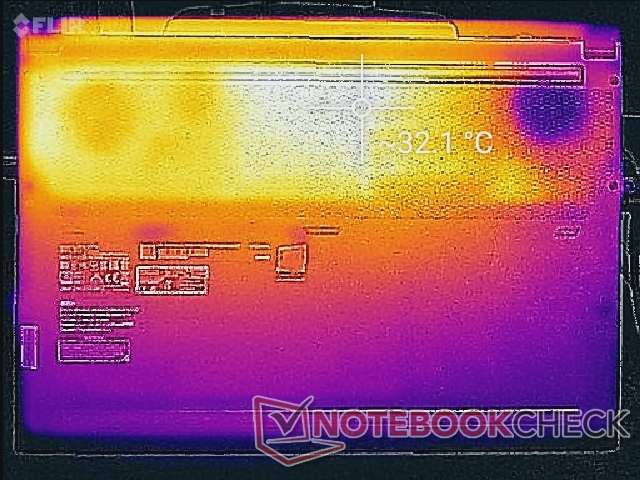
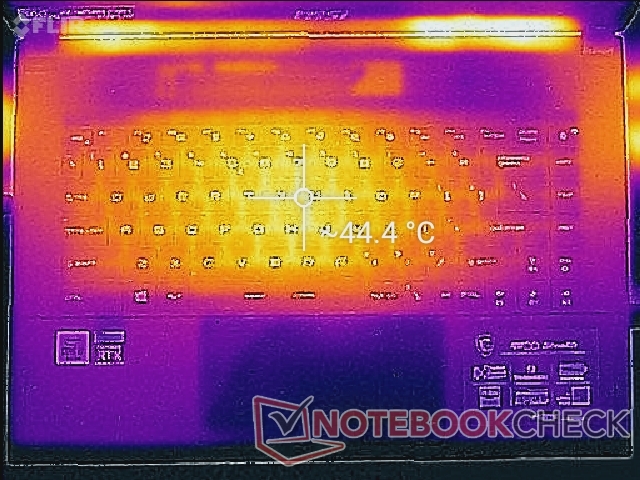
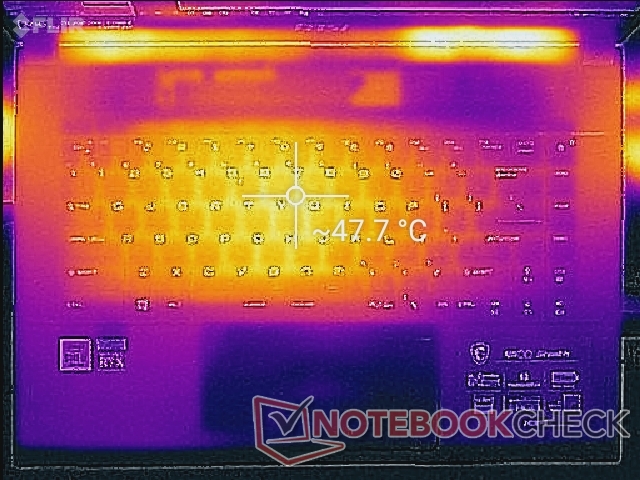
Le temperature di superficie sono simili a quelle registrate l'anno scorso sul MSI GS65. Il punto caldo continua a trovarsi proprio al centro della tastiera in contrasto con l'Asus Zephyrus S GX531 dove il punto caldo è sopra la tastiera e lontano dai tasti. Se si gioca, aspettatevi che i tasti WASD siano circa 40 °C.
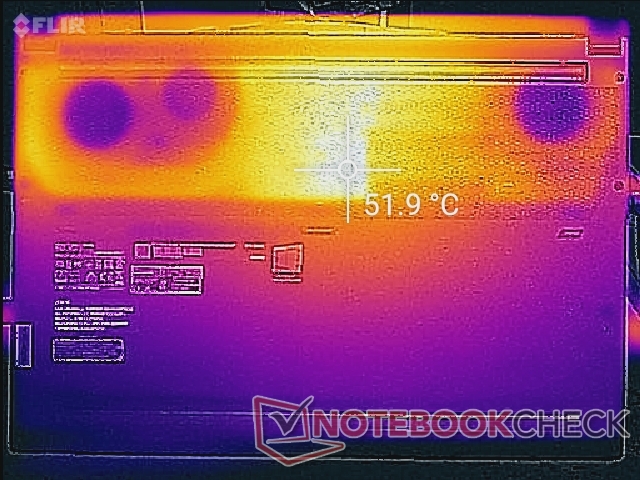
La metà anteriore del portatile sarà sempre molto più fredda della metà posteriore, poiché la batteria occupa la maggior parte della parte anteriore.
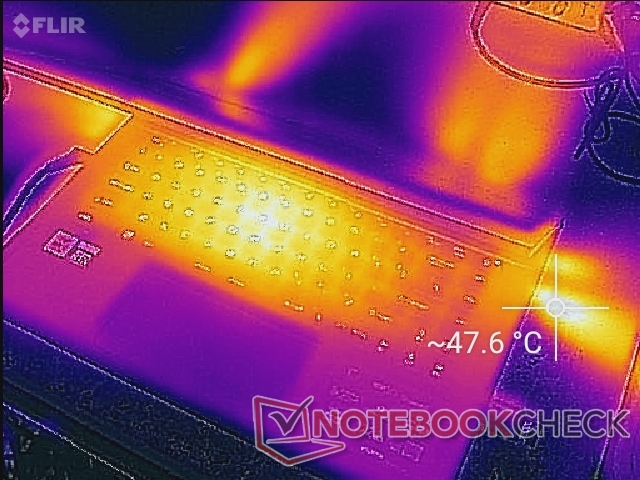
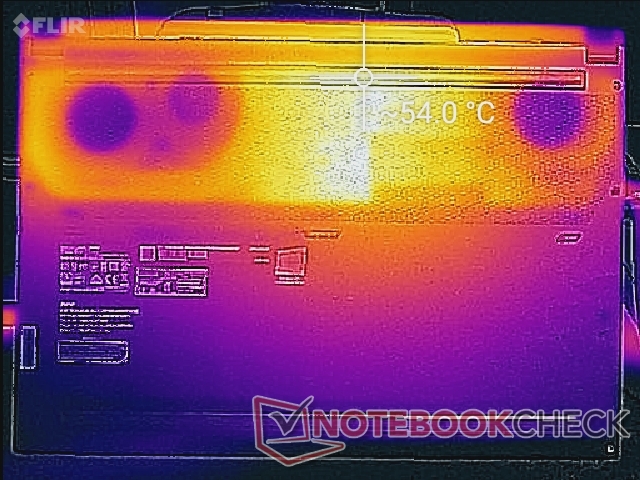
(-) La temperatura massima sul lato superiore è di 47.8 °C / 118 F, rispetto alla media di 40.4 °C / 105 F, che varia da 21.2 a 68.8 °C per questa classe Gaming.
(-) Il lato inferiore si riscalda fino ad un massimo di 54.4 °C / 130 F, rispetto alla media di 43.2 °C / 110 F
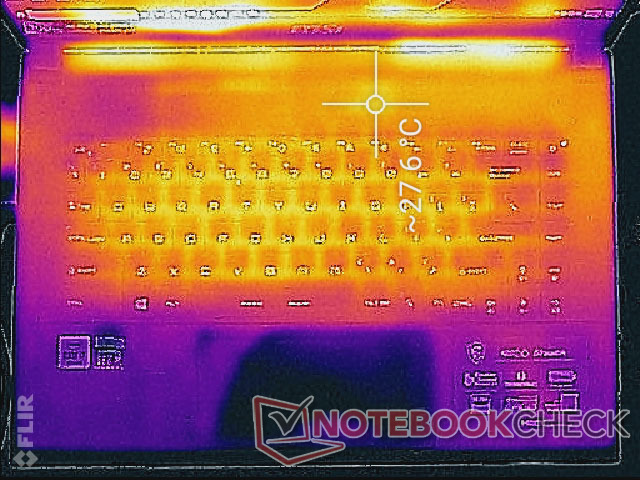
(+) In idle, la temperatura media del lato superiore è di 25.9 °C / 79 F, rispetto alla media deld ispositivo di 33.9 °C / 93 F.
(±) Riproducendo The Witcher 3, la temperatura media per il lato superiore e' di 33.3 °C / 92 F, rispetto alla media del dispositivo di 33.9 °C / 93 F.
(+) I poggiapolsi e il touchpad sono piu' freddi della temperatura della pelle con un massimo di 28.6 °C / 83.5 F e sono quindi freddi al tatto.
(±) La temperatura media della zona del palmo della mano di dispositivi simili e'stata di 28.8 °C / 83.8 F (+0.2 °C / 0.3 F).
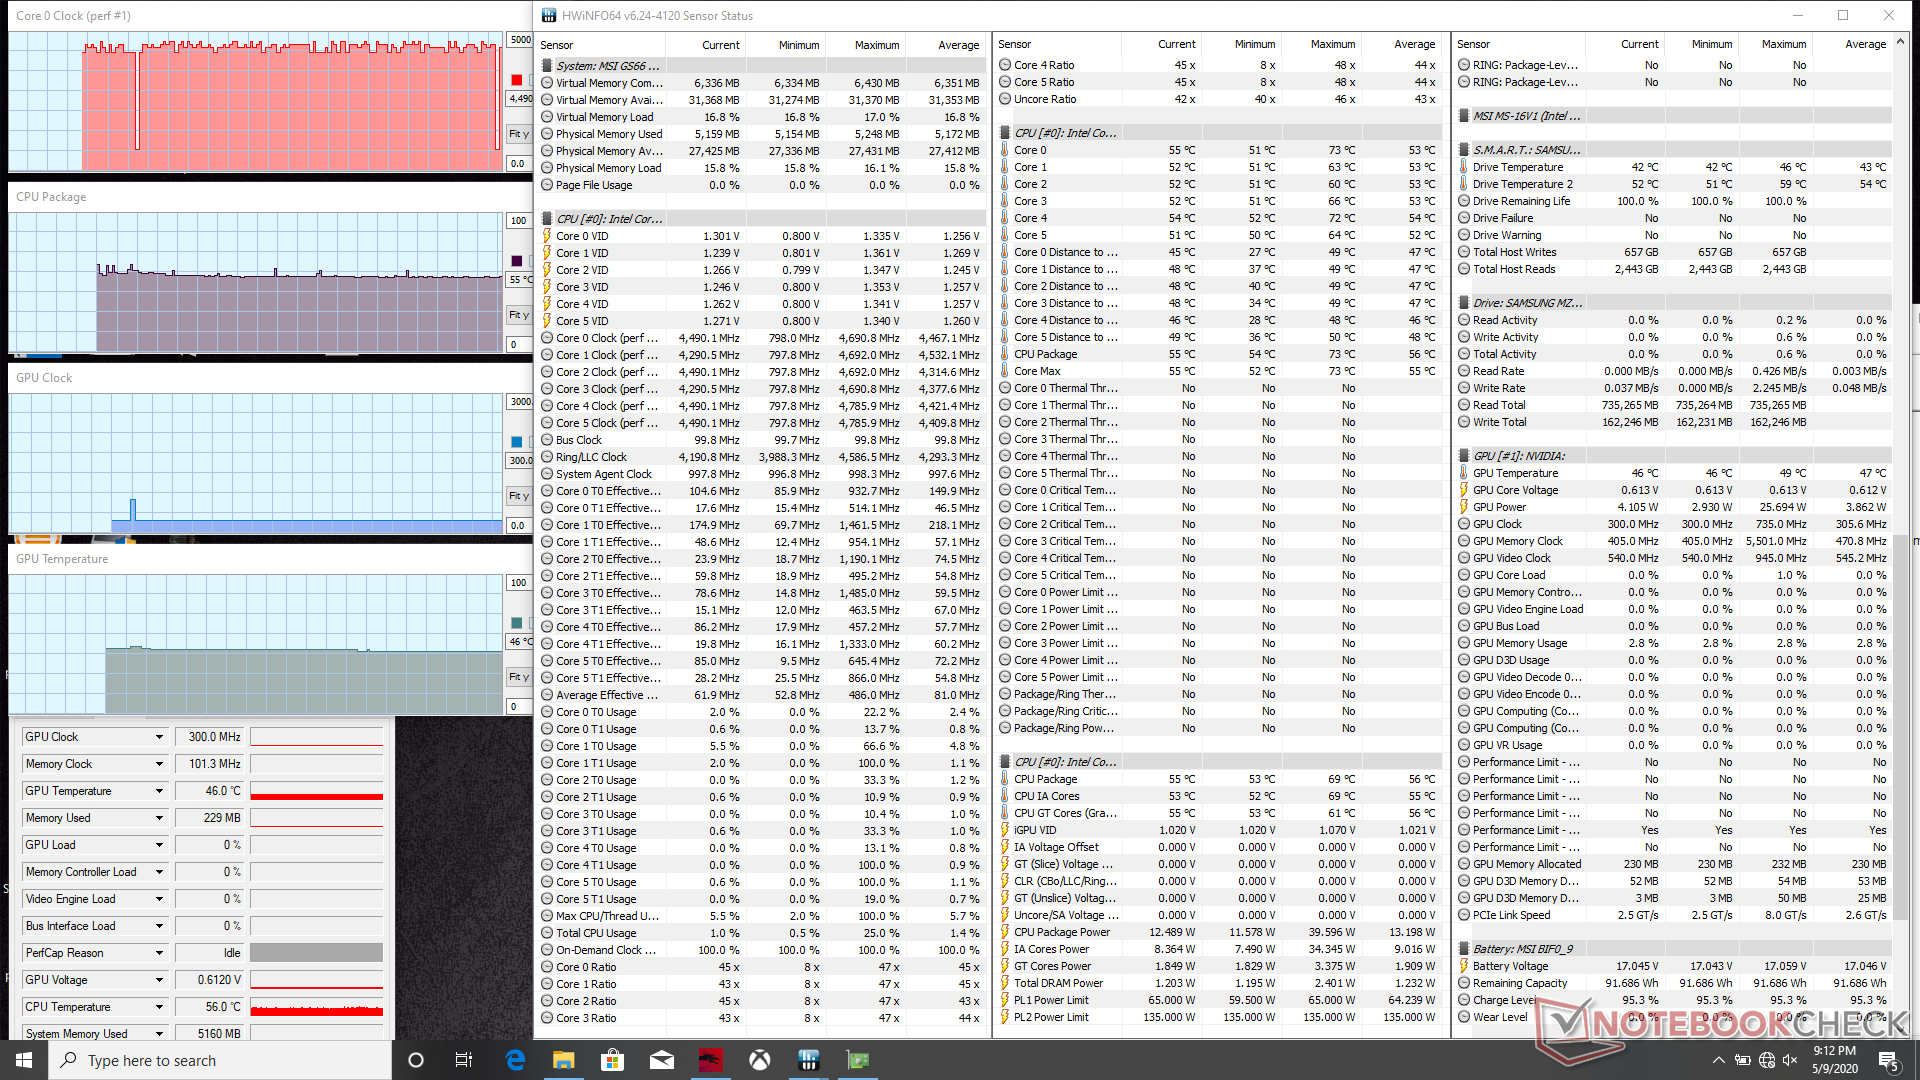
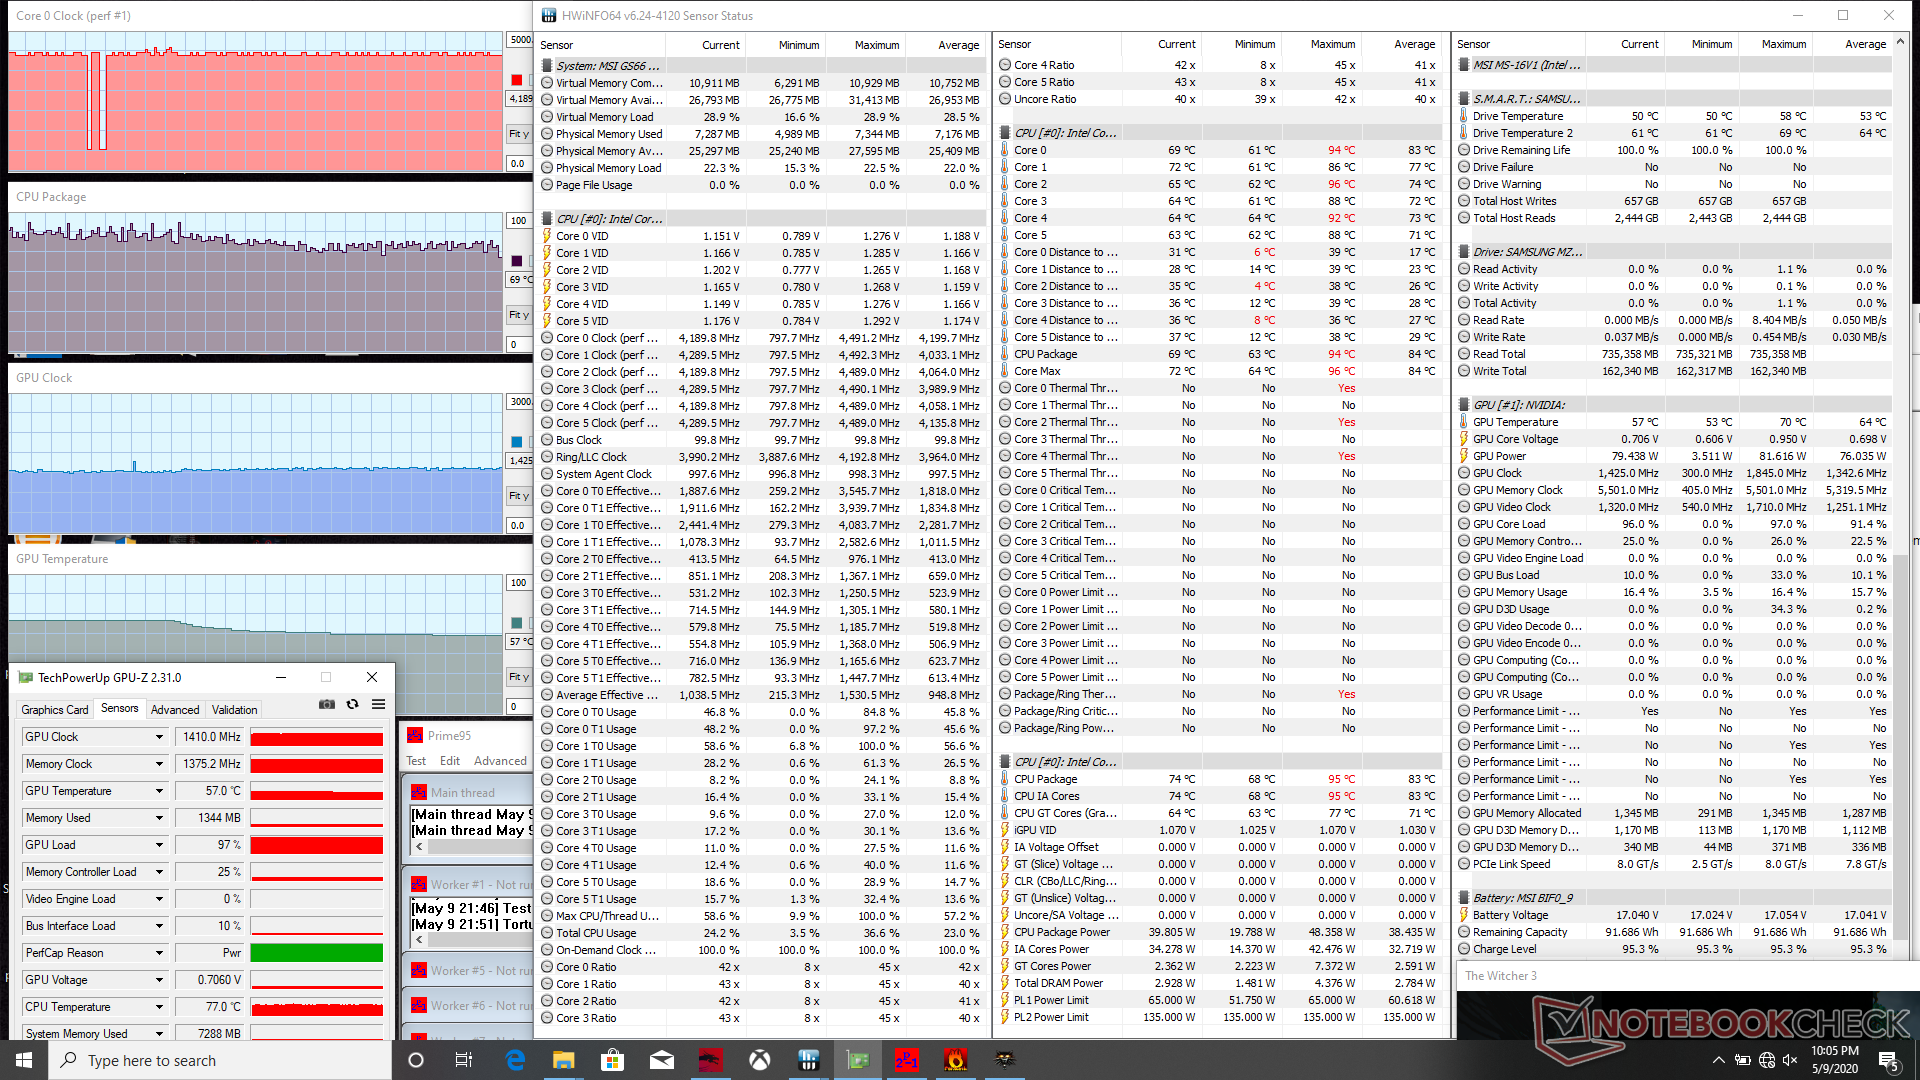
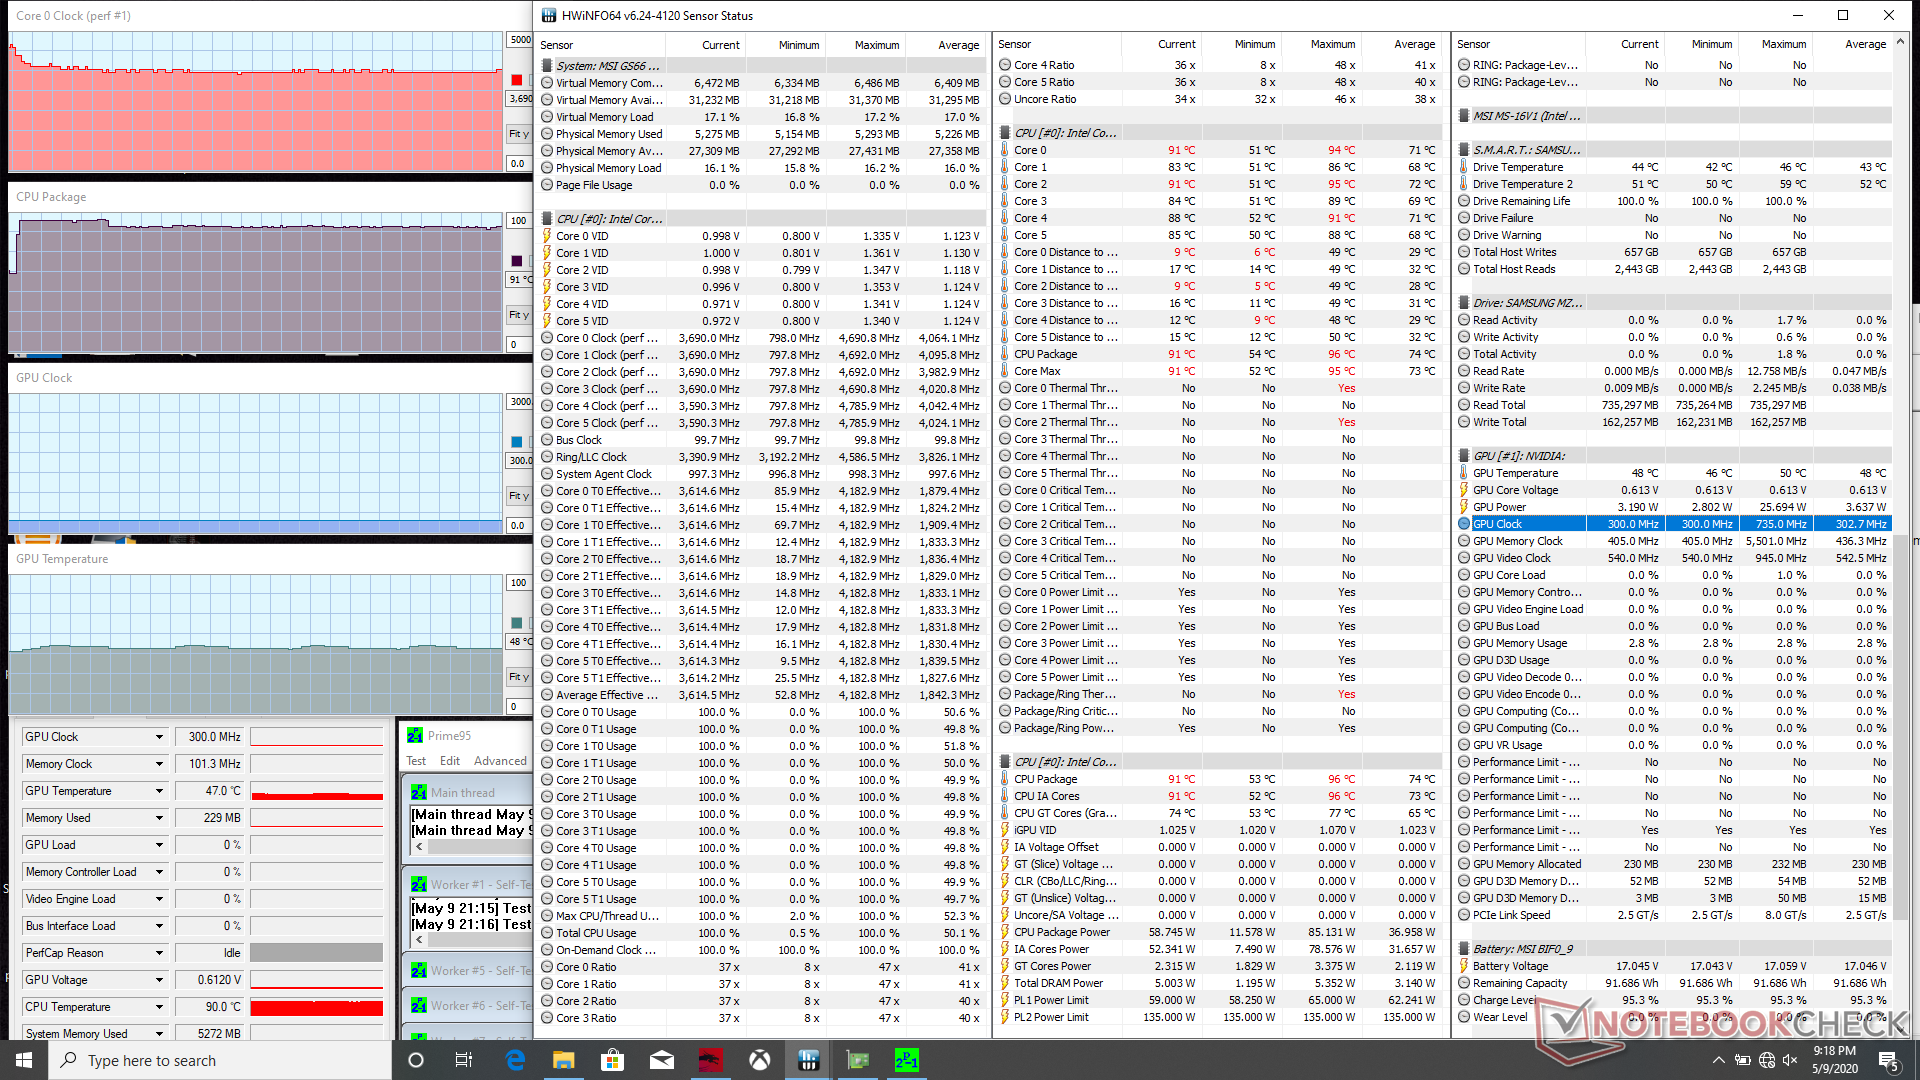
Stress Test
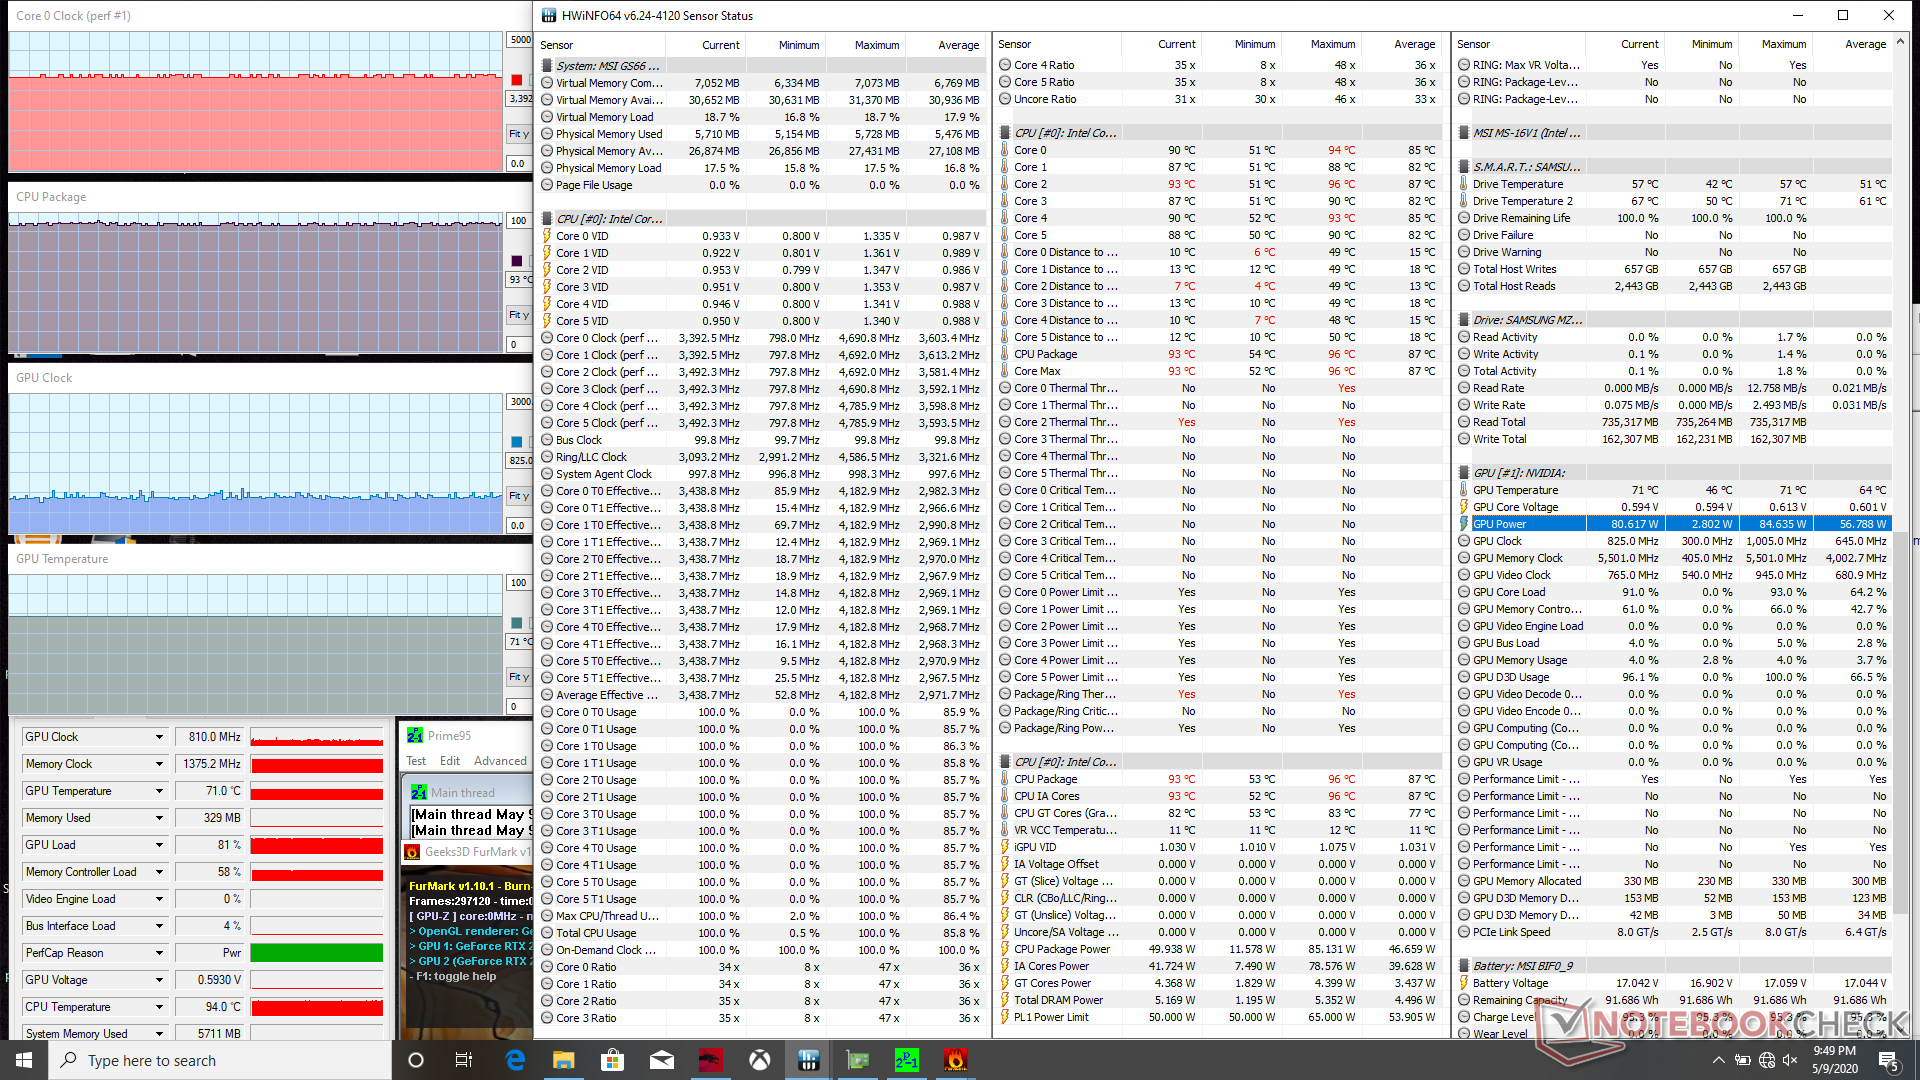
Stressiamo il sistema con carichi sintetici per identificare per eventuali problemi di strozzamento. Quando si esegue Prime95, la CPU aumenta fino a 4,2 GHz per solo un paio di secondi prima di scendere a 3,8 - 3,9 GHz per i successivi 30-40 secondi. In seguito, le frequenze di clock e la temperatura del core si stabilizzano rispettivamente a 3,6 - 3,7 GHz e a ben 91 °C. L'esecuzione simultanea di Prime95 e FurMark fa sì che la CPU e la GPU si stabilizzino rispettivamente a 93 °C e 71 °C.
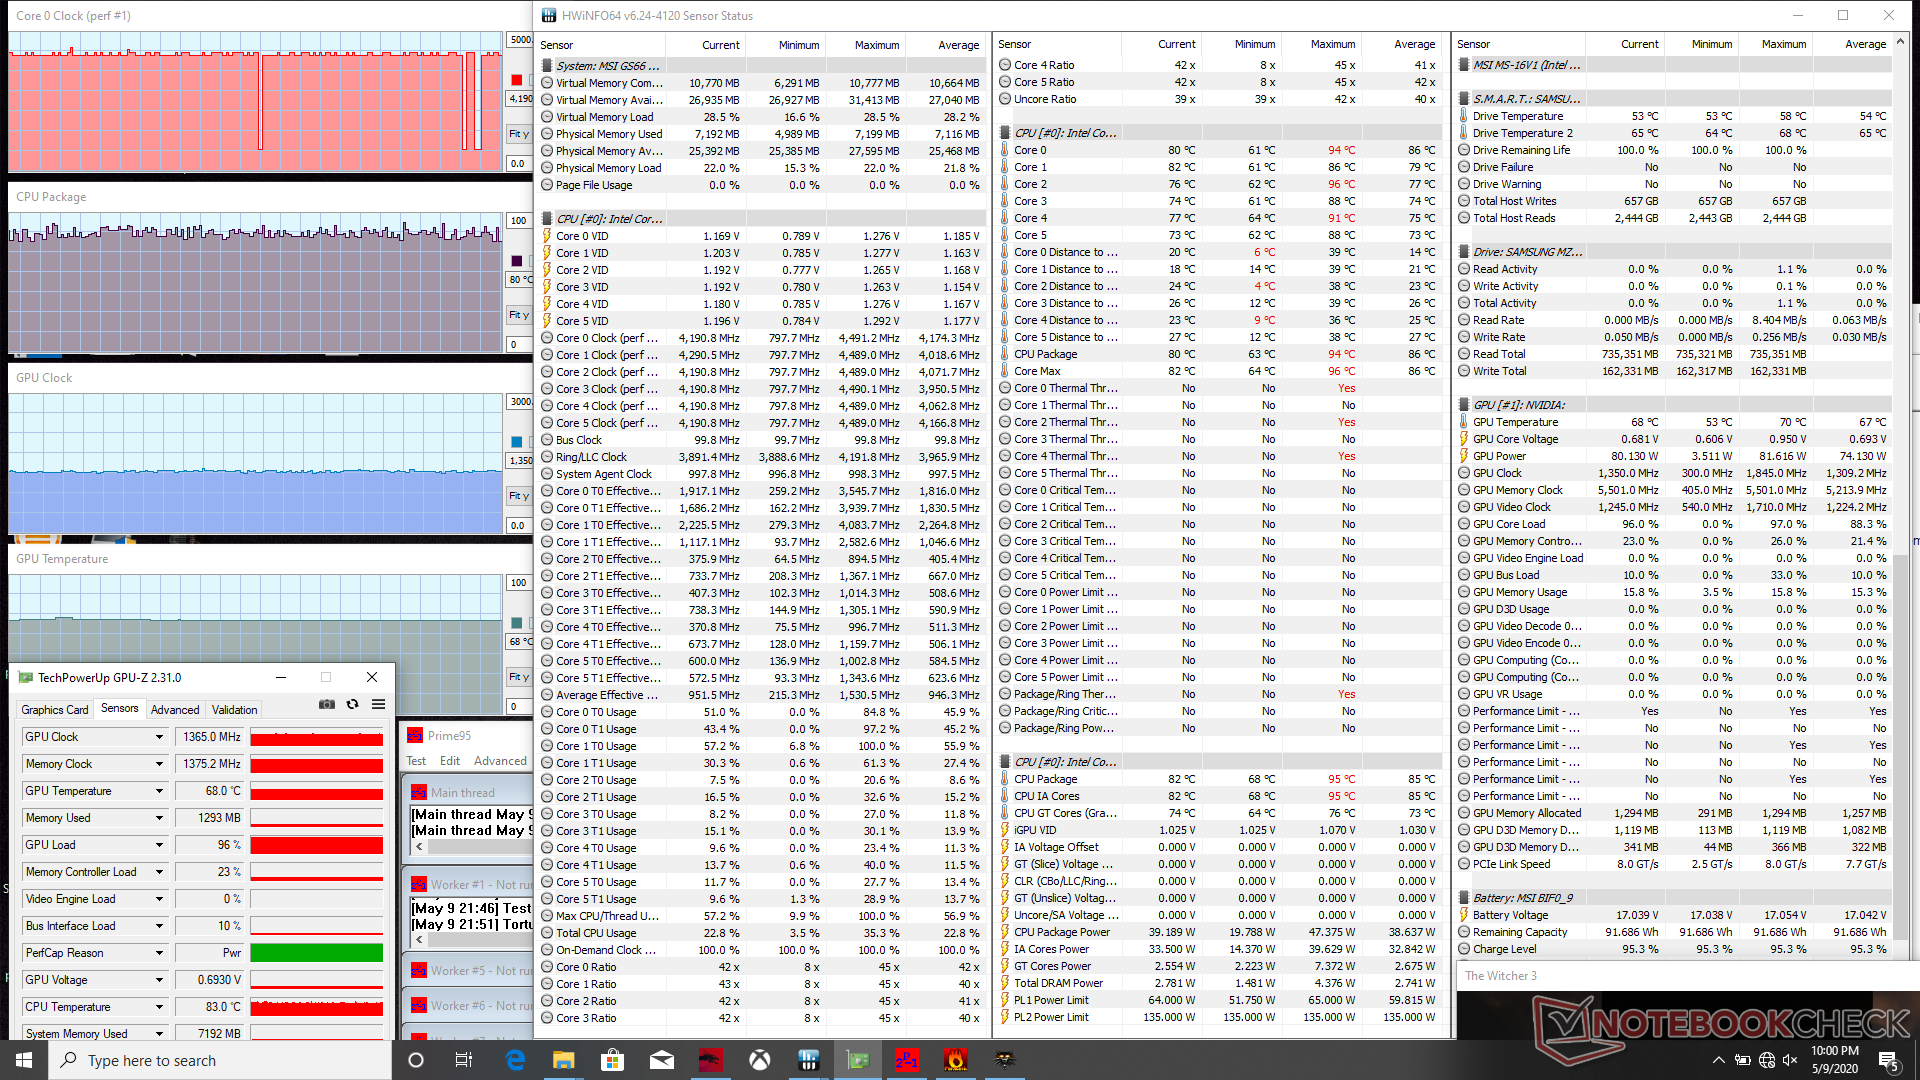
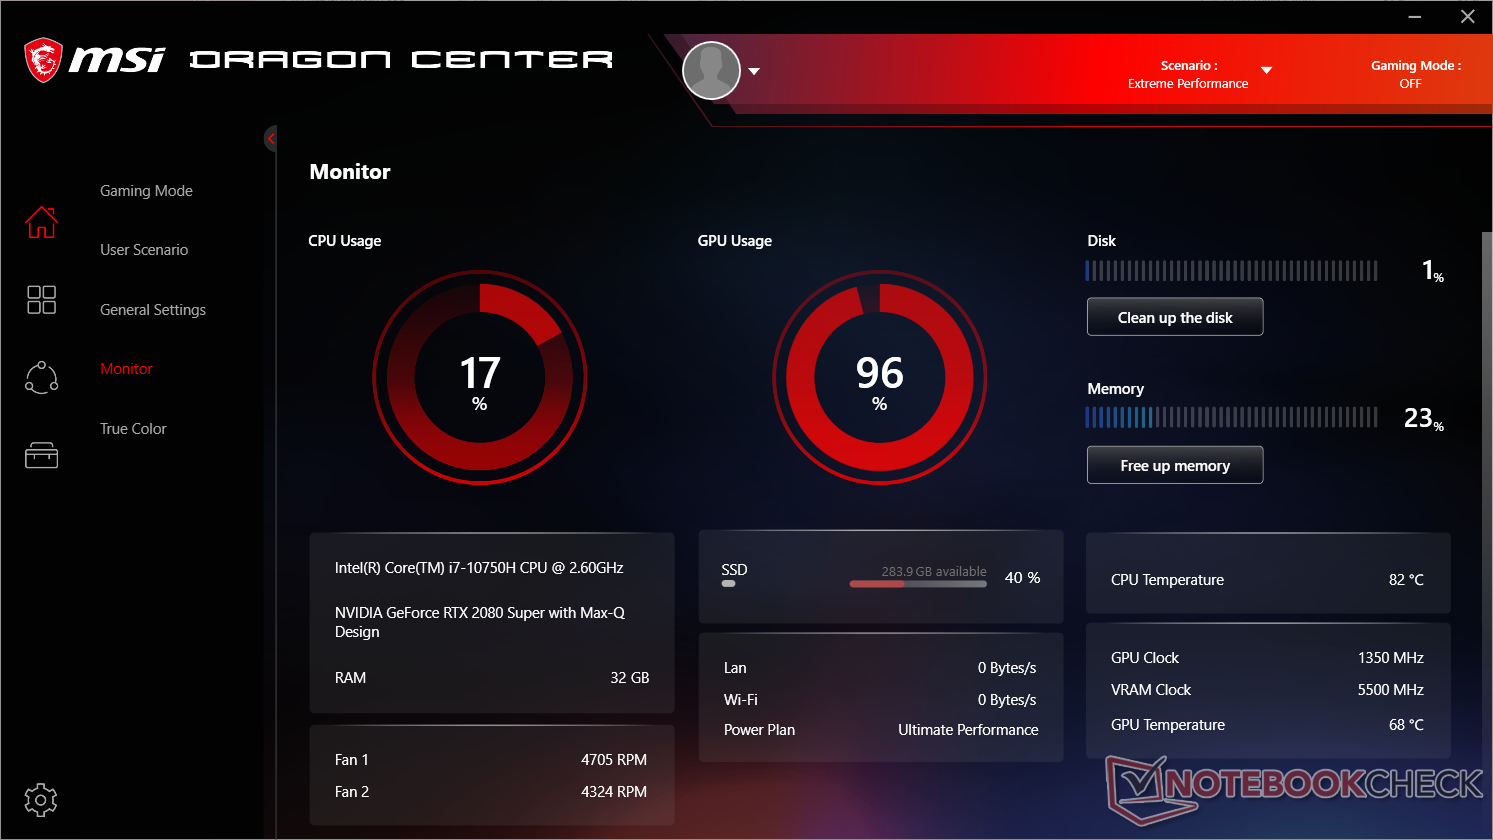
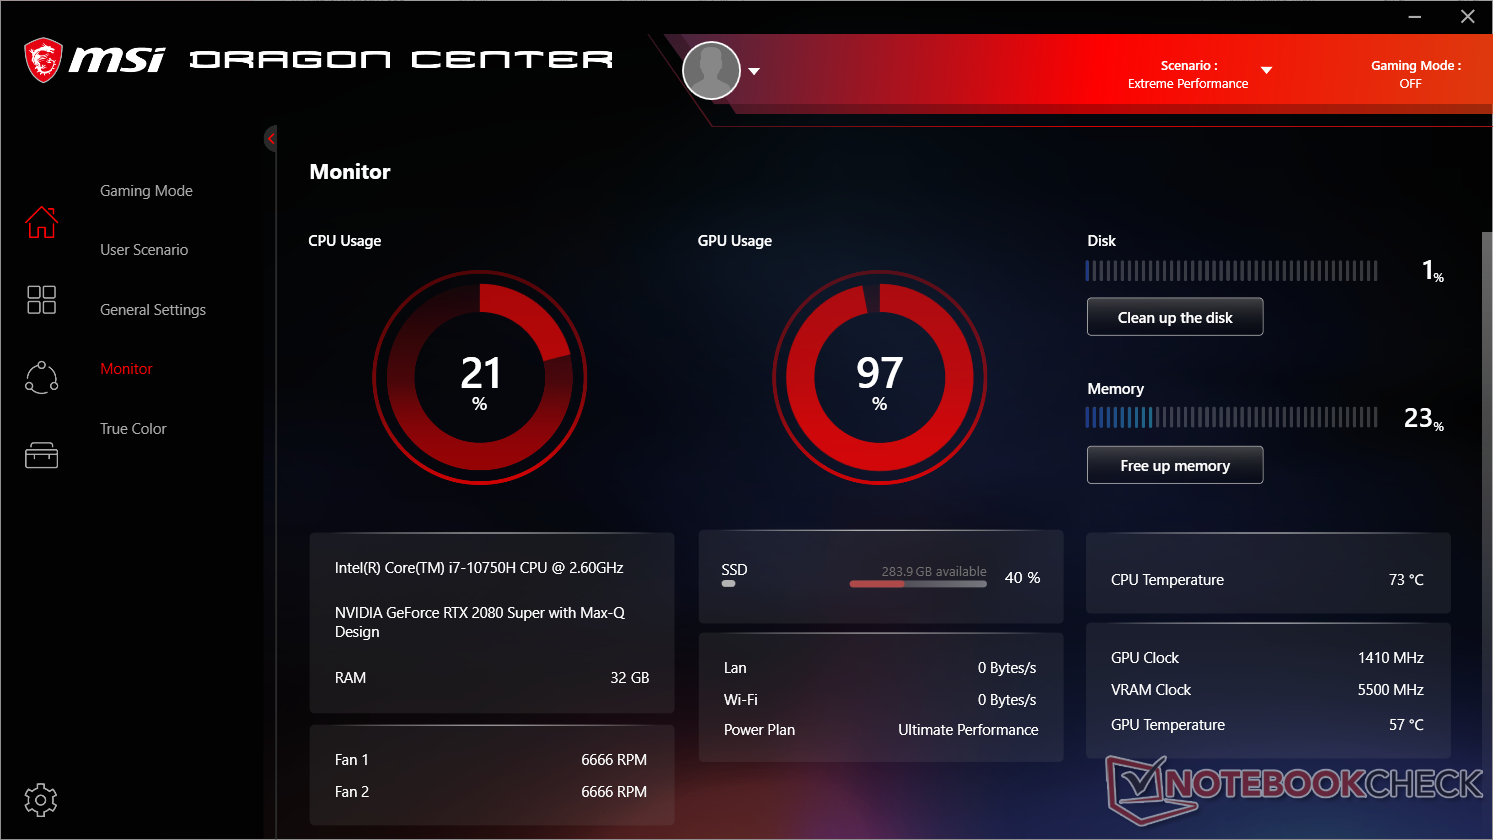
L'esecuzione di The Witcher 3 è più rappresentativa dei carichi di gioco del mondo reale. La CPU e la GPU si stabilizzano rispettivamente a 82 °C e 68 °C, rispetto a 81 °C e 71 °C del vecchio GS65 con il Core i7-9750H e RTX 2080 Max-Q. Abilitando il Cooler Boost si riducono le temperature della CPU e della GPU di circa 10 °C ciascuna, mentre si aumenta leggermente la velocità di clock della GPU (1365 MHz contro 1410 MHz).
Usando la batteria si avrà un impatto sulle prestazioni. Un Fire Strike eseguito con la batteria restituisce Physics e Graphics punteggi di 12931 e 5667 punti, rispettivamente, rispetto a 17764 e 20117 punti ottenuti con l'alimentazione di rete.
| CPU Clock (GHz) | GPU Clock (MHz) | Average CPU Temperature (°C) | Average GPU Temperature (°C) | |
| System Idle | -- | -- | 55 | 46 |
| Prime95 Stress | 3.6 - 3.7 | -- | 91 | 48 |
| Prime95 + FurMark Stress | 3.3 - 3.4 | 810 | 93 | 71 |
| Witcher 3 Stress (Cooler Boost off) | 4.2 - 4.3 | 1365 | ~82 | 68 |
| Witcher 3 Stress (Cooler Boost on) | 4.2 - 4.3 | 1410 | 71 | 57 |
Altoparlanti


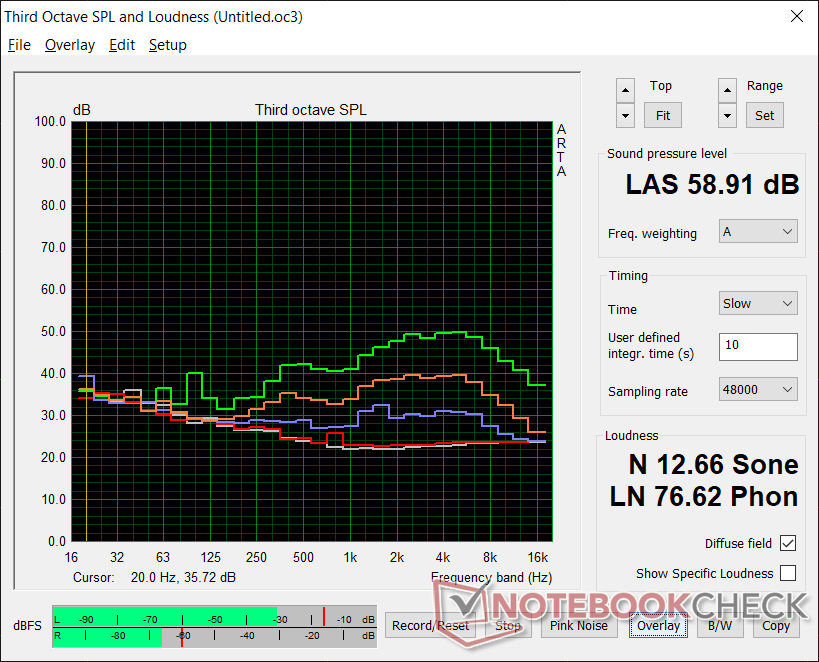
MSI GS66 10SGS analisi audio
(+) | gli altoparlanti sono relativamente potenti (92.3 dB)
Bassi 100 - 315 Hz
(-) | quasi nessun basso - in media 29.8% inferiori alla media
(±) | la linearità dei bassi è media (7.5% delta rispetto alla precedente frequenza)
Medi 400 - 2000 Hz
(±) | medi elevati - circa 9.3% superiore alla media
(±) | linearità dei medi adeguata (9.2% delta rispetto alla precedente frequenza)
Alti 2 - 16 kHz
(±) | alti ridotti - circa 6.1% inferiori alla media
(±) | la linearità degli alti è media (7.5% delta rispetto alla precedente frequenza)
Nel complesso 100 - 16.000 Hz
(±) | la linearità complessiva del suono è media (29.4% di differenza rispetto alla media
Rispetto alla stessa classe
» 95% di tutti i dispositivi testati in questa classe è stato migliore, 2% simile, 3% peggiore
» Il migliore ha avuto un delta di 6%, medio di 18%, peggiore di 132%
Rispetto a tutti i dispositivi testati
» 87% di tutti i dispositivi testati in questa classe è stato migliore, 2% similare, 10% peggiore
» Il migliore ha avuto un delta di 4%, medio di 23%, peggiore di 134%
Apple MacBook 12 (Early 2016) 1.1 GHz analisi audio
(+) | gli altoparlanti sono relativamente potenti (83.6 dB)
Bassi 100 - 315 Hz
(±) | bassi ridotti - in media 11.3% inferiori alla media
(±) | la linearità dei bassi è media (14.2% delta rispetto alla precedente frequenza)
Medi 400 - 2000 Hz
(+) | medi bilanciati - solo only 2.4% rispetto alla media
(+) | medi lineari (5.5% delta rispetto alla precedente frequenza)
Alti 2 - 16 kHz
(+) | Alti bilanciati - appena 2% dalla media
(+) | alti lineari (4.5% delta rispetto alla precedente frequenza)
Nel complesso 100 - 16.000 Hz
(+) | suono nel complesso lineare (10.2% differenza dalla media)
Rispetto alla stessa classe
» 7% di tutti i dispositivi testati in questa classe è stato migliore, 2% simile, 90% peggiore
» Il migliore ha avuto un delta di 5%, medio di 18%, peggiore di 53%
Rispetto a tutti i dispositivi testati
» 5% di tutti i dispositivi testati in questa classe è stato migliore, 1% similare, 94% peggiore
» Il migliore ha avuto un delta di 4%, medio di 23%, peggiore di 134%
Gestione Energetica
Consumo Energetico
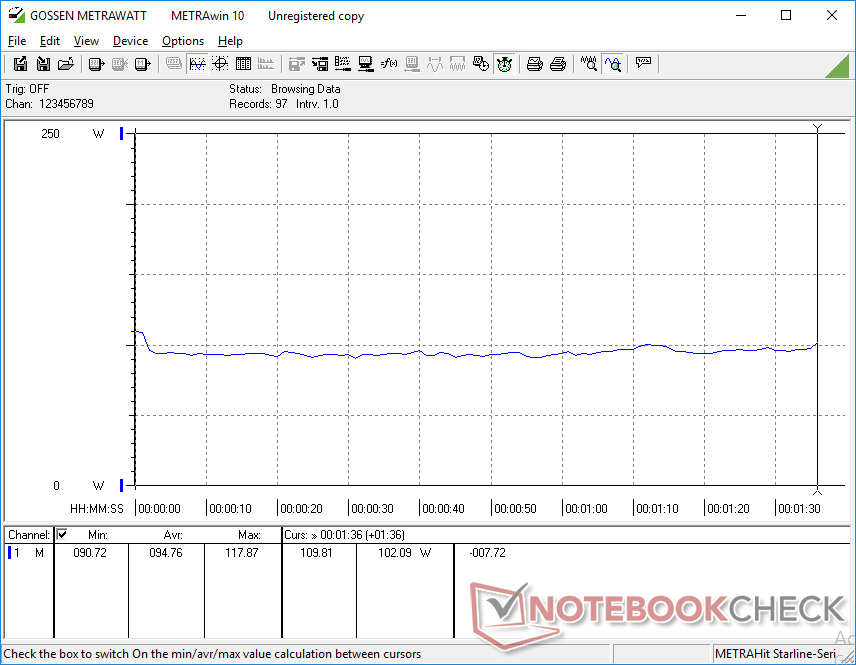
Il funzionamento al minimo sulla scrivania in modalità Power Saver con l'impostazione di luminosità minima e con l'iGPU attiva consumerà circa 15 W. Portando la luminosità fino al massimo comporterà un aumento del consumo di circa 2,5 W. Se impostato in modalità High Performance, il consumo salta a quasi 30 W, il che significa che vale la pena di cambiare il profilo di potenza manualmente per prolungare la durata della batteria se semplicemente si naviga, si effettua lo streaming video o si invia un'e-mail.
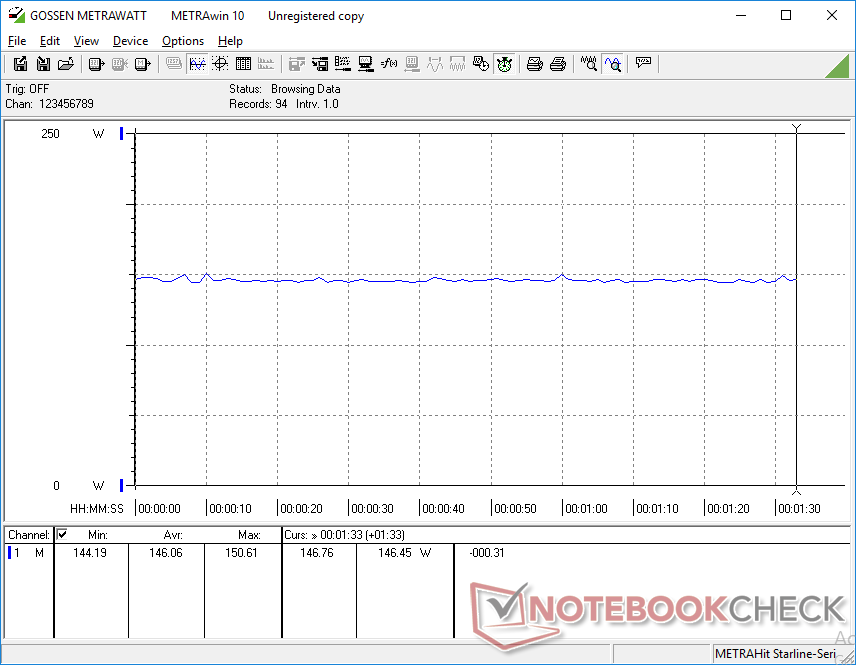
In caso di carichi più elevati, il consumo di energia trascina dietro il GS65 10SGS con il Core i9-10980HK anche se quest'ultimo utilizza la GPU GeForce RTX 2070 Super Max-Q più lenta della GeForce RTX 2070. Questo ha senso perché RTX 2070 Super Max-Q e RTX 2080 Super Max-Q condividono quasi lo stesso TDP, mentre l'octa-core Core i9 ha un cTDP fino a 65 W rispetto ai soli 35 W - 45 W del nostro Core i7 hexa-core. Lanciando The Witcher 3 si ha una media di 146 W quindi circa il 6% in meno rispetto al GS65 10SGS.
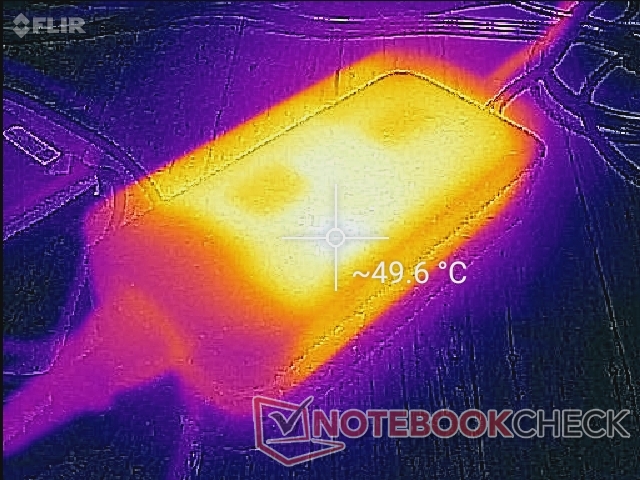
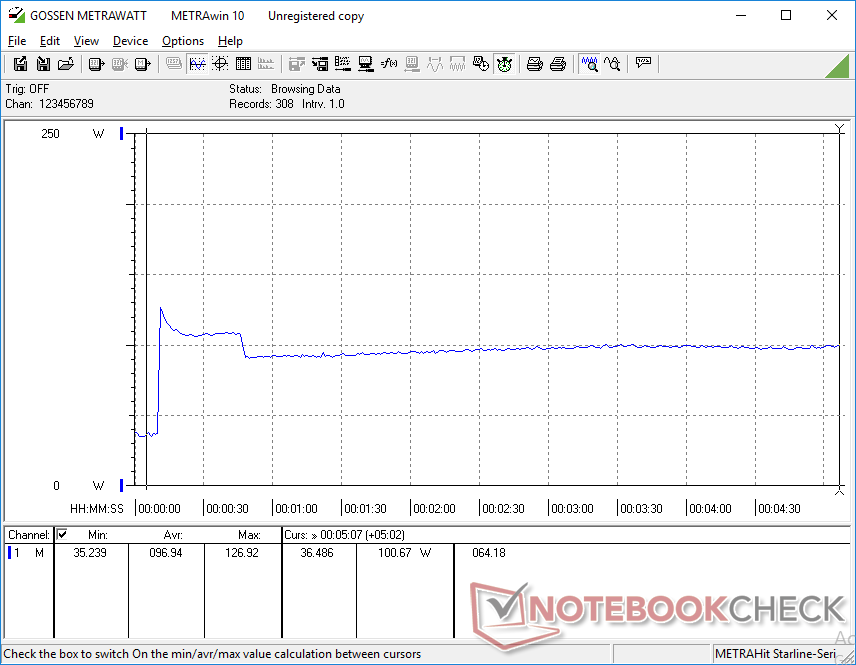
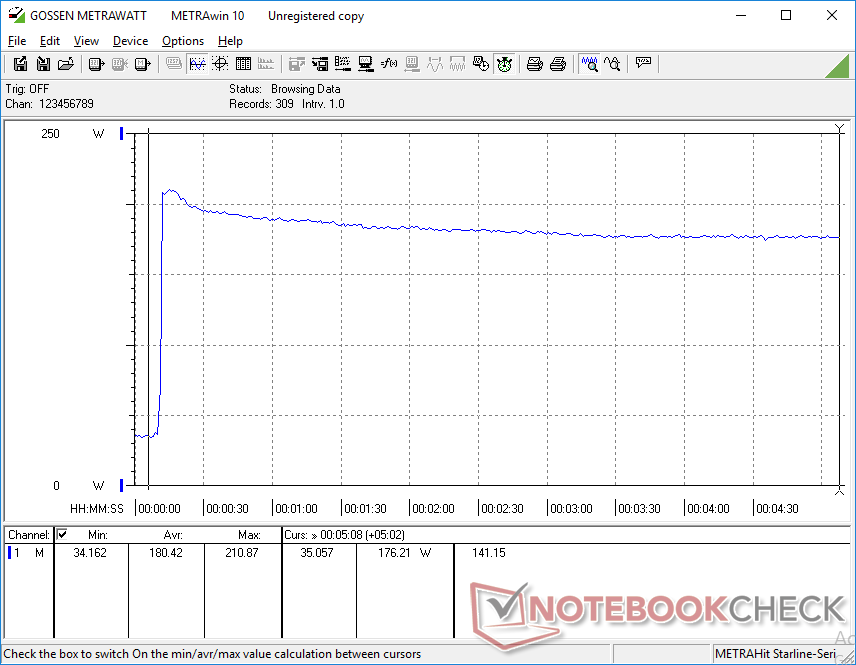
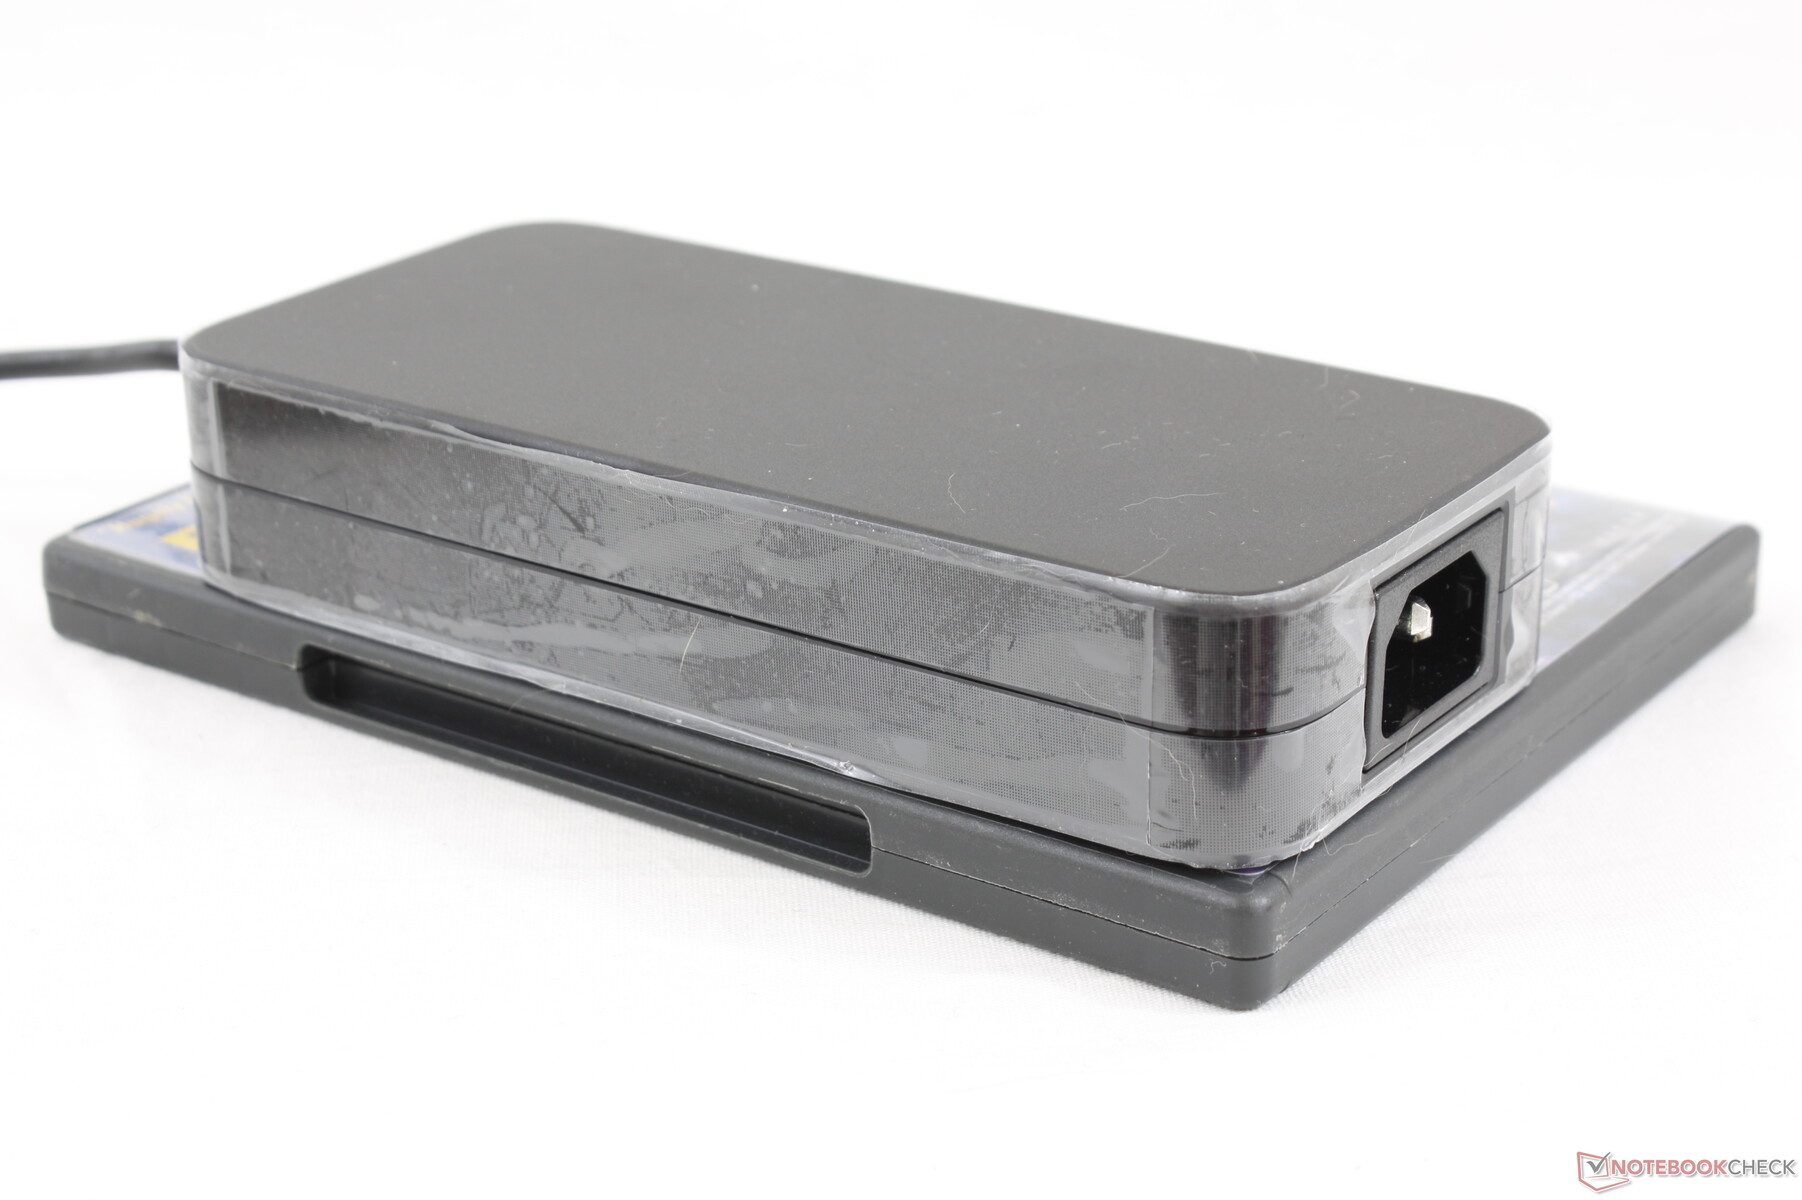
Siamo in grado di registrare un massimo di 210,9 W dall'adattatore relativamente grande (~16,5 x 7,5 x 3,3 cm) 230 W quando usiamo contemporaneamente Prime95 e FurMark. Questo picco è solo temporaneo come mostrato dai grafici qui sotto.
| Off / Standby | |
| Idle | |
| Sotto carico |
|
Leggenda:
min: | |
| MSI GS66 10SGS i7-10750H, GeForce RTX 2080 Super Max-Q, Samsung SSD PM981 MZVLB512HAJQ, IPS, 1920x1080, 15.6" | MSI GS65 Stealth 9SG i7-9750H, GeForce RTX 2080 Max-Q, Samsung SSD PM981 MZVLB512HAJQ, IPS, 1920x1080, 15.6" | Asus Zephyrus S GX502GW i7-9750H, GeForce RTX 2070 Mobile, 2x Intel SSD 660p SSDPEKNW512G8 (RAID 0), IPS, 1920x1080, 15.6" | Razer Blade 15 RTX 2080 Max-Q i7-9750H, GeForce RTX 2080 Max-Q, Samsung SSD PM981 MZVLB512HAJQ, IPS, 1920x1080, 15.6" | HP Omen X 2S 15-dg0075cl i7-9750H, GeForce RTX 2070 Max-Q, WDC PC SN720 SDAPNTW-1T00, IPS, 1920x1080, 15.6" | Lenovo Legion Y740-15ICHg i7-9750H, GeForce RTX 2070 Max-Q, WDC PC SN520 SDAPMUW-128G, IPS, 1920x1080, 15.6" | MSI GS66 Stealth 10SFS i9-10980HK, GeForce RTX 2070 Super Max-Q, Samsung SSD PM981 MZVLB1T0HALR, IPS, 1920x1080, 15.6" | |
|---|---|---|---|---|---|---|---|
| Power Consumption | -8% | -31% | 9% | -97% | -15% | -1% | |
| Idle Minimum * (Watt) | 14.9 | 18.3 -23% | 24 -61% | 12.5 16% | 46 -209% | 22.2 -49% | 13 13% |
| Idle Average * (Watt) | 17.5 | 22 -26% | 27 -54% | 15.3 13% | 59 -237% | 24.9 -42% | 16 9% |
| Idle Maximum * (Watt) | 29.5 | 28.8 2% | 33 -12% | 20.7 30% | 65.5 -122% | 30.6 -4% | 27 8% |
| Load Average * (Watt) | 94.8 | 93 2% | 129 -36% | 90.2 5% | 99.8 -5% | 101 -7% | 109 -15% |
| Witcher 3 ultra * (Watt) | 146.1 | 142.6 2% | 176 -20% | 162 -11% | 154.1 -5% | 143 2% | 155 -6% |
| Load Maximum * (Watt) | 210.9 | 215.9 -2% | 216 -2% | 209.3 1% | 222.7 -6% | 186 12% | 236 -12% |
* ... Meglio usare valori piccoli
Autonomia della batteria
Una delle principali differenze tra il GS65 e il più recente GS66 è l'aumento della capacità della batteria da 82 Wh a 99 Wh. Non esiste un laptop consumer con un pacco batterie integrato più grande di 99 Wh, poiché la FAA non consente batterie superiori a 100 Wh a bordo di aerei commerciali. Il risultato è una lunga durata della batteria soprattutto per un portatile da gioco con grafica RTX 2080 a quasi 7 ore di utilizzo della WLAN nel mondo reale. Assicuratevi di impostare il sistema in modalità Power Saver o Balanced per ridurre il consumo di energia come detto sopra.
Uno svantaggio della grande capacità della batteria è la velocità di ricarica più lenta. Aspettatevi un'attesa di circa 2,5 - 3 ore per una carica completa rispetto a 1,5 - 2 ore sulla maggior parte degli altri portatili. Il sistema non può essere ricaricato tramite USB Type-C, a differenza dell'Asus Zephyrus M.
| MSI GS66 10SGS i7-10750H, GeForce RTX 2080 Super Max-Q, 99.99 Wh | MSI GS65 Stealth 9SG i7-9750H, GeForce RTX 2080 Max-Q, 82 Wh | Asus Zephyrus S GX502GW i7-9750H, GeForce RTX 2070 Mobile, 76 Wh | Razer Blade 15 RTX 2080 Max-Q i7-9750H, GeForce RTX 2080 Max-Q, 80 Wh | Lenovo Legion Y740-15ICHg i7-9750H, GeForce RTX 2070 Max-Q, 57 Wh | MSI GS66 Stealth 10SFS i9-10980HK, GeForce RTX 2070 Super Max-Q, 99.99 Wh | |
|---|---|---|---|---|---|---|
| Autonomia della batteria | -13% | -42% | 19% | -57% | -8% | |
| Reader / Idle (h) | 10.2 | 5.9 -42% | 15.9 56% | 8.4 -18% | ||
| WiFi v1.3 (h) | 6.9 | 6 -13% | 3.7 -46% | 6.6 -4% | 3 -57% | 6.1 -12% |
| Load (h) | 1.6 | 1 -37% | 1.7 6% | 1.7 6% |
Pro
Contro
Giudizio Complessivo

L'MSI GS66 è disponibile in diverse SKU con due opzioni CPU (Core i7-10750H, Core i9-10980HK) e tre opzioni GPU (GeForce RTX 2060, RTX 2070 Super Max-Q, RTX 2080 Super Max-Q). Le due SKU che abbiamo testato finora sono la GS66 10SGS (Core i7-10750H, RTX 2080 Super Max-Q) e la GS66 10SFS (Core i9-10980HK, RTX 2070 Super Max-Q). Se dovessimo scegliere tra la CPU più veloce con la GPU più lenta o la CPU più lenta con la GPU più veloce per scopi di gioco, sarebbe sicuramente quest'ultima, dato che i giochi saranno ancora leggermente più veloci in generale con questa configurazione.
Se si intende utilizzare il GS66 per compiti pesanti di CPU al di fuori del gaming, allora la SKU dell'otta-core Core i9 potrebbe avere più senso grazie al suo vantaggio in termini di prestazioni multi-thread dal 25 al 35% più veloce rispetto all'hexa-core Core i7. Altrimenti, qualsiasi differenza risulterebbe troppo limitata nei giochi in cui l'opzione GPU più veloce ha spesso la precedenza. Gli utenti che vogliono il meglio di entrambi i mondi possono sempre scegliere la configurazione ultra high-end GS66 10SGS-031.
Un nuovo telaio impressionante con aggiornamenti gaming non altrettanto impressionanti. La GeForce RTX 2080 Super Max-Q della GS66 offre prestazioni grafiche dal 5 al 10% più veloci rispetto al vecchio MSI GS65 con la GeForce RTX 2080 Max-Q. Le ragioni migliori per l'acquisto del GS66 rispetto al GS65 sono quindi il design del telaio più robusto e la possibilità di upgrade, piuttosto che i minori guadagni in termini di prestazioni durante il gioco.
MSI GS66 10SGS
- 05/17/2020 v7 (old)
Allen Ngo
Price comparison
