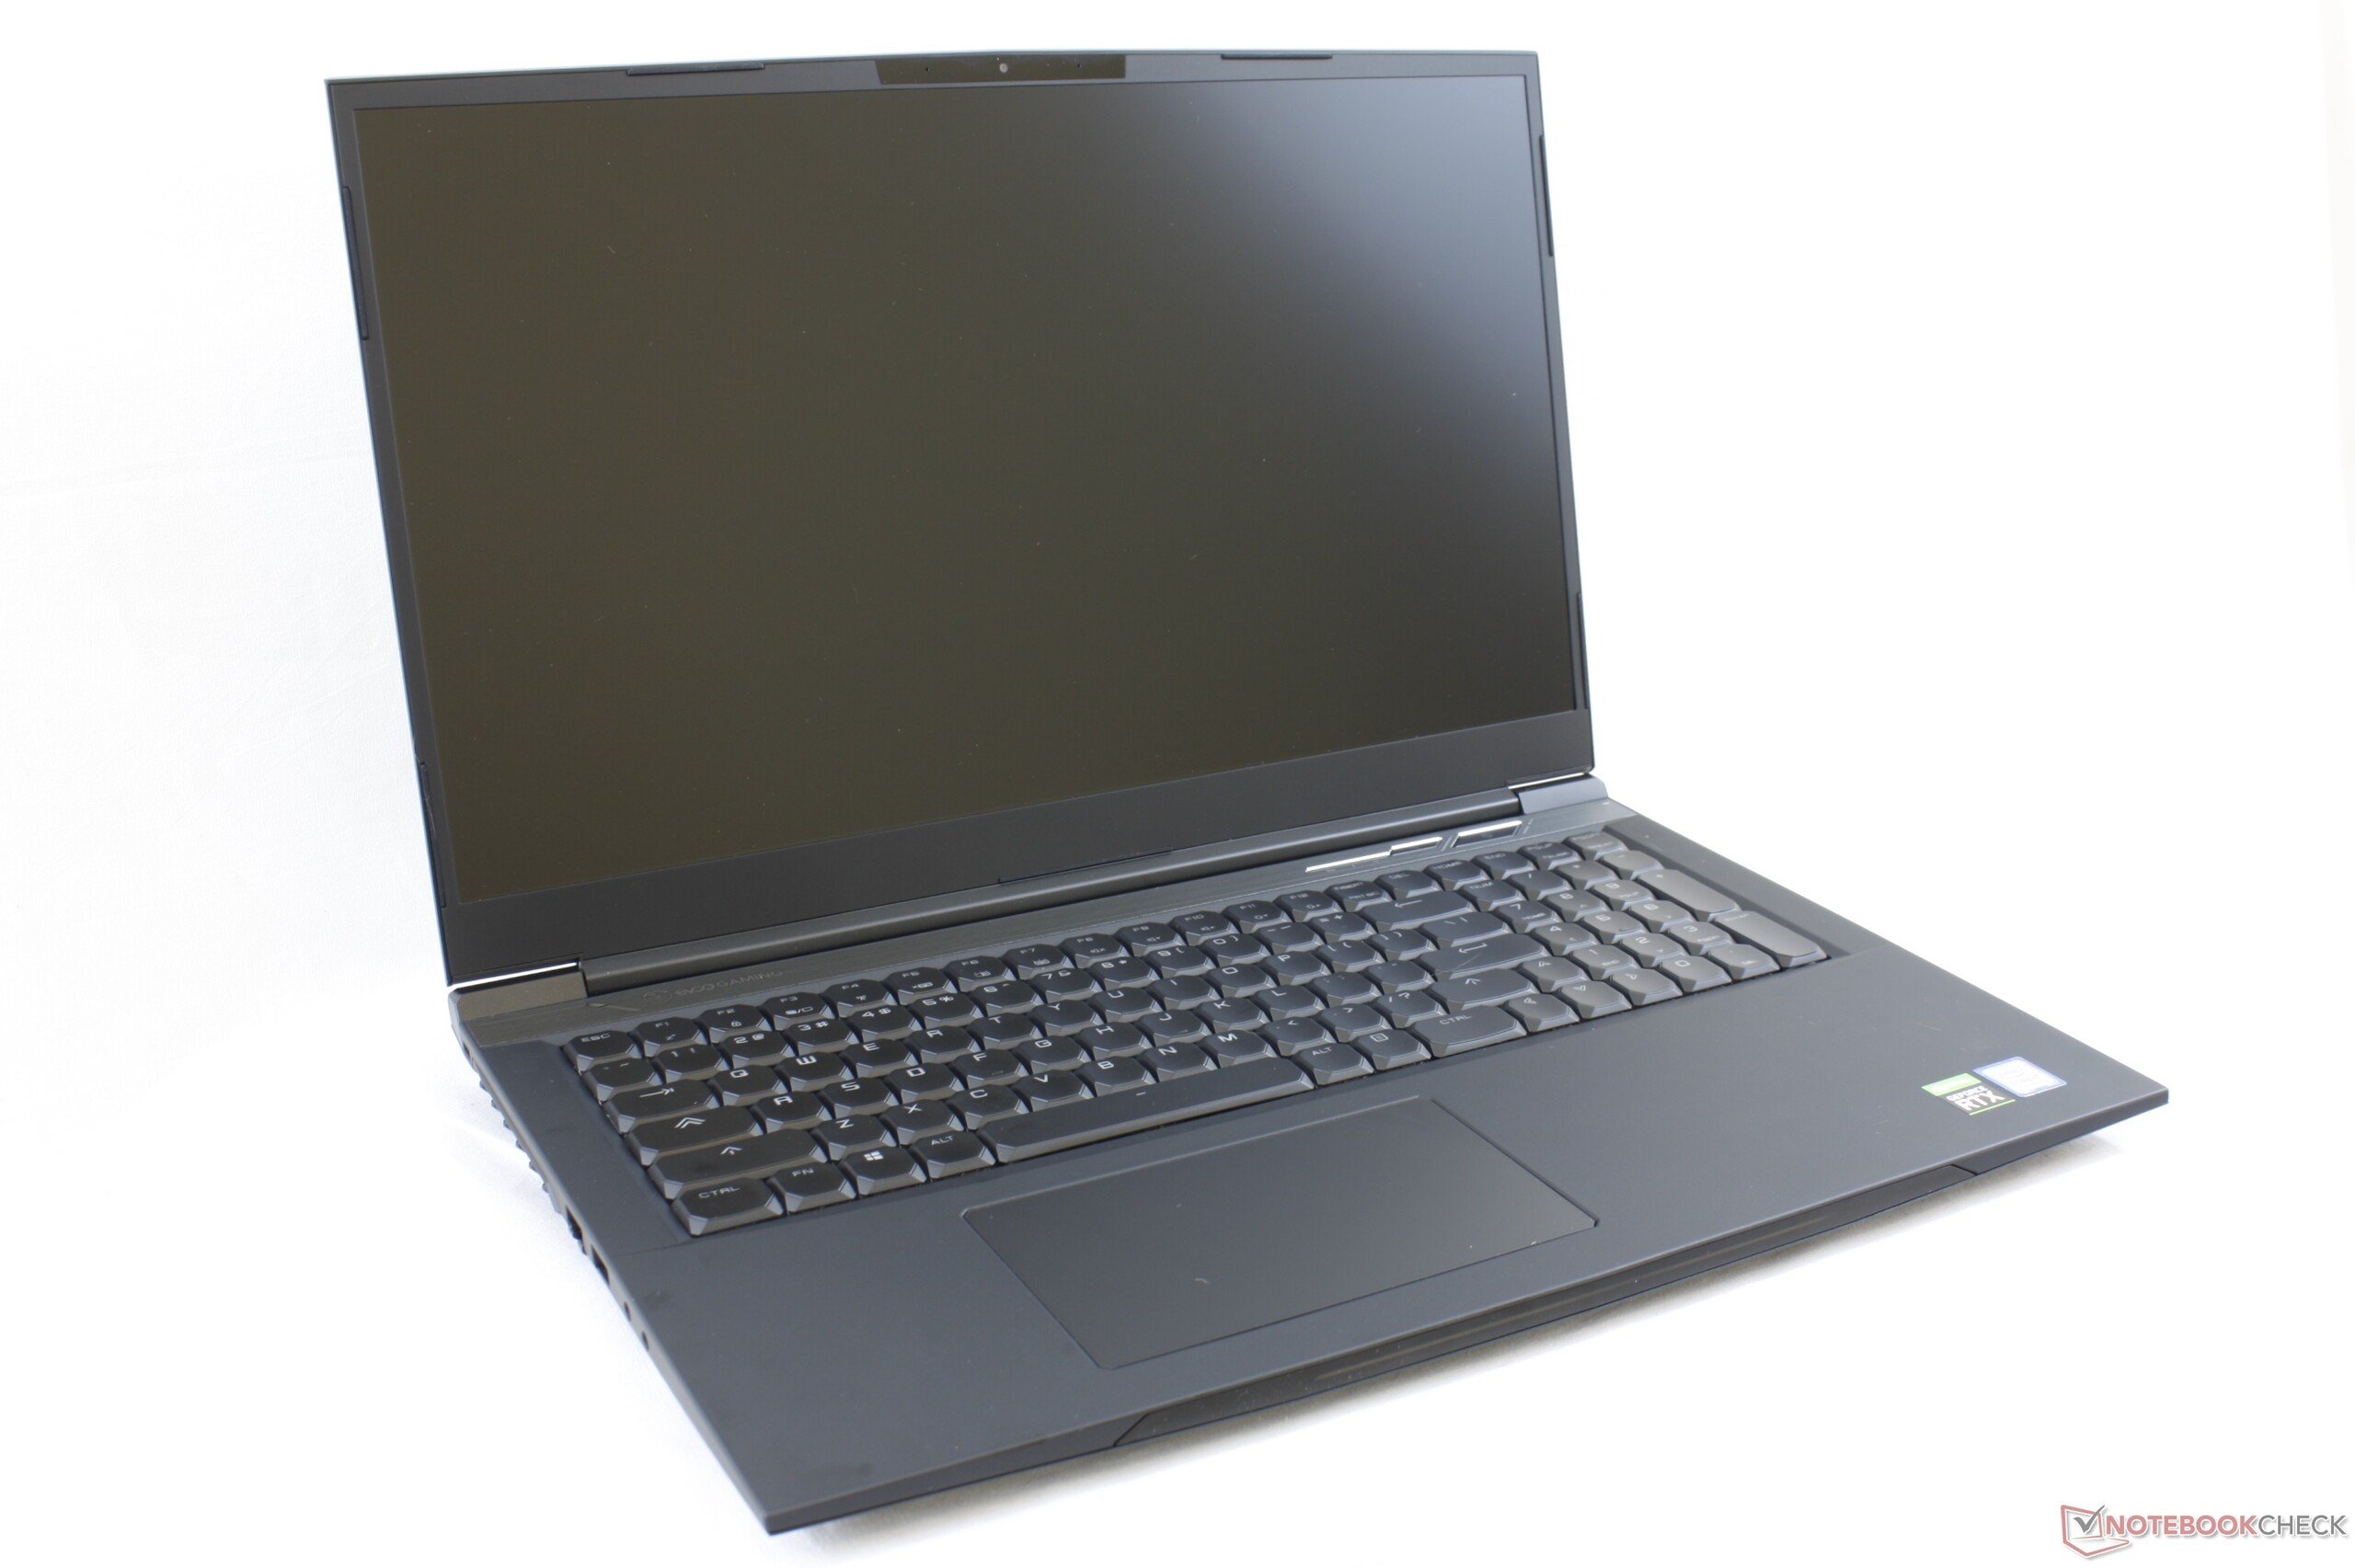
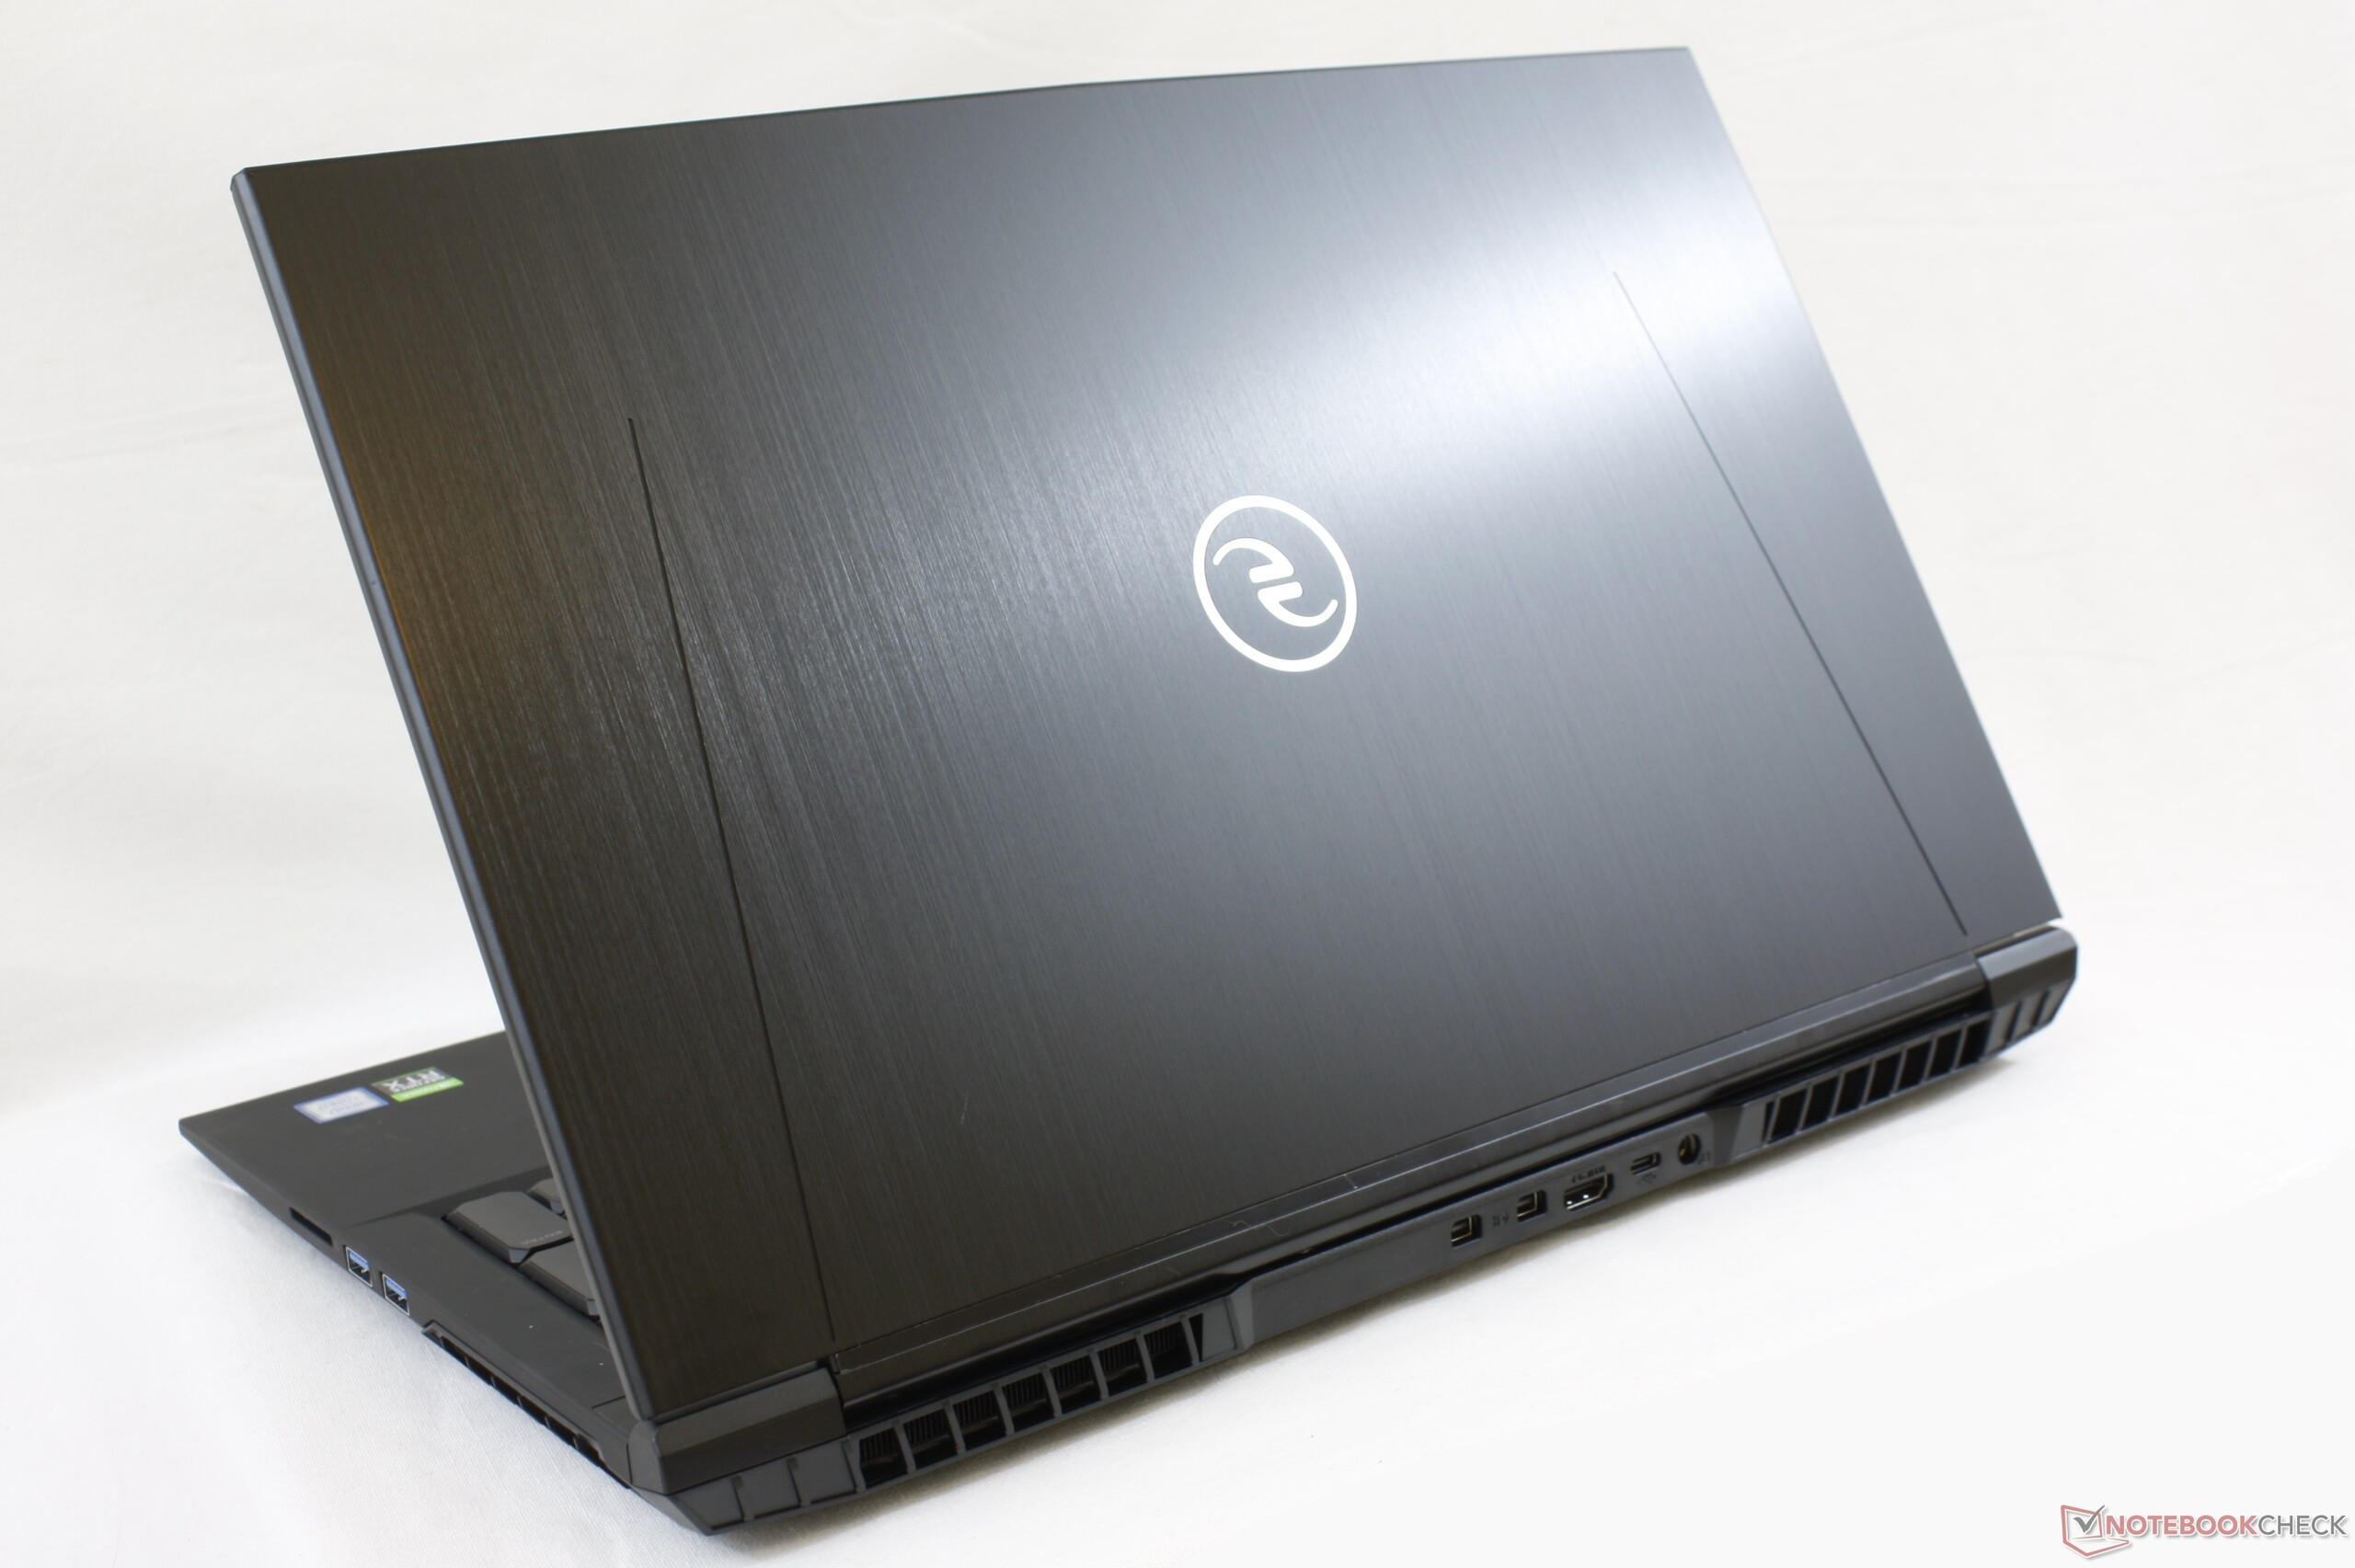
Recensione del Laptop Walmart EVOO Gaming 17: Un portatile cinese con il marchio Walmart
Punteggio | Data | Modello | Peso | Altezza | Dimensione | Risoluzione | Prezzo |
|---|---|---|---|---|---|---|---|
| 84.5 % v7 (old) | 12/2019 | Walmart EVOO Gaming 17 i7-9750H, GeForce RTX 2060 Mobile | 2.5 kg | 27.5 mm | 17.30" | 1920x1080 | |
| 83.3 % v7 (old) | 03/2019 | Schenker XMG Neo 17 i7-8750H, GeForce RTX 2070 Mobile | 2.5 kg | 27.5 mm | 17.30" | 1920x1080 | |
| 87.4 % v6 (old) | 04/2019 | Alienware m17 P37E i9-8950HK, GeForce RTX 2080 Max-Q | 2.6 kg | 23 mm | 17.30" | 3840x2160 | |
| 83.2 % v7 (old) | 10/2019 | Lenovo Legion Y740-17IRH i7-9750H, GeForce RTX 2060 Mobile | 3 kg | 23 mm | 17.30" | 1920x1080 | |
| 89.4 % v6 (old) | 08/2019 | Razer Blade Pro 17 RTX 2060 i7-9750H, GeForce RTX 2060 Mobile | 2.8 kg | 19.9 mm | 17.30" | 1920x1080 |
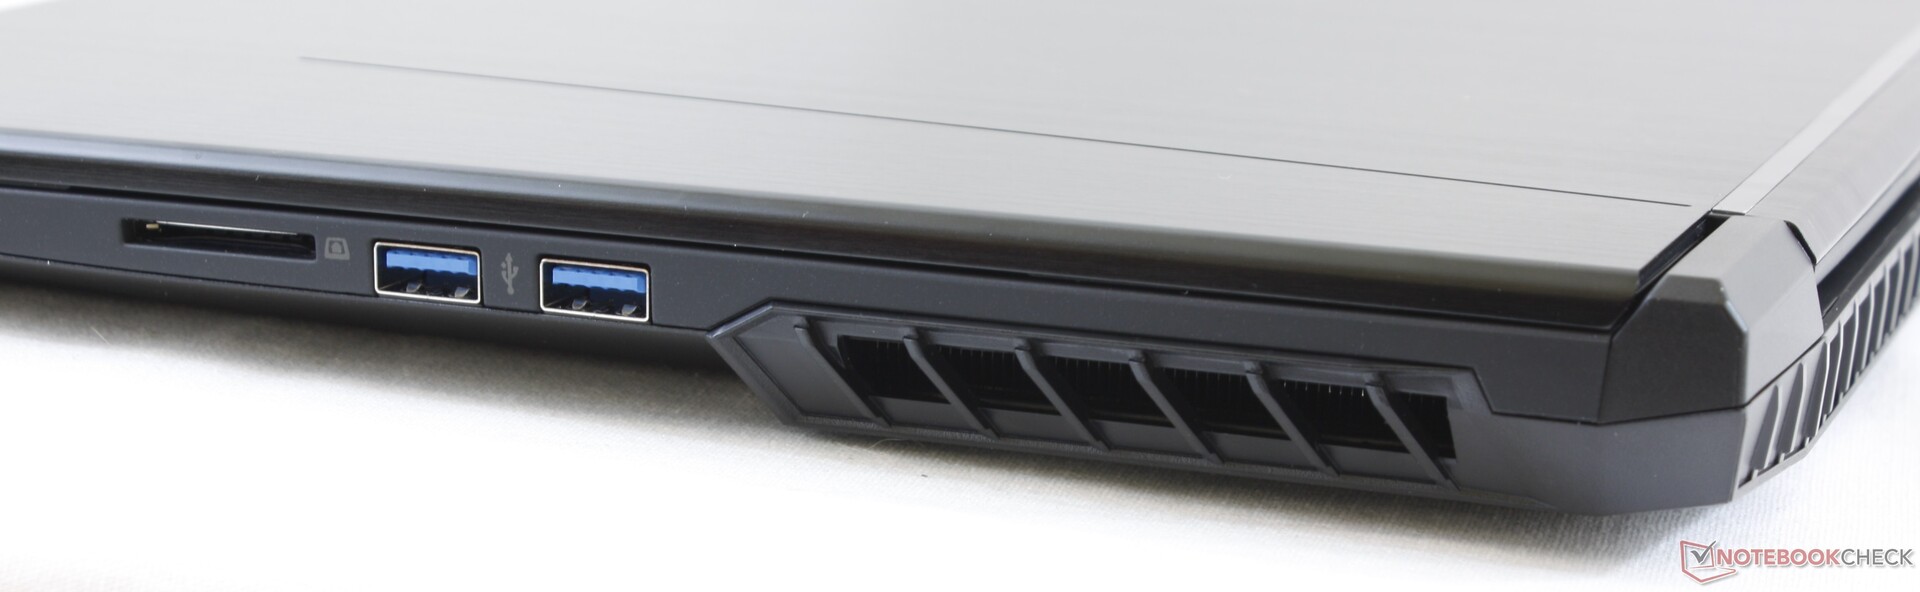
| SD Card Reader | |
| average JPG Copy Test (av. of 3 runs) | |
| Dell XPS 15 7590 9980HK GTX 1650 (Toshiba Exceria Pro SDXC 64 GB UHS-II) | |
| Samsung Notebook 9 NP930QAA (Toshiba Exceria Pro M501 microSDXC 64GB) | |
| Schenker XMG Neo 17 (Toshiba Exceria Pro SDXC 64 GB UHS-II) | |
| Walmart EVOO Gaming 17 (Toshiba Exceria Pro SDXC 64 GB UHS-II) | |
| MSI GL62M 7RD-077 (Toshiba Exceria Pro SDXC 64 GB UHS-II) | |
| maximum AS SSD Seq Read Test (1GB) | |
| Dell XPS 15 7590 9980HK GTX 1650 (Toshiba Exceria Pro SDXC 64 GB UHS-II) | |
| Samsung Notebook 9 NP930QAA (Toshiba Exceria Pro M501 microSDXC 64GB) | |
| Schenker XMG Neo 17 (Toshiba Exceria Pro SDXC 64 GB UHS-II) | |
| Walmart EVOO Gaming 17 (Toshiba Exceria Pro SDXC 64 GB UHS-II) | |
| MSI GL62M 7RD-077 (Toshiba Exceria Pro SDXC 64 GB UHS-II) | |
| Networking | |
| iperf3 transmit AX12 | |
| Lenovo Legion Y740-17IRH | |
| Schenker XMG Neo 17 | |
| Alienware m17 P37E | |
| Razer Blade Pro 17 RTX 2060 | |
| iperf3 receive AX12 | |
| Razer Blade Pro 17 RTX 2060 | |
| Lenovo Legion Y740-17IRH | |
| Alienware m17 P37E | |
| Schenker XMG Neo 17 | |
| |||||||||||||||||||||||||
Distribuzione della luminosità: 92 %
Al centro con la batteria: 314.2 cd/m²
Contrasto: 1208:1 (Nero: 0.26 cd/m²)
ΔE ColorChecker Calman: 3.15 | ∀{0.5-29.43 Ø4.72}
calibrated: 2.74
ΔE Greyscale Calman: 2.6 | ∀{0.09-98 Ø4.97}
91.8% sRGB (Argyll 1.6.3 3D)
59.6% AdobeRGB 1998 (Argyll 1.6.3 3D)
66.7% AdobeRGB 1998 (Argyll 3D)
92.2% sRGB (Argyll 3D)
65.5% Display P3 (Argyll 3D)
Gamma: 2.31
CCT: 6928 K
| Walmart EVOO Gaming 17 BOE HF N173FHM-N44, IPS, 17.3", 1920x1080 | Schenker XMG Neo 17 BOEhydis NV173FHM-N44 (BOE07B6), IPS, 17.3", 1920x1080 | Alienware m17 P37E AU Optronics B173ZAN01.0, IPS, 17.3", 3840x2160 | Lenovo Legion Y740-17IRH LG Philips LP173WFG-SPD2 (LGD05E0), IPS, 17.3", 1920x1080 | Razer Blade Pro 17 RTX 2060 AU Optronics B173HAN04.0, IPS, 17.3", 1920x1080 | MSI GS75 Stealth 9SG Chi Mei N173HCE-G33 (CMN175C), IPS, 17.3", 1920x1080 | |
|---|---|---|---|---|---|---|
| Display | 0% | 30% | 1% | -5% | -2% | |
| Display P3 Coverage (%) | 65.5 | 65.2 0% | 86.4 32% | 64.8 -1% | 61.1 -7% | 62.6 -4% |
| sRGB Coverage (%) | 92.2 | 92.2 0% | 99.9 8% | 96 4% | 89.4 -3% | 93.5 1% |
| AdobeRGB 1998 Coverage (%) | 66.7 | 66.5 0% | 99.1 49% | 65.8 -1% | 62.5 -6% | 64.7 -3% |
| Response Times | -1% | -111% | 15% | 46% | 41% | |
| Response Time Grey 50% / Grey 80% * (ms) | 17.6 ? | 18.8 ? -7% | 35.6 ? -102% | 14.8 ? 16% | 6.8 ? 61% | 7.2 ? 59% |
| Response Time Black / White * (ms) | 12.8 ? | 12 ? 6% | 28 ? -119% | 11.2 ? 13% | 8.8 ? 31% | 10 ? 22% |
| PWM Frequency (Hz) | 980 ? | 971 ? | 25510 ? | |||
| Screen | 3% | -32% | -8% | 3% | 19% | |
| Brightness middle (cd/m²) | 314.2 | 304 -3% | 357.9 14% | 282 -10% | 300.4 -4% | 366 16% |
| Brightness (cd/m²) | 307 | 289 -6% | 347 13% | 261 -15% | 289 -6% | 343 12% |
| Brightness Distribution (%) | 92 | 90 -2% | 94 2% | 87 -5% | 93 1% | 91 -1% |
| Black Level * (cd/m²) | 0.26 | 0.26 -0% | 0.33 -27% | 0.27 -4% | 0.32 -23% | 0.29 -12% |
| Contrast (:1) | 1208 | 1169 -3% | 1085 -10% | 1044 -14% | 939 -22% | 1262 4% |
| Colorchecker dE 2000 * | 3.15 | 2.65 16% | 6.57 -109% | 3.18 -1% | 2.32 26% | 1.51 52% |
| Colorchecker dE 2000 max. * | 5.4 | 6.11 -13% | 9.86 -83% | 8.39 -55% | 3.81 29% | 3.22 40% |
| Colorchecker dE 2000 calibrated * | 2.74 | 1.5 45% | 6.74 -146% | 0.95 65% | 2.95 -8% | 0.71 74% |
| Greyscale dE 2000 * | 2.6 | 2.75 -6% | 4.3 -65% | 4.1 -58% | 1.5 42% | 1.93 26% |
| Gamma | 2.31 95% | 2.46 89% | 2.6 85% | 2.55 86% | 2.3 96% | 2.38 92% |
| CCT | 6928 94% | 6763 96% | 6403 102% | 7260 90% | 6764 96% | 6881 94% |
| Color Space (Percent of AdobeRGB 1998) (%) | 59.6 | 60 1% | 88.4 48% | 61 2% | 57.4 -4% | 60 1% |
| Color Space (Percent of sRGB) (%) | 91.8 | 92 0% | 100 9% | 96 5% | 89 -3% | 94 2% |
| Media totale (Programma / Settaggio) | 1% /
2% | -38% /
-30% | 3% /
-4% | 15% /
7% | 19% /
18% |
* ... Meglio usare valori piccoli
Tempi di risposta del Display
| ↔ Tempi di risposta dal Nero al Bianco | ||
|---|---|---|
| 12.8 ms ... aumenta ↗ e diminuisce ↘ combinato | ↗ 7.6 ms Incremento | 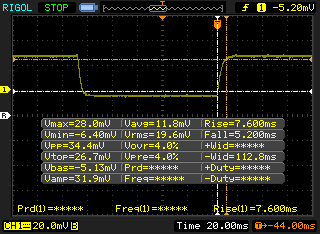 |
| ↘ 5.2 ms Calo | ||
| Lo schermo mostra buoni tempi di risposta durante i nostri tests, ma potrebbe essere troppo lento per i gamers competitivi. In confronto, tutti i dispositivi di test variano da 0.1 (minimo) a 240 (massimo) ms. » 33 % di tutti i dispositivi è migliore. Questo significa che i tempi di risposta rilevati sono migliori rispettto alla media di tutti i dispositivi testati (19.8 ms). | ||
| ↔ Tempo di risposta dal 50% Grigio all'80% Grigio | ||
| 17.6 ms ... aumenta ↗ e diminuisce ↘ combinato | ↗ 8.4 ms Incremento | 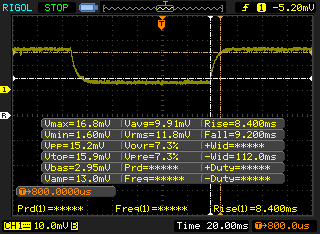 |
| ↘ 9.2 ms Calo | ||
| Lo schermo mostra buoni tempi di risposta durante i nostri tests, ma potrebbe essere troppo lento per i gamers competitivi. In confronto, tutti i dispositivi di test variano da 0.165 (minimo) a 636 (massimo) ms. » 32 % di tutti i dispositivi è migliore. Questo significa che i tempi di risposta rilevati sono migliori rispettto alla media di tutti i dispositivi testati (31 ms). | ||
Sfarfallio dello schermo / PWM (Pulse-Width Modulation)
| flickering dello schermo / PWM rilevato | 980 Hz | ≤ 99 % settaggio luminosita' | 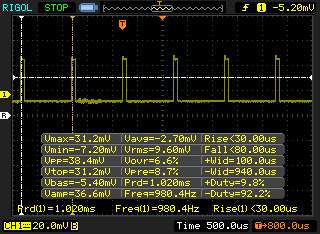 |
Il display sfarfalla a 980 Hz (Probabilmente a causa dell'uso di PWM) Flickering rilevato ad una luminosita' di 99 % o inferiore. Non dovrebbe verificarsi flickering o PWM sopra questo valore di luminosita'. La frequenza di 980 Hz è abbastanza alta, quindi la maggioranza degli utenti sensibili al PWM non dovrebbero notare alcun flickering. In confronto: 52 % di tutti i dispositivi testati non utilizza PWM per ridurre la luminosita' del display. Se è rilevato PWM, una media di 7763 (minimo: 5 - massimo: 343500) Hz è stata rilevata. | |||
| PCMark 8 Home Score Accelerated v2 | 4445 punti | |
| PCMark 8 Work Score Accelerated v2 | 5746 punti | |
| PCMark 10 Score | 5797 punti | |
Aiuto | ||
| Walmart EVOO Gaming 17 Intel SSD 660p 1TB SSDPEKNW010T8 | Schenker XMG Neo 17 Samsung SSD 970 EVO Plus 1TB | Alienware m17 P37E SK Hynix PC401 512GB M.2 (HFS512GD9TNG) | Lenovo Legion Y740-17IRH WDC PC SN520 SDAPMUW-128G | Razer Blade Pro 17 RTX 2060 Samsung SSD PM981 MZVLB512HAJQ | MSI GS75 Stealth 9SG 2x Samsung SSD PM981 MZVLB1T0HALR (RAID 0) | |
|---|---|---|---|---|---|---|
| AS SSD | 98% | -1% | -51% | 47% | 55% | |
| Seq Read (MB/s) | 1038 | 2359 127% | 1835 77% | 1339 29% | 1810 74% | 2855 175% |
| Seq Write (MB/s) | 1604 | 2469 54% | 1121 -30% | 688 -57% | 1797 12% | 2687 68% |
| 4K Read (MB/s) | 42.9 | 53.5 25% | 23.98 -44% | 23.23 -46% | 48.43 13% | 30.31 -29% |
| 4K Write (MB/s) | 107.4 | 117.6 9% | 100 -7% | 98.8 -8% | 106 -1% | 96.3 -10% |
| 4K-64 Read (MB/s) | 583 | 1579 171% | 687 18% | 300.9 -48% | 1156 98% | 1460 150% |
| 4K-64 Write (MB/s) | 725 | 2048 182% | 776 7% | 204.6 -72% | 1748 141% | 1224 69% |
| Access Time Read * (ms) | 0.045 | 0.048 -7% | 0.047 -4% | 0.184 -309% | 0.057 -27% | 0.054 -20% |
| Access Time Write * (ms) | 0.127 | 0.03 76% | 0.053 58% | 0.037 71% | 0.035 72% | 0.038 70% |
| Score Read (Points) | 730 | 1869 156% | 895 23% | 458 -37% | 1385 90% | 1776 143% |
| Score Write (Points) | 992 | 2413 143% | 988 0% | 372 -62% | 2033 105% | 1589 60% |
| Score Total (Points) | 2137 | 5248 146% | 2306 8% | 1038 -51% | 4135 93% | 4259 99% |
| Copy ISO MB/s (MB/s) | 1612 | 773 -52% | 988 -39% | 1984 23% | 2226 38% | |
| Copy Program MB/s (MB/s) | 564 | 493 -13% | 327.2 -42% | 588 4% | 426.4 -24% | |
| Copy Game MB/s (MB/s) | 1328 | 647 -51% | 758 -43% | 835 -37% | 1152 -13% |
* ... Meglio usare valori piccoli

| 3DMark 11 Performance | 19567 punti | |
| 3DMark Cloud Gate Standard Score | 38260 punti | |
| 3DMark Fire Strike Score | 16083 punti | |
| 3DMark Time Spy Score | 6911 punti | |
Aiuto | ||
| basso | medio | alto | ultra | |
|---|---|---|---|---|
| BioShock Infinite (2013) | 322.5 | 285 | 265 | 156 |
| The Witcher 3 (2015) | 295.3 | 215.4 | 131 | 68.9 |
| Shadow of the Tomb Raider (2018) | 133 | 100 | 94 | 83 |
| Walmart EVOO Gaming 17 GeForce RTX 2060 Mobile, i7-9750H, Intel SSD 660p 1TB SSDPEKNW010T8 | Schenker XMG Neo 17 XNE17M19 GeForce RTX 2060 Mobile, i7-9750H, Samsung SSD 970 EVO Plus 500GB | Alienware m17 P37E GeForce RTX 2080 Max-Q, i9-8950HK, SK Hynix PC401 512GB M.2 (HFS512GD9TNG) | Lenovo Legion Y740-17IRH GeForce RTX 2060 Mobile, i7-9750H, WDC PC SN520 SDAPMUW-128G | Razer Blade Pro 17 RTX 2060 GeForce RTX 2060 Mobile, i7-9750H, Samsung SSD PM981 MZVLB512HAJQ | MSI GS75 Stealth 9SG GeForce RTX 2080 Max-Q, i7-9750H, 2x Samsung SSD PM981 MZVLB1T0HALR (RAID 0) | |
|---|---|---|---|---|---|---|
| Noise | -11% | -10% | -15% | -5% | -15% | |
| off /ambiente * (dB) | 28.7 | 31 -8% | 28.2 2% | 30 -5% | 28.2 2% | 30 -5% |
| Idle Minimum * (dB) | 28.7 | 31 -8% | 28.2 2% | 33 -15% | 28.2 2% | 31 -8% |
| Idle Average * (dB) | 28.7 | 33 -15% | 28.2 2% | 34 -18% | 28.2 2% | 32 -11% |
| Idle Maximum * (dB) | 29.5 | 35 -19% | 31 -5% | 35 -19% | 28.2 4% | 38 -29% |
| Load Average * (dB) | 31.4 | 43 -37% | 50.8 -62% | 48 -53% | 43 -37% | 47 -50% |
| Witcher 3 ultra * (dB) | 44.5 | 45 -1% | 50.8 -14% | 46 -3% | 48.4 -9% | 48 -8% |
| Load Maximum * (dB) | 54 | 47 13% | 50.8 6% | 49 9% | 53.4 1% | 49 9% |
* ... Meglio usare valori piccoli
Rumorosità
| Idle |
| 28.7 / 28.7 / 29.5 dB(A) |
| Sotto carico |
| 31.4 / 54 dB(A) |
 | ||
30 dB silenzioso 40 dB(A) udibile 50 dB(A) rumoroso |
||
min: | ||
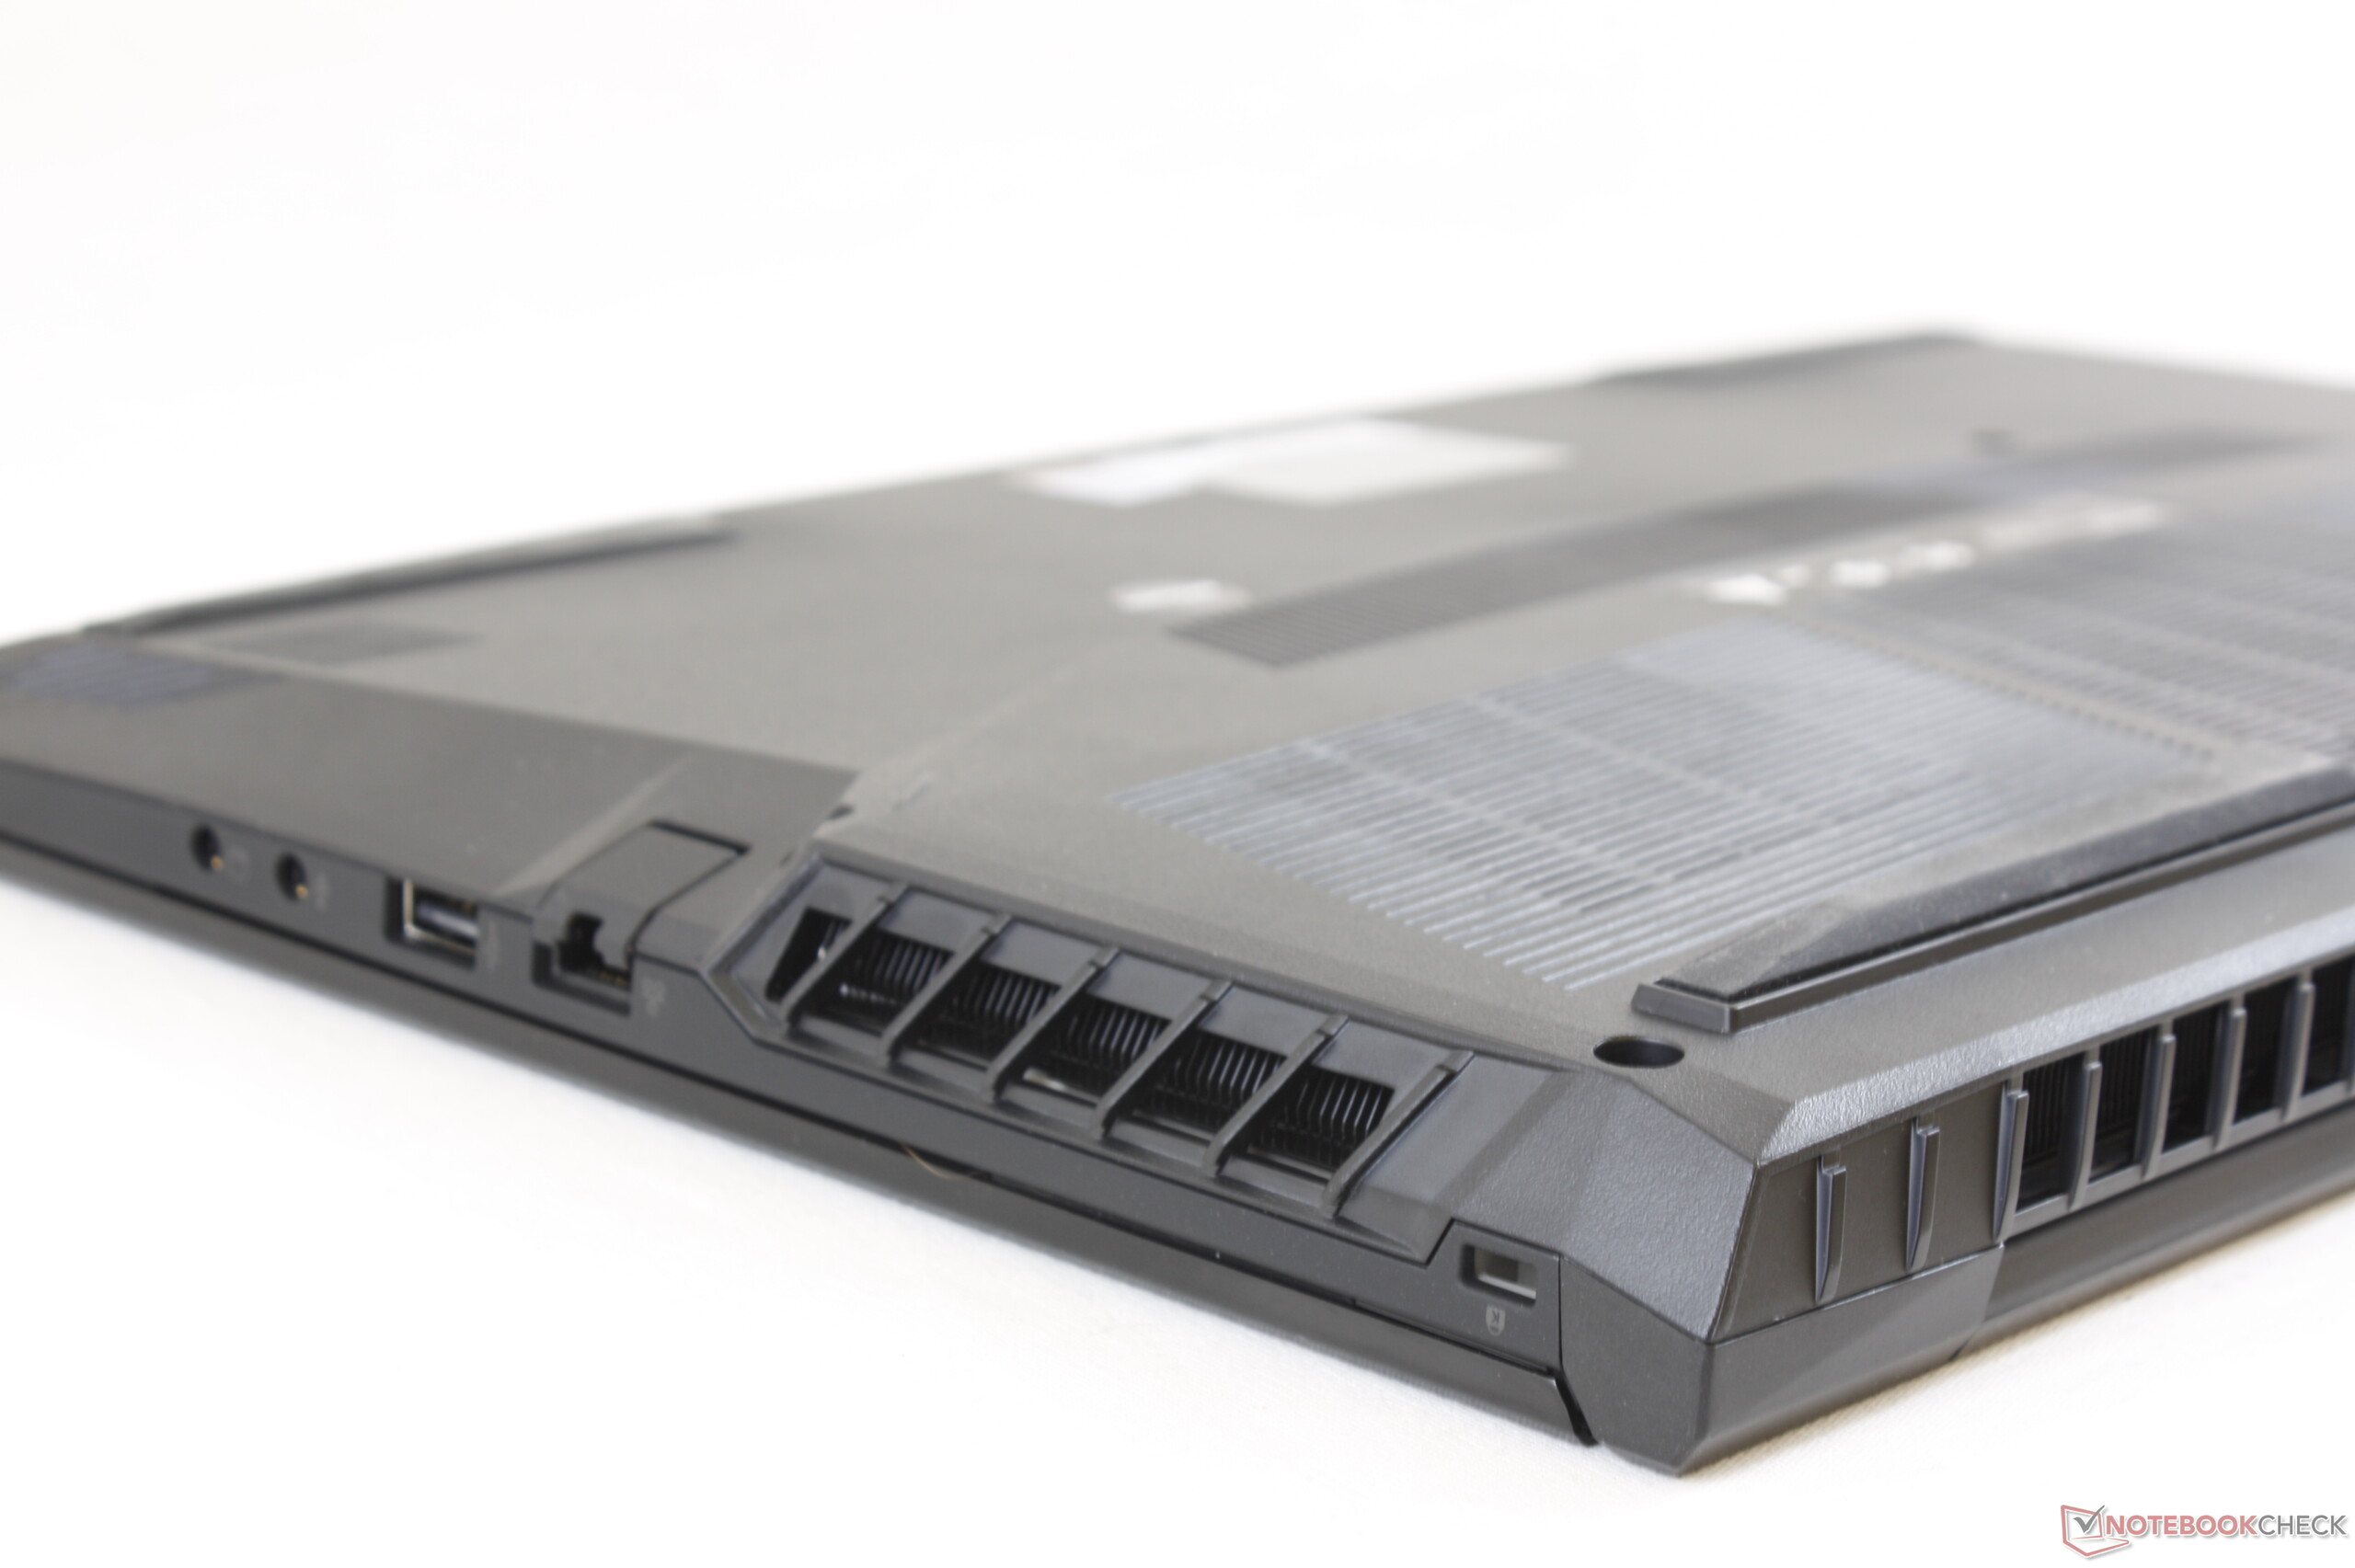
(±) La temperatura massima sul lato superiore è di 45 °C / 113 F, rispetto alla media di 40.4 °C / 105 F, che varia da 21.2 a 68.8 °C per questa classe Gaming.
(-) Il lato inferiore si riscalda fino ad un massimo di 56.8 °C / 134 F, rispetto alla media di 43.2 °C / 110 F
(+) In idle, la temperatura media del lato superiore è di 21.1 °C / 70 F, rispetto alla media deld ispositivo di 33.9 °C / 93 F.
(+) Riproducendo The Witcher 3, la temperatura media per il lato superiore e' di 30.4 °C / 87 F, rispetto alla media del dispositivo di 33.9 °C / 93 F.
(+) I poggiapolsi e il touchpad sono piu' freddi della temperatura della pelle con un massimo di 26.2 °C / 79.2 F e sono quindi freddi al tatto.
(+) La temperatura media della zona del palmo della mano di dispositivi simili e'stata di 28.8 °C / 83.8 F (+2.6 °C / 4.6 F).
| Off / Standby | |
| Idle | |
| Sotto carico |
|
Leggenda:
min: | |
| Walmart EVOO Gaming 17 i7-9750H, GeForce RTX 2060 Mobile, Intel SSD 660p 1TB SSDPEKNW010T8, IPS, 1920x1080, 17.3" | Schenker XMG Neo 17 XNE17M19 i7-9750H, GeForce RTX 2060 Mobile, Samsung SSD 970 EVO Plus 500GB, IPS, 1920x1080, 17.3" | Alienware m17 P37E i9-8950HK, GeForce RTX 2080 Max-Q, SK Hynix PC401 512GB M.2 (HFS512GD9TNG), IPS, 3840x2160, 17.3" | Lenovo Legion Y740-17IRH i7-9750H, GeForce RTX 2060 Mobile, WDC PC SN520 SDAPMUW-128G, IPS, 1920x1080, 17.3" | Razer Blade Pro 17 RTX 2060 i7-9750H, GeForce RTX 2060 Mobile, Samsung SSD PM981 MZVLB512HAJQ, IPS, 1920x1080, 17.3" | MSI GS75 Stealth 9SG i7-9750H, GeForce RTX 2080 Max-Q, 2x Samsung SSD PM981 MZVLB1T0HALR (RAID 0), IPS, 1920x1080, 17.3" | |
|---|---|---|---|---|---|---|
| Power Consumption | 15% | -35% | -7% | -9% | 2% | |
| Idle Minimum * (Watt) | 11.4 | 11 4% | 21.2 -86% | 20 -75% | 16 -40% | 13 -14% |
| Idle Average * (Watt) | 16.3 | 14 14% | 29.6 -82% | 21 -29% | 21.7 -33% | 17 -4% |
| Idle Maximum * (Watt) | 31.8 | 20 37% | 34 -7% | 26 18% | 26.1 18% | 25 21% |
| Load Average * (Watt) | 92.9 | 100 -8% | 130.9 -41% | 97 -4% | 105.6 -14% | 96 -3% |
| Witcher 3 ultra * (Watt) | 171.5 | 151 12% | 177.5 -3% | 139 19% | 161.8 6% | 156 9% |
| Load Maximum * (Watt) | 243.3 | 174 28% | 219.7 10% | 168 31% | 225.3 7% | 239 2% |
* ... Meglio usare valori piccoli
| Walmart EVOO Gaming 17 i7-9750H, GeForce RTX 2060 Mobile, 46 Wh | Schenker XMG Neo 17 i7-8750H, GeForce RTX 2070 Mobile, 46.74 Wh | Alienware m17 P37E i9-8950HK, GeForce RTX 2080 Max-Q, 90 Wh | Lenovo Legion Y740-17IRH i7-9750H, GeForce RTX 2060 Mobile, 76 Wh | Razer Blade Pro 17 RTX 2060 i7-9750H, GeForce RTX 2060 Mobile, 70 Wh | MSI GS75 Stealth 9SG i7-9750H, GeForce RTX 2080 Max-Q, 80.25 Wh | |
|---|---|---|---|---|---|---|
| Autonomia della batteria | -12% | 17% | 2% | 7% | 43% | |
| WiFi v1.3 (h) | 4.2 | 3.7 -12% | 4.9 17% | 4.3 2% | 4.5 7% | 6 43% |
| Reader / Idle (h) | 5.3 | 9.1 | 6.9 | 7.7 | ||
| Load (h) | 0.9 | 0.8 | 1.1 | 1.2 |
Pro
Contro
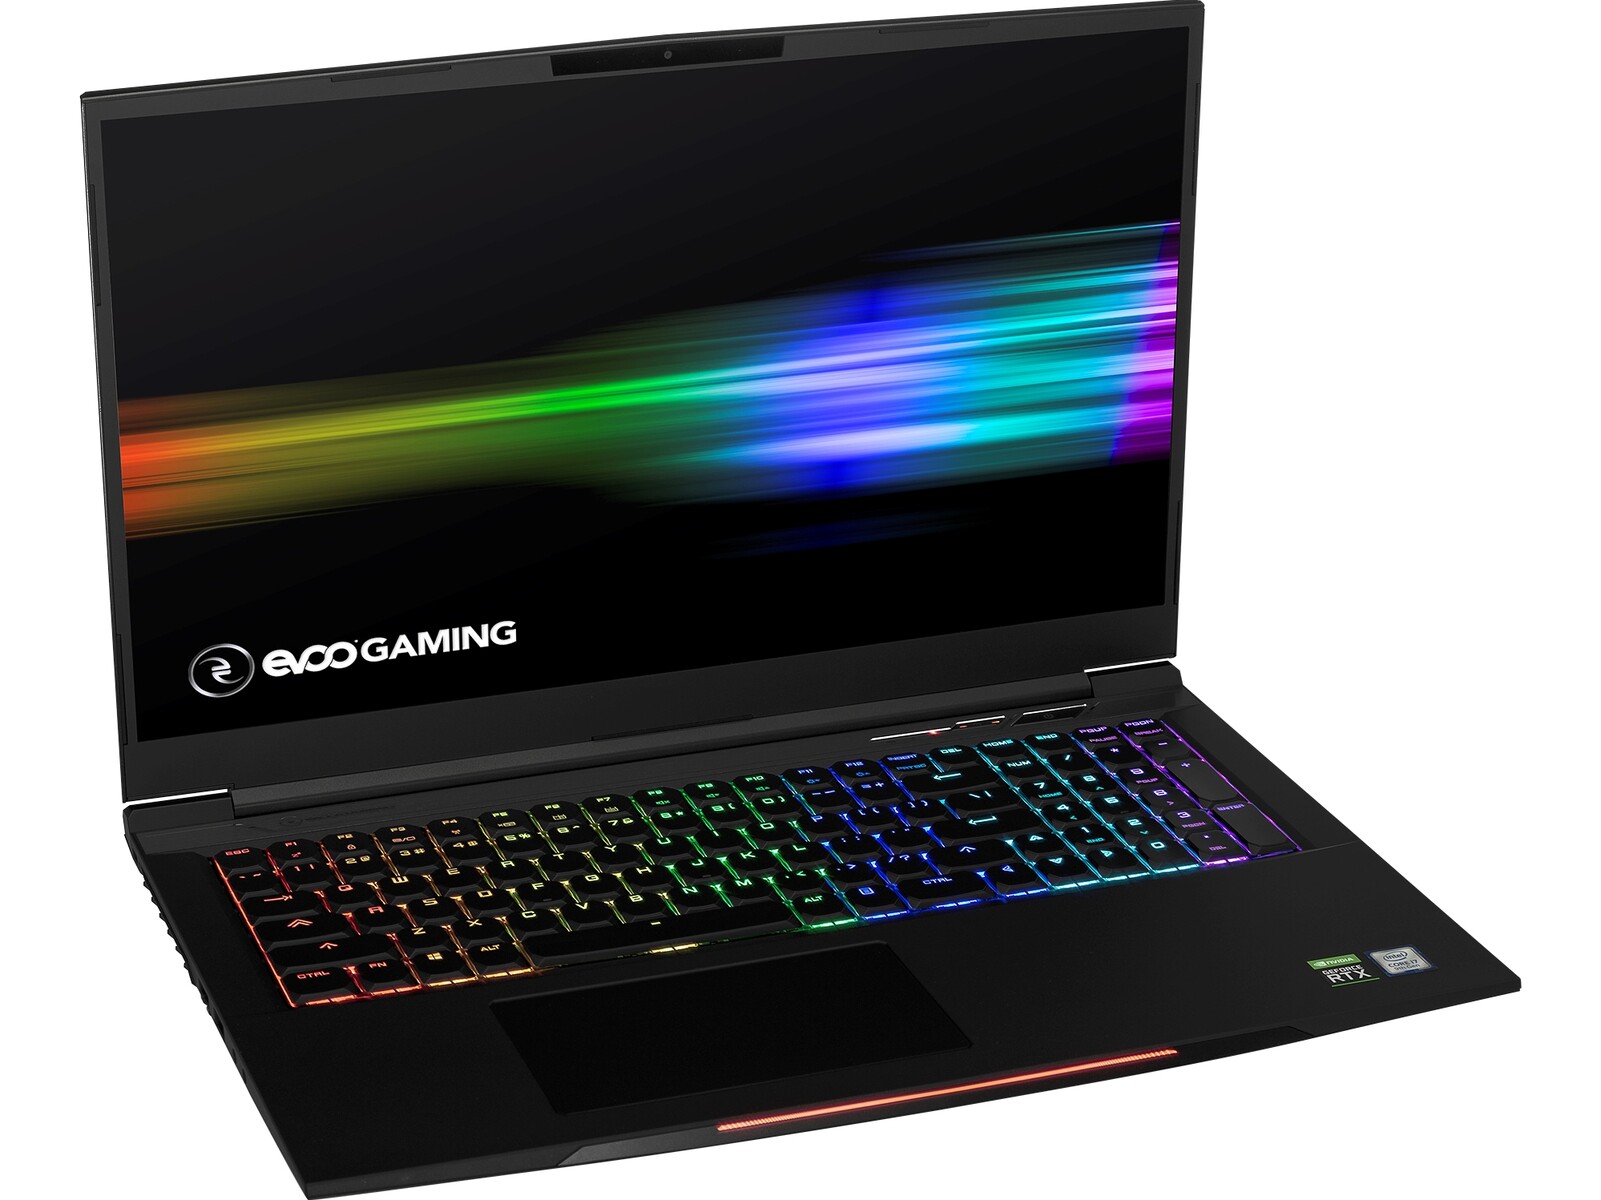
L'acquisto di un Walmart EVOO rispetto alle alternative come MSI GS75, Razer Blade Pro 17, Lenovo Legion Y740, o Asus Zephyrus S GX701 non significa necessariamente sacrificare la qualità ad un prezzo inferiore. Tenete a mente che Walmart non progetta o produce i suoi computer portatili perché sono semplicemente sistemi cinesi con un nuovo marchio. I rivenditori di PC gaming di fascia alta come Maingear, Eluktronics e altri usano la stessa tattica con lo stesso telaio cinese con la stessa white laber.
Detto questo, siamo rimasti impressionati dalle prestazioni superiori alla media della CPU e della GPU del Walmart EVOO. Sia il telaio che il display sono di qualità superiore a quelli del Lenovo. La rumorosa tastiera meccanica, tuttavia, potrebbe non essere adatta a tutti, soprattutto se si prevede di utilizzare il laptop in aule o librerie. La capacità della batteria è piccola per un laptop da 17,3 pollici ed è un peccato che la semplice modifica della RAM o gli aggiornamenti di storage richiedano la rottura di un adesivo. Si consiglia inoltre di controllare i problemi audio, dato che gli altoparlanti della nostra unità di prova non sembrano funzionare.
Il Walmart EVOO Gaming 17 funziona bene se utilizzato esclusivamente per il gaming. La sua breve durata della batteria e i tasti rumorosi della tastiera lo rendono un'opzione scadente per i viaggiatori e gli studenti che desiderano un portatile da gioco più versatile.
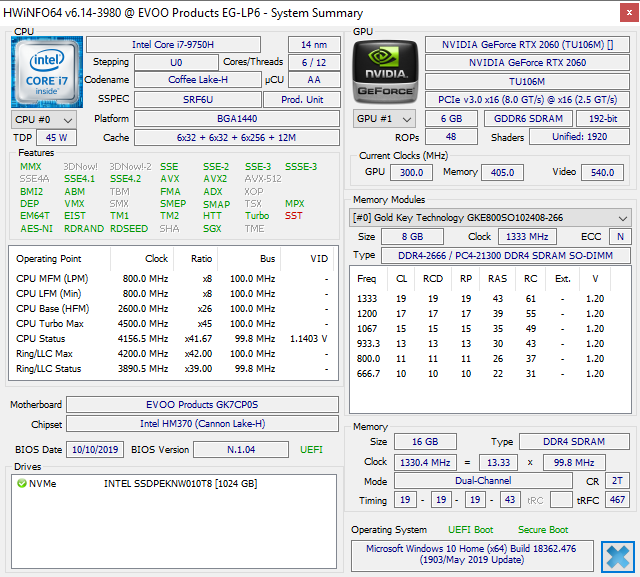
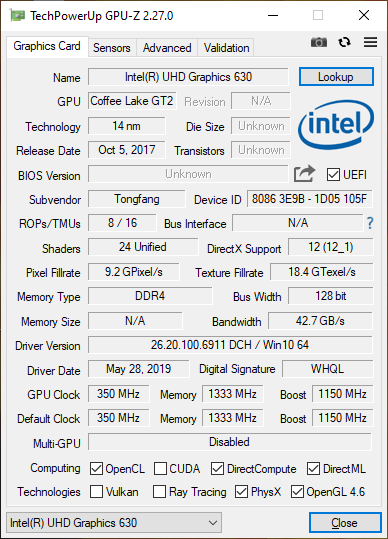
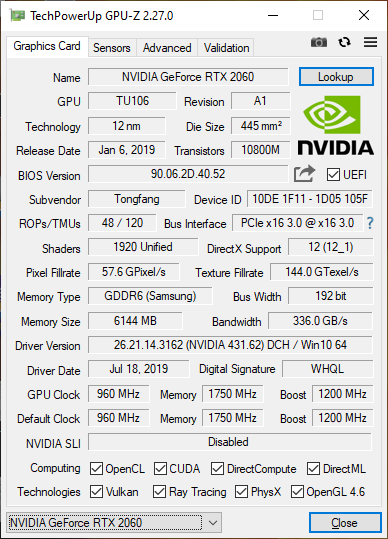
Walmart EVOO Gaming 17
- 05/14/2020 v7 (old)
Allen Ngo
Price comparison
