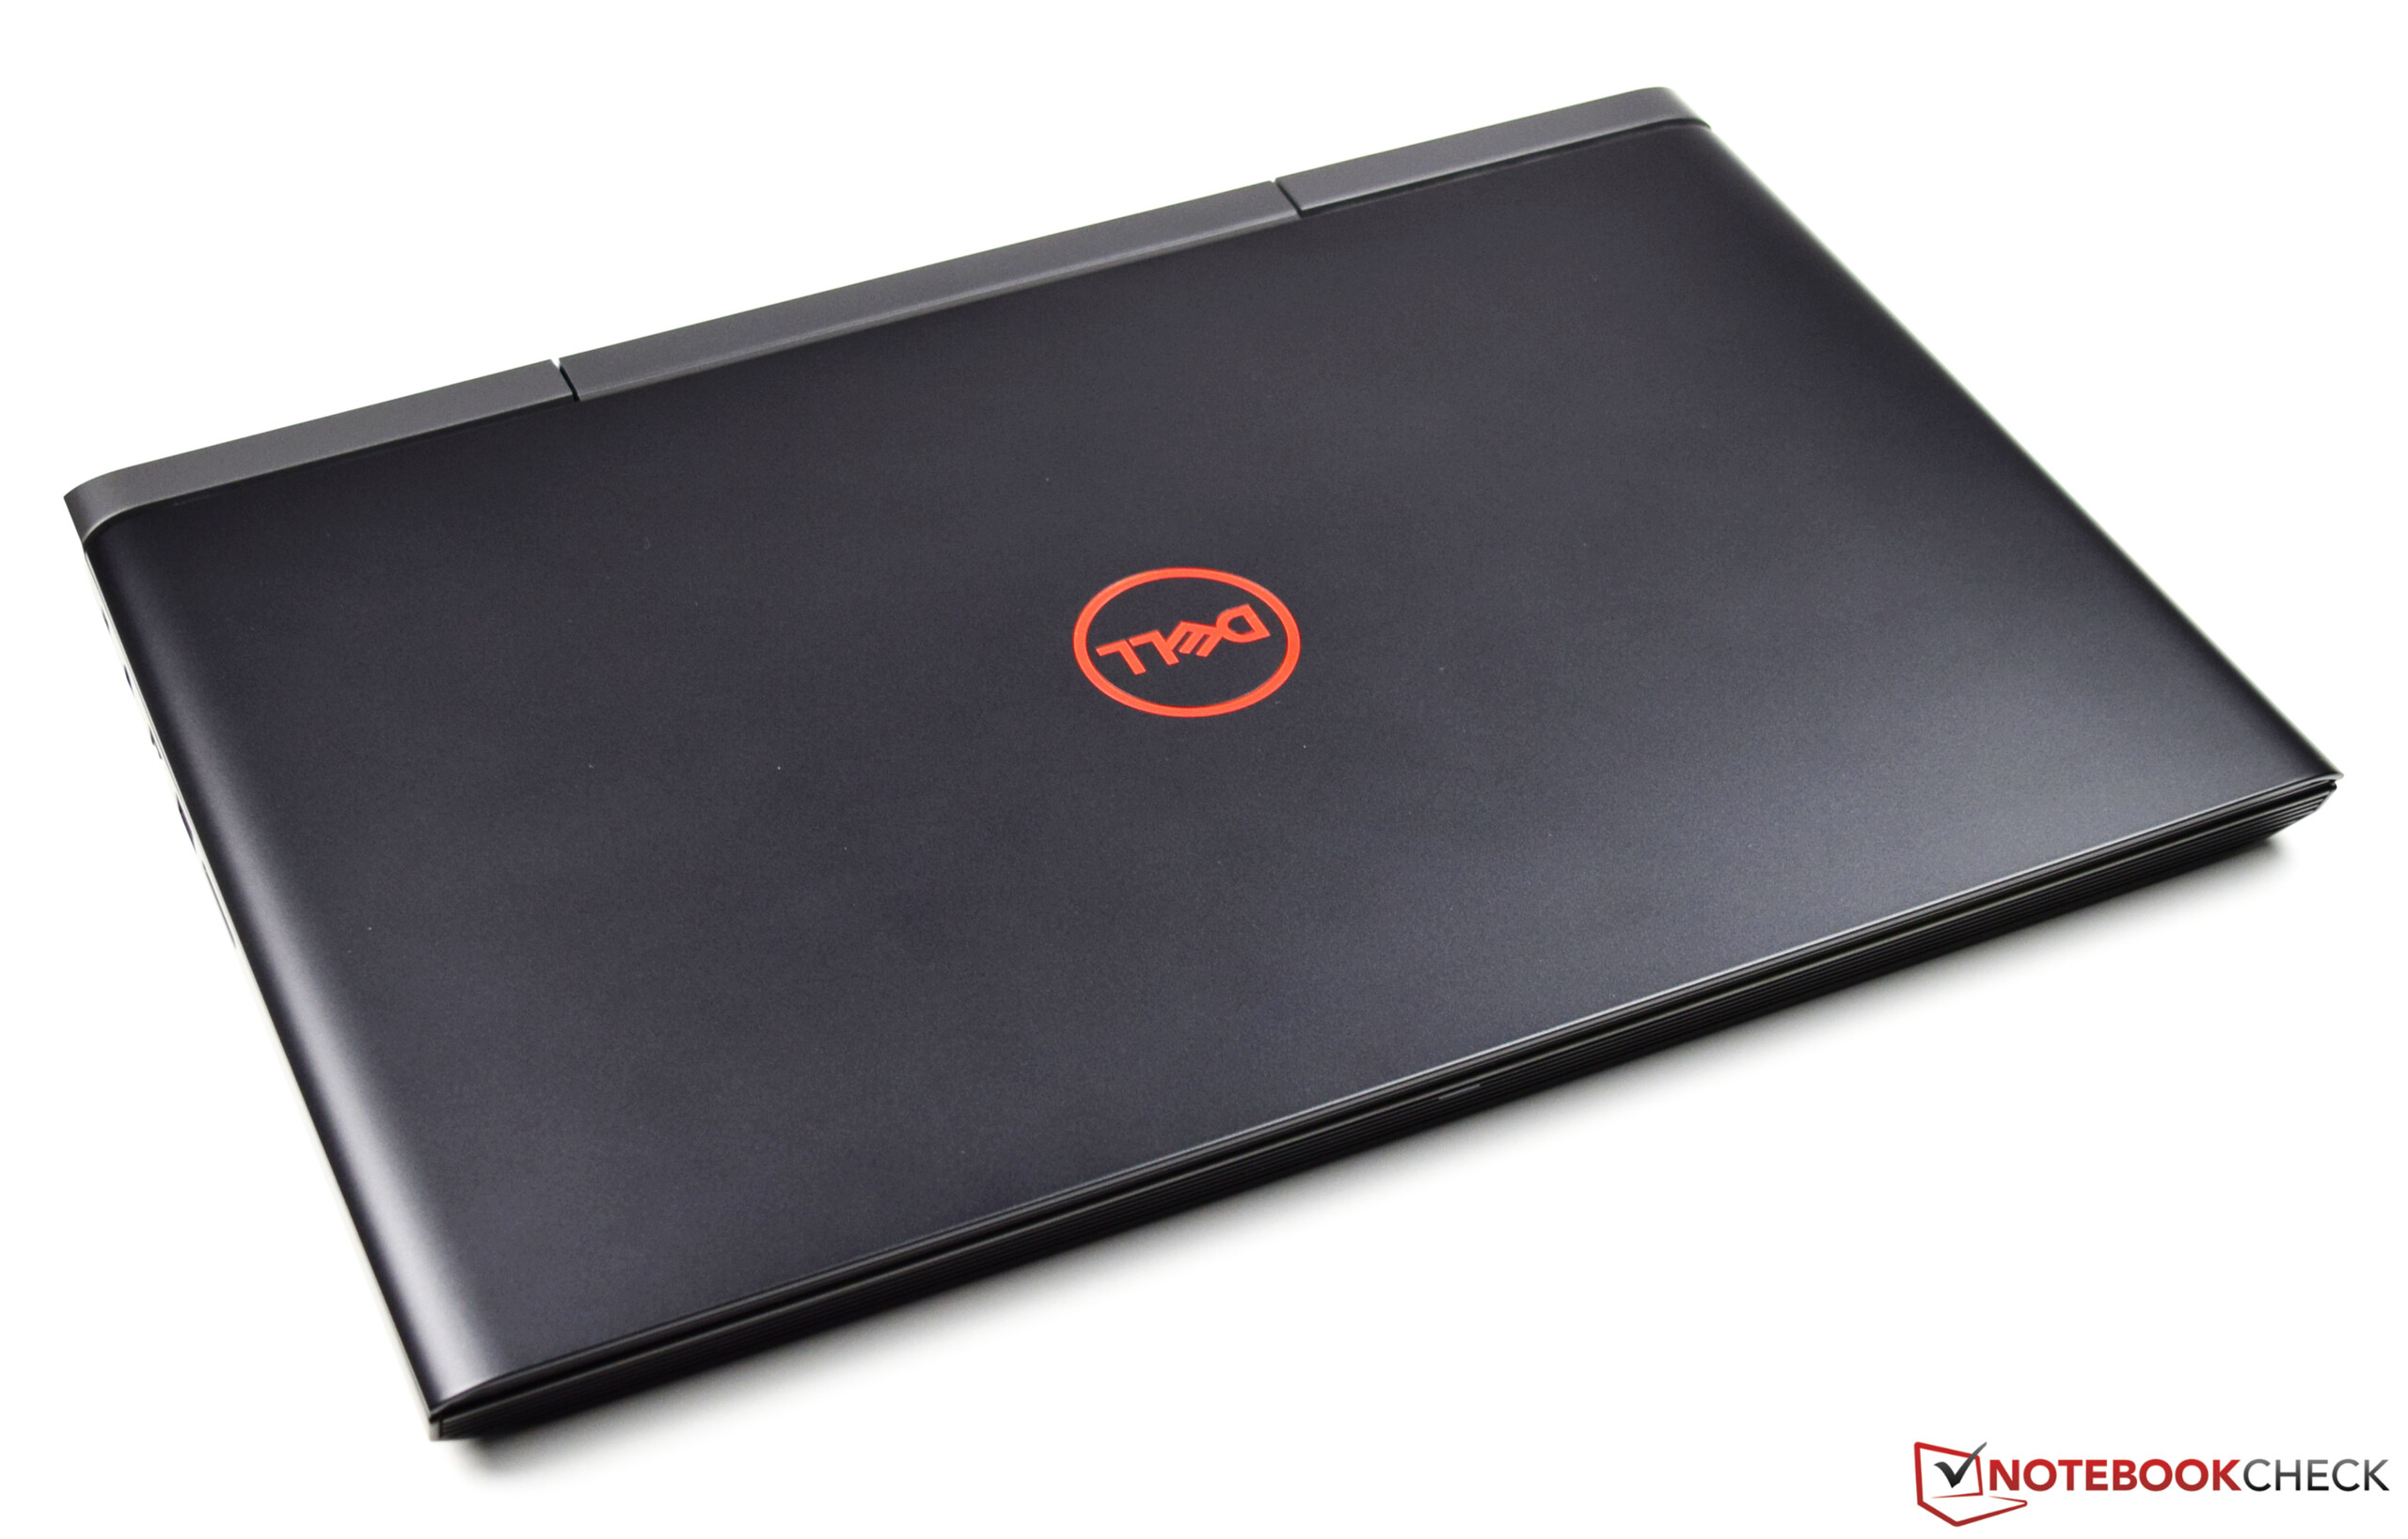
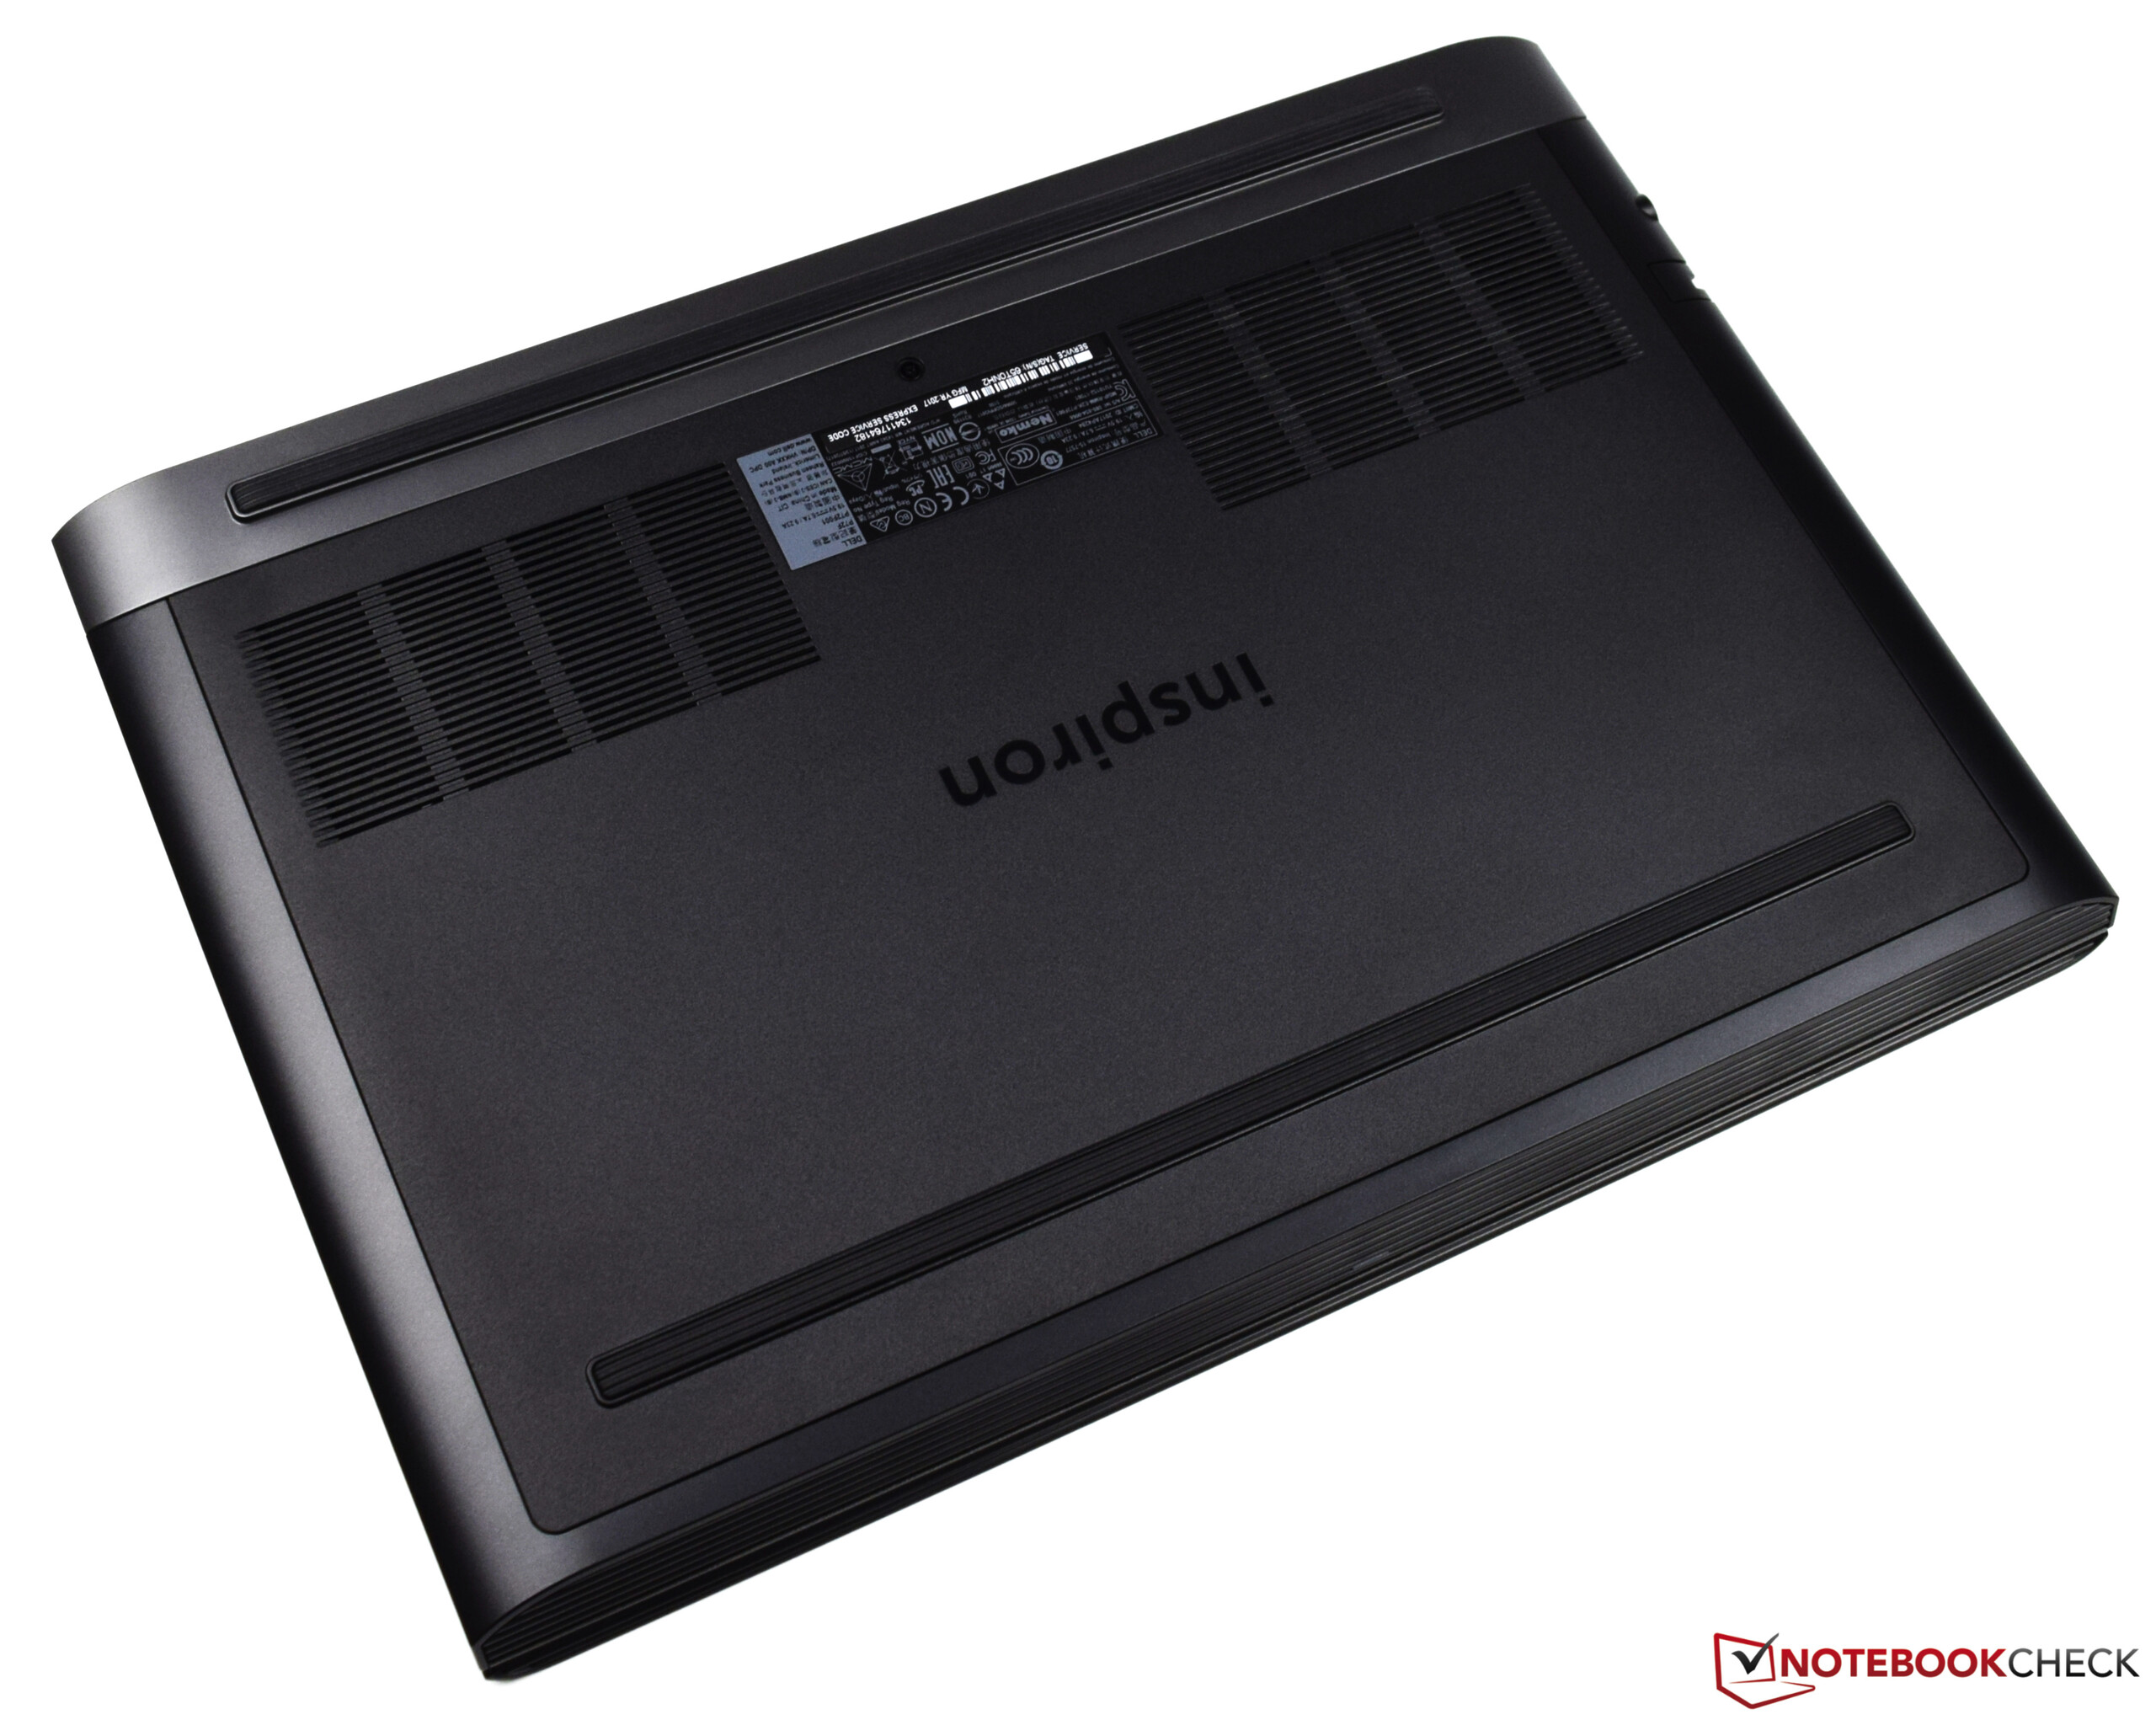
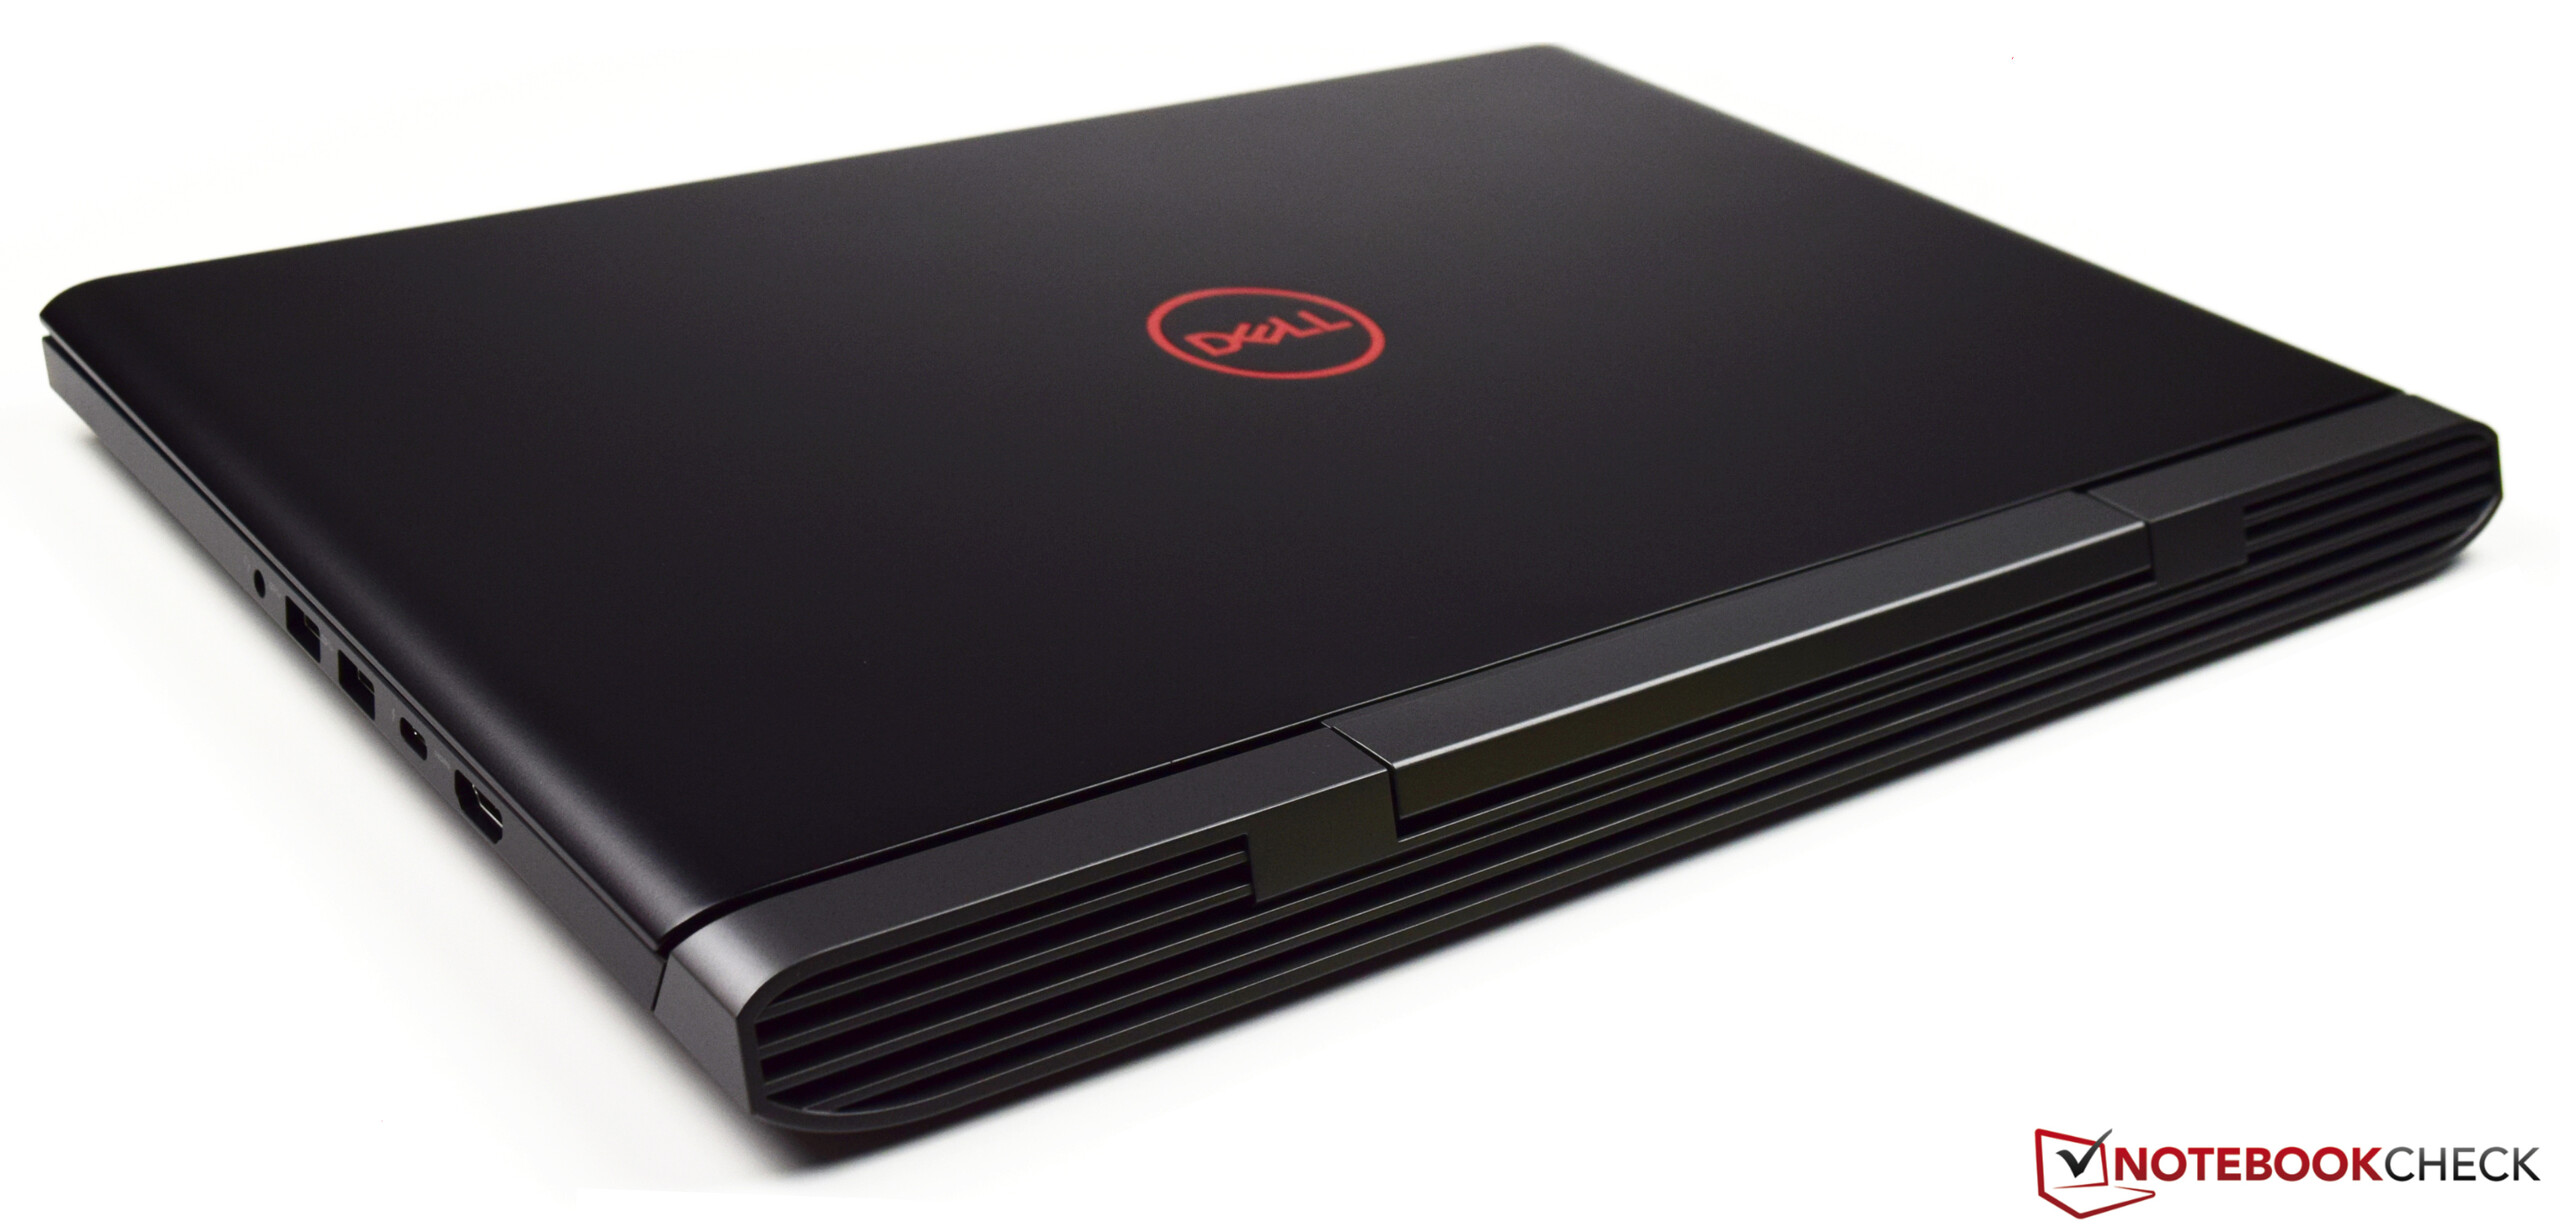
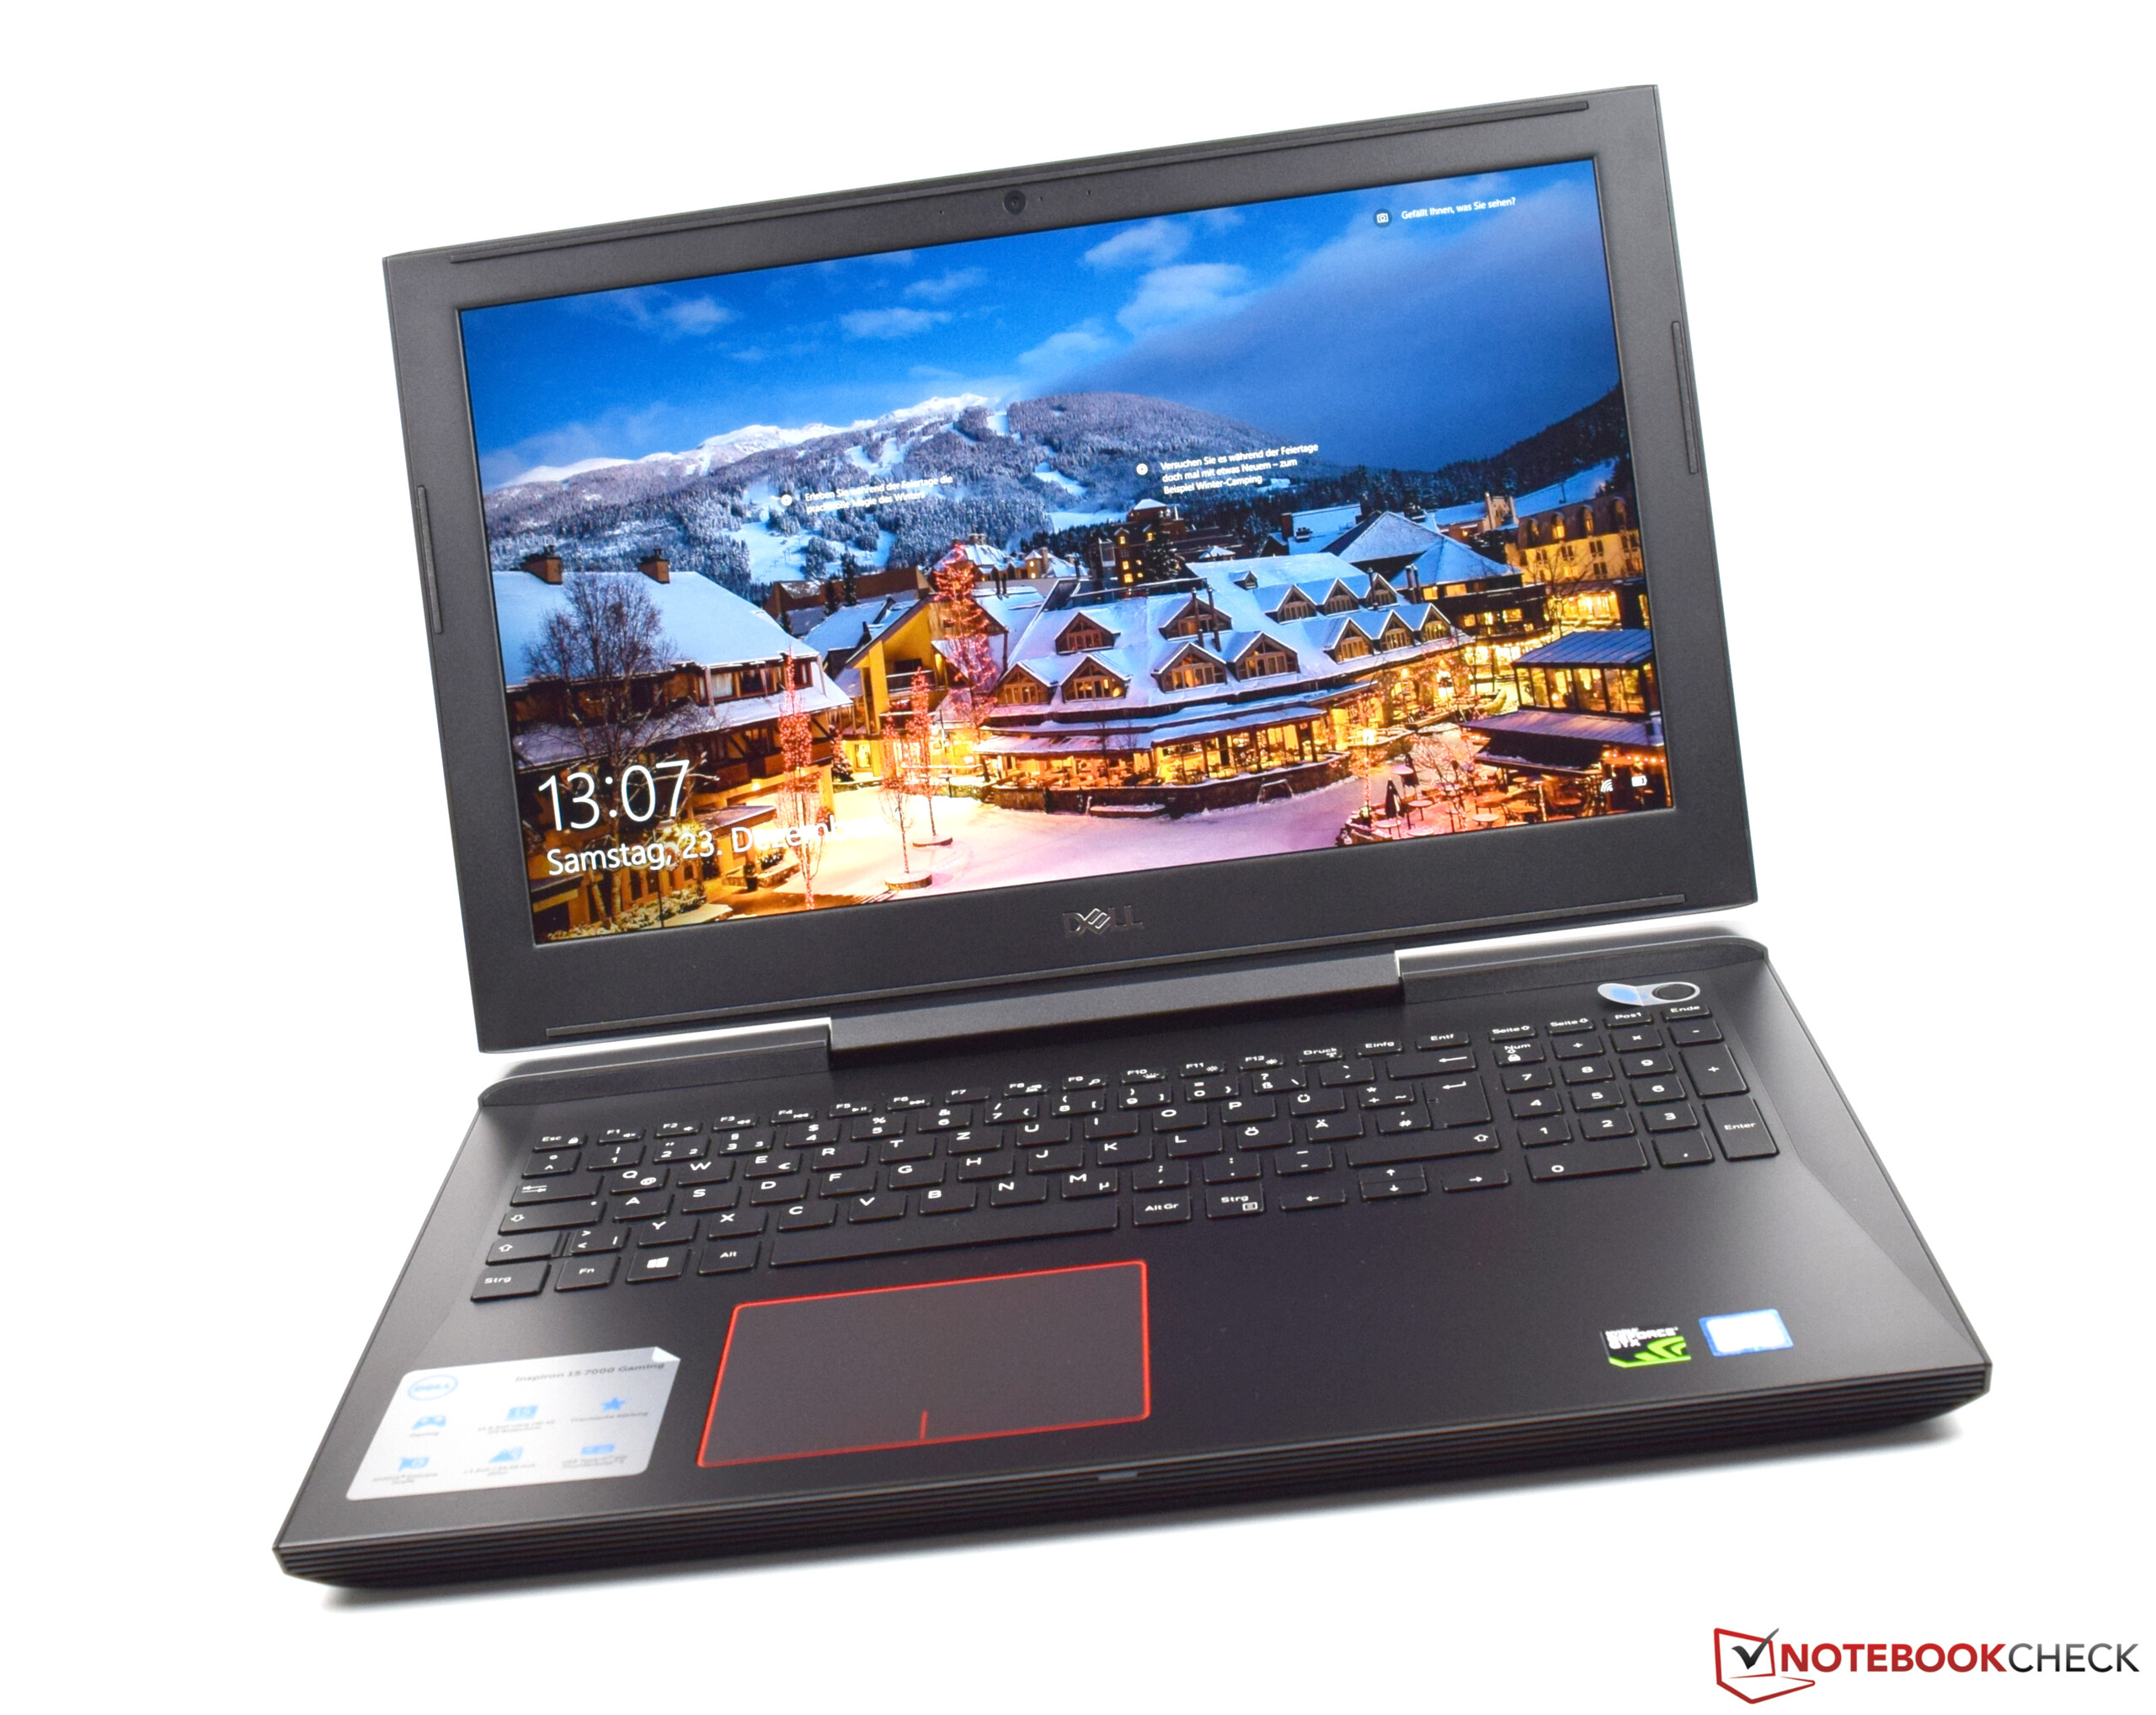
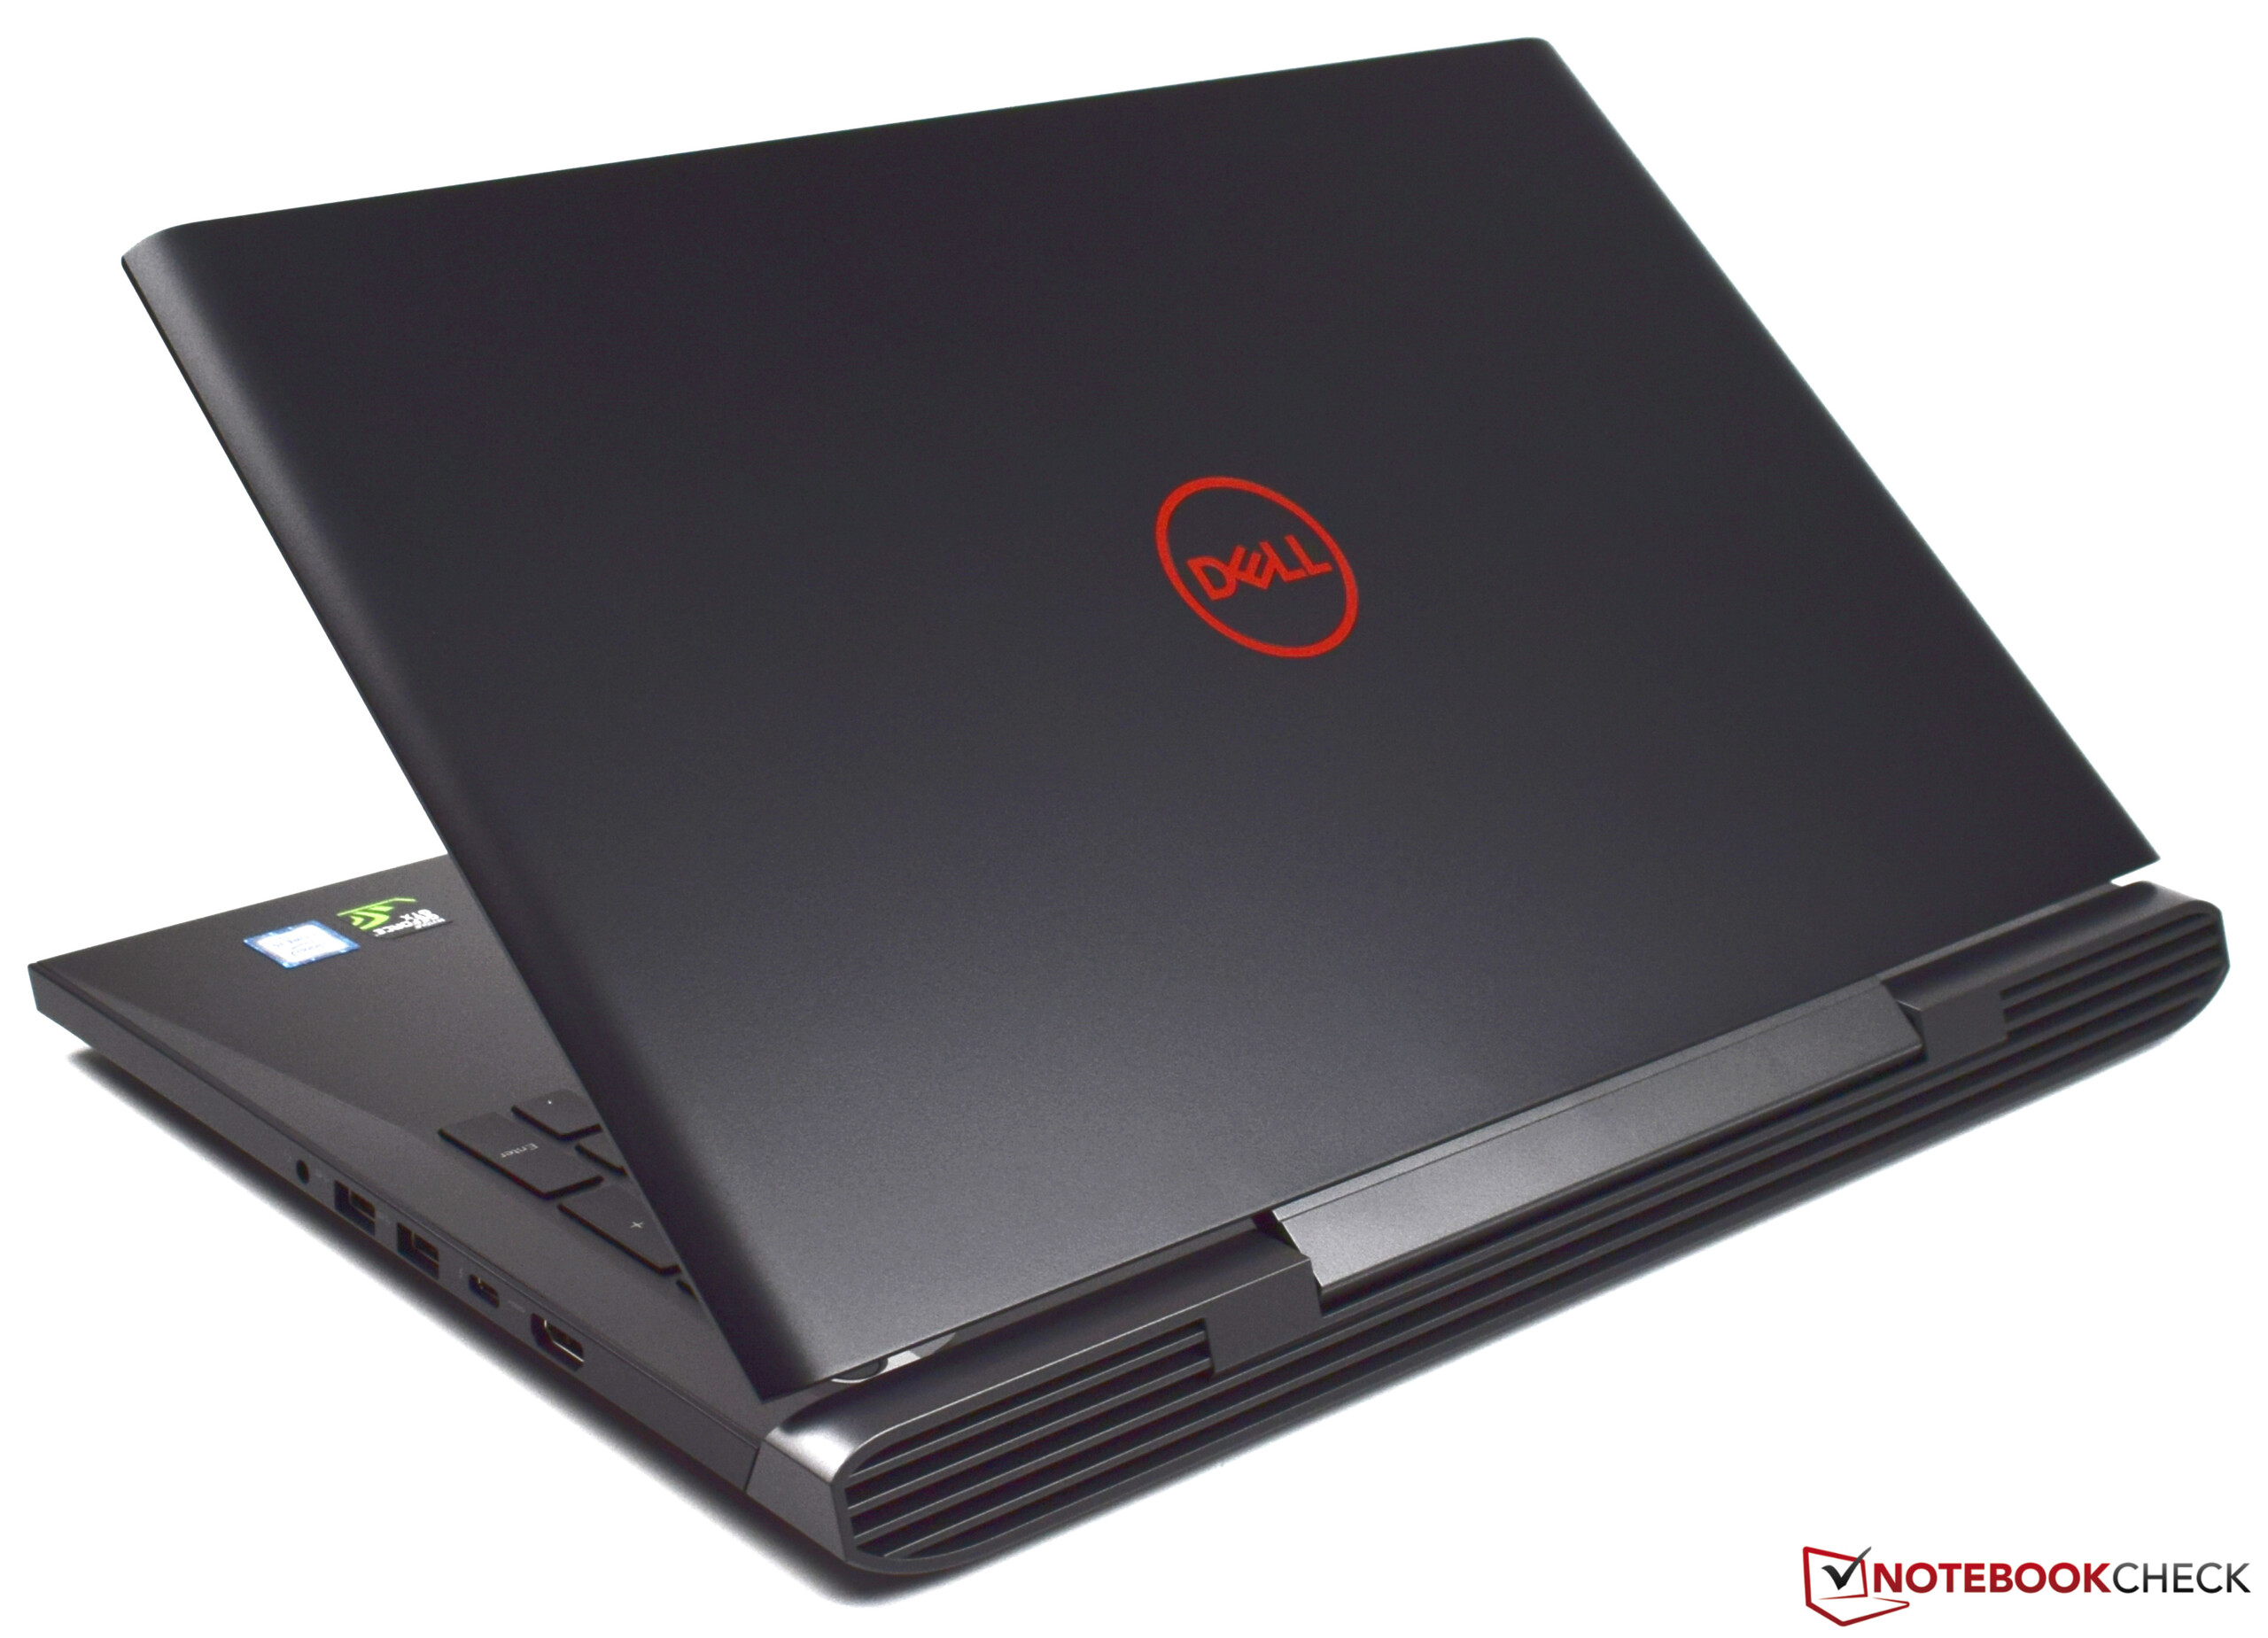
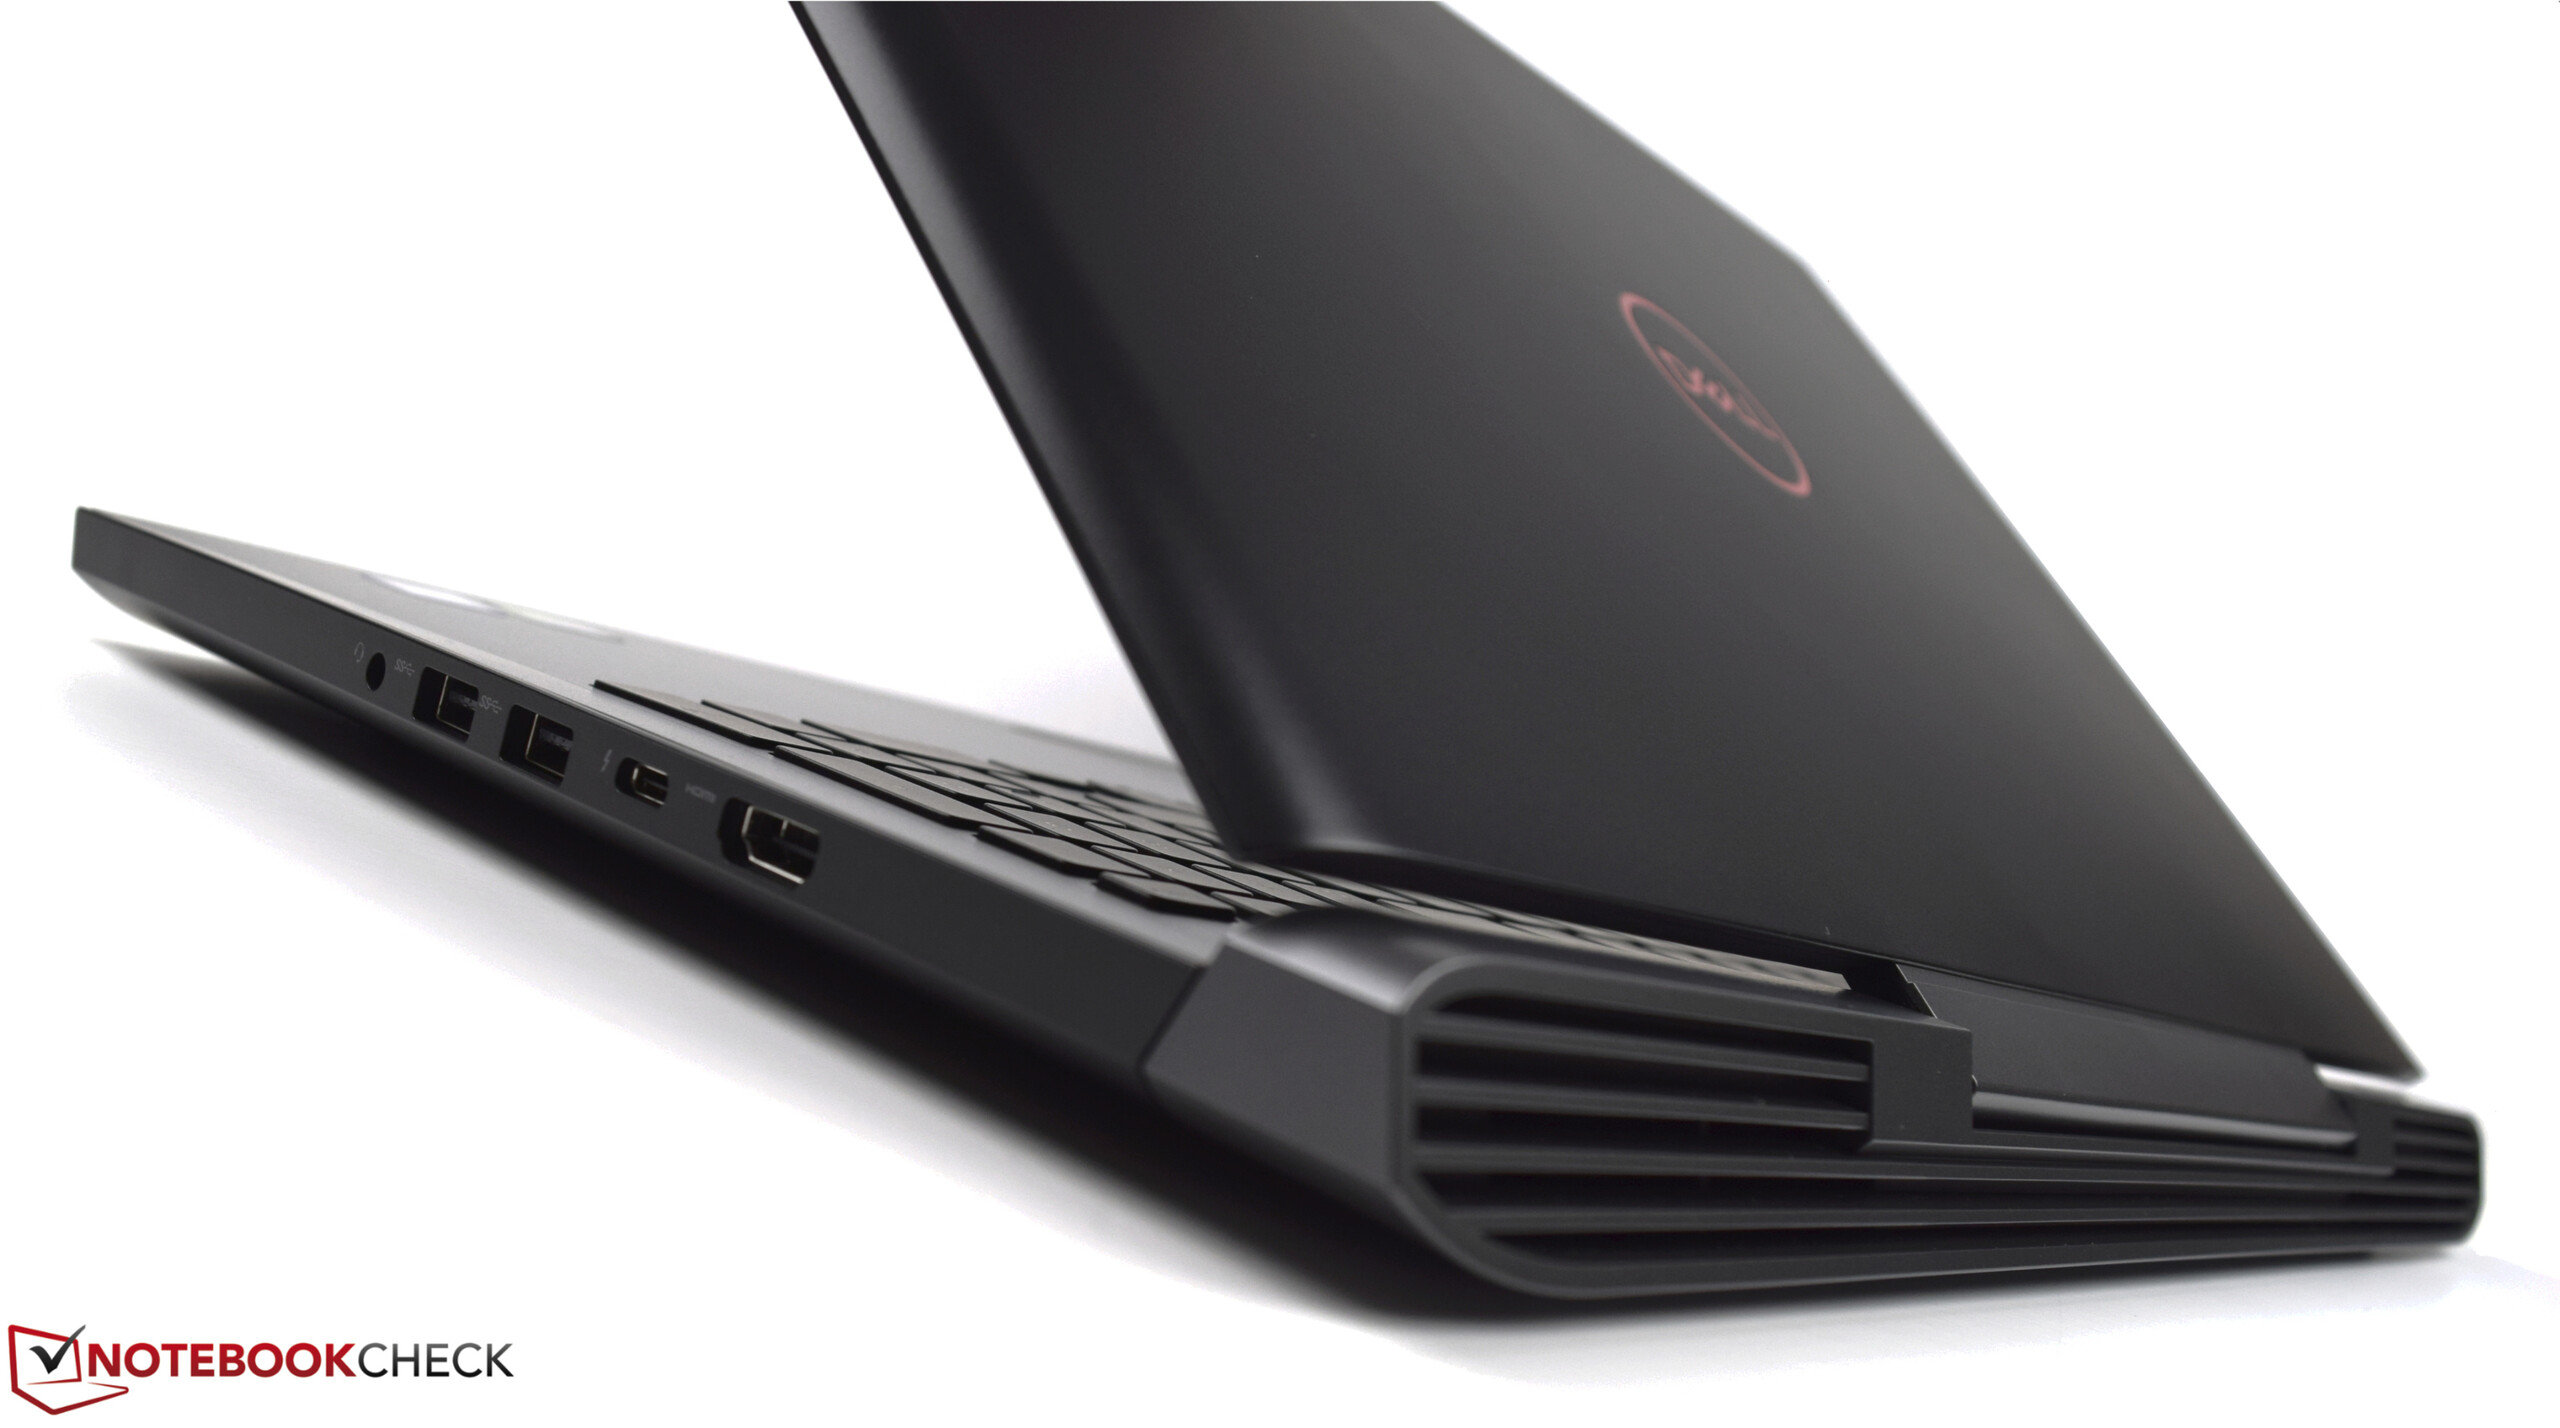
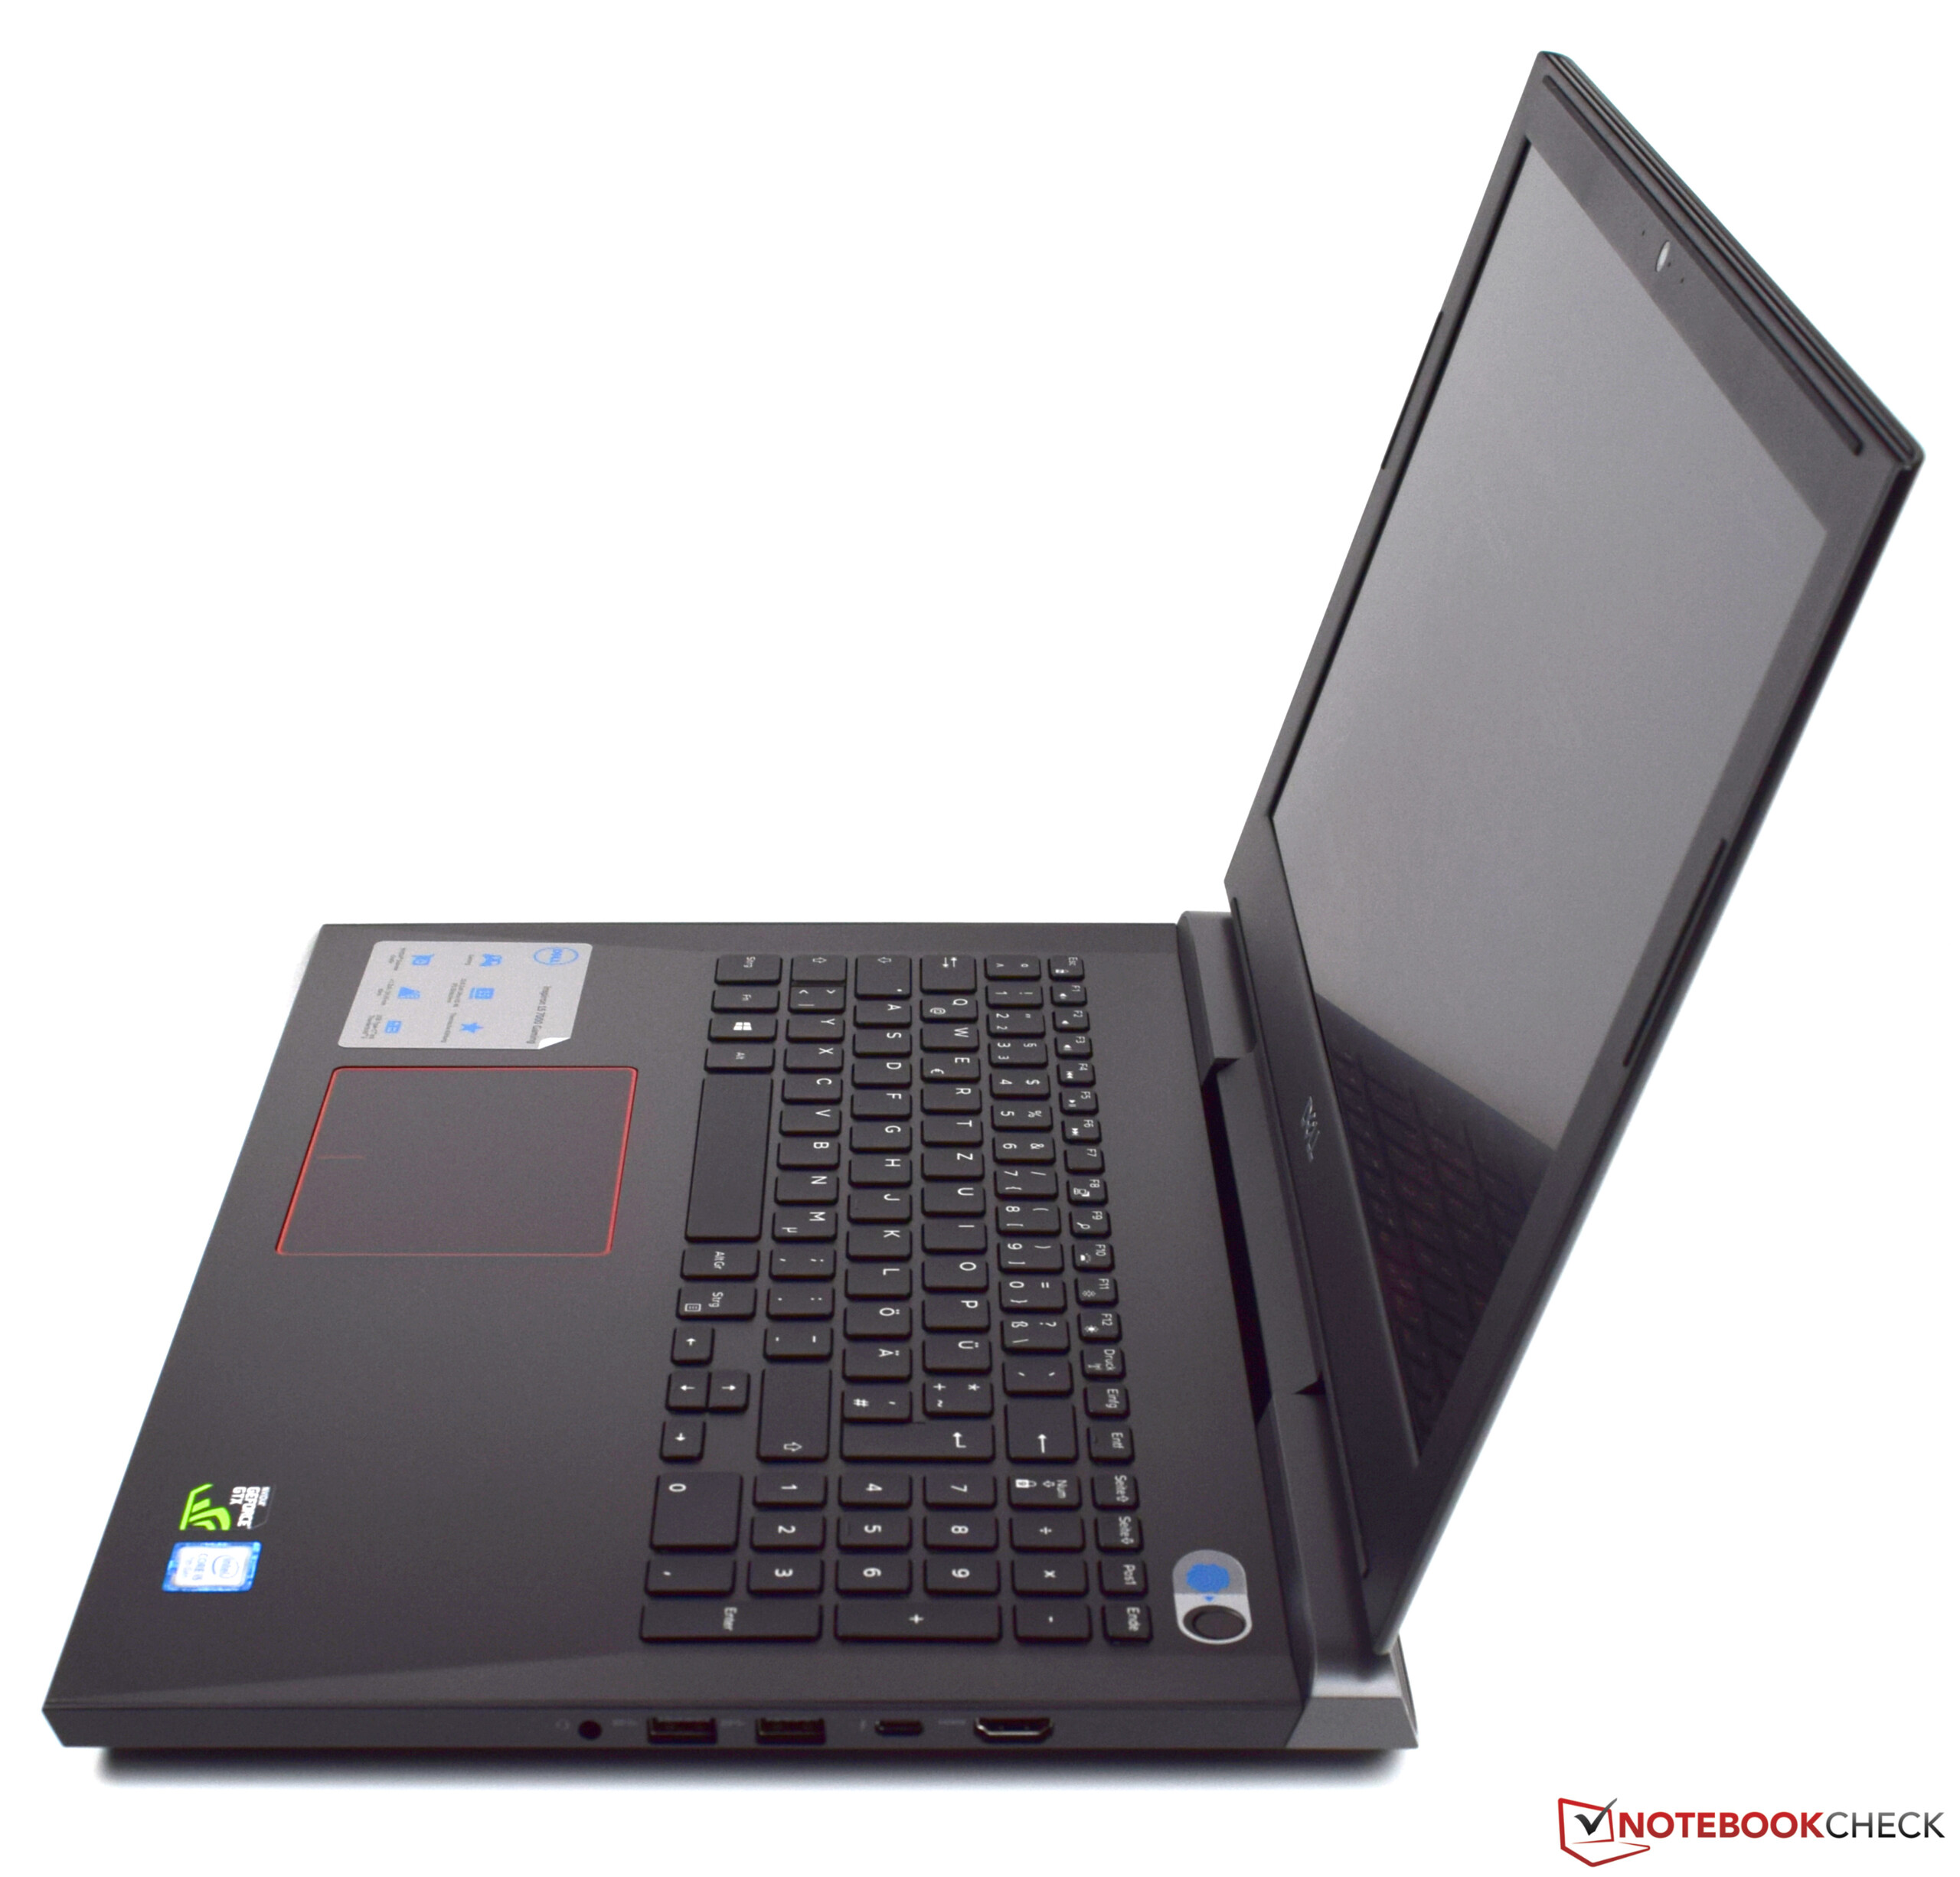
Recensione breve del Portatile Dell Inspiron 15 7000 7577 (i5-7300HQ, GTX 1050, 1080p)

| SD Card Reader | |
| average JPG Copy Test (av. of 3 runs) | |
| Dell Inspiron 15 7000 7577 (Toshiba Exceria Pro SDXC 64 GB UHS-II) | |
| MSI GL62M 7RD-077 (Toshiba Exceria Pro SDXC 64 GB UHS-II) | |
| Acer Aspire VX15 VX5-591G-589S (Toshiba Exceria Pro SDXC 64 GB UHS-II) | |
| Dell Inspiron 15 7000 7577 (Toshiba Exceria Pro SDXC 64 GB UHS-II) | |
| maximum AS SSD Seq Read Test (1GB) | |
| Dell Inspiron 15 7000 7577 (Toshiba Exceria Pro SDXC 64 GB UHS-II) | |
| Dell Inspiron 15 7000 7577 (Toshiba Exceria Pro SDXC 64 GB UHS-II) | |
| MSI GL62M 7RD-077 (Toshiba Exceria Pro SDXC 64 GB UHS-II) | |
| Acer Aspire VX15 VX5-591G-589S (Toshiba Exceria Pro SDXC 64 GB UHS-II) | |
| |||||||||||||||||||||||||
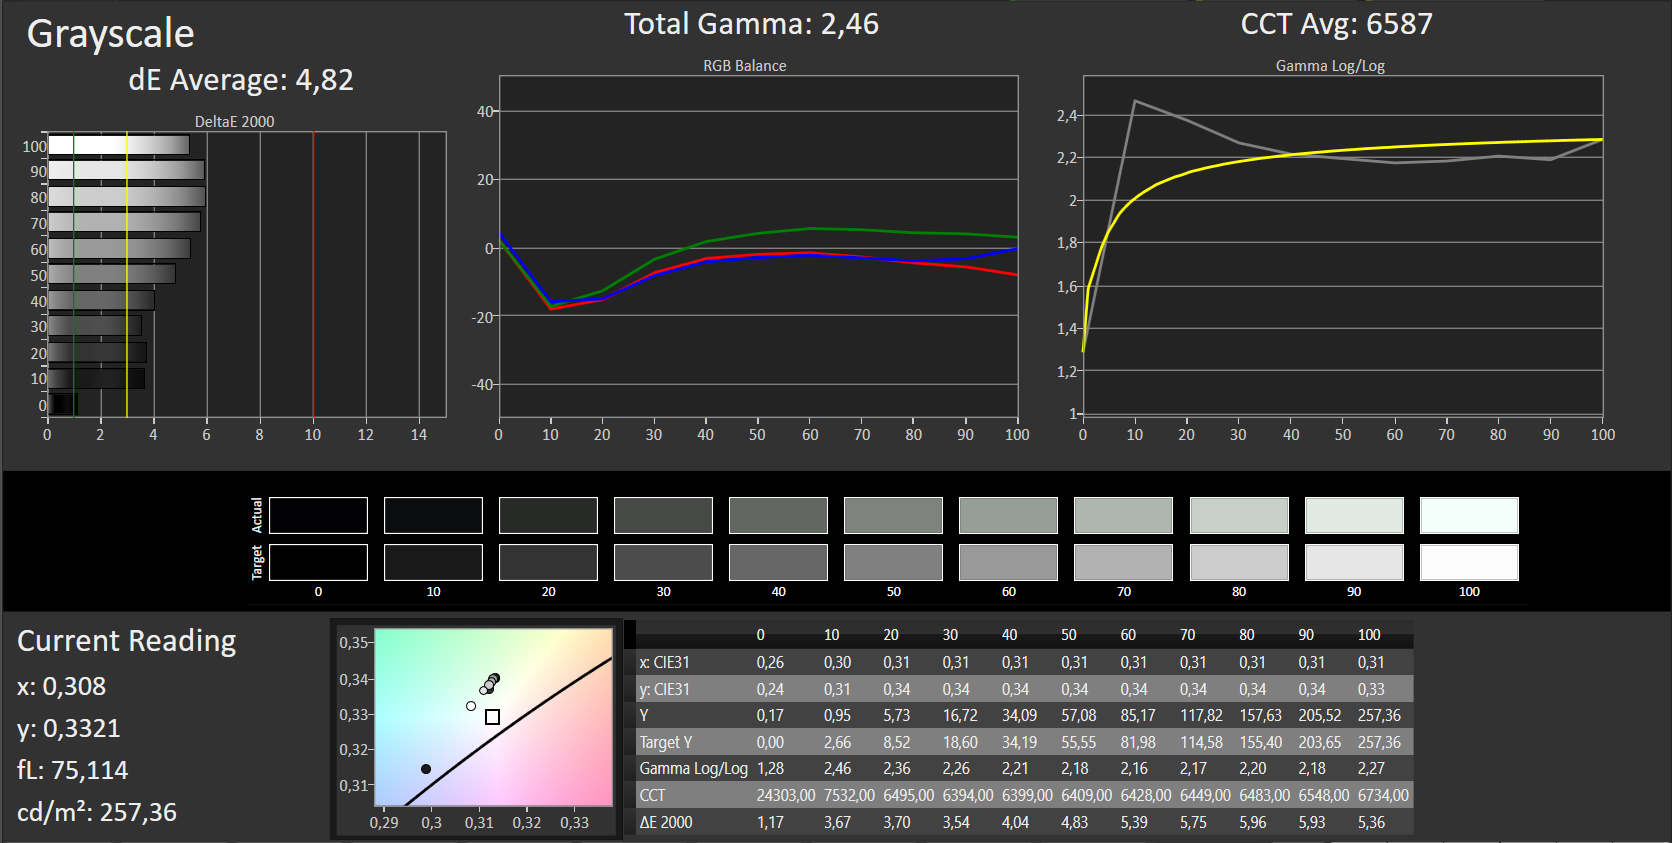
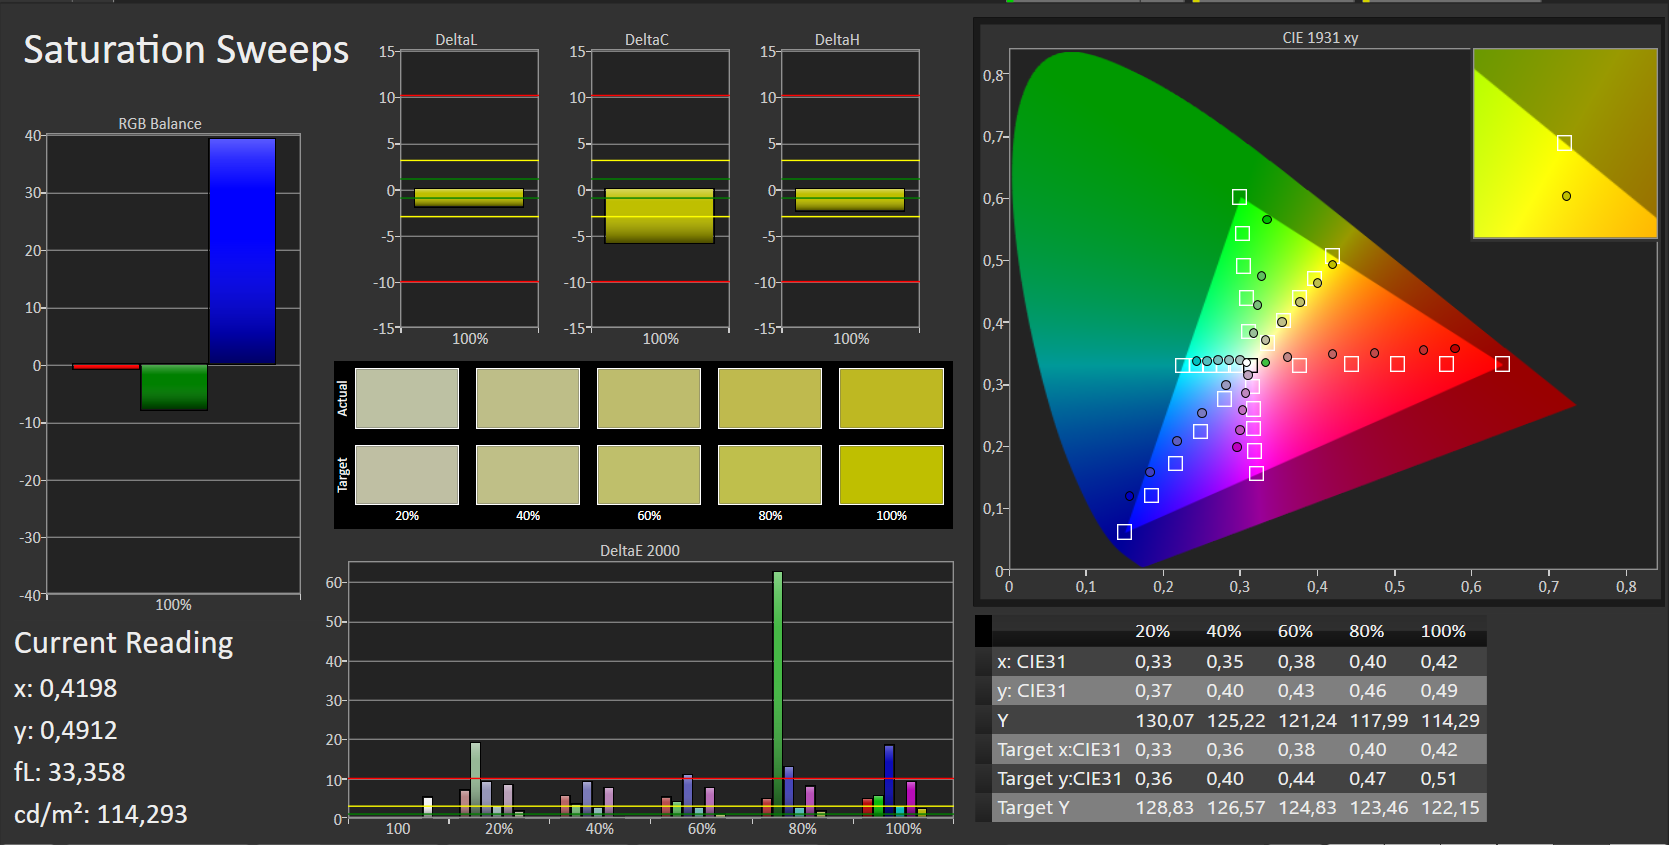
Distribuzione della luminosità: 84 %
Al centro con la batteria: 256 cd/m²
Contrasto: 1512:1 (Nero: 0.17 cd/m²)
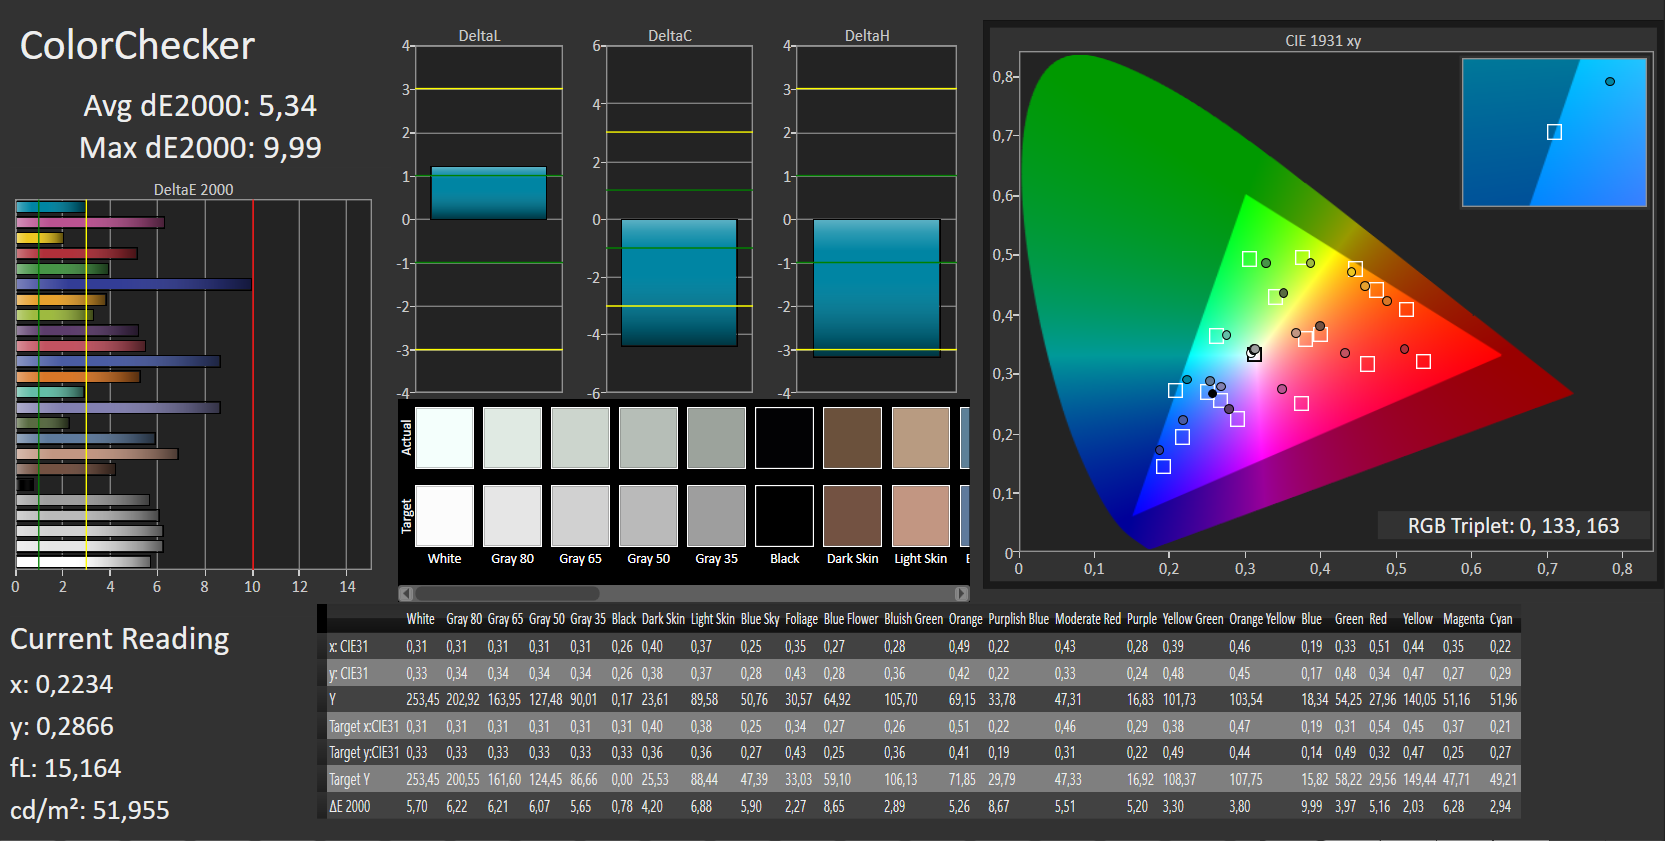
ΔE ColorChecker Calman: 5.34 | ∀{0.5-29.43 Ø4.73}
ΔE Greyscale Calman: 4.82 | ∀{0.09-98 Ø4.97}
60% sRGB (Argyll 1.6.3 3D)
38% AdobeRGB 1998 (Argyll 1.6.3 3D)
41.77% AdobeRGB 1998 (Argyll 3D)
60.5% sRGB (Argyll 3D)
40.4% Display P3 (Argyll 3D)
Gamma: 2.46
CCT: 6587 K
| Dell Inspiron 15 7000 7577 ID: LG Philips LGD053F, Name: 156WF6, Dell P/N: 4XK13, 1920x1080, 15.6" | Dell Inspiron 15 7000 7577 ID: LG Philips LGD053F, Name: 156WF6, Dell P/N: 4XK13, 1920x1080, 15.6" | Lenovo Legion Y520-15IKBN 80WK0042GE LG Philips LP156WF6-SPK3, 1920x1080, 15.6" | Acer Aspire VX15 VX5-591G-589S BOE CQ NV156HFM-N42, 1920x1080, 15.6" | MSI GL62M 7RD-077 Chi Mei N156HGE-EAL, 1920x1080, 15.6" | |
|---|---|---|---|---|---|
| Display | -8% | -3% | -1% | 92% | |
| Display P3 Coverage (%) | 40.4 | 37.07 -8% | 39.01 -3% | 40.56 0% | 85.4 111% |
| sRGB Coverage (%) | 60.5 | 55.6 -8% | 58.4 -3% | 59.4 -2% | 100 65% |
| AdobeRGB 1998 Coverage (%) | 41.77 | 38.32 -8% | 40.34 -3% | 41.9 0% | 83.8 101% |
| Response Times | 7% | 1% | -17% | -6% | |
| Response Time Grey 50% / Grey 80% * (ms) | 41 ? | 35.6 ? 13% | 39 ? 5% | 46 ? -12% | 44 ? -7% |
| Response Time Black / White * (ms) | 28 ? | 27.6 ? 1% | 29 ? -4% | 34 ? -21% | 29 ? -4% |
| PWM Frequency (Hz) | 21000 ? | 20000 ? | 198 ? | ||
| Screen | -21% | -19% | 0% | -39% | |
| Brightness middle (cd/m²) | 257 | 235.4 -8% | 283 10% | 277 8% | 258 0% |
| Brightness (cd/m²) | 229 | 223 -3% | 281 23% | 268 17% | 234 2% |
| Brightness Distribution (%) | 84 | 91 8% | 91 8% | 91 8% | 79 -6% |
| Black Level * (cd/m²) | 0.17 | 0.28 -65% | 0.39 -129% | 0.26 -53% | 0.54 -218% |
| Contrast (:1) | 1512 | 841 -44% | 726 -52% | 1065 -30% | 478 -68% |
| Colorchecker dE 2000 * | 5.34 | 5.6 -5% | 6.1 -14% | 5.05 5% | 9.74 -82% |
| Colorchecker dE 2000 max. * | 9.99 | 20.3 -103% | 11.08 -11% | 8.93 11% | 14.6 -46% |
| Greyscale dE 2000 * | 4.82 | 3.6 25% | 5.69 -18% | 2.97 38% | 11.59 -140% |
| Gamma | 2.46 89% | 2.23 99% | 2.44 90% | 2.39 92% | 2.19 100% |
| CCT | 6587 99% | 7214 90% | 6702 97% | 6466 101% | 11851 55% |
| Color Space (Percent of AdobeRGB 1998) (%) | 38 | 35.2 -7% | 37 -3% | 38 0% | 76 100% |
| Color Space (Percent of sRGB) (%) | 60 | 55.4 -8% | 58 -3% | 59 -2% | 100 67% |
| Media totale (Programma / Settaggio) | -7% /
-15% | -7% /
-13% | -6% /
-2% | 16% /
-8% |
* ... Meglio usare valori piccoli
Tempi di risposta del Display
| ↔ Tempi di risposta dal Nero al Bianco | ||
|---|---|---|
| 28 ms ... aumenta ↗ e diminuisce ↘ combinato | ↗ 15 ms Incremento | 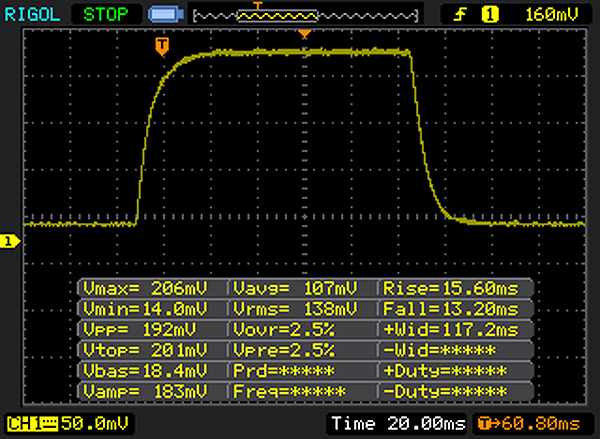 |
| ↘ 13 ms Calo | ||
| Lo schermo mostra tempi di risposta relativamente lenti nei nostri tests e potrebbe essere troppo lento per i gamers. In confronto, tutti i dispositivi di test variano da 0.1 (minimo) a 240 (massimo) ms. » 71 % di tutti i dispositivi è migliore. Questo significa che i tempi di risposta rilevati sono peggiori rispetto alla media di tutti i dispositivi testati (19.9 ms). | ||
| ↔ Tempo di risposta dal 50% Grigio all'80% Grigio | ||
| 41 ms ... aumenta ↗ e diminuisce ↘ combinato | ↗ 20 ms Incremento | 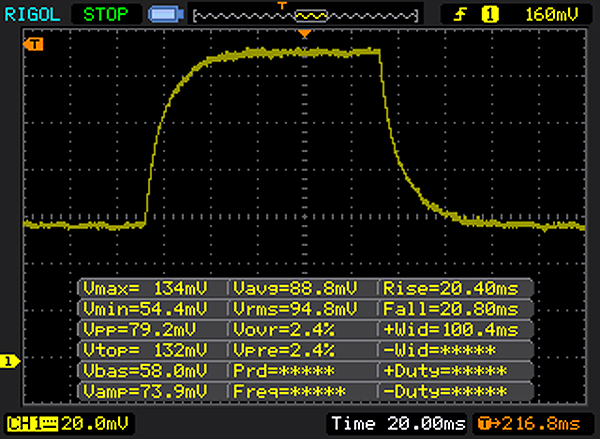 |
| ↘ 21 ms Calo | ||
| Lo schermo mostra tempi di risposta lenti nei nostri tests e sarà insoddisfacente per i gamers. In confronto, tutti i dispositivi di test variano da 0.165 (minimo) a 636 (massimo) ms. » 65 % di tutti i dispositivi è migliore. Questo significa che i tempi di risposta rilevati sono peggiori rispetto alla media di tutti i dispositivi testati (31.1 ms). | ||
Sfarfallio dello schermo / PWM (Pulse-Width Modulation)
| flickering dello schermo / PWM non rilevato | ||
In confronto: 52 % di tutti i dispositivi testati non utilizza PWM per ridurre la luminosita' del display. Se è rilevato PWM, una media di 7798 (minimo: 5 - massimo: 343500) Hz è stata rilevata. | ||
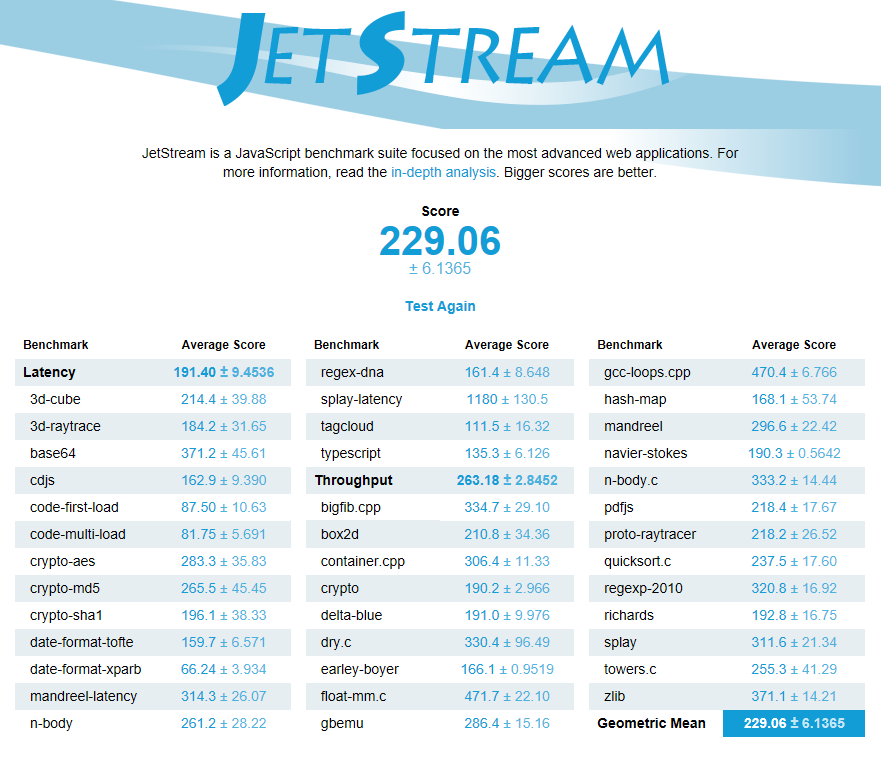
| JetStream 1.1 - 1.1 Total | |
| MSI GL62M 7RD-077 | |
| Acer Aspire VX15 VX5-591G-589S | |
| Lenovo Legion Y520-15IKBN 80WK0042GE | |
| Dell Inspiron 15 7000 7577 | |
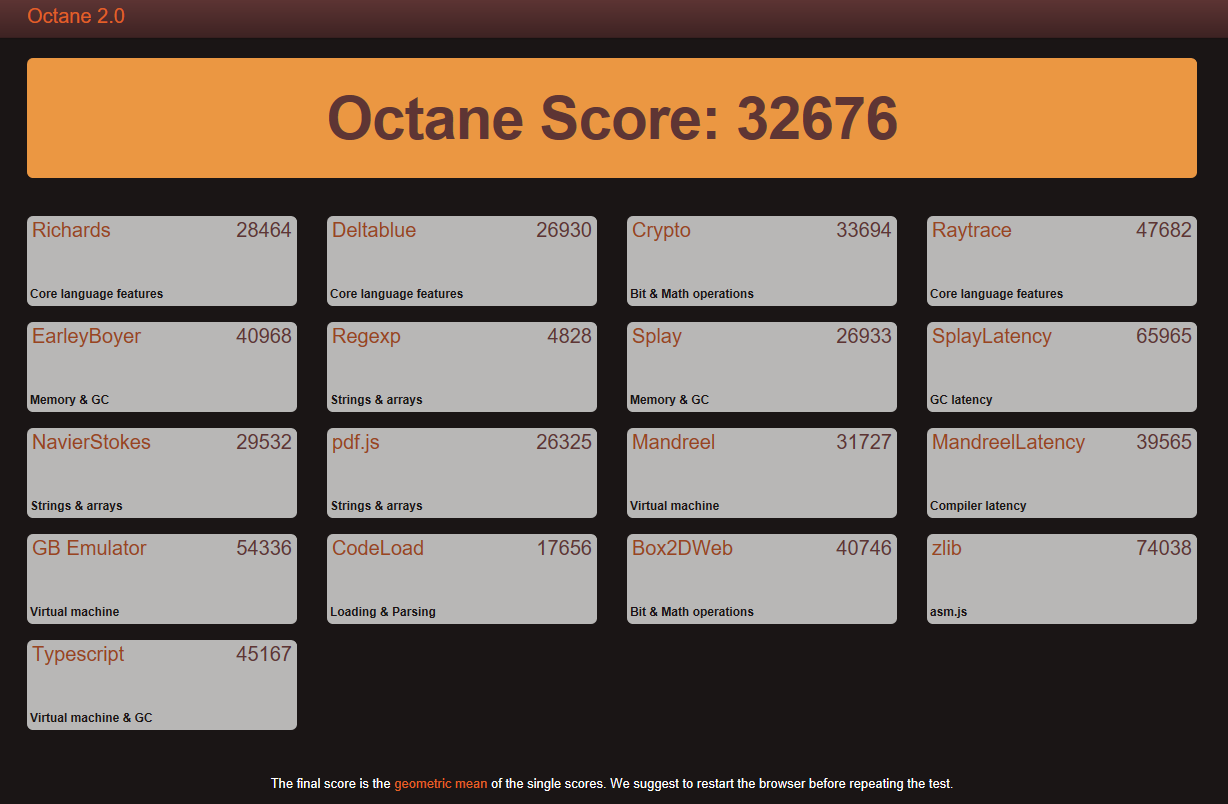
| Octane V2 - Total Score | |
| MSI GL62M 7RD-077 | |
| Lenovo Legion Y520-15IKBN 80WK0042GE | |
| Dell Inspiron 15 7000 7577 | |
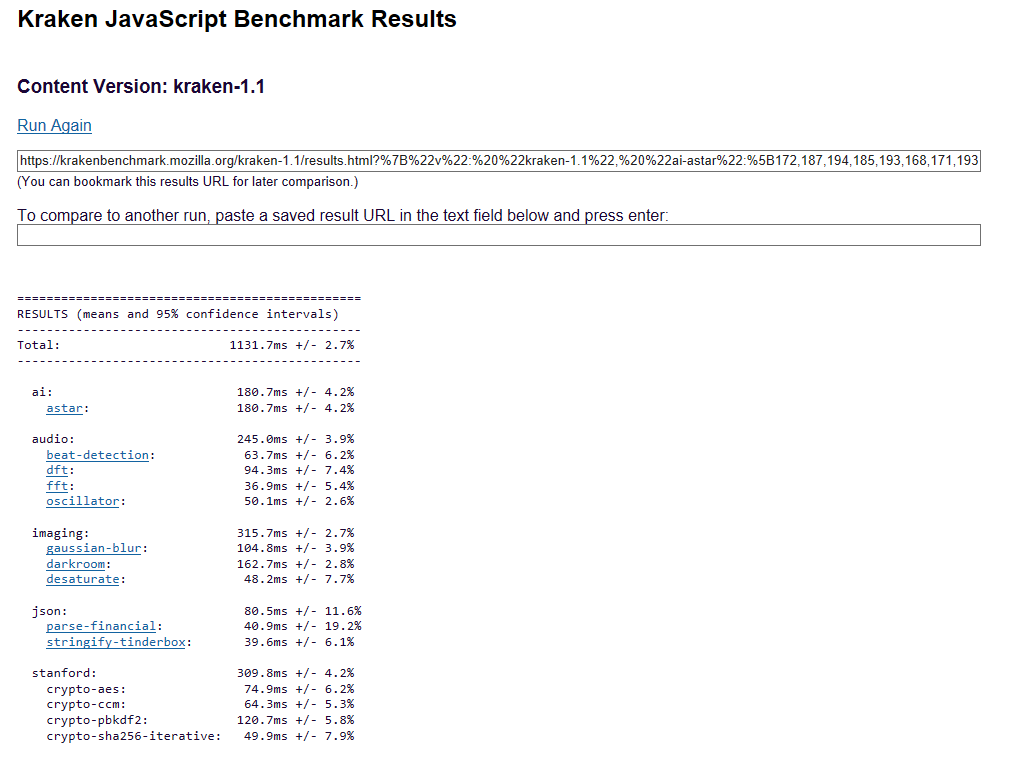
| Mozilla Kraken 1.1 - Total | |
| Dell Inspiron 15 7000 7577 | |
| Lenovo Legion Y520-15IKBN 80WK0042GE | |
| MSI GL62M 7RD-077 | |
* ... Meglio usare valori piccoli
| PCMark 8 | |
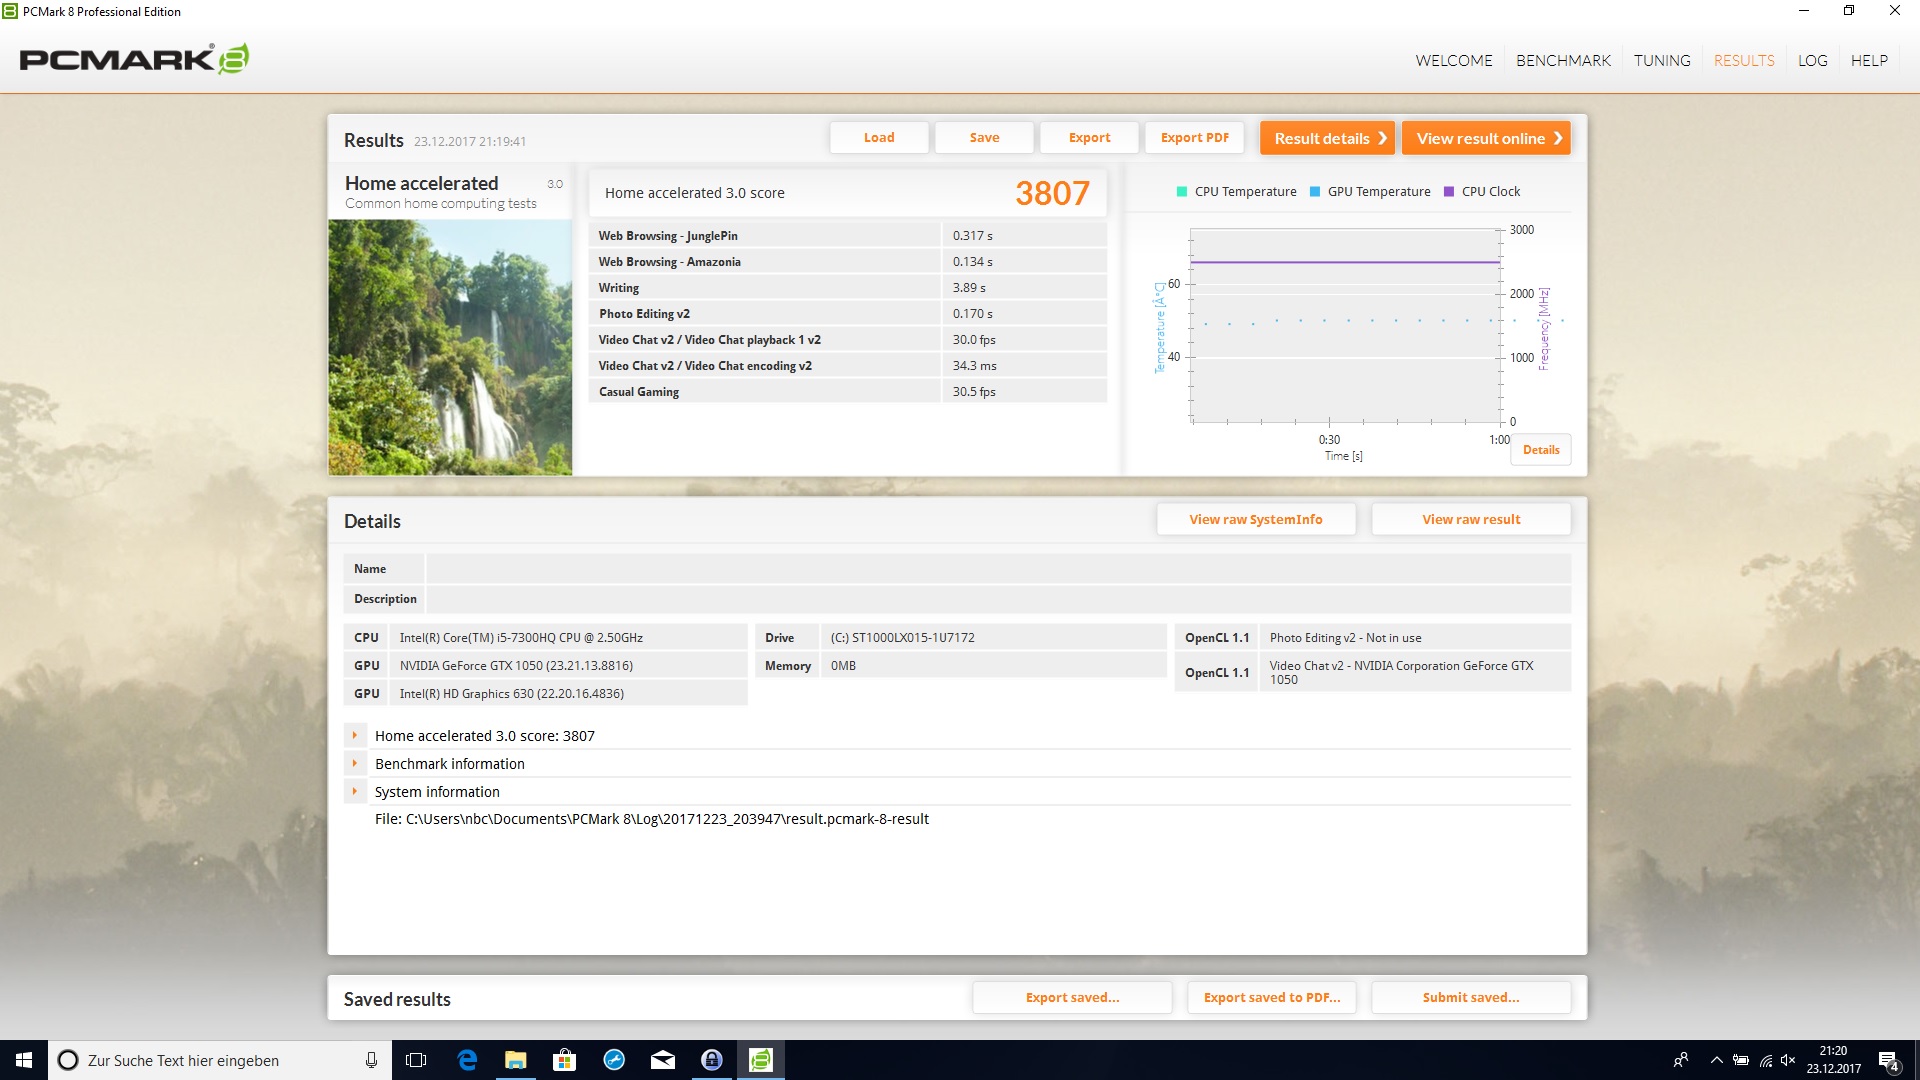
| Home Score Accelerated v2 | |
| MSI GL62M 7RD-077 | |
| Dell Inspiron 15 7000 7577 | |
| Dell Inspiron 15 7000 7577 | |
| Acer Aspire VX15 VX5-591G-589S | |
| Lenovo Legion Y520-15IKBN 80WK0042GE | |
| Work Score Accelerated v2 | |
| Dell Inspiron 15 7000 7577 | |
| Dell Inspiron 15 7000 7577 | |
| MSI GL62M 7RD-077 | |
| Lenovo Legion Y520-15IKBN 80WK0042GE | |
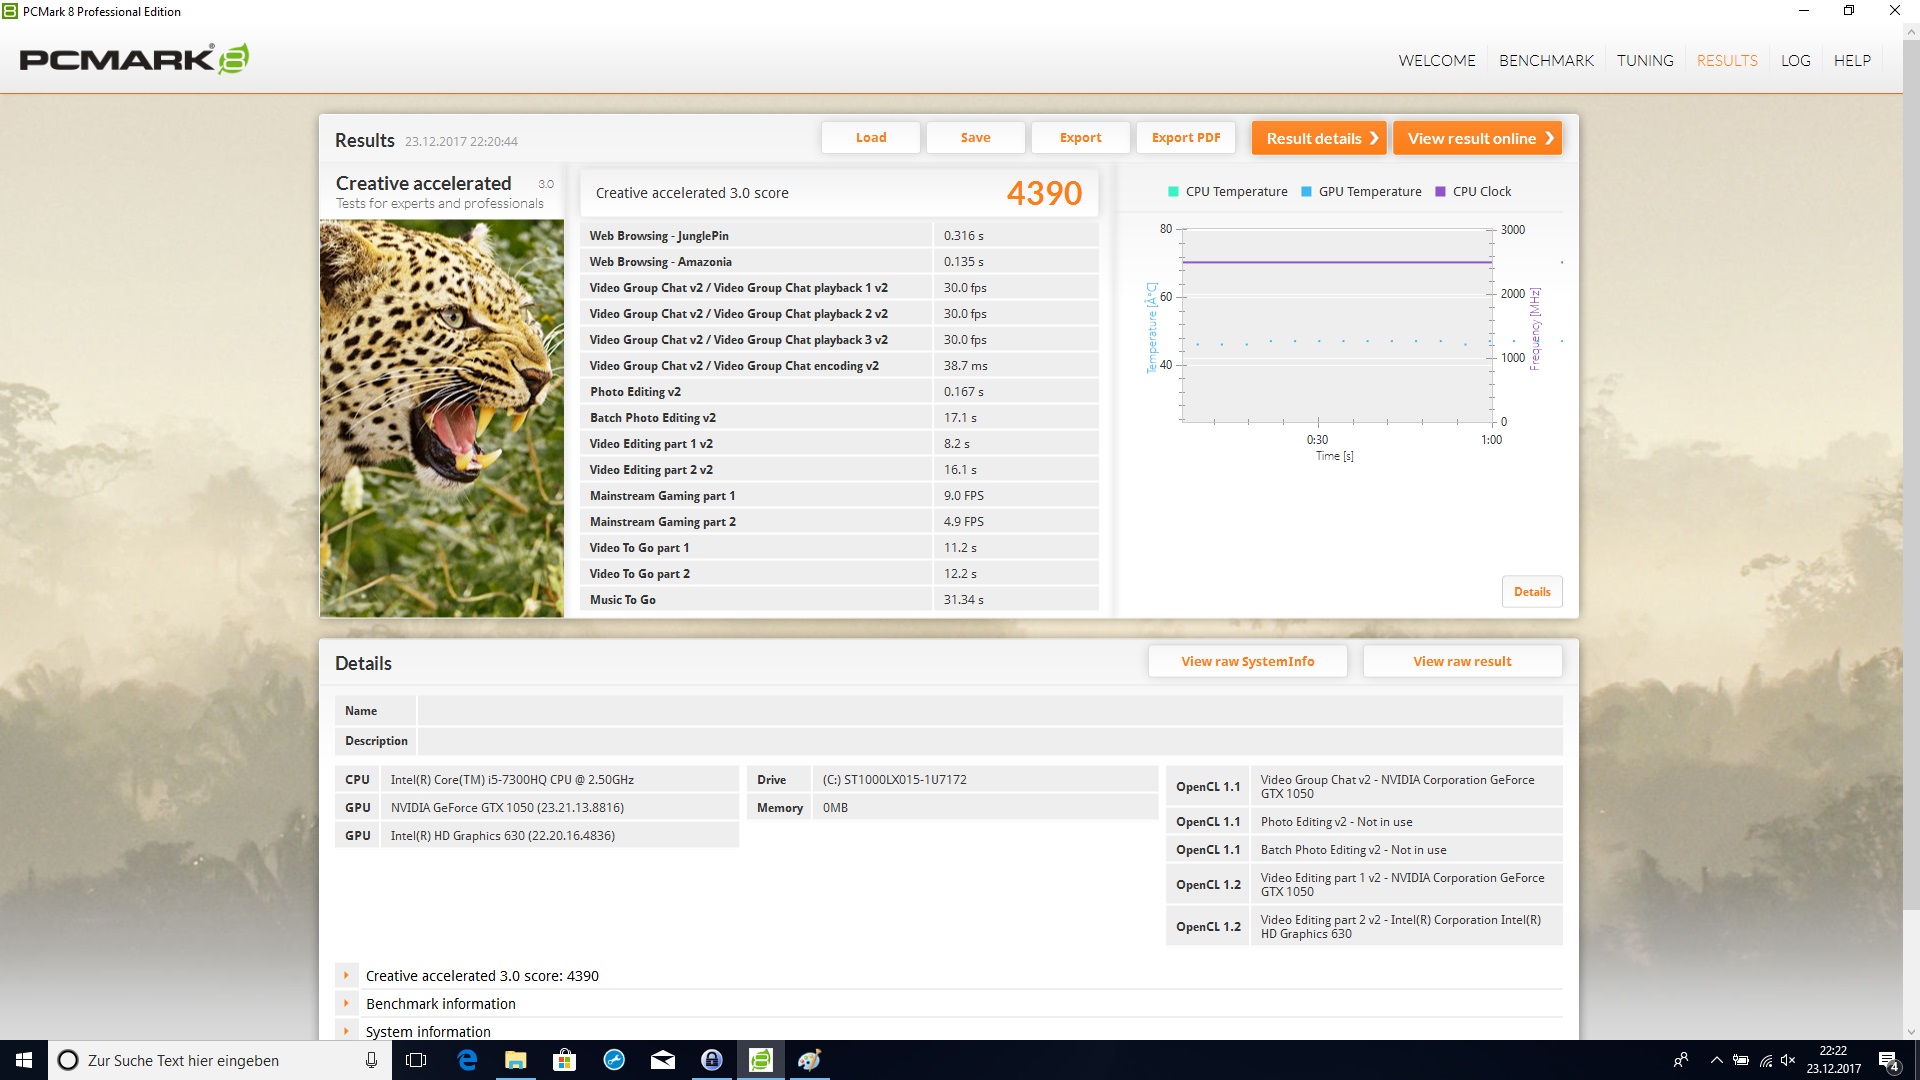
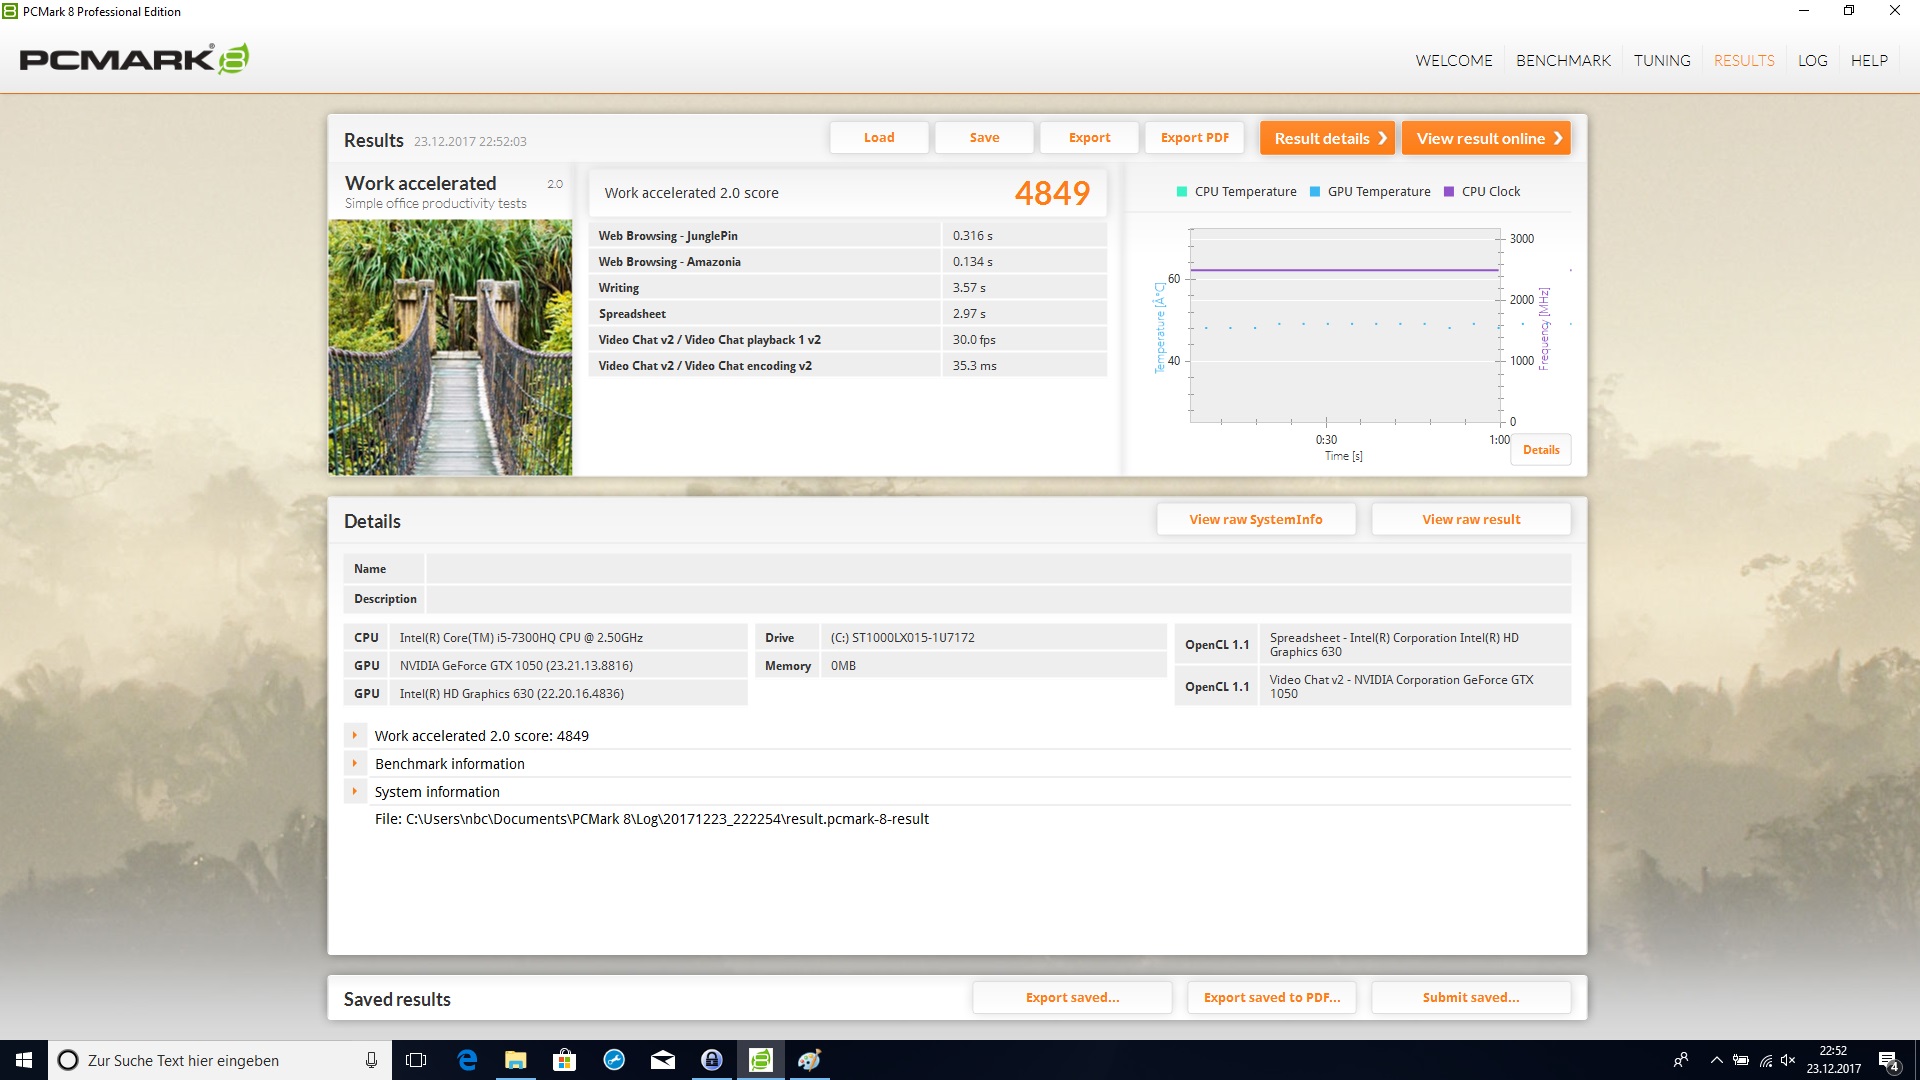
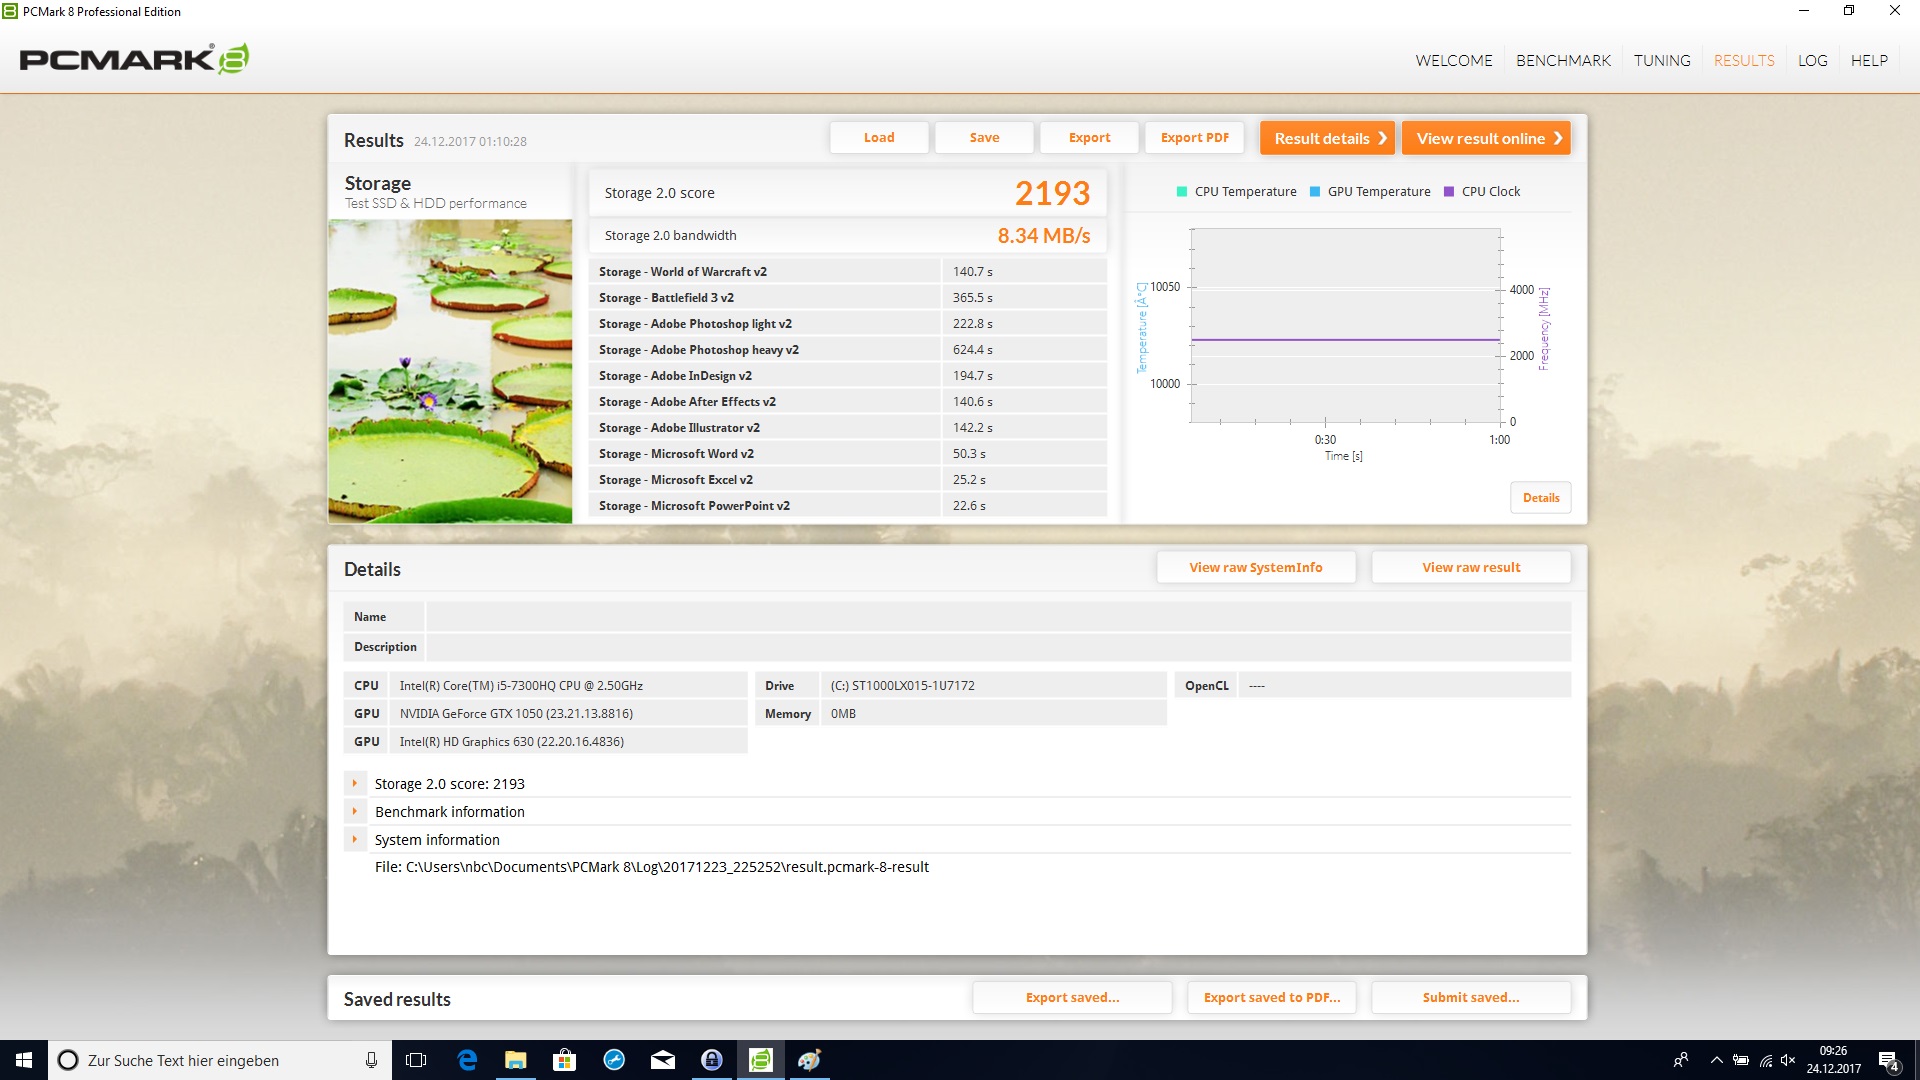
| PCMark 8 Home Score Accelerated v2 | 3807 punti | |
| PCMark 8 Creative Score Accelerated v2 | 4390 punti | |
| PCMark 8 Work Score Accelerated v2 | 4849 punti | |
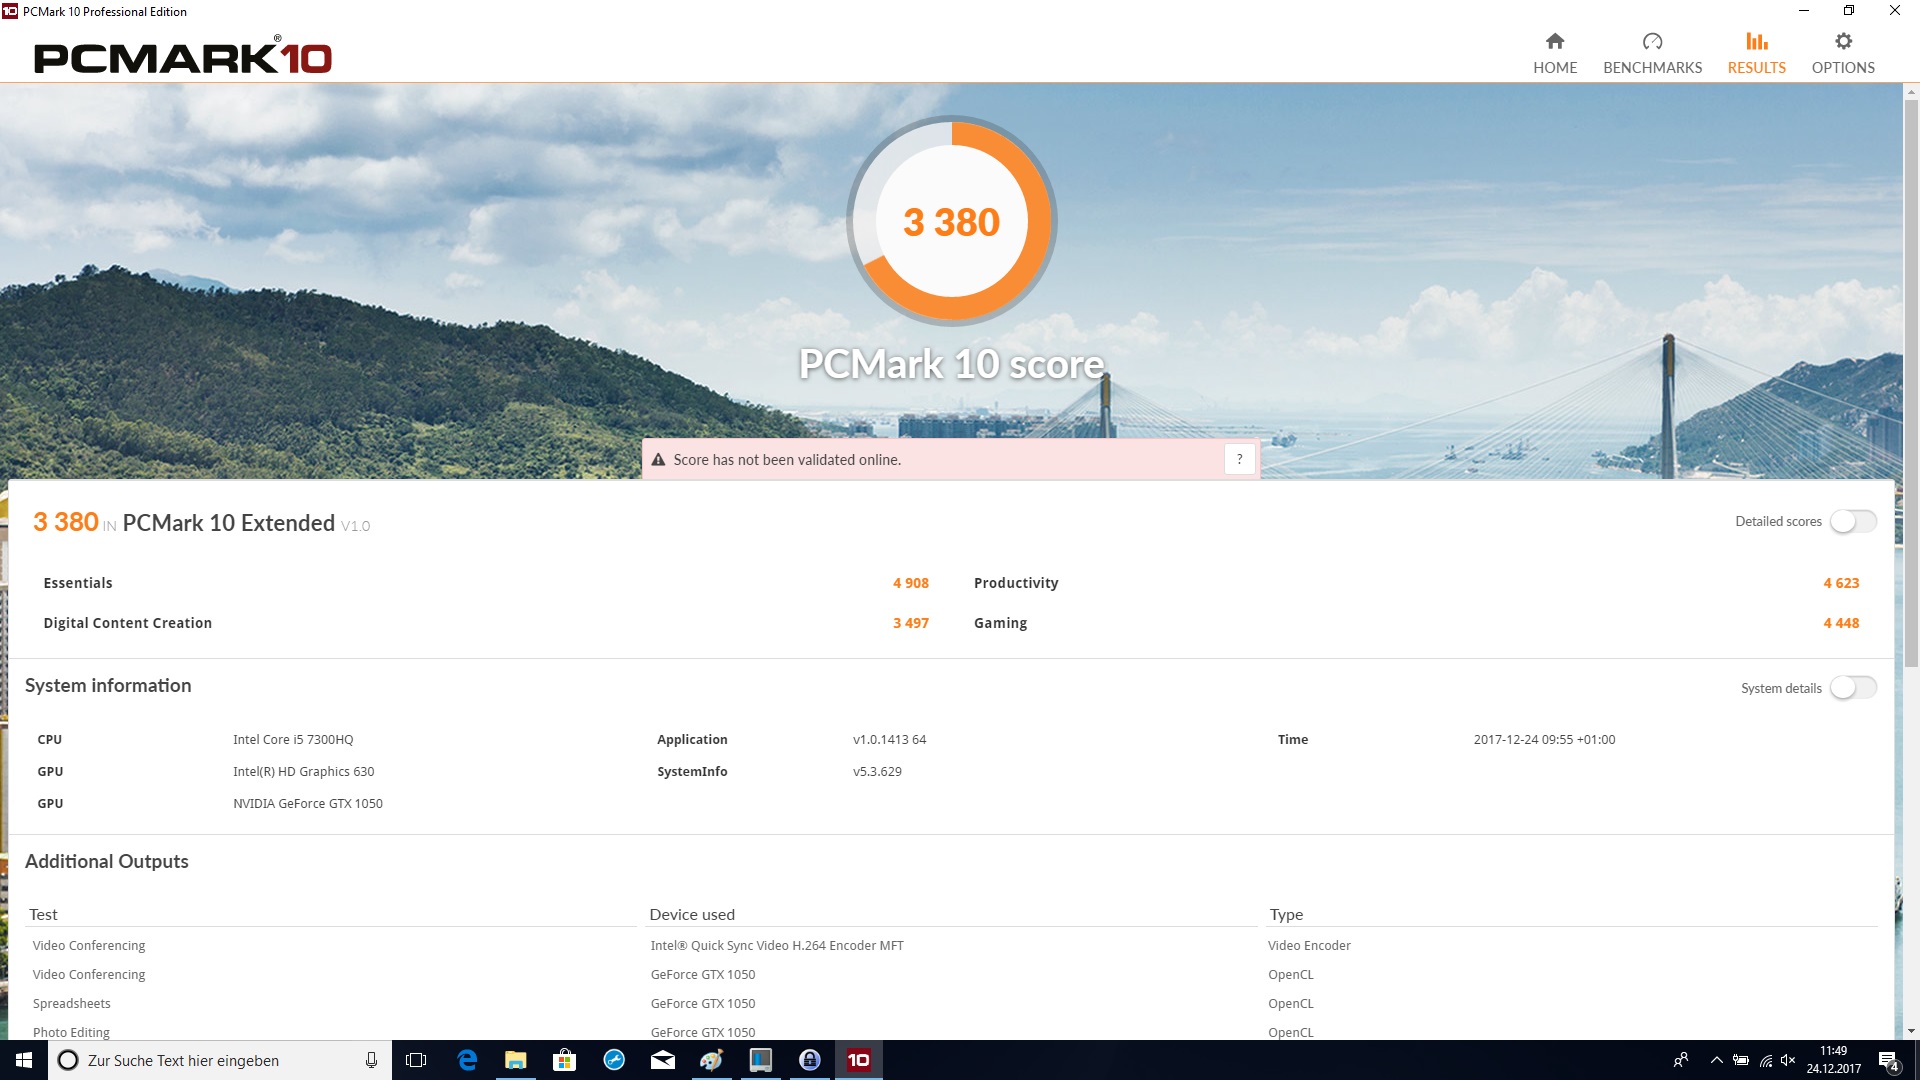
| PCMark 10 Score | 3380 punti | |
Aiuto | ||
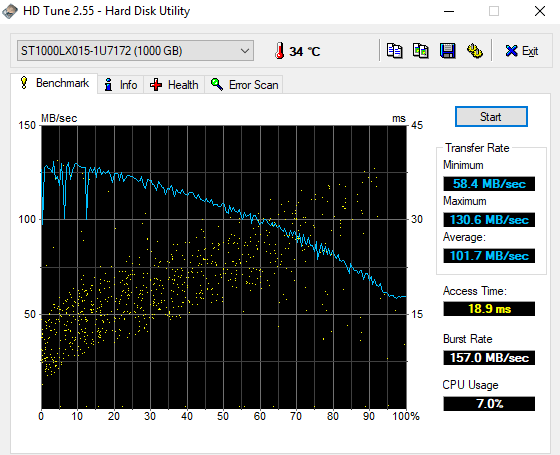
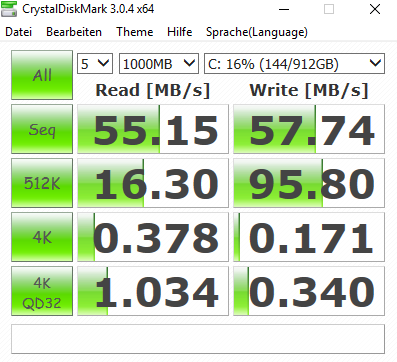
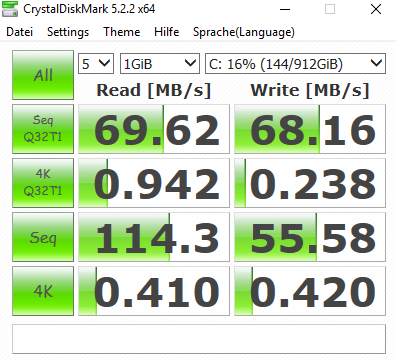
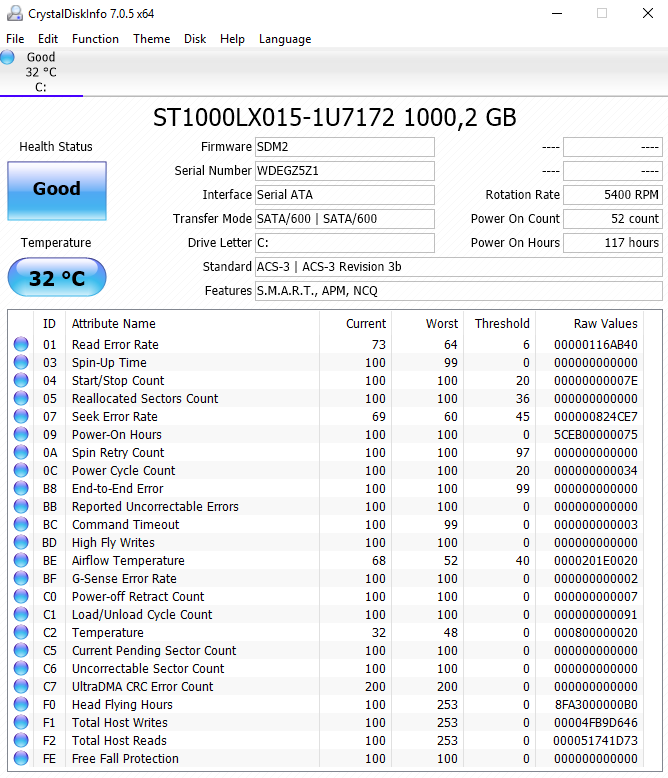
| Dell Inspiron 15 7000 7577 Seagate Mobile HDD 1TB ST1000LX015-1U7172 | Lenovo Legion Y520-15IKBN 80WK0042GE Samsung PM961 NVMe MZVLW128HEGR | Acer Aspire VX15 VX5-591G-589S Hynix HFS128G39TND | MSI GL62M 7RD-077 HGST Travelstar 7K1000 HTS721010A9E630 | |
|---|---|---|---|---|
| CrystalDiskMark 3.0 | 25854% | 18785% | 146% | |
| Read Seq (MB/s) | 55.2 | 2127 3753% | 510 824% | 112.4 104% |
| Write Seq (MB/s) | 57.7 | 796 1280% | 137.6 138% | 107.3 86% |
| Read 512 (MB/s) | 16.3 | 455.6 2695% | 362.1 2121% | 43.19 165% |
| Write 512 (MB/s) | 95.8 | 196.7 105% | 137.2 43% | 57 -41% |
| Read 4k (MB/s) | 0.378 | 46.07 12088% | 35.18 9207% | 0.494 31% |
| Write 4k (MB/s) | 0.171 | 154.8 90426% | 104.8 61187% | 1.122 556% |
| Read 4k QD32 (MB/s) | 1.034 | 480.9 46409% | 375.8 36244% | 1.088 5% |
| Write 4k QD32 (MB/s) | 0.34 | 170.6 50076% | 138.1 40518% | 1.234 263% |

| 3DMark | |
| 1280x720 Cloud Gate Standard Graphics | |
| Dell Inspiron 15 7000 7577 | |
| Lenovo Legion Y520-15IKBN 80WK0042GE | |
| MSI GL62M 7RD-077 | |
| Dell Inspiron 15 7000 7577 | |
| 1920x1080 Fire Strike Graphics | |
| Dell Inspiron 15 7000 7577 | |
| Lenovo Legion Y520-15IKBN 80WK0042GE | |
| MSI GL62M 7RD-077 | |
| Dell Inspiron 15 7000 7577 | |
| 3DMark 11 - 1280x720 Performance GPU | |
| Dell Inspiron 15 7000 7577 | |
| Lenovo Legion Y520-15IKBN 80WK0042GE | |
| MSI GL62M 7RD-077 | |
| Dell Inspiron 15 7000 7577 | |
| Acer Aspire VX15 VX5-591G-589S | |
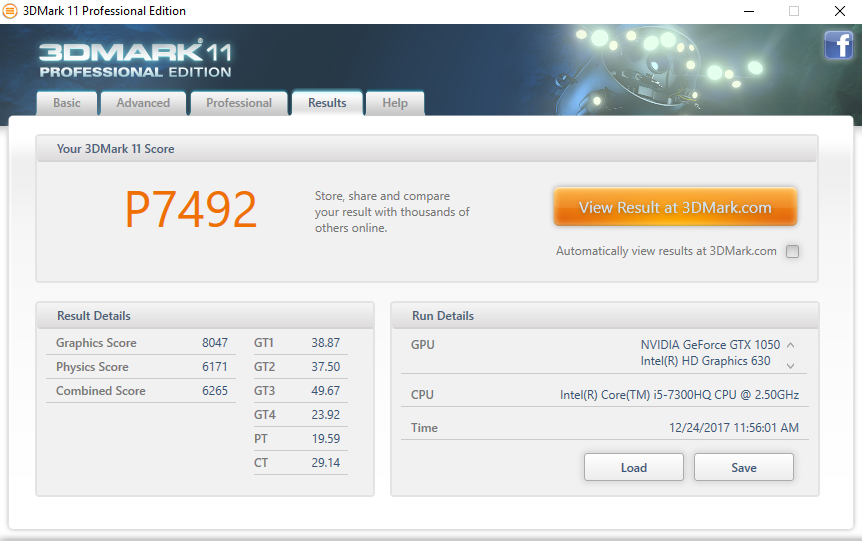
| 3DMark 11 Performance | 7492 punti | |
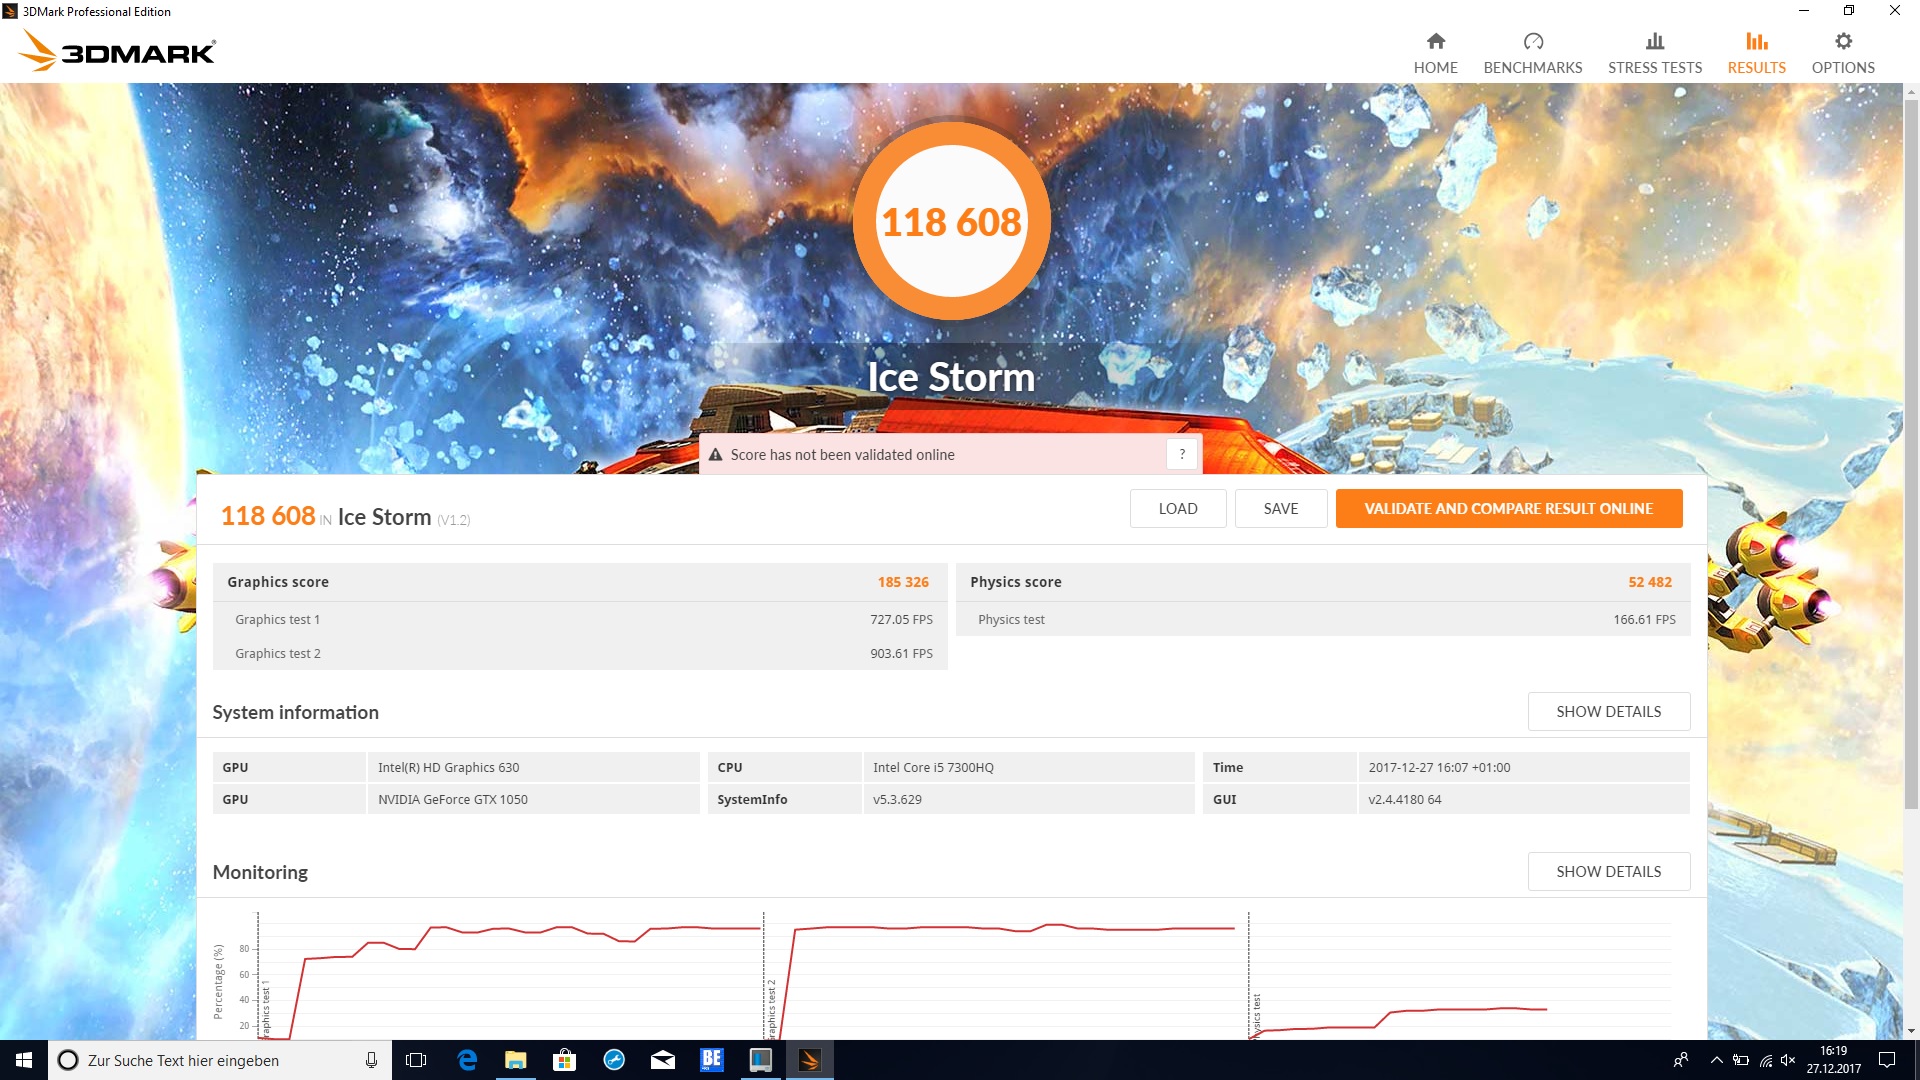
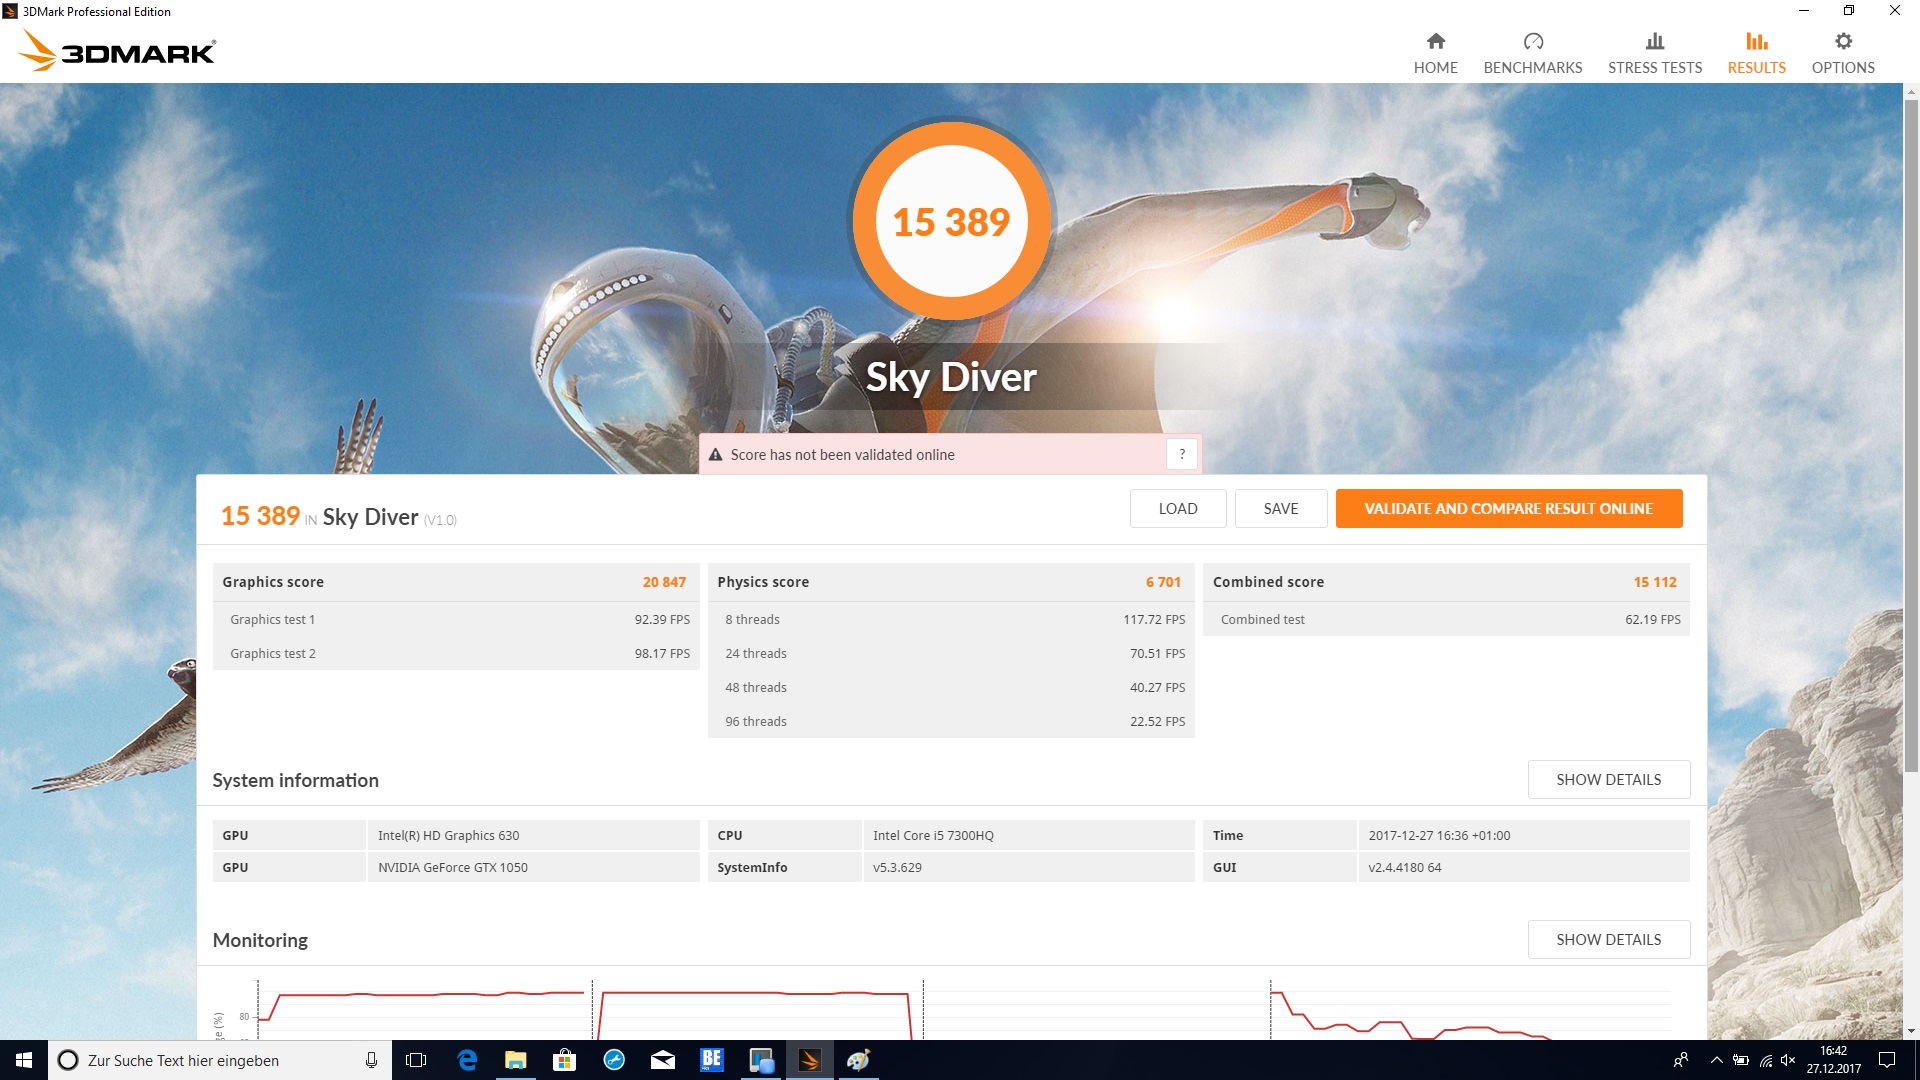
| 3DMark Ice Storm Standard Score | 118608 punti | |
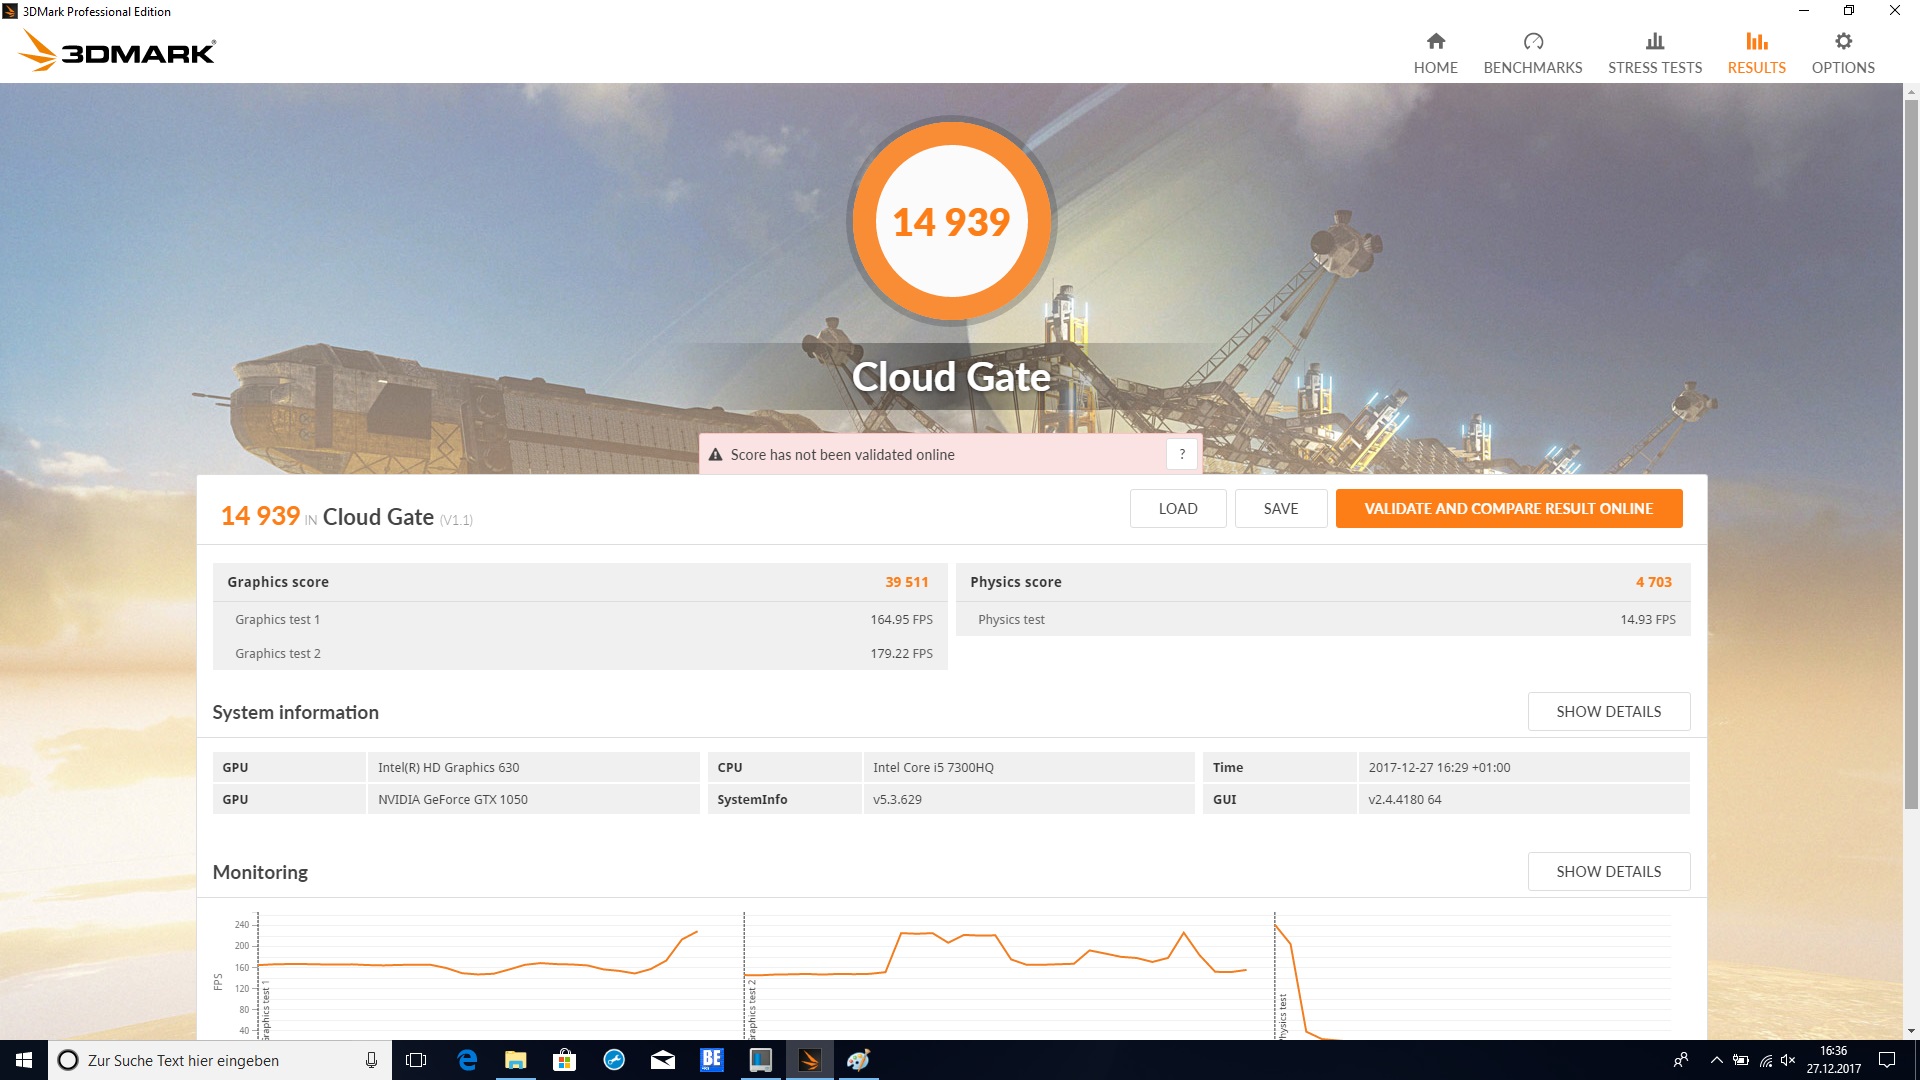
| 3DMark Cloud Gate Standard Score | 14939 punti | |
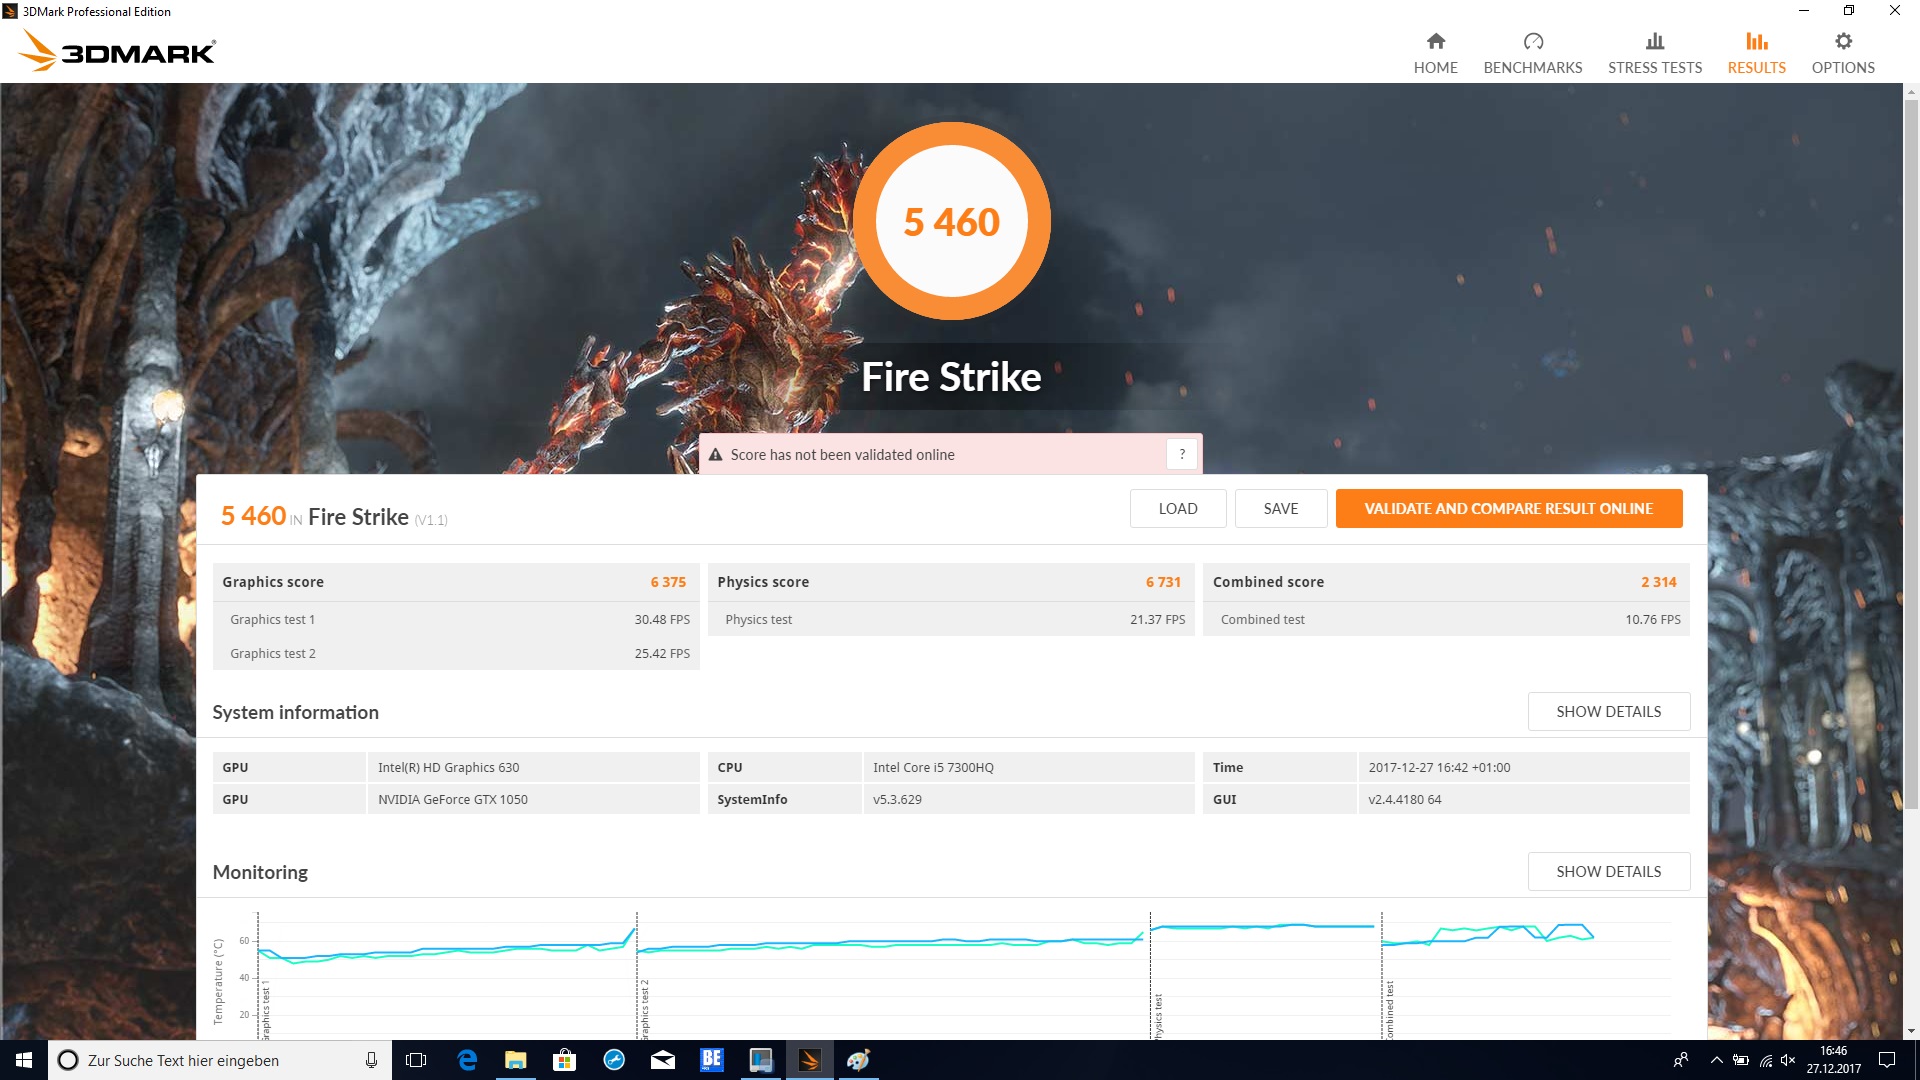
| 3DMark Fire Strike Score | 5460 punti | |
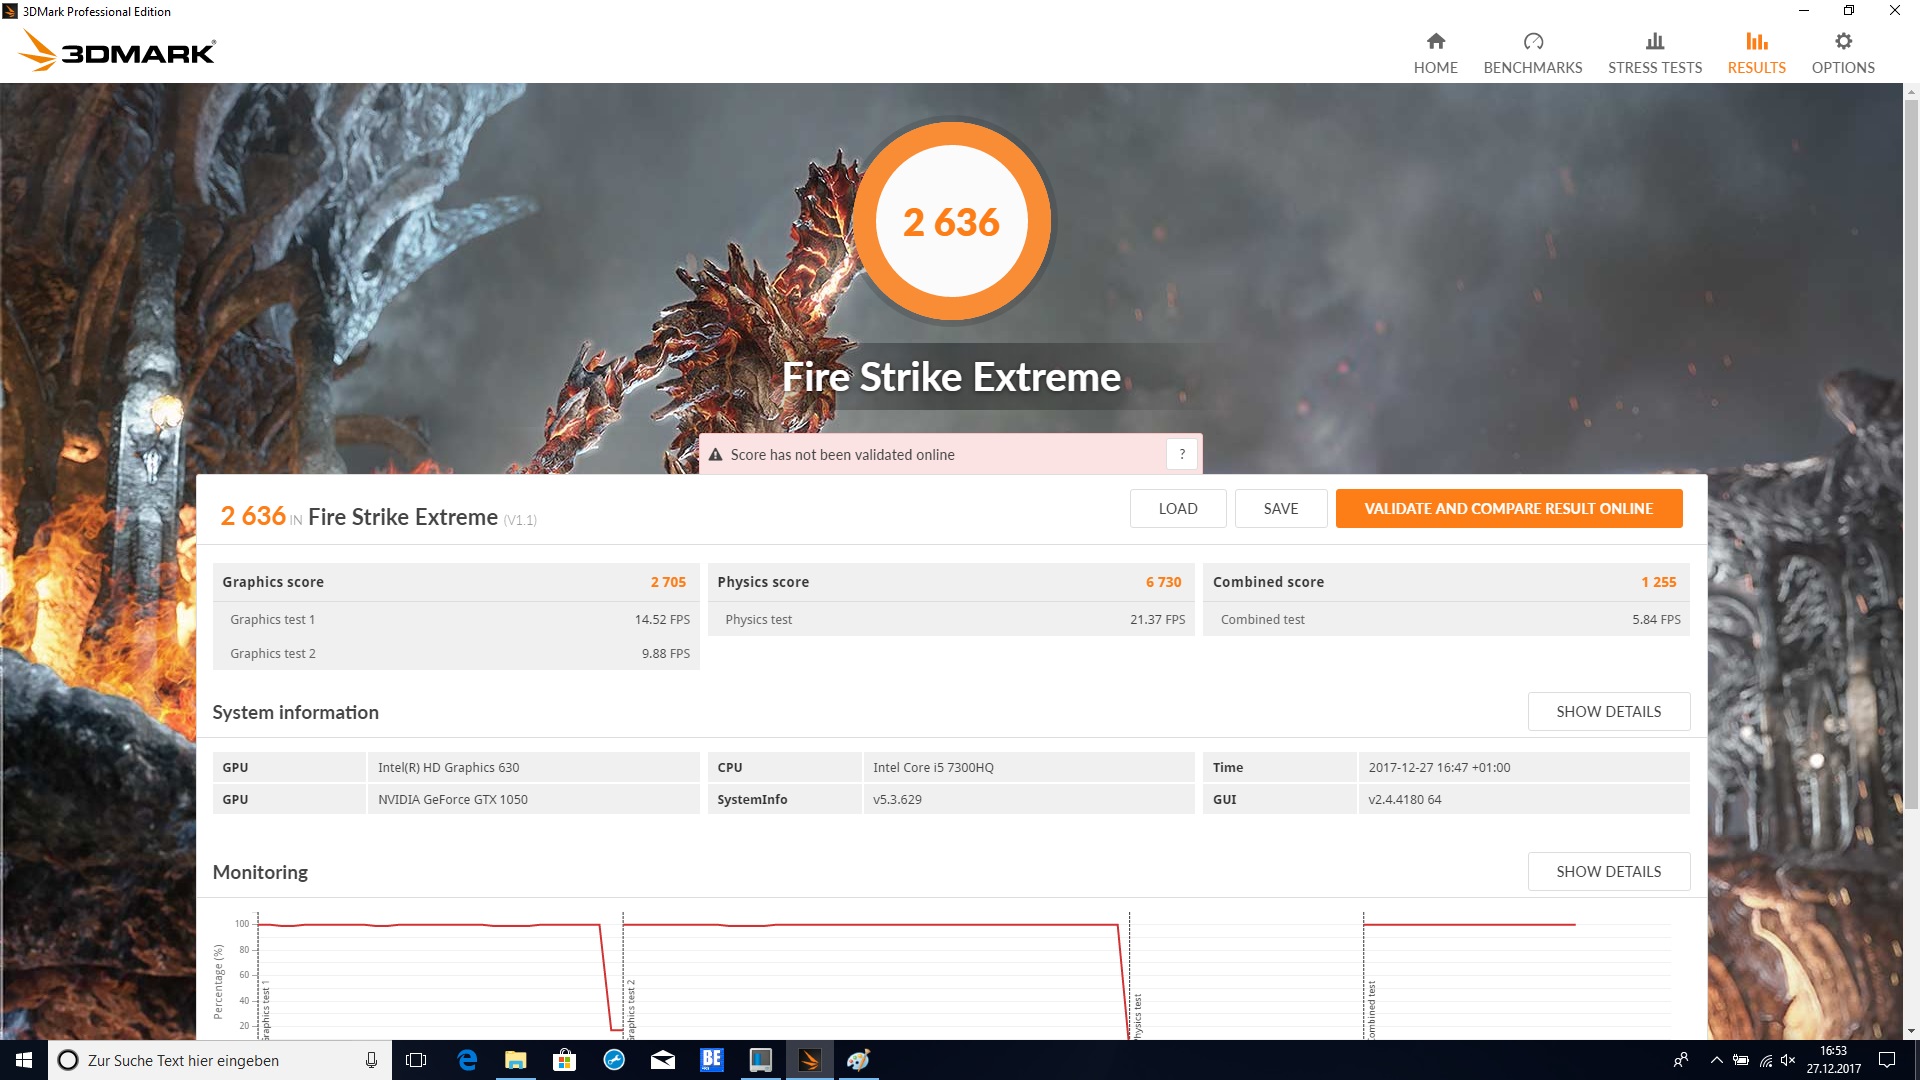
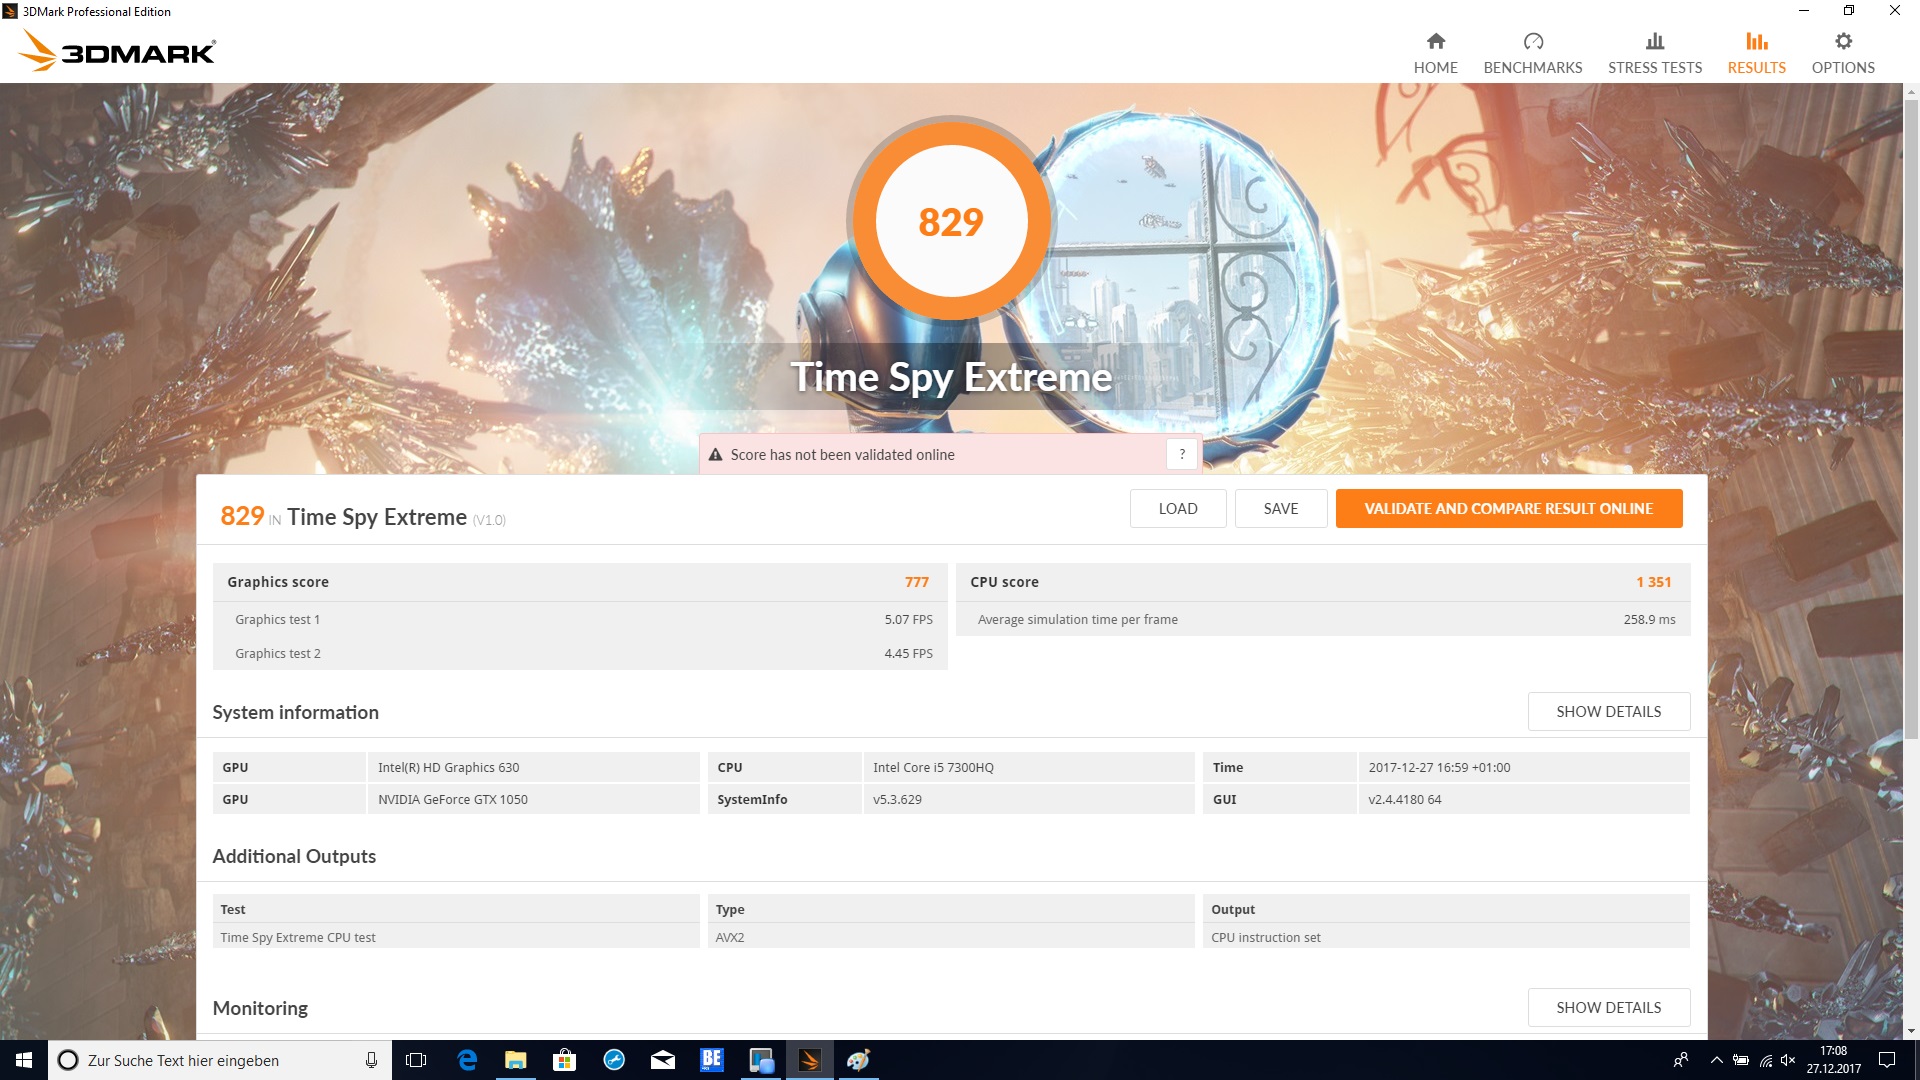
| 3DMark Fire Strike Extreme Score | 2636 punti | |
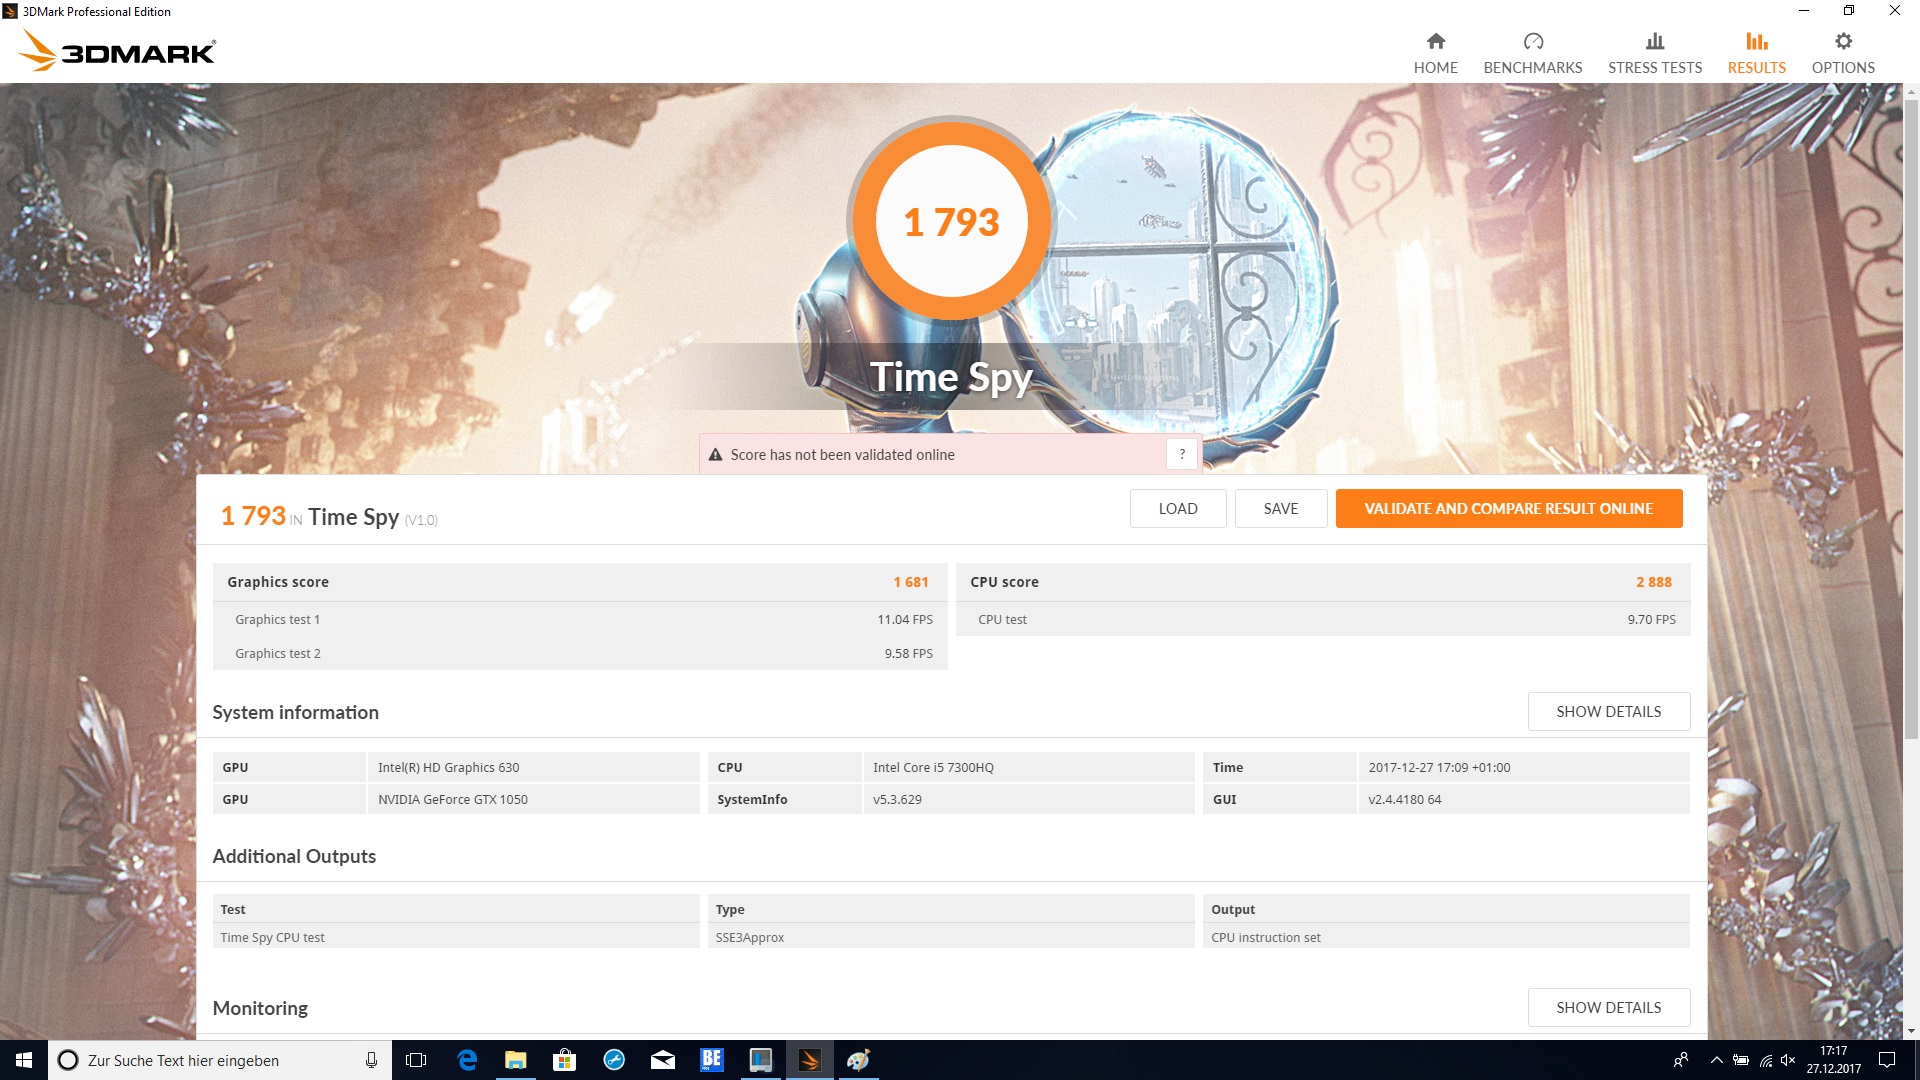
| 3DMark Time Spy Score | 1793 punti | |
Aiuto | ||
| basso | medio | alto | ultra | |
|---|---|---|---|---|
| BioShock Infinite (2013) | 217.4 | 158.3 | 146.6 | 64.3 |
| Battlefield 4 (2013) | 170 | 143.7 | 124.3 | 51.5 |
| The Witcher 3 (2015) | 115.1 | 72.9 | 41 | 22.6 |
| Rise of the Tomb Raider (2016) | 124.2 | 73.8 | 39.6 | 33.1 |
Rumorosità
| Idle |
| 32.7 / 32.7 / 32.7 dB(A) |
| HDD |
| 33 dB(A) |
| Sotto carico |
| 38.7 / 44.6 dB(A) |
 | ||
30 dB silenzioso 40 dB(A) udibile 50 dB(A) rumoroso |
||
min: | ||
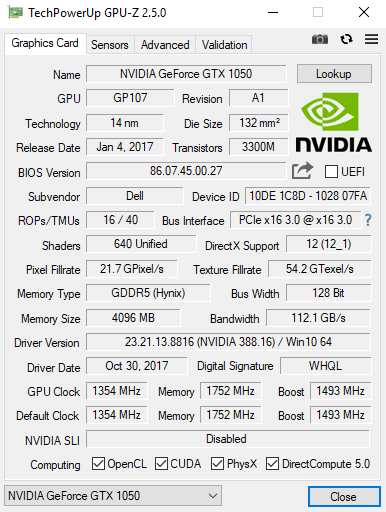
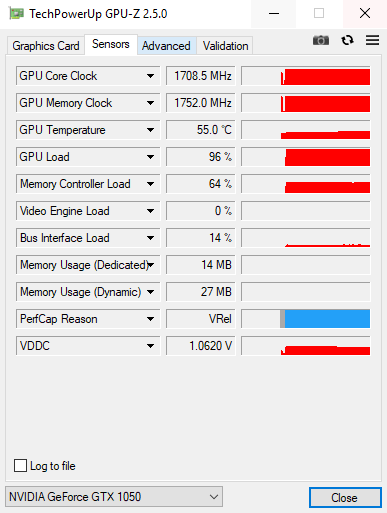
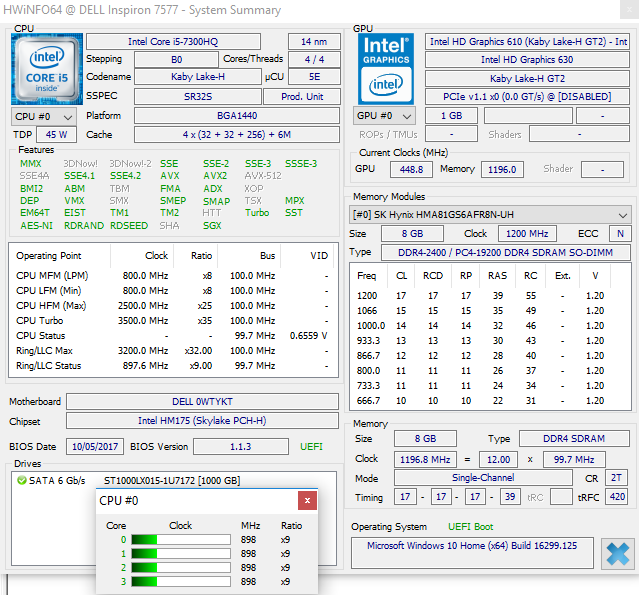
| Dell Inspiron 15 7000 7577 GeForce GTX 1050 Mobile, i5-7300HQ, Seagate Mobile HDD 1TB ST1000LX015-1U7172 | Dell Inspiron 15 7000 7577 GeForce GTX 1060 Max-Q, i5-7300HQ, Samsung PM961 MZVLW256HEHP | Lenovo Legion Y520-15IKBN 80WK0042GE GeForce GTX 1050 Ti Mobile, i5-7300HQ, Samsung PM961 NVMe MZVLW128HEGR | Acer Aspire VX15 VX5-591G-589S GeForce GTX 1050 Mobile, i5-7300HQ, Hynix HFS128G39TND | MSI GL62M 7RD-077 GeForce GTX 1050 Mobile, i7-7700HQ, HGST Travelstar 7K1000 HTS721010A9E630 | |
|---|---|---|---|---|---|
| Noise | 10% | 3% | 9% | -1% | |
| off /ambiente * (dB) | 31 | 28 10% | 30.6 1% | 30 3% | 30.6 1% |
| Idle Minimum * (dB) | 32.7 | 28 14% | 31.9 2% | 30 8% | 32.5 1% |
| Idle Average * (dB) | 32.7 | 28 14% | 31.9 2% | 30 8% | 32.5 1% |
| Idle Maximum * (dB) | 32.7 | 28 14% | 31.9 2% | 31.1 5% | 32.5 1% |
| Load Average * (dB) | 38.7 | 30.3 22% | 34.6 11% | 31.3 19% | 36.4 6% |
| Witcher 3 ultra * (dB) | 39 | 39.5 -1% | 39.3 -1% | ||
| Load Maximum * (dB) | 44.6 | 46.5 -4% | 41.7 7% | 38.9 13% | 52.4 -17% |
* ... Meglio usare valori piccoli
(+) La temperatura massima sul lato superiore è di 35.9 °C / 97 F, rispetto alla media di 40.4 °C / 105 F, che varia da 21.2 a 68.8 °C per questa classe Gaming.
(±) Il lato inferiore si riscalda fino ad un massimo di 41.6 °C / 107 F, rispetto alla media di 43.2 °C / 110 F
(+) In idle, la temperatura media del lato superiore è di 26.4 °C / 80 F, rispetto alla media deld ispositivo di 33.9 °C / 93 F.
(+) Riproducendo The Witcher 3, la temperatura media per il lato superiore e' di 28.4 °C / 83 F, rispetto alla media del dispositivo di 33.9 °C / 93 F.
(+) I poggiapolsi e il touchpad sono piu' freddi della temperatura della pelle con un massimo di 29.1 °C / 84.4 F e sono quindi freddi al tatto.
(±) La temperatura media della zona del palmo della mano di dispositivi simili e'stata di 28.8 °C / 83.8 F (-0.3 °C / -0.6 F).
| Dell Inspiron 15 7000 7577 GeForce GTX 1050 Mobile, i5-7300HQ, Seagate Mobile HDD 1TB ST1000LX015-1U7172 | Dell Inspiron 15 7000 7577 GeForce GTX 1060 Max-Q, i5-7300HQ, Samsung PM961 MZVLW256HEHP | Lenovo Legion Y520-15IKBN 80WK0042GE GeForce GTX 1050 Ti Mobile, i5-7300HQ, Samsung PM961 NVMe MZVLW128HEGR | Acer Aspire VX15 VX5-591G-589S GeForce GTX 1050 Mobile, i5-7300HQ, Hynix HFS128G39TND | MSI GL62M 7RD-077 GeForce GTX 1050 Mobile, i7-7700HQ, HGST Travelstar 7K1000 HTS721010A9E630 | |
|---|---|---|---|---|---|
| Heat | -3% | 11% | -11% | -3% | |
| Maximum Upper Side * (°C) | 35.9 | 44 -23% | 39.6 -10% | 47.2 -31% | 44.9 -25% |
| Maximum Bottom * (°C) | 41.6 | 43.8 -5% | 38.4 8% | 42.2 -1% | 38.2 8% |
| Idle Upper Side * (°C) | 27.9 | 26 7% | 22.8 18% | 31.8 -14% | 27.4 2% |
| Idle Bottom * (°C) | 30.5 | 28 8% | 22.1 28% | 29.5 3% | 29 5% |
* ... Meglio usare valori piccoli
Dell Inspiron 15 7000 7577 analisi audio
(-) | altoparlanti non molto potenti (71.9 dB)
Bassi 100 - 315 Hz
(±) | bassi ridotti - in media 9.3% inferiori alla media
(+) | bassi in lineaa (6.1% delta rispetto alla precedente frequenza)
Medi 400 - 2000 Hz
(±) | medi elevati - circa 6.1% superiore alla media
(+) | medi lineari (5.7% delta rispetto alla precedente frequenza)
Alti 2 - 16 kHz
(±) | alti elevati - circa 6% superiori alla media
(±) | la linearità degli alti è media (10.4% delta rispetto alla precedente frequenza)
Nel complesso 100 - 16.000 Hz
(±) | la linearità complessiva del suono è media (19% di differenza rispetto alla media
Rispetto alla stessa classe
» 63% di tutti i dispositivi testati in questa classe è stato migliore, 8% simile, 29% peggiore
» Il migliore ha avuto un delta di 6%, medio di 18%, peggiore di 132%
Rispetto a tutti i dispositivi testati
» 45% di tutti i dispositivi testati in questa classe è stato migliore, 7% similare, 48% peggiore
» Il migliore ha avuto un delta di 4%, medio di 24%, peggiore di 134%
Lenovo Legion Y520-15IKBN 80WK0042GE analisi audio
(-) | altoparlanti non molto potenti (65.8 dB)
Bassi 100 - 315 Hz
(-) | quasi nessun basso - in media 16.9% inferiori alla media
(±) | la linearità dei bassi è media (13.9% delta rispetto alla precedente frequenza)
Medi 400 - 2000 Hz
(+) | medi bilanciati - solo only 4.6% rispetto alla media
(±) | linearità dei medi adeguata (8.8% delta rispetto alla precedente frequenza)
Alti 2 - 16 kHz
(+) | Alti bilanciati - appena 3.6% dalla media
(±) | la linearità degli alti è media (12.7% delta rispetto alla precedente frequenza)
Nel complesso 100 - 16.000 Hz
(±) | la linearità complessiva del suono è media (22.6% di differenza rispetto alla media
Rispetto alla stessa classe
» 81% di tutti i dispositivi testati in questa classe è stato migliore, 5% simile, 14% peggiore
» Il migliore ha avuto un delta di 6%, medio di 18%, peggiore di 132%
Rispetto a tutti i dispositivi testati
» 67% di tutti i dispositivi testati in questa classe è stato migliore, 6% similare, 28% peggiore
» Il migliore ha avuto un delta di 4%, medio di 24%, peggiore di 134%
| Off / Standby | |
| Idle | |
| Sotto carico |
|
Leggenda:
min: | |
| Dell Inspiron 15 7000 7577 i5-7300HQ, GeForce GTX 1050 Mobile, Seagate Mobile HDD 1TB ST1000LX015-1U7172, IPS, 1920x1080, 15.6" | Dell Inspiron 15 7000 7577 i5-7300HQ, GeForce GTX 1060 Max-Q, Samsung PM961 MZVLW256HEHP, IPS, 1920x1080, 15.6" | Lenovo Legion Y520-15IKBN 80WK0042GE i5-7300HQ, GeForce GTX 1050 Ti Mobile, Samsung PM961 NVMe MZVLW128HEGR, IPS, 1920x1080, 15.6" | Acer Aspire VX15 VX5-591G-589S i5-7300HQ, GeForce GTX 1050 Mobile, Hynix HFS128G39TND, IPS, 1920x1080, 15.6" | MSI GL62M 7RD-077 i7-7700HQ, GeForce GTX 1050 Mobile, HGST Travelstar 7K1000 HTS721010A9E630, TN LED, 1920x1080, 15.6" | |
|---|---|---|---|---|---|
| Power Consumption | 4% | 7% | -21% | -47% | |
| Idle Minimum * (Watt) | 5.3 | 7.1 -34% | 5.2 2% | 8.4 -58% | 10.6 -100% |
| Idle Average * (Watt) | 8.8 | 7.6 14% | 8.3 6% | 13.1 -49% | 14.5 -65% |
| Idle Maximum * (Watt) | 9.7 | 8.6 11% | 10.1 -4% | 14.2 -46% | 15 -55% |
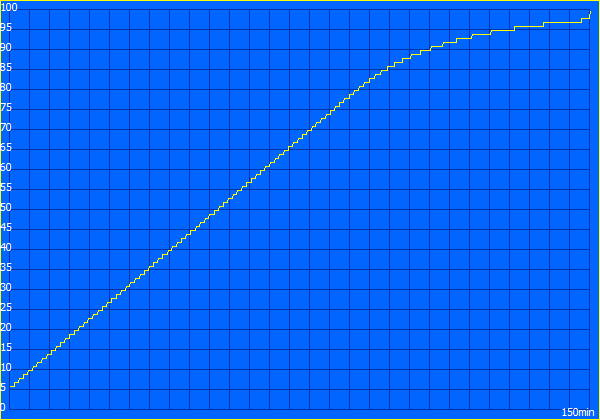
| Load Average * (Watt) | 100 | 59.5 40% | 62.7 37% | 50 50% | 90 10% |
| Witcher 3 ultra * (Watt) | 87 | 89 -2% | 94 -8% | ||
| Load Maximum * (Watt) | 109 | 112.8 -3% | 100 8% | 111 -2% | 135 -24% |
* ... Meglio usare valori piccoli

| Dell Inspiron 15 7000 7577 i5-7300HQ, GeForce GTX 1050 Mobile, 56 Wh | Dell Inspiron 15 7000 7577 i5-7300HQ, GeForce GTX 1060 Max-Q, 56 Wh | Lenovo Legion Y520-15IKBN 80WK0042GE i5-7300HQ, GeForce GTX 1050 Ti Mobile, 45 Wh | Acer Aspire VX15 VX5-591G-589S i5-7300HQ, GeForce GTX 1050 Mobile, 52.5 Wh | MSI GL62M 7RD-077 i7-7700HQ, GeForce GTX 1050 Mobile, 41 Wh | |
|---|---|---|---|---|---|
| Autonomia della batteria | -4% | -16% | -19% | -44% | |
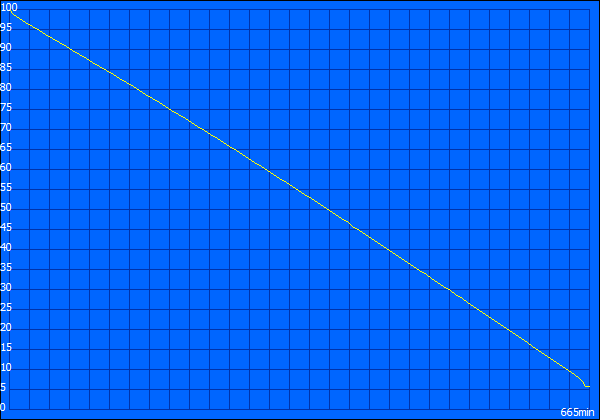
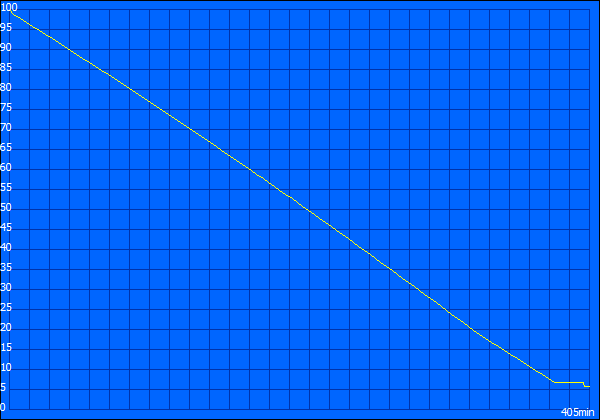
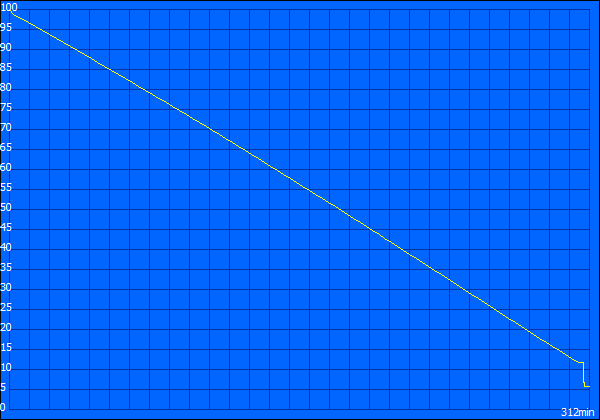
| Reader / Idle (h) | 11.1 | 11 -1% | 10.6 -5% | 6.5 -41% | |
| H.264 (h) | 5.2 | 4.5 -13% | 3.6 -31% | ||
| WiFi v1.3 (h) | 6.8 | 6.9 1% | 5.2 -24% | 5.5 -19% | 3.8 -44% |
| Load (h) | 1.8 | 1.6 -11% | 1.4 -22% | 0.7 -61% |
Pro
Contro
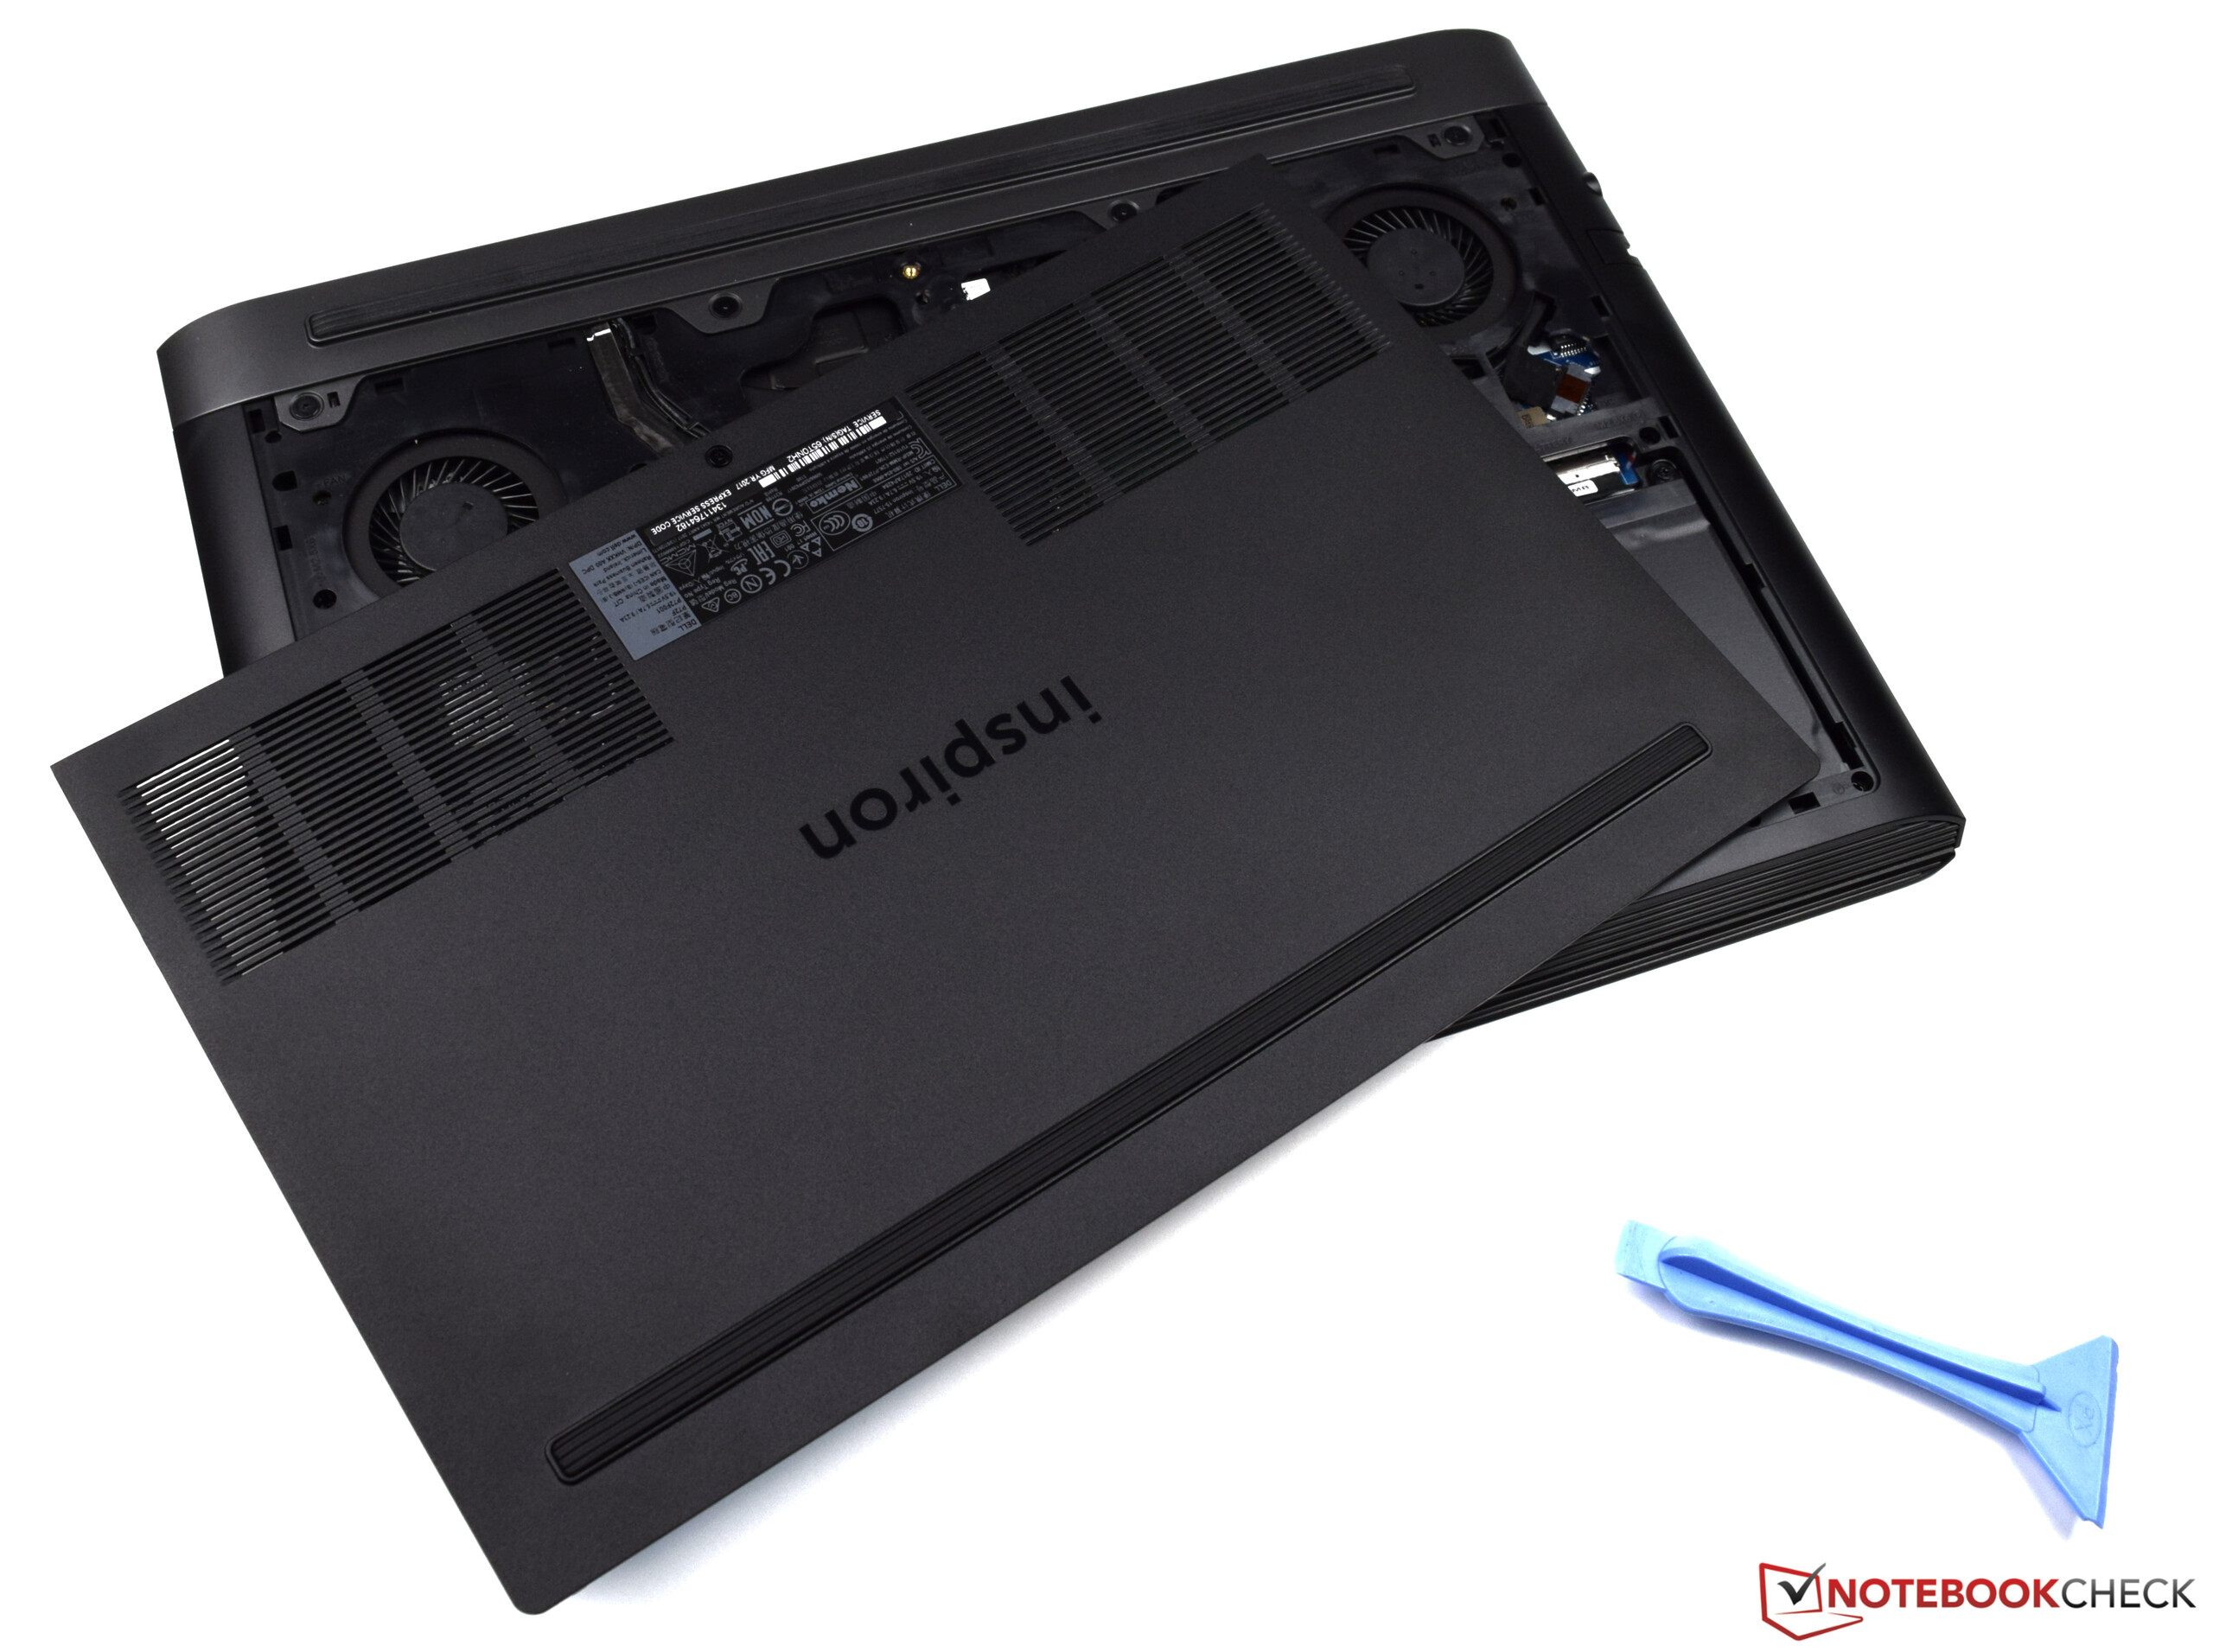
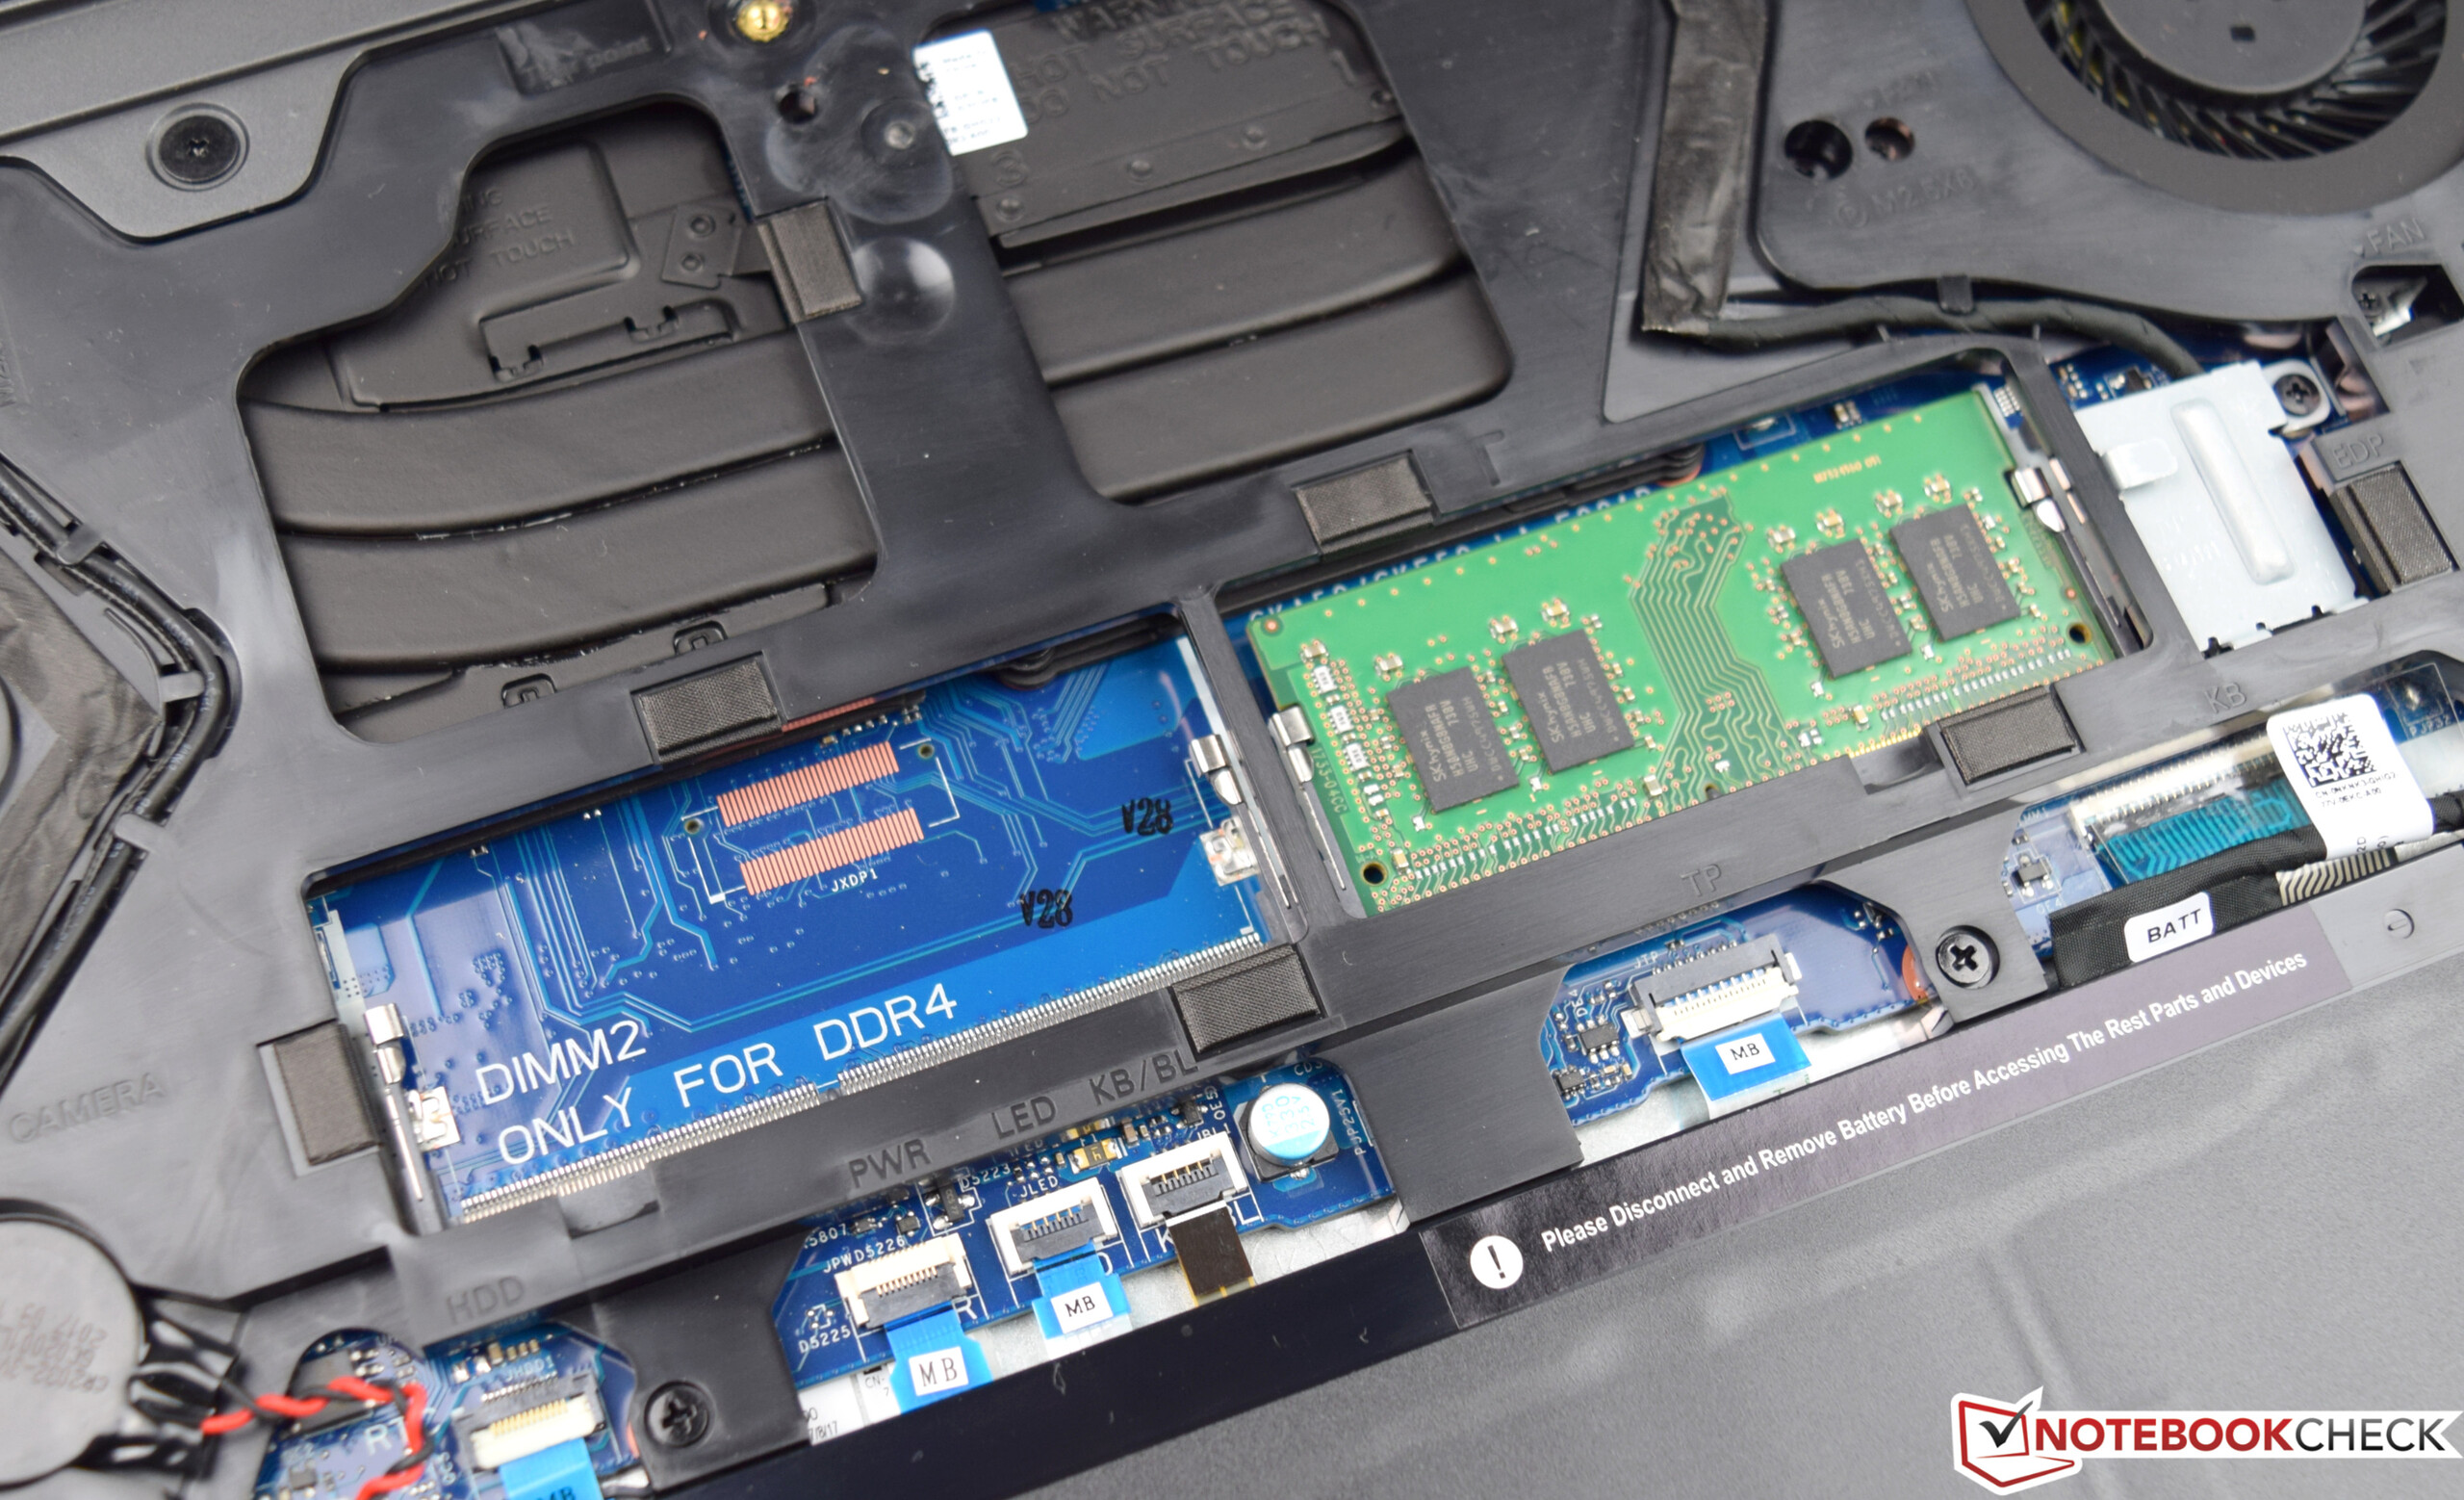
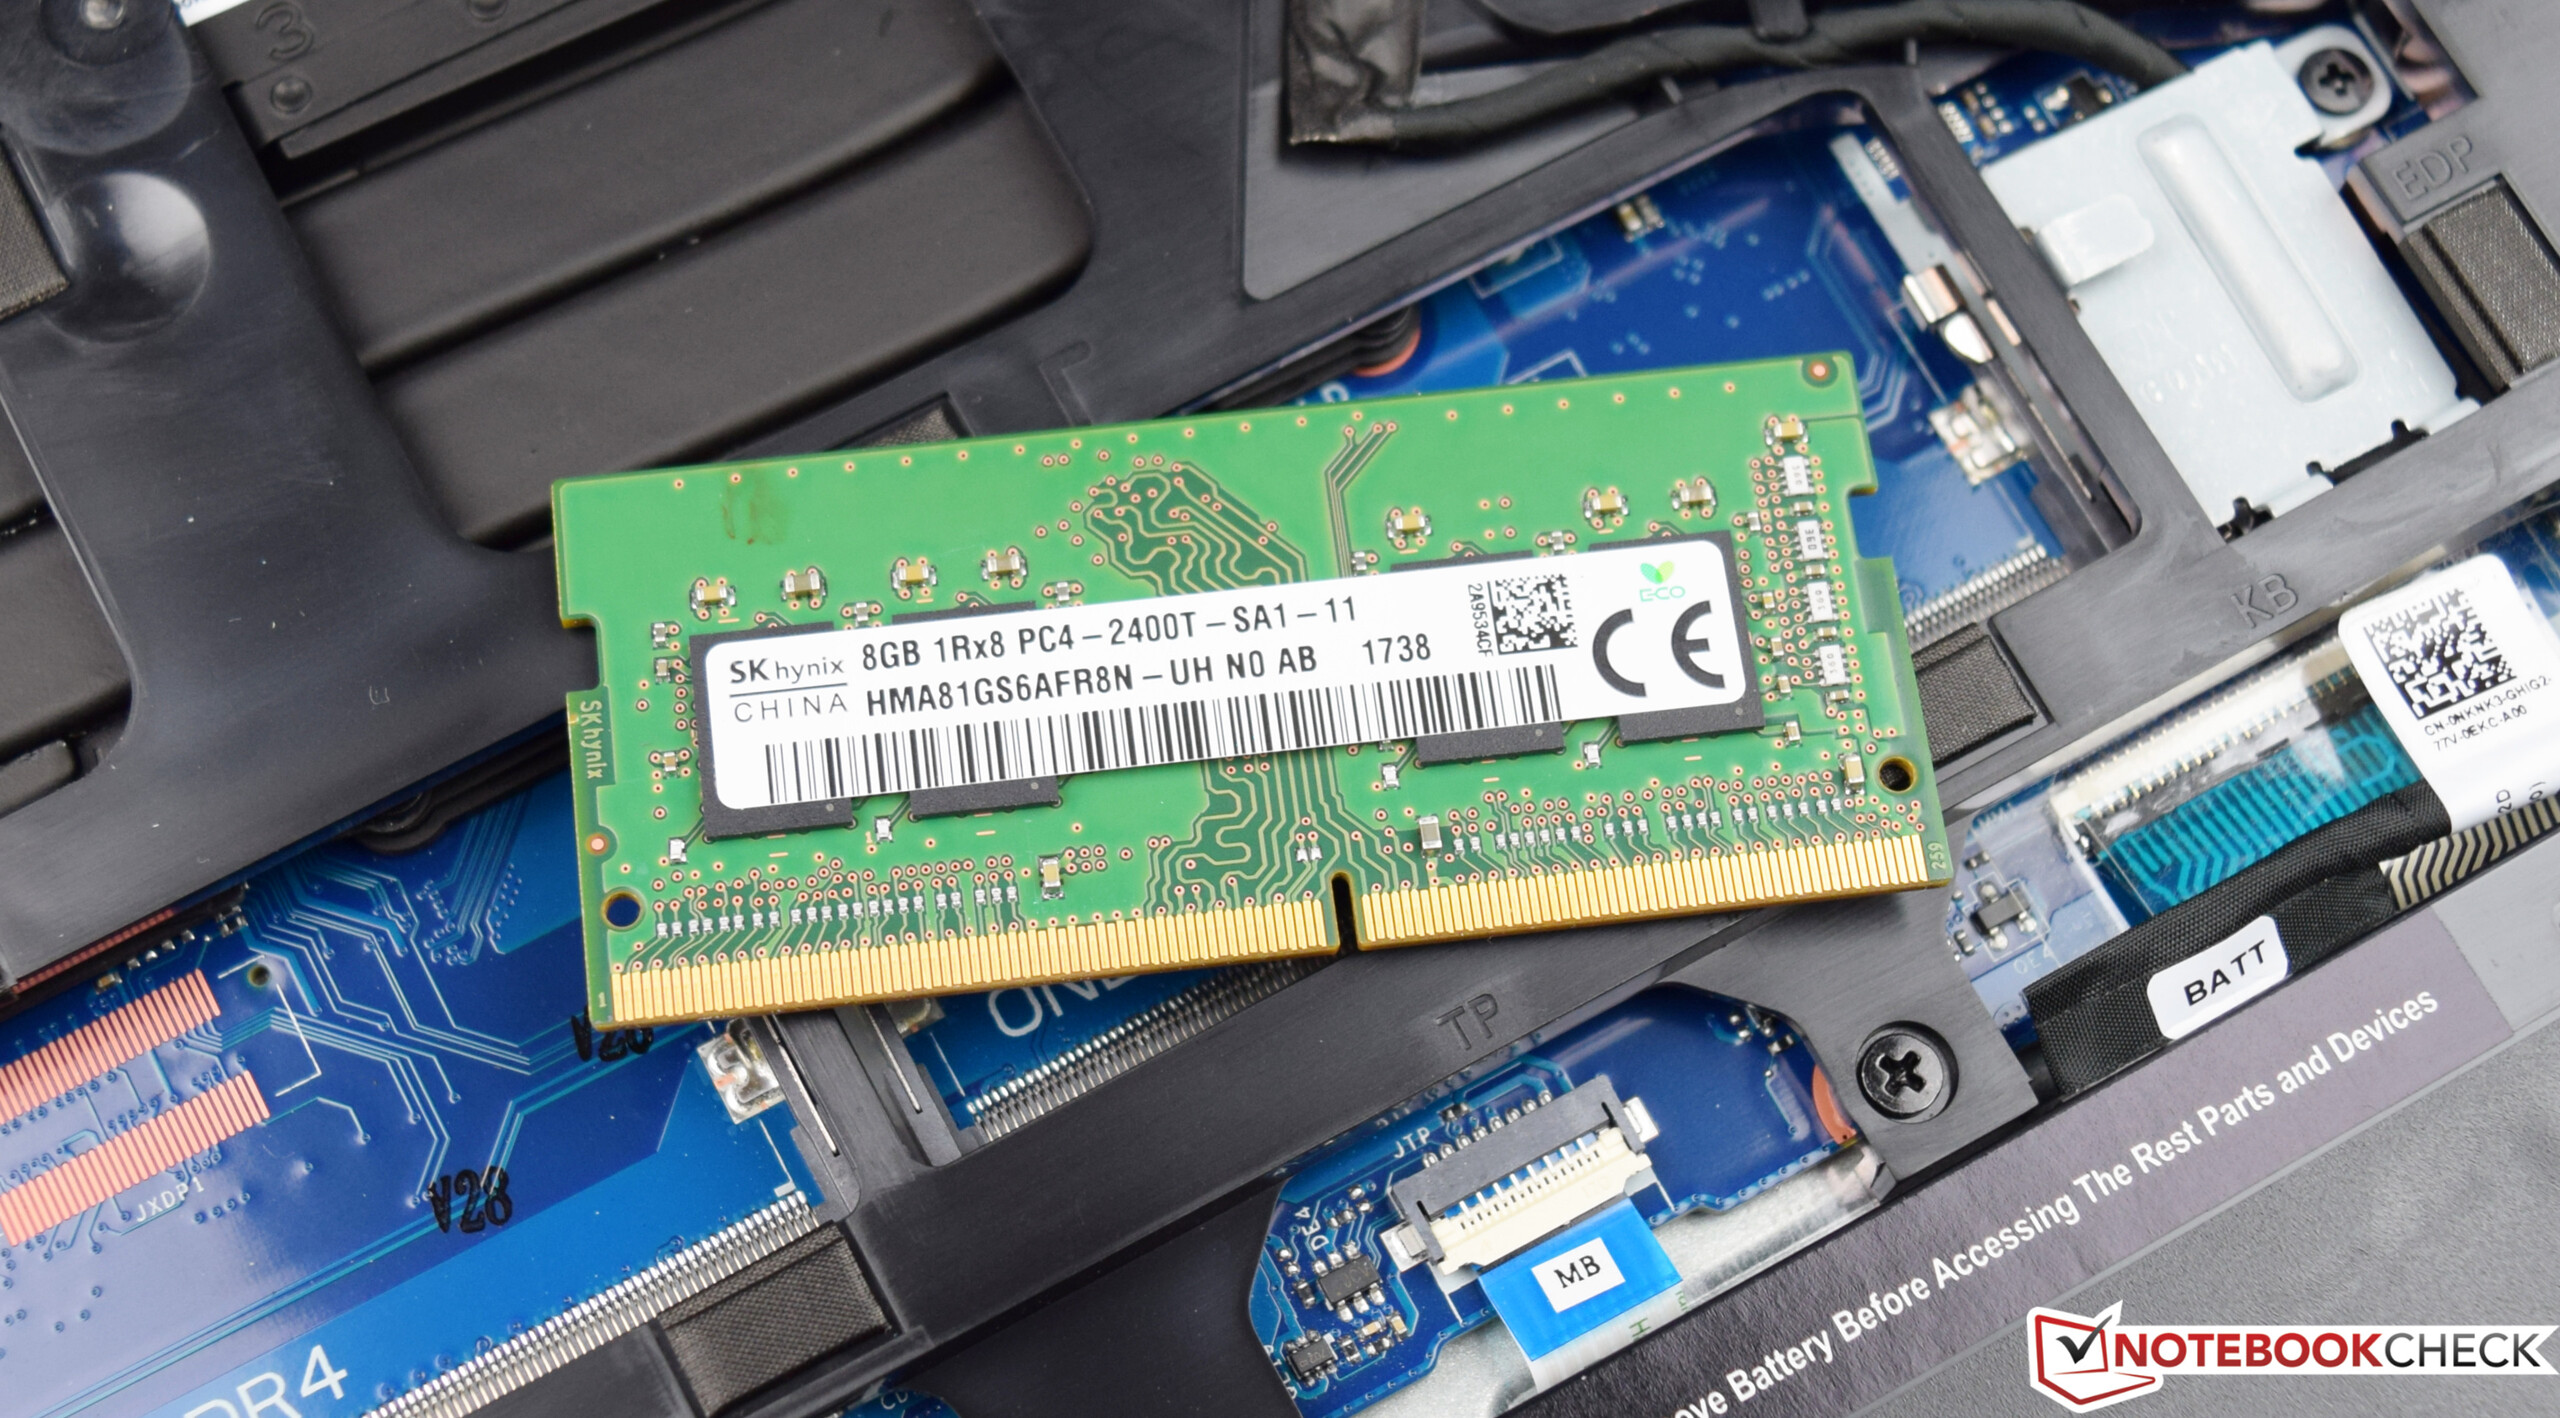
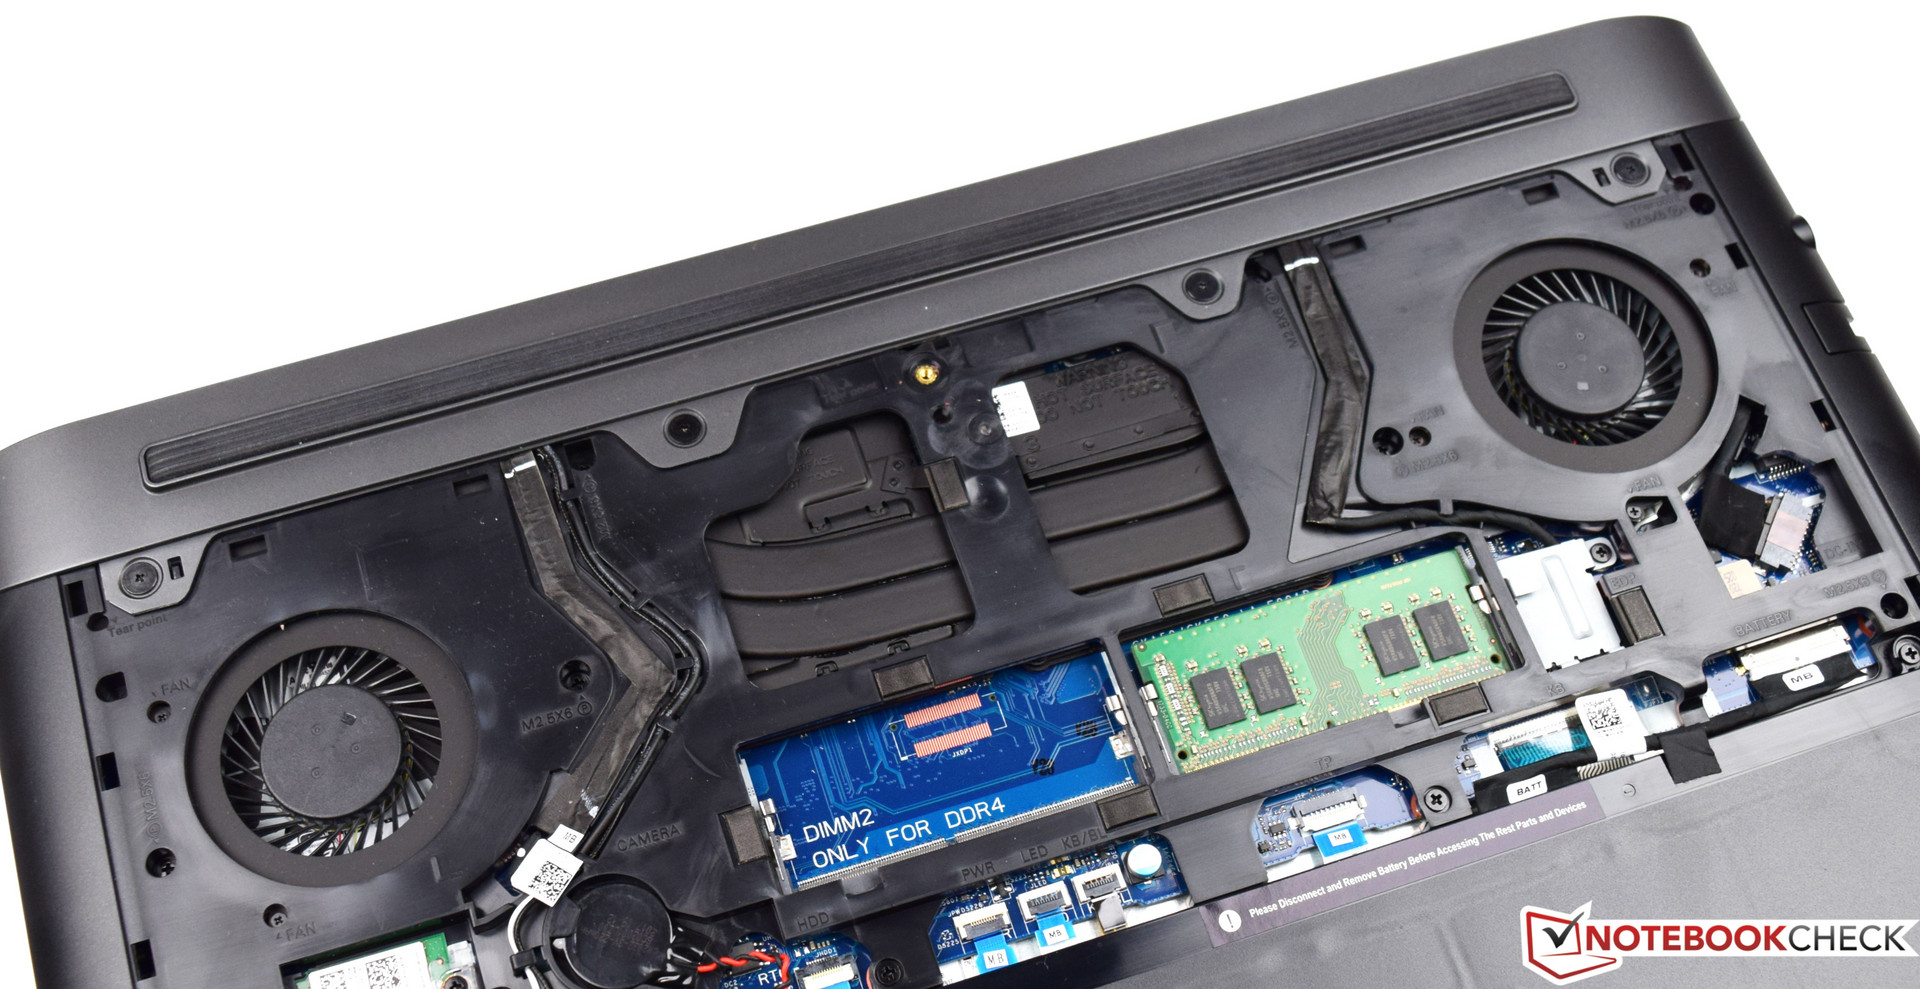
Dell ha fatto molte scelte positive con l'Inspiron 15 7000 7577 e combina una buona capacità gaming con una batteria duratura. Il dispositivo è realizzato con componenti conosciuti come l'Intel Core i5-7300HQ, che ha ancora qualcosa da dire. Gli 8 GB di RAM DDR4 sono sufficienti, e l'espansione della memoria è facile da eseguire. Il case semplice e stabile ci ha fatto complessivamente una buona impressione, come le prestazioni della Nvidia GeForce GTX 1050. Per $750, i potenziali clienti riceveranno un portatile gaming in grado di gestire i giochi recenti in modo fluido. Vorremmo sottolineare l'ampia autonomia, che spesso manca nei portatili gaming.
Dell ha presentato un economico portatile - l'Inspiron 15 7000 7577. Ma lo spazio di archiviazione ibrido non riesce a bilanciare i vantaggi di un SSD.
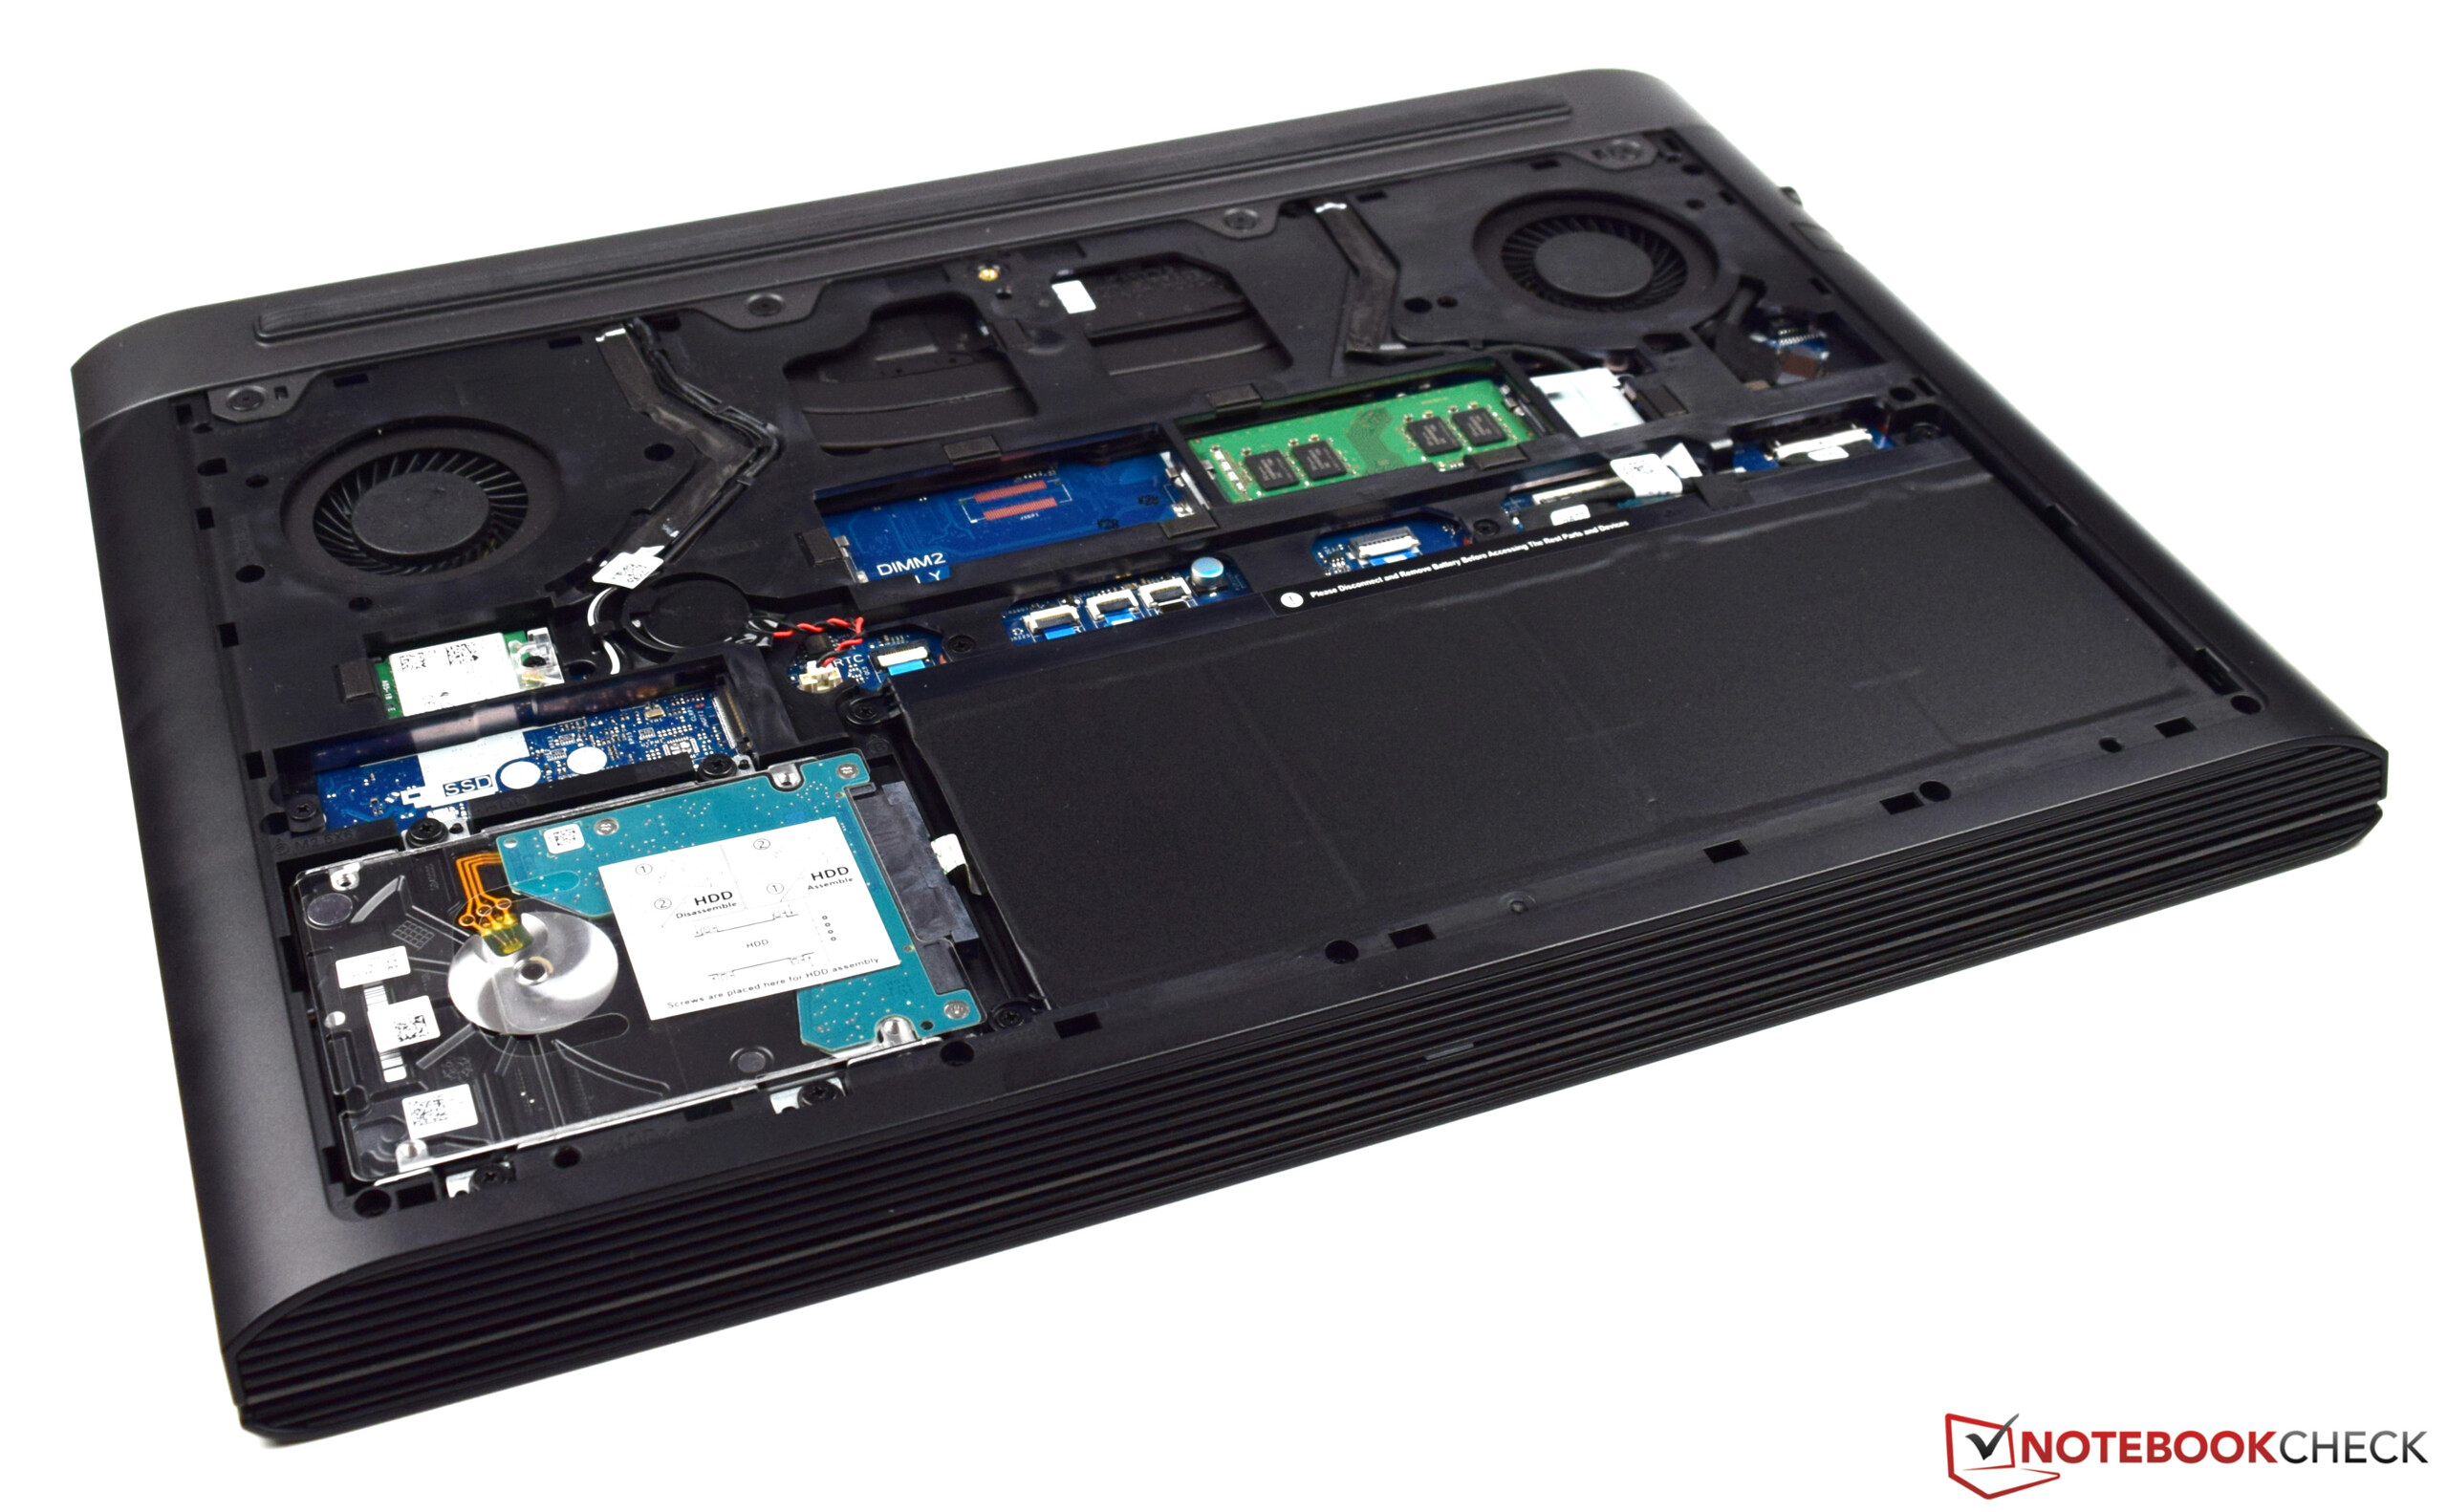
Dobbiamo sottrarre qualche punto a causa dell'assenza di un SSD. Lo spazio di archiviazione ibrido fa un buon lavoro, ma anche le attività quotidiane richiedono un po' di attesa, il che può dare fastidio. Se siete davvero interessati a questo dispositivo, potreste pensare ad una combinazione di SSD ed HDD. Il display pure ci ha lasciato sensazioni miste. Grazie alla tecnologia IPS, ha impressionato con ottimi angoli di visuale. Tuttavia, la copertura della gamma di colore e la luminosità del display sono costati qualche punto a questo dispositivo.
Nota: si tratta di una recensione breve, con alcune sezioni non tradotte, per la versione integrale in inglese guardate qui.
Dell Inspiron 15 7000 7577
- 01/02/2018 v6 (old)
Sebastian Bade
Price comparison
