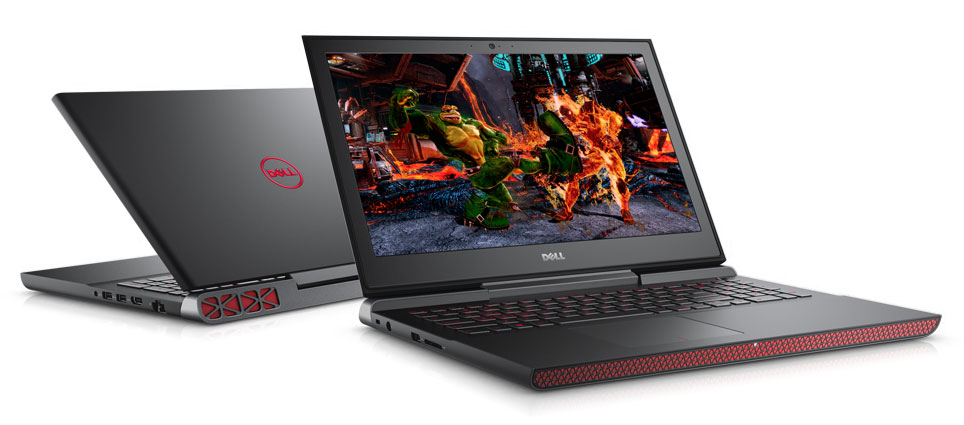
Recensione breve del Portatile Dell Inspiron 15 7000 7567 Gaming (i5-7300HQ, GTX 1050)


| |||||||||||||||||||||||||
Distribuzione della luminosità: 88 %
Al centro con la batteria: 242.2 cd/m²
Contrasto: 351:1 (Nero: 0.69 cd/m²)
ΔE ColorChecker Calman: 11.6 | ∀{0.5-29.43 Ø4.71}
ΔE Greyscale Calman: 15.7 | ∀{0.09-98 Ø4.96}
57.55% sRGB (Argyll 1.6.3 3D)
39.47% AdobeRGB 1998 (Argyll 1.6.3 3D)
39.47% AdobeRGB 1998 (Argyll 3D)
57.5% sRGB (Argyll 3D)
38.2% Display P3 (Argyll 3D)
Gamma: 1.57
CCT: 11662 K
| Dell Inspiron 15 7000 7567 Gaming (Core i5-7300HQ, GTX 1050) AU Optronics AUO38ED B156HTN , TN, 15.6", 1920x1080 | Lenovo Legion Y520-15IKBN-80WK001KUS LP156WF6-SPK3, IPS, 15.6", 1920x1080 | Samsung Odyssey NP800G5M-X01US IPS, 15.6", 1920x1080 | Asus ROG Strix GL553VD-DS71 BOE HF NV156FHM-N43, IPS, 15.6", 1920x1080 | Gigabyte Sabre 15G ID: LGD0533, Name: LG Display LP156WF6-SPK3, IPS, 15.6", 1920x1080 | Acer Aspire VX15 VX5-591G-589S BOE CQ NV156HFM-N42, IPS, 15.6", 1920x1080 | |
|---|---|---|---|---|---|---|
| Display | 23% | 68% | 2% | 5% | ||
| Display P3 Coverage (%) | 38.2 | 47.11 23% | 67.6 77% | 38.97 2% | 40.56 6% | |
| sRGB Coverage (%) | 57.5 | 70.4 22% | 90.8 58% | 58.2 1% | 59.4 3% | |
| AdobeRGB 1998 Coverage (%) | 39.47 | 48.71 23% | 66.4 68% | 40.3 2% | 41.9 6% | |
| Response Times | -45% | -14% | -46% | 10% | -24% | |
| Response Time Grey 50% / Grey 80% * (ms) | 36.8 ? | 58.8 ? -60% | 38.8 ? -5% | 57.6 ? -57% | 32 ? 13% | 46 ? -25% |
| Response Time Black / White * (ms) | 27.6 ? | 36 ? -30% | 33.6 ? -22% | 37.2 ? -35% | 25.6 ? 7% | 34 ? -23% |
| PWM Frequency (Hz) | 21550 ? | 19230 ? | 20000 ? | 20000 ? | ||
| Screen | 21% | 25% | 62% | 25% | 49% | |
| Brightness middle (cd/m²) | 242.2 | 239 -1% | 255.9 6% | 289.3 19% | 248.4 3% | 277 14% |
| Brightness (cd/m²) | 235 | 244 4% | 249 6% | 280 19% | 241 3% | 268 14% |
| Brightness Distribution (%) | 88 | 88 0% | 90 2% | 93 6% | 84 -5% | 91 3% |
| Black Level * (cd/m²) | 0.69 | 0.35 49% | 0.48 30% | 0.29 58% | 0.3 57% | 0.26 62% |
| Contrast (:1) | 351 | 683 95% | 533 52% | 998 184% | 828 136% | 1065 203% |
| Colorchecker dE 2000 * | 11.6 | 7.3 37% | 5.9 49% | 3.1 73% | 7.5 35% | 5.05 56% |
| Colorchecker dE 2000 max. * | 19.4 | 24.7 -27% | 18.9 3% | 7.1 63% | 25.2 -30% | 8.93 54% |
| Greyscale dE 2000 * | 15.7 | 4.9 69% | 5.6 64% | 2.1 87% | 6.5 59% | 2.97 81% |
| Gamma | 1.57 140% | 2.19 100% | 2.21 100% | 2.22 99% | 2.19 100% | 2.39 92% |
| CCT | 11662 56% | 7332 89% | 7250 90% | 6226 104% | 7852 83% | 6466 101% |
| Color Space (Percent of AdobeRGB 1998) (%) | 39.47 | 35 -11% | 44.8 14% | 59 49% | 37 -6% | 38 -4% |
| Color Space (Percent of sRGB) (%) | 57.55 | 55 -4% | 70.1 22% | 91 58% | 57.9 1% | 59 3% |
| Media totale (Programma / Settaggio) | -12% /
10% | 11% /
19% | 28% /
48% | 12% /
19% | 10% /
30% |
* ... Meglio usare valori piccoli
Tempi di risposta del Display
| ↔ Tempi di risposta dal Nero al Bianco | ||
|---|---|---|
| 27.6 ms ... aumenta ↗ e diminuisce ↘ combinato | ↗ 24.4 ms Incremento | 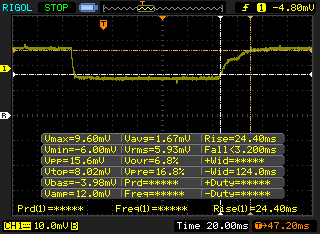 |
| ↘ 3.2 ms Calo | ||
| Lo schermo mostra tempi di risposta relativamente lenti nei nostri tests e potrebbe essere troppo lento per i gamers. In confronto, tutti i dispositivi di test variano da 0.1 (minimo) a 240 (massimo) ms. » 70 % di tutti i dispositivi è migliore. Questo significa che i tempi di risposta rilevati sono peggiori rispetto alla media di tutti i dispositivi testati (19.8 ms). | ||
| ↔ Tempo di risposta dal 50% Grigio all'80% Grigio | ||
| 36.8 ms ... aumenta ↗ e diminuisce ↘ combinato | ↗ 17.2 ms Incremento | 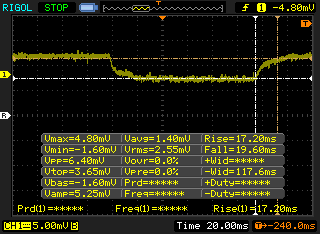 |
| ↘ 19.6 ms Calo | ||
| Lo schermo mostra tempi di risposta lenti nei nostri tests e sarà insoddisfacente per i gamers. In confronto, tutti i dispositivi di test variano da 0.165 (minimo) a 636 (massimo) ms. » 53 % di tutti i dispositivi è migliore. Questo significa che i tempi di risposta rilevati sono peggiori rispetto alla media di tutti i dispositivi testati (30.9 ms). | ||
Sfarfallio dello schermo / PWM (Pulse-Width Modulation)
| flickering dello schermo / PWM non rilevato | 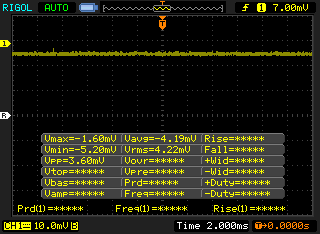 | ||
In confronto: 52 % di tutti i dispositivi testati non utilizza PWM per ridurre la luminosita' del display. Se è rilevato PWM, una media di 7741 (minimo: 5 - massimo: 343500) Hz è stata rilevata. | |||
| wPrime 2.10 - 1024m | |
| Dell Inspiron 15 7000 7567 Gaming (Core i5-7300HQ, GTX 1050) | |
| Asus ROG Strix GL553VD-DS71 | |
| Gigabyte Sabre 15G | |
| Samsung Odyssey NP800G5M-X01US | |
* ... Meglio usare valori piccoli
| PCMark 8 Home Score Accelerated v2 | 3638 punti | |
| PCMark 8 Creative Score Accelerated v2 | 4334 punti | |
| PCMark 8 Work Score Accelerated v2 | 4749 punti | |
| PCMark 10 Score | 3618 punti | |
Aiuto | ||
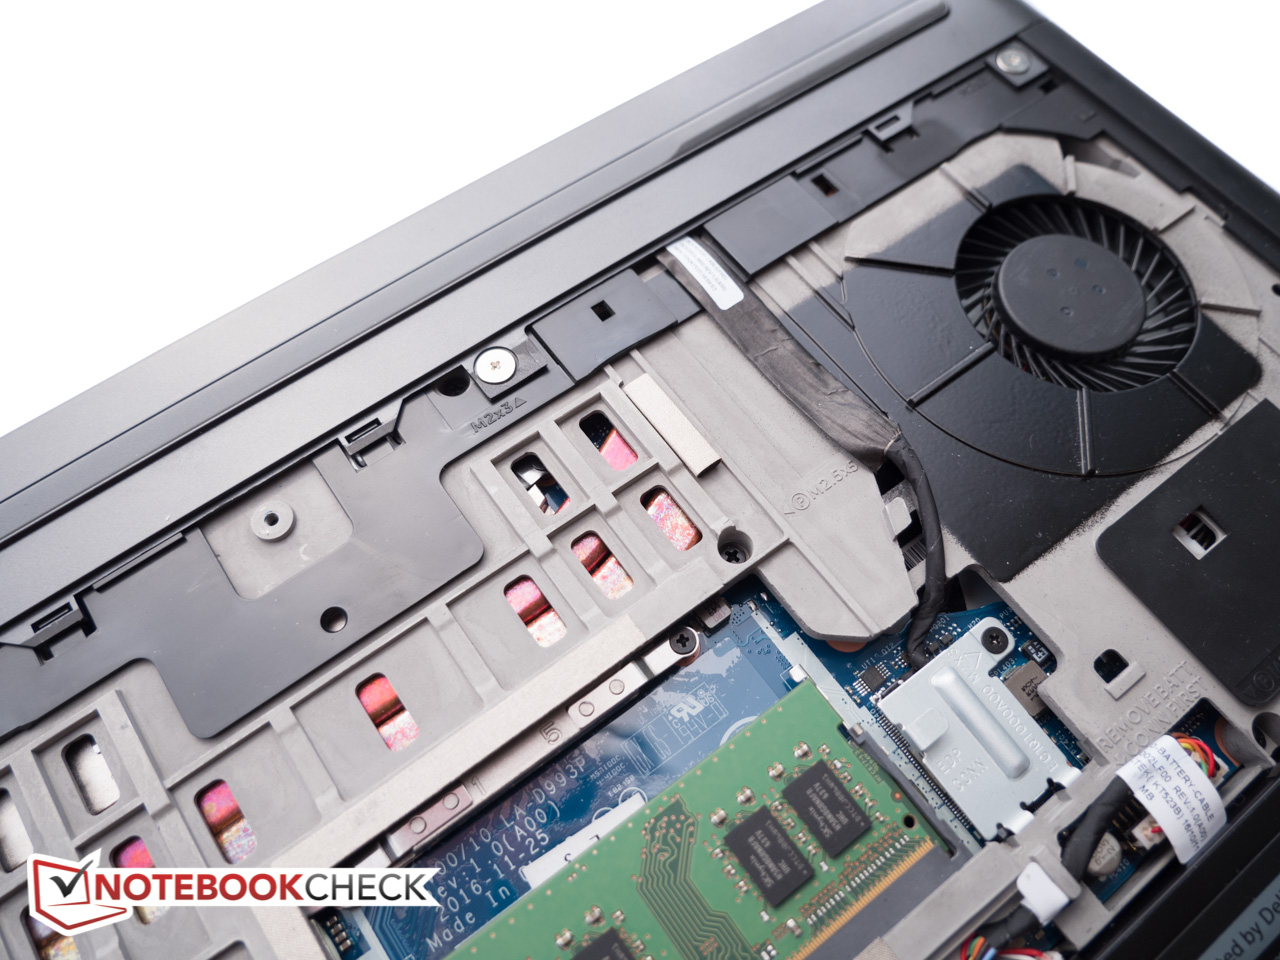
| Dell Inspiron 15 7000 7567 Gaming (Core i5-7300HQ, GTX 1050) Toshiba MQ02ABD100H | Lenovo Legion Y520-15IKBN-80WK001KUS Samsung PM961 MZVLW256HEHP | Samsung Odyssey NP800G5M-X01US Samsung PM961 NVMe MZVLW128HEGR | Asus ROG Strix GL553VD-DS71 HGST Travelstar 7K1000 HTS721010A9E630 | Acer Aspire VX15 VX5-591G-589S Hynix HFS128G39TND | |
|---|---|---|---|---|---|
| CrystalDiskMark 3.0 | 21400% | 15742% | 56% | 11511% | |
| Read Seq (MB/s) | 84.7 | 2170 2462% | 1518 1692% | 93.5 10% | 510 502% |
| Write Seq (MB/s) | 65.4 | 1202 1738% | 798 1120% | 89.6 37% | 137.6 110% |
| Read 512 (MB/s) | 19.86 | 786 3858% | 460.5 2219% | 39.06 97% | 362.1 1723% |
| Write 512 (MB/s) | 28.43 | 822 2791% | 195.8 589% | 51.1 80% | 137.2 383% |
| Read 4k (MB/s) | 0.531 | 58.9 10992% | 47.16 8781% | 0.57 7% | 35.18 6525% |
| Write 4k (MB/s) | 0.481 | 146.4 30337% | 143.1 29651% | 1.05 118% | 104.8 21688% |
| Read 4k QD32 (MB/s) | 1.105 | 457.7 41321% | 521 47049% | 1.06 -4% | 375.8 33909% |
| Write 4k QD32 (MB/s) | 0.505 | 392.9 77702% | 176.4 34831% | 1.04 106% | 138.1 27247% |

| 3DMark 11 Performance | 7170 punti | |
| 3DMark Cloud Gate Standard Score | 13473 punti | |
| 3DMark Fire Strike Score | 5085 punti | |
| 3DMark Fire Strike Extreme Score | 2512 punti | |
Aiuto | ||
| The Witcher 3 | |
| 1024x768 Low Graphics & Postprocessing (ordina per valore) | |
| Dell Inspiron 15 7000 7567 Gaming (Core i5-7300HQ, GTX 1050) | |
| Dell XPS 15 2017 9560 (7300HQ, Full-HD) | |
| 1366x768 Medium Graphics & Postprocessing (ordina per valore) | |
| Dell Inspiron 15 7000 7567 Gaming (Core i5-7300HQ, GTX 1050) | |
| Dell XPS 15 2017 9560 (7300HQ, Full-HD) | |
| 1920x1080 High Graphics & Postprocessing (Nvidia HairWorks Off) (ordina per valore) | |
| Dell Inspiron 15 7000 7567 Gaming (Core i5-7300HQ, GTX 1050) | |
| Samsung Odyssey NP800G5M-X01US | |
| Gigabyte Sabre 15G | |
| Dell XPS 15 2017 9560 (7300HQ, Full-HD) | |
| Acer Aspire VX5-591G-75C4 VX15 | |
| 1920x1080 Ultra Graphics & Postprocessing (HBAO+) (ordina per valore) | |
| Dell Inspiron 15 7000 7567 Gaming (Core i5-7300HQ, GTX 1050) | |
| Lenovo Legion Y520-15IKBN-80WK001KUS | |
| Samsung Odyssey NP800G5M-X01US | |
| Gigabyte Sabre 15G | |
| Dell XPS 15 2017 9560 (7300HQ, Full-HD) | |
| Acer Aspire VX5-591G-75C4 VX15 | |
| basso | medio | alto | ultra | |
|---|---|---|---|---|
| Metro 2033 (2010) | 85.5 | 80.7 | 72.7 | 44.6 |
| Dirt 3 (2011) | 194.4 | 106.9 | 127.4 | 101 |
| Sleeping Dogs (2012) | 174.9 | 135.8 | 114.6 | 98.5 |
| Hitman: Absolution (2012) | 79.1 | 73.9 | 66.8 | 41.8 |
| Tomb Raider (2013) | 252.5 | 208.6 | 167.7 | 79.9 |
| BioShock Infinite (2013) | 173.5 | 149.6 | 139.2 | 64.9 |
| GRID 2 (2013) | 120.4 | 103 | 96.2 | 75.3 |
| Company of Heroes 2 (2013) | 52.4 | 50.7 | 47.4 | 26 |
| Thief (2014) | 58 | 56.6 | 53.8 | 41.8 |
| GRID: Autosport (2014) | 141.6 | 98.7 | 87 | 71.3 |
| Middle-earth: Shadow of Mordor (2014) | 122.8 | 99 | 58.8 | 45.8 |
| The Witcher 3 (2015) | 95.9 | 69.2 | 39 | 21.9 |
| Batman: Arkham Knight (2015) | 80 | 76 | 50 | 32 |
| Rise of the Tomb Raider (2016) | 105.5 | 64.5 | 35.8 | 30.9 |
| Ashes of the Singularity (2016) | 37.1 | 31 | 28.6 |
Rumorosità
| Idle |
| 31.6 / 31.8 / 31.8 dB(A) |
| Sotto carico |
| 36.3 / 49 dB(A) |
 | ||
30 dB silenzioso 40 dB(A) udibile 50 dB(A) rumoroso |
||
min: | ||
| Dell Inspiron 15 7000 7567 Gaming (Core i5-7300HQ, GTX 1050) GeForce GTX 1050 Mobile, i5-7300HQ, Toshiba MQ02ABD100H | Lenovo Legion Y520-15IKBN-80WK001KUS GeForce GTX 1050 Ti Mobile, i7-7700HQ, Samsung PM961 MZVLW256HEHP | Samsung Odyssey NP800G5M-X01US GeForce GTX 1050 Mobile, i7-7700HQ, Samsung PM961 NVMe MZVLW128HEGR | Asus ROG Strix GL553VD-DS71 GeForce GTX 1050 Mobile, i7-7700HQ, HGST Travelstar 7K1000 HTS721010A9E630 | Acer Aspire VX15 VX5-591G-589S GeForce GTX 1050 Mobile, i5-7300HQ, Hynix HFS128G39TND | Gigabyte Sabre 15G GeForce GTX 1050 Mobile, i7-7700HQ, Liteonit CV3-8D128 | Dell XPS 15 2017 9560 (7300HQ, Full-HD) GeForce GTX 1050 Mobile, i5-7300HQ, WDC WD10SPCX-75KHST0 + SanDisk Z400s M.2 2242 32 GB Cache | |
|---|---|---|---|---|---|---|---|
| Noise | 4% | -2% | -9% | 7% | -8% | -7% | |
| off /ambiente * (dB) | 28 | 27.7 1% | 28.1 -0% | 30.6 -9% | 30 -7% | 28.2 -1% | 30.3 -8% |
| Idle Minimum * (dB) | 31.6 | 30.5 3% | 28.1 11% | 33.4 -6% | 30 5% | 33 -4% | 31.6 -0% |
| Idle Average * (dB) | 31.8 | 30.5 4% | 29.1 8% | 33.4 -5% | 30 6% | 33.3 -5% | 31.6 1% |
| Idle Maximum * (dB) | 31.8 | 30.6 4% | 29.1 8% | 33.4 -5% | 31.1 2% | 34.7 -9% | 33.4 -5% |
| Load Average * (dB) | 36.3 | 40 -10% | 49.2 -36% | 46.5 -28% | 31.3 14% | 44.5 -23% | 47.8 -32% |
| Witcher 3 ultra * (dB) | 46.3 | 40 14% | 49.2 -6% | ||||
| Load Maximum * (dB) | 49 | 42.6 13% | 49.2 -0% | 49.6 -1% | 38.9 21% | 52.8 -8% | 47.8 2% |
* ... Meglio usare valori piccoli
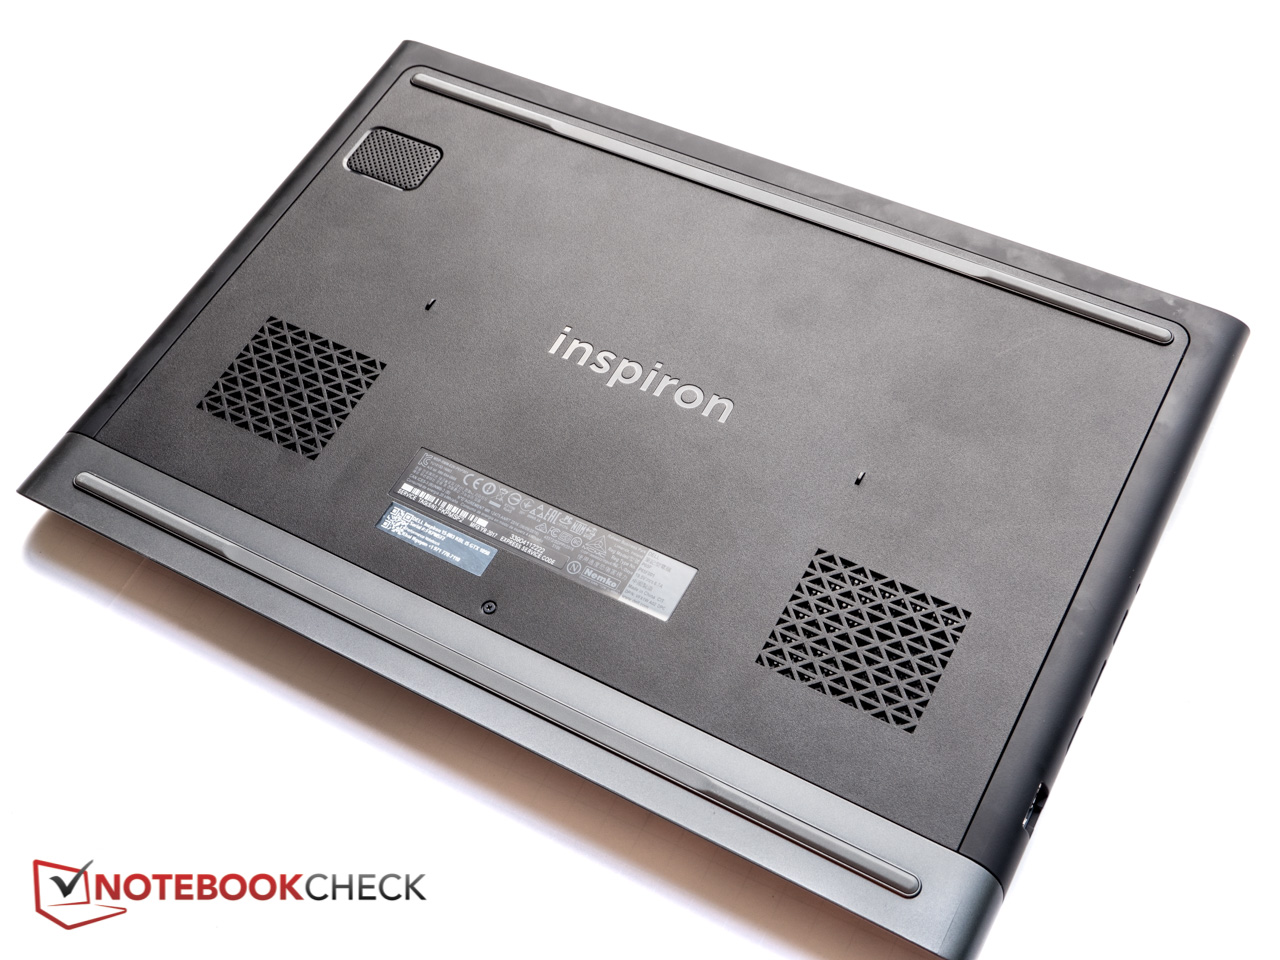
(-) La temperatura massima sul lato superiore è di 47.2 °C / 117 F, rispetto alla media di 40.4 °C / 105 F, che varia da 21.2 a 68.8 °C per questa classe Gaming.
(±) Il lato inferiore si riscalda fino ad un massimo di 43.2 °C / 110 F, rispetto alla media di 43.2 °C / 110 F
(+) In idle, la temperatura media del lato superiore è di 26.4 °C / 80 F, rispetto alla media deld ispositivo di 33.9 °C / 93 F.
(+) Riproducendo The Witcher 3, la temperatura media per il lato superiore e' di 29.5 °C / 85 F, rispetto alla media del dispositivo di 33.9 °C / 93 F.
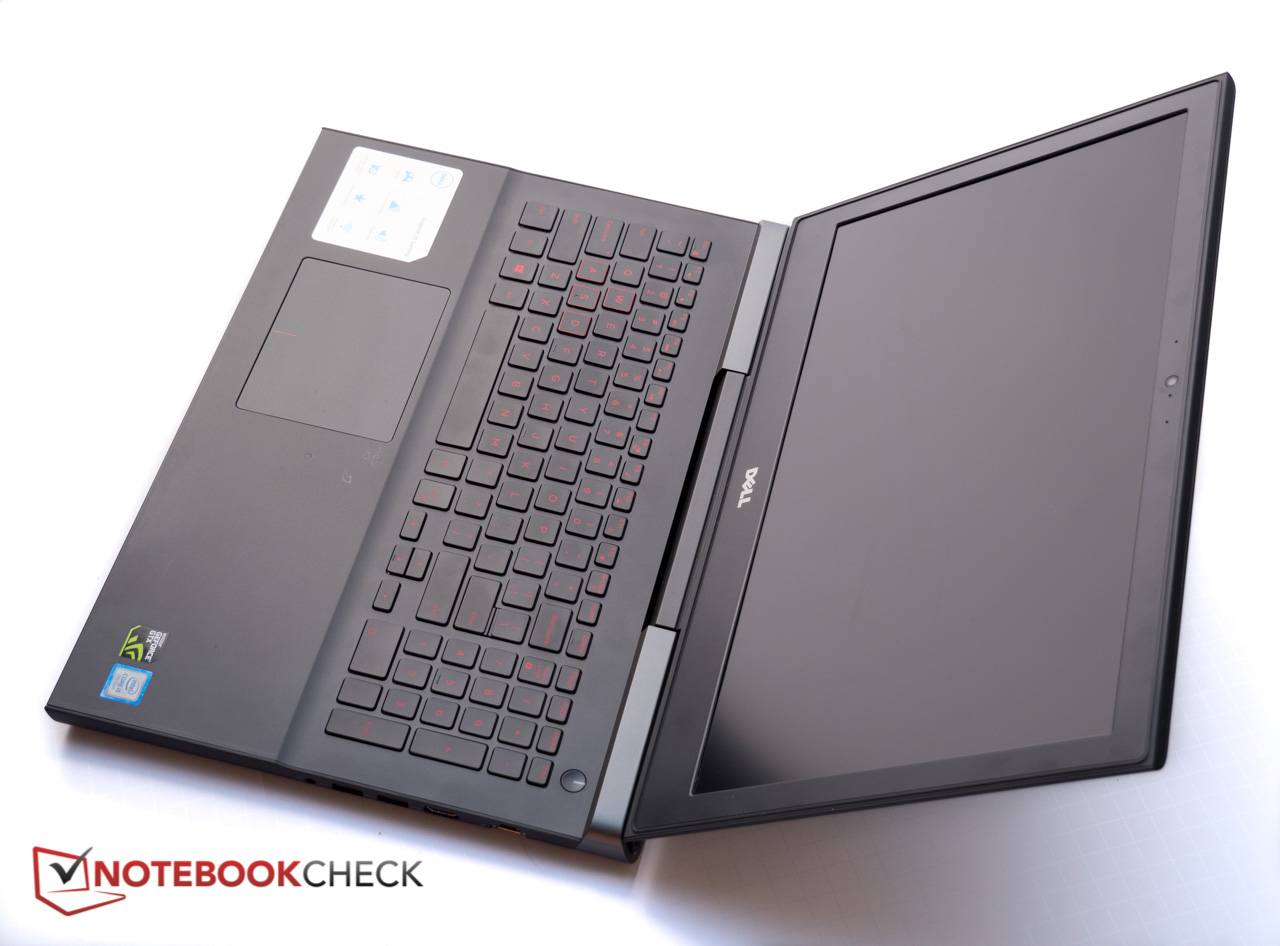
(±) I poggiapolsi e il touchpad possono diventare molto caldi al tatto con un massimo di 36.6 °C / 97.9 F.
(-) La temperatura media della zona del palmo della mano di dispositivi simili e'stata di 28.8 °C / 83.8 F (-7.8 °C / -14.1 F).
Dell Inspiron 15 7000 7567 Gaming (Core i5-7300HQ, GTX 1050) analisi audio
(±) | potenza degli altiparlanti media ma buona (78.2 dB)
Bassi 100 - 315 Hz
(±) | bassi ridotti - in media 11.4% inferiori alla media
(±) | la linearità dei bassi è media (11.2% delta rispetto alla precedente frequenza)
Medi 400 - 2000 Hz
(+) | medi bilanciati - solo only 2.4% rispetto alla media
(±) | linearità dei medi adeguata (7.8% delta rispetto alla precedente frequenza)
Alti 2 - 16 kHz
(+) | Alti bilanciati - appena 4.1% dalla media
(+) | alti lineari (6.7% delta rispetto alla precedente frequenza)
Nel complesso 100 - 16.000 Hz
(±) | la linearità complessiva del suono è media (16.6% di differenza rispetto alla media
Rispetto alla stessa classe
» 43% di tutti i dispositivi testati in questa classe è stato migliore, 7% simile, 50% peggiore
» Il migliore ha avuto un delta di 6%, medio di 18%, peggiore di 132%
Rispetto a tutti i dispositivi testati
» 29% di tutti i dispositivi testati in questa classe è stato migliore, 6% similare, 65% peggiore
» Il migliore ha avuto un delta di 4%, medio di 23%, peggiore di 134%
Apple MacBook 12 (Early 2016) 1.1 GHz analisi audio
(+) | gli altoparlanti sono relativamente potenti (83.6 dB)
Bassi 100 - 315 Hz
(±) | bassi ridotti - in media 11.3% inferiori alla media
(±) | la linearità dei bassi è media (14.2% delta rispetto alla precedente frequenza)
Medi 400 - 2000 Hz
(+) | medi bilanciati - solo only 2.4% rispetto alla media
(+) | medi lineari (5.5% delta rispetto alla precedente frequenza)
Alti 2 - 16 kHz
(+) | Alti bilanciati - appena 2% dalla media
(+) | alti lineari (4.5% delta rispetto alla precedente frequenza)
Nel complesso 100 - 16.000 Hz
(+) | suono nel complesso lineare (10.2% differenza dalla media)
Rispetto alla stessa classe
» 7% di tutti i dispositivi testati in questa classe è stato migliore, 2% simile, 90% peggiore
» Il migliore ha avuto un delta di 5%, medio di 18%, peggiore di 53%
Rispetto a tutti i dispositivi testati
» 5% di tutti i dispositivi testati in questa classe è stato migliore, 1% similare, 94% peggiore
» Il migliore ha avuto un delta di 4%, medio di 23%, peggiore di 134%
| Off / Standby | |
| Idle | |
| Sotto carico |
|
Leggenda:
min: | |
| Dell Inspiron 15 7000 7567 Gaming (Core i5-7300HQ, GTX 1050) i5-7300HQ, GeForce GTX 1050 Mobile, Toshiba MQ02ABD100H, TN, 1920x1080, 15.6" | Dell Inspiron 15 7000 7567 i7-7700HQ, GeForce GTX 1050 Ti Mobile, Intel SSDSCKKF256H6, TN, 1920x1080, 15.6" | Lenovo Legion Y520-15IKBN-80WK001KUS i7-7700HQ, GeForce GTX 1050 Ti Mobile, Samsung PM961 MZVLW256HEHP, IPS, 1920x1080, 15.6" | Samsung Odyssey NP800G5M-X01US i7-7700HQ, GeForce GTX 1050 Mobile, Samsung PM961 NVMe MZVLW128HEGR, IPS, 1920x1080, 15.6" | Asus ROG Strix GL553VD-DS71 i7-7700HQ, GeForce GTX 1050 Mobile, HGST Travelstar 7K1000 HTS721010A9E630, IPS, 1920x1080, 15.6" | Acer Aspire VX15 VX5-591G-589S i5-7300HQ, GeForce GTX 1050 Mobile, Hynix HFS128G39TND, IPS, 1920x1080, 15.6" | Gigabyte Sabre 15G i7-7700HQ, GeForce GTX 1050 Mobile, Liteonit CV3-8D128, IPS, 1920x1080, 15.6" | |
|---|---|---|---|---|---|---|---|
| Power Consumption | 21% | 3% | 5% | -2% | 2% | 3% | |
| Idle Minimum * (Watt) | 9.1 | 4.4 52% | 8.5 7% | 6.7 26% | 7.7 15% | 8.4 8% | 8 12% |
| Idle Average * (Watt) | 10.3 | 6.8 34% | 9.1 12% | 8.9 14% | 11.7 -14% | 13.1 -27% | 10.9 -6% |
| Idle Maximum * (Watt) | 13 | 8.3 36% | 9.7 25% | 10.8 17% | 12 8% | 14.2 -9% | 11 15% |
| Load Average * (Watt) | 75.6 | 81 -7% | 79.9 -6% | 81.8 -8% | 80.5 -6% | 50 34% | 76.7 -1% |
| Witcher 3 ultra * (Watt) | 83.8 | 97.7 -17% | 92.2 -10% | 94.9 -13% | |||
| Load Maximum * (Watt) | 115.2 | 127 -10% | 121.5 -5% | 122.7 -7% | 128.4 -11% | 111 4% | 106.4 8% |
* ... Meglio usare valori piccoli
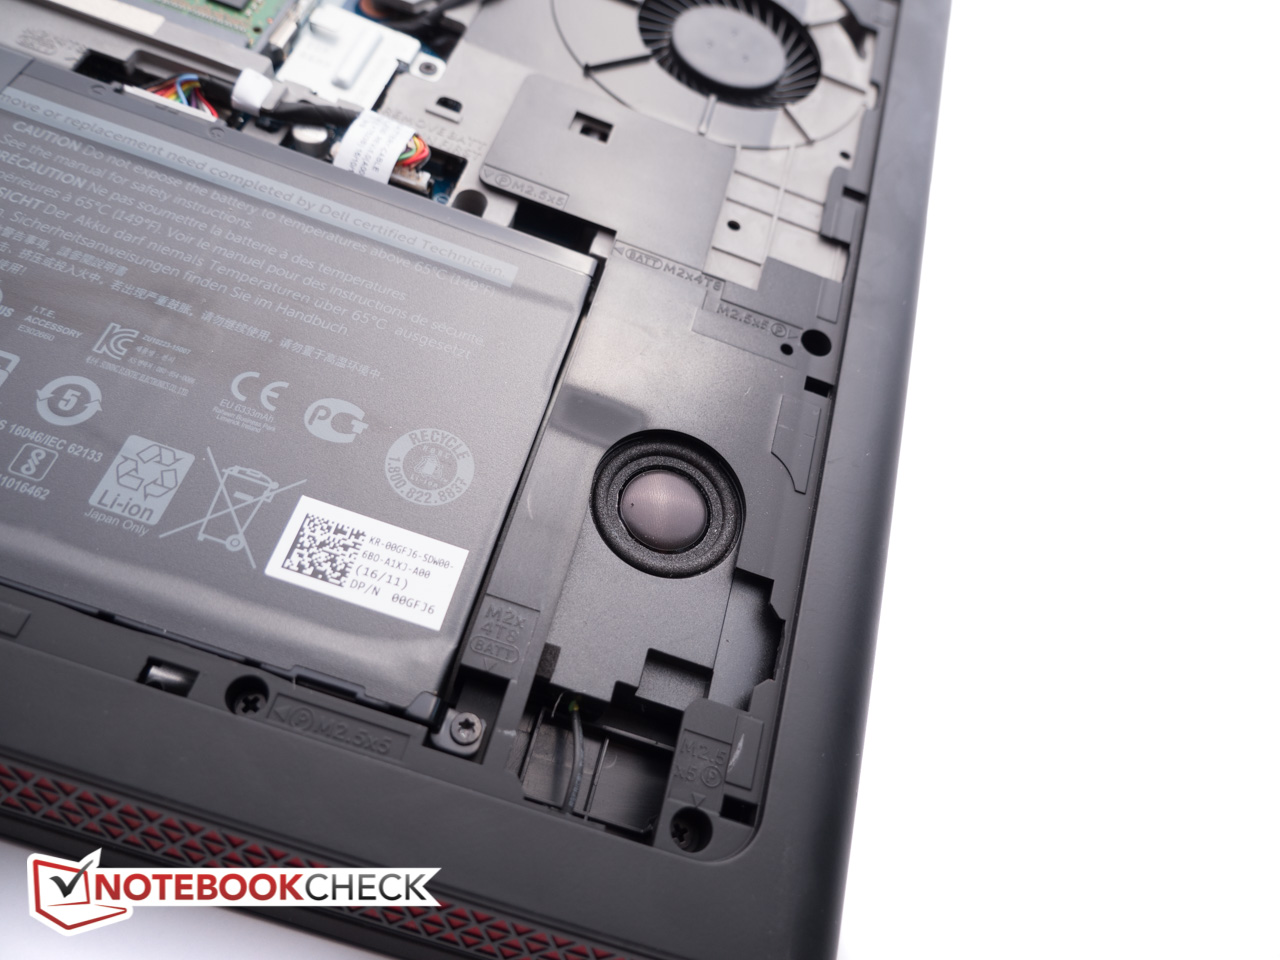
| Dell Inspiron 15 7000 7567 Gaming (Core i5-7300HQ, GTX 1050) i5-7300HQ, GeForce GTX 1050 Mobile, 74 Wh | Dell Inspiron 15 7000 7567 i7-7700HQ, GeForce GTX 1050 Ti Mobile, 74 Wh | Lenovo Legion Y520-15IKBN-80WK001KUS i7-7700HQ, GeForce GTX 1050 Ti Mobile, 45 Wh | Samsung Odyssey NP800G5M-X01US i7-7700HQ, GeForce GTX 1050 Mobile, 43 Wh | Asus ROG Strix GL553VD-DS71 i7-7700HQ, GeForce GTX 1050 Mobile, 48 Wh | Acer Aspire VX15 VX5-591G-589S i5-7300HQ, GeForce GTX 1050 Mobile, 52.5 Wh | Gigabyte Sabre 15G i7-7700HQ, GeForce GTX 1050 Mobile, 47 Wh | |
|---|---|---|---|---|---|---|---|
| Autonomia della batteria | -4% | -57% | -44% | -57% | -42% | -48% | |
| Reader / Idle (h) | 18.2 | 19.6 8% | 8.5 -53% | 10.2 -44% | 7.3 -60% | 8.2 -55% | |
| WiFi v1.3 (h) | 9.5 | 10.4 9% | 4 -58% | 4.4 -54% | 4.6 -52% | 5.5 -42% | 4.4 -54% |
| Load (h) | 2 | 1.4 -30% | 0.8 -60% | 1.3 -35% | 0.8 -60% | 1.3 -35% |
Pro
Contro
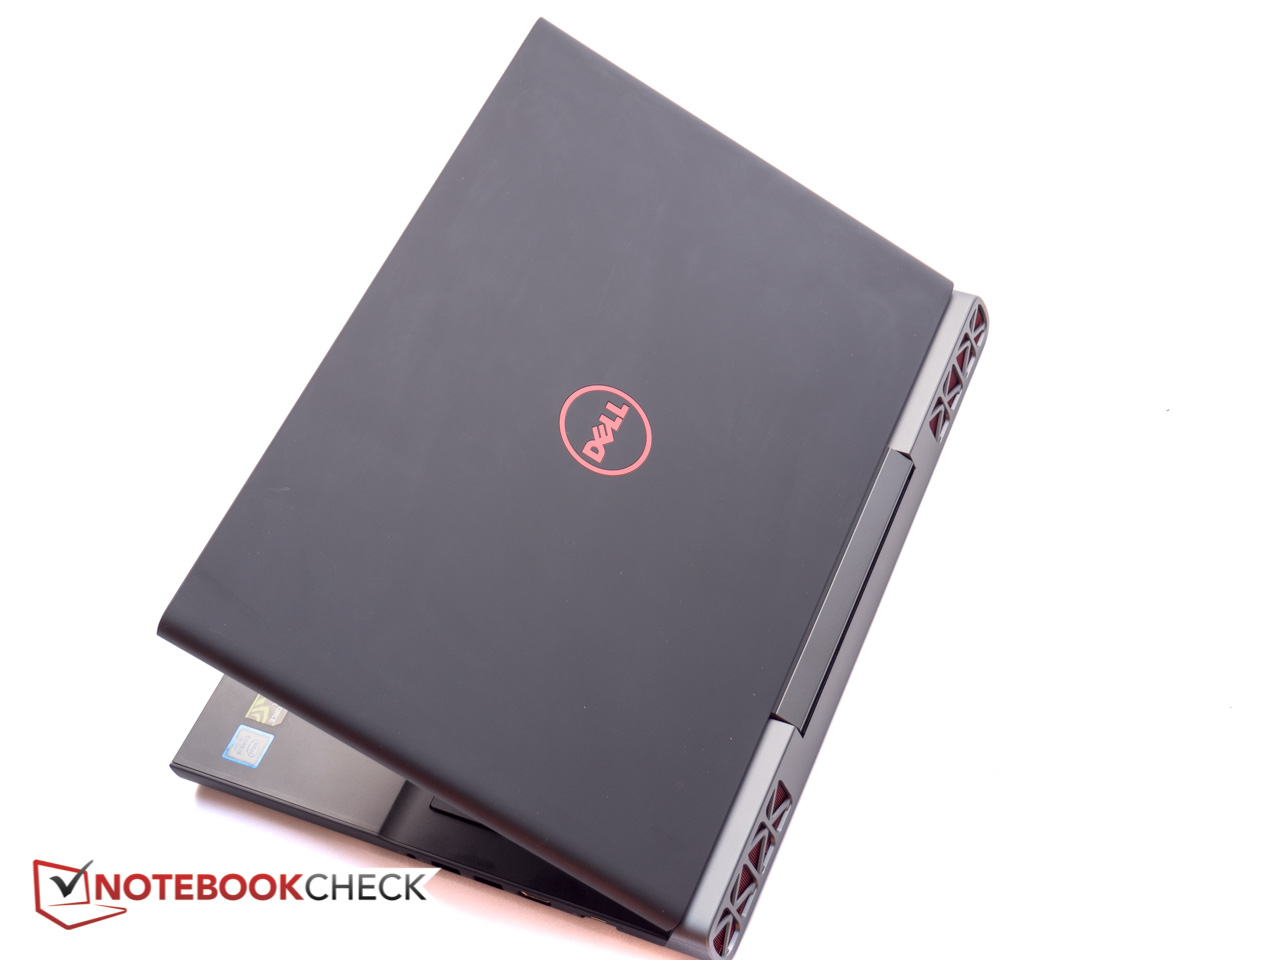
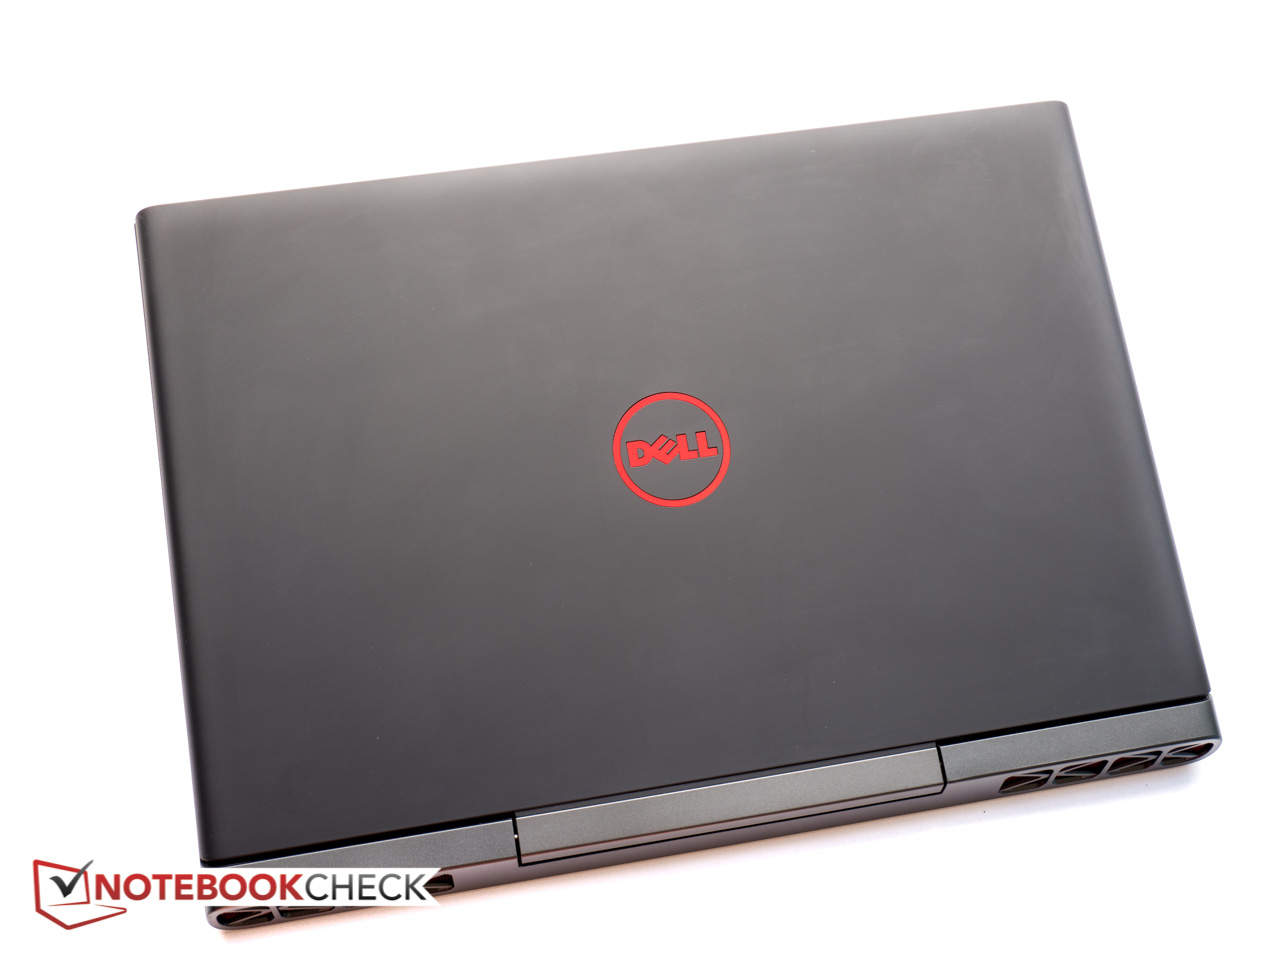
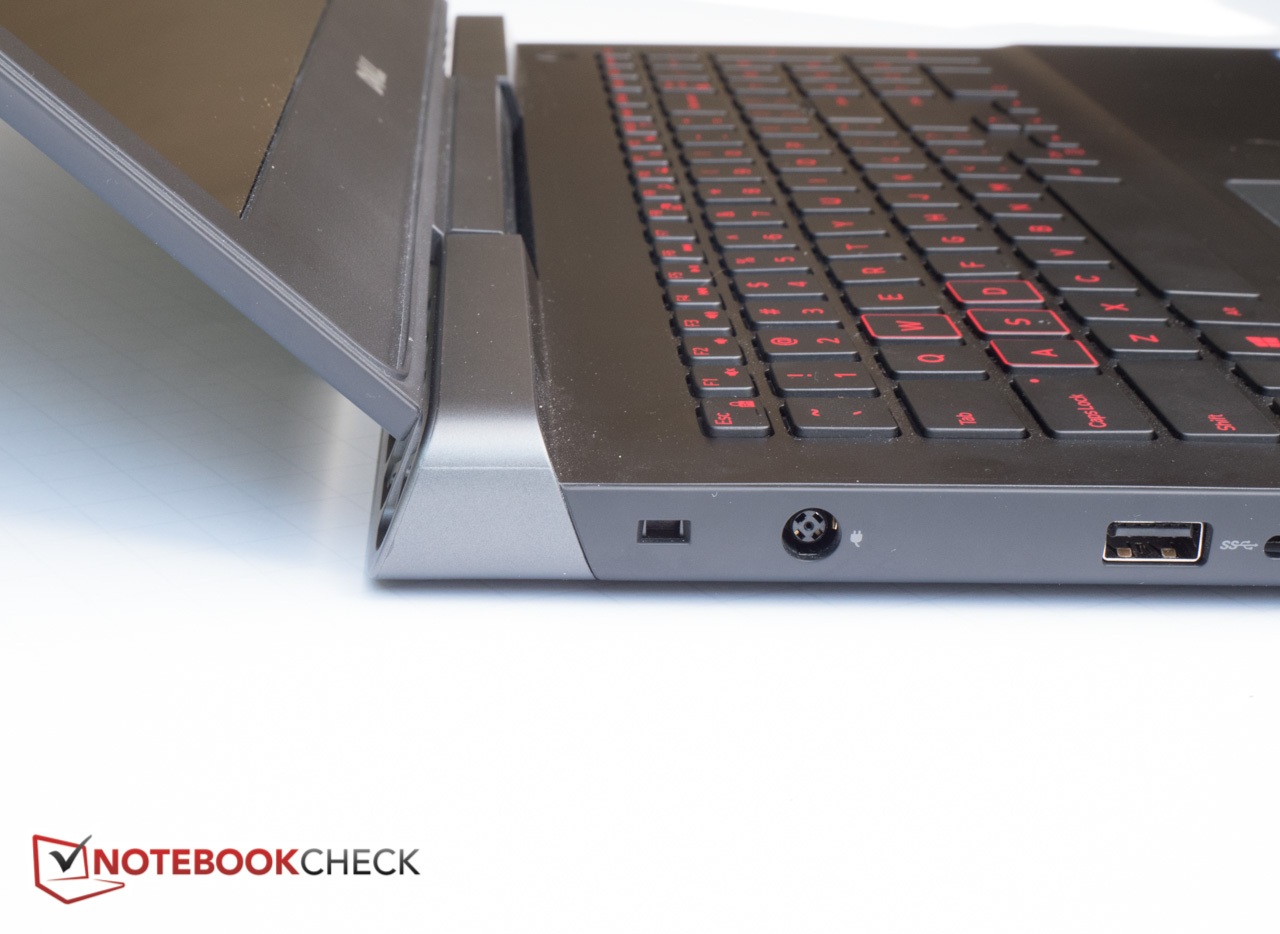
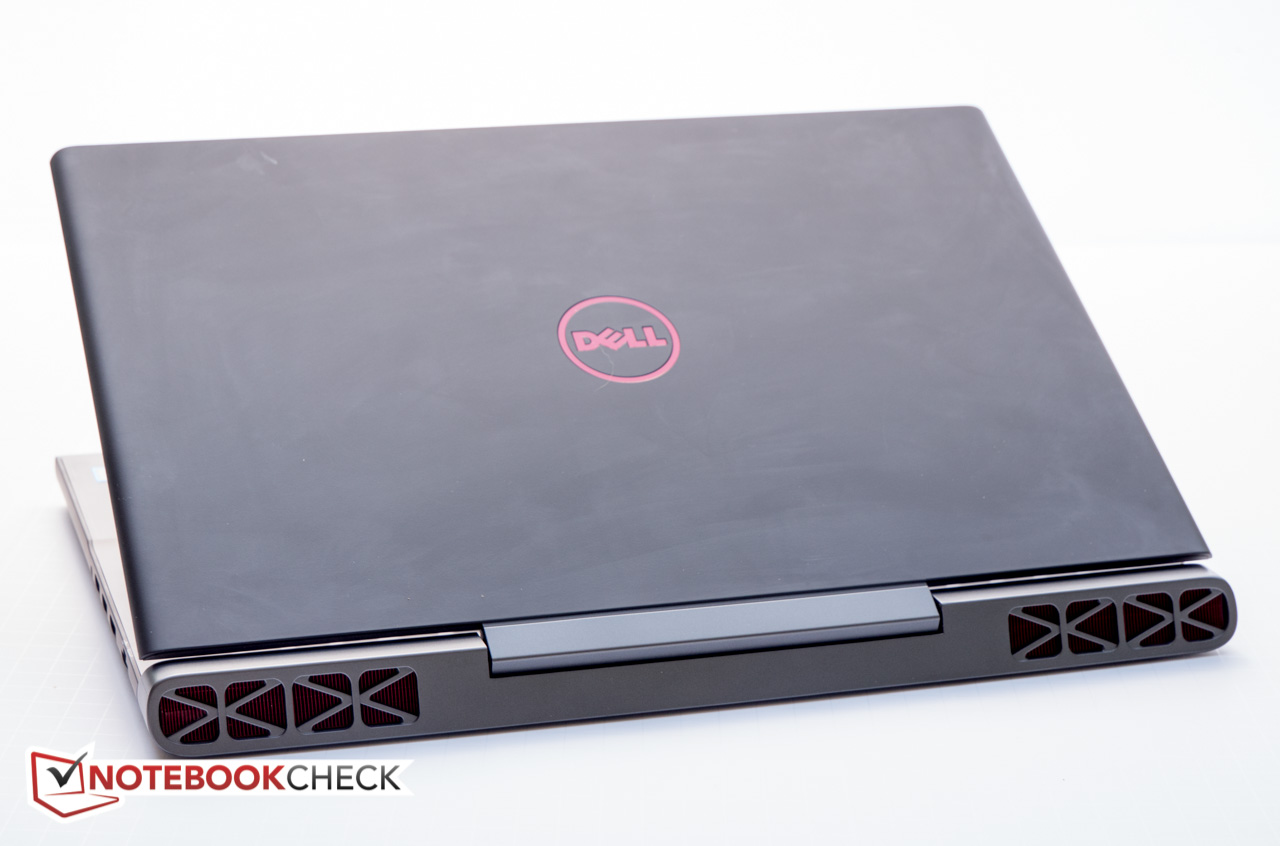
Per certi versi, la nostra recensione del Dell Inspiron 15 7000 7567 Gaming con i5-7300HQ e GTX 1050 non è andata liscia come ci aspettavamo: sulla carta, il portatile è semplicemente la versione meno potente del modello superiore. Mentre ovviamente le prestazioni sono inferiori proprio come ci aspettavamo, ci ha sopreso che il sistema sia più rumoroso, e si scaldi di più, con una autonomia anche inferiore. Doveva essere un affare, ma non sembra sia così: l'Inspiron è ben costruito, robusto, carino, con prestazioni decenti e con una autonomia di un giorno intero con applicazioni quotidiane. Ma la vera pecca è il display TN luminoso, ma con contrasto scarso, colori imprecisi e angoli di visuale molto ridotti.
L'Inspiron 15 7000 Gaming è uno dei sistemi gaming economici con autonomia maggiore. Il prezzo di $750 può essere considerato abbastanza onesto.
Per $850 l'Inspiron 15 7000 Gaming può essere ordinato con un SSD da 256 GB in aggiunta alla GTX 1050 Ti ed al display da 15,6" FHD (1920 x 1080) IPS. Considerato il display TN del nostro modello non dovreste pensarci su due volte se potete permettervi la spesa.
Nota: si tratta di una recensione breve, con alcune sezioni non tradotte, per la versione integrale in inglese guardate qui.
Dell Inspiron 15 7000 7567 Gaming (Core i5-7300HQ, GTX 1050)
- 08/07/2017 v6 (old)
Bernie Pechlaner
Price comparison
