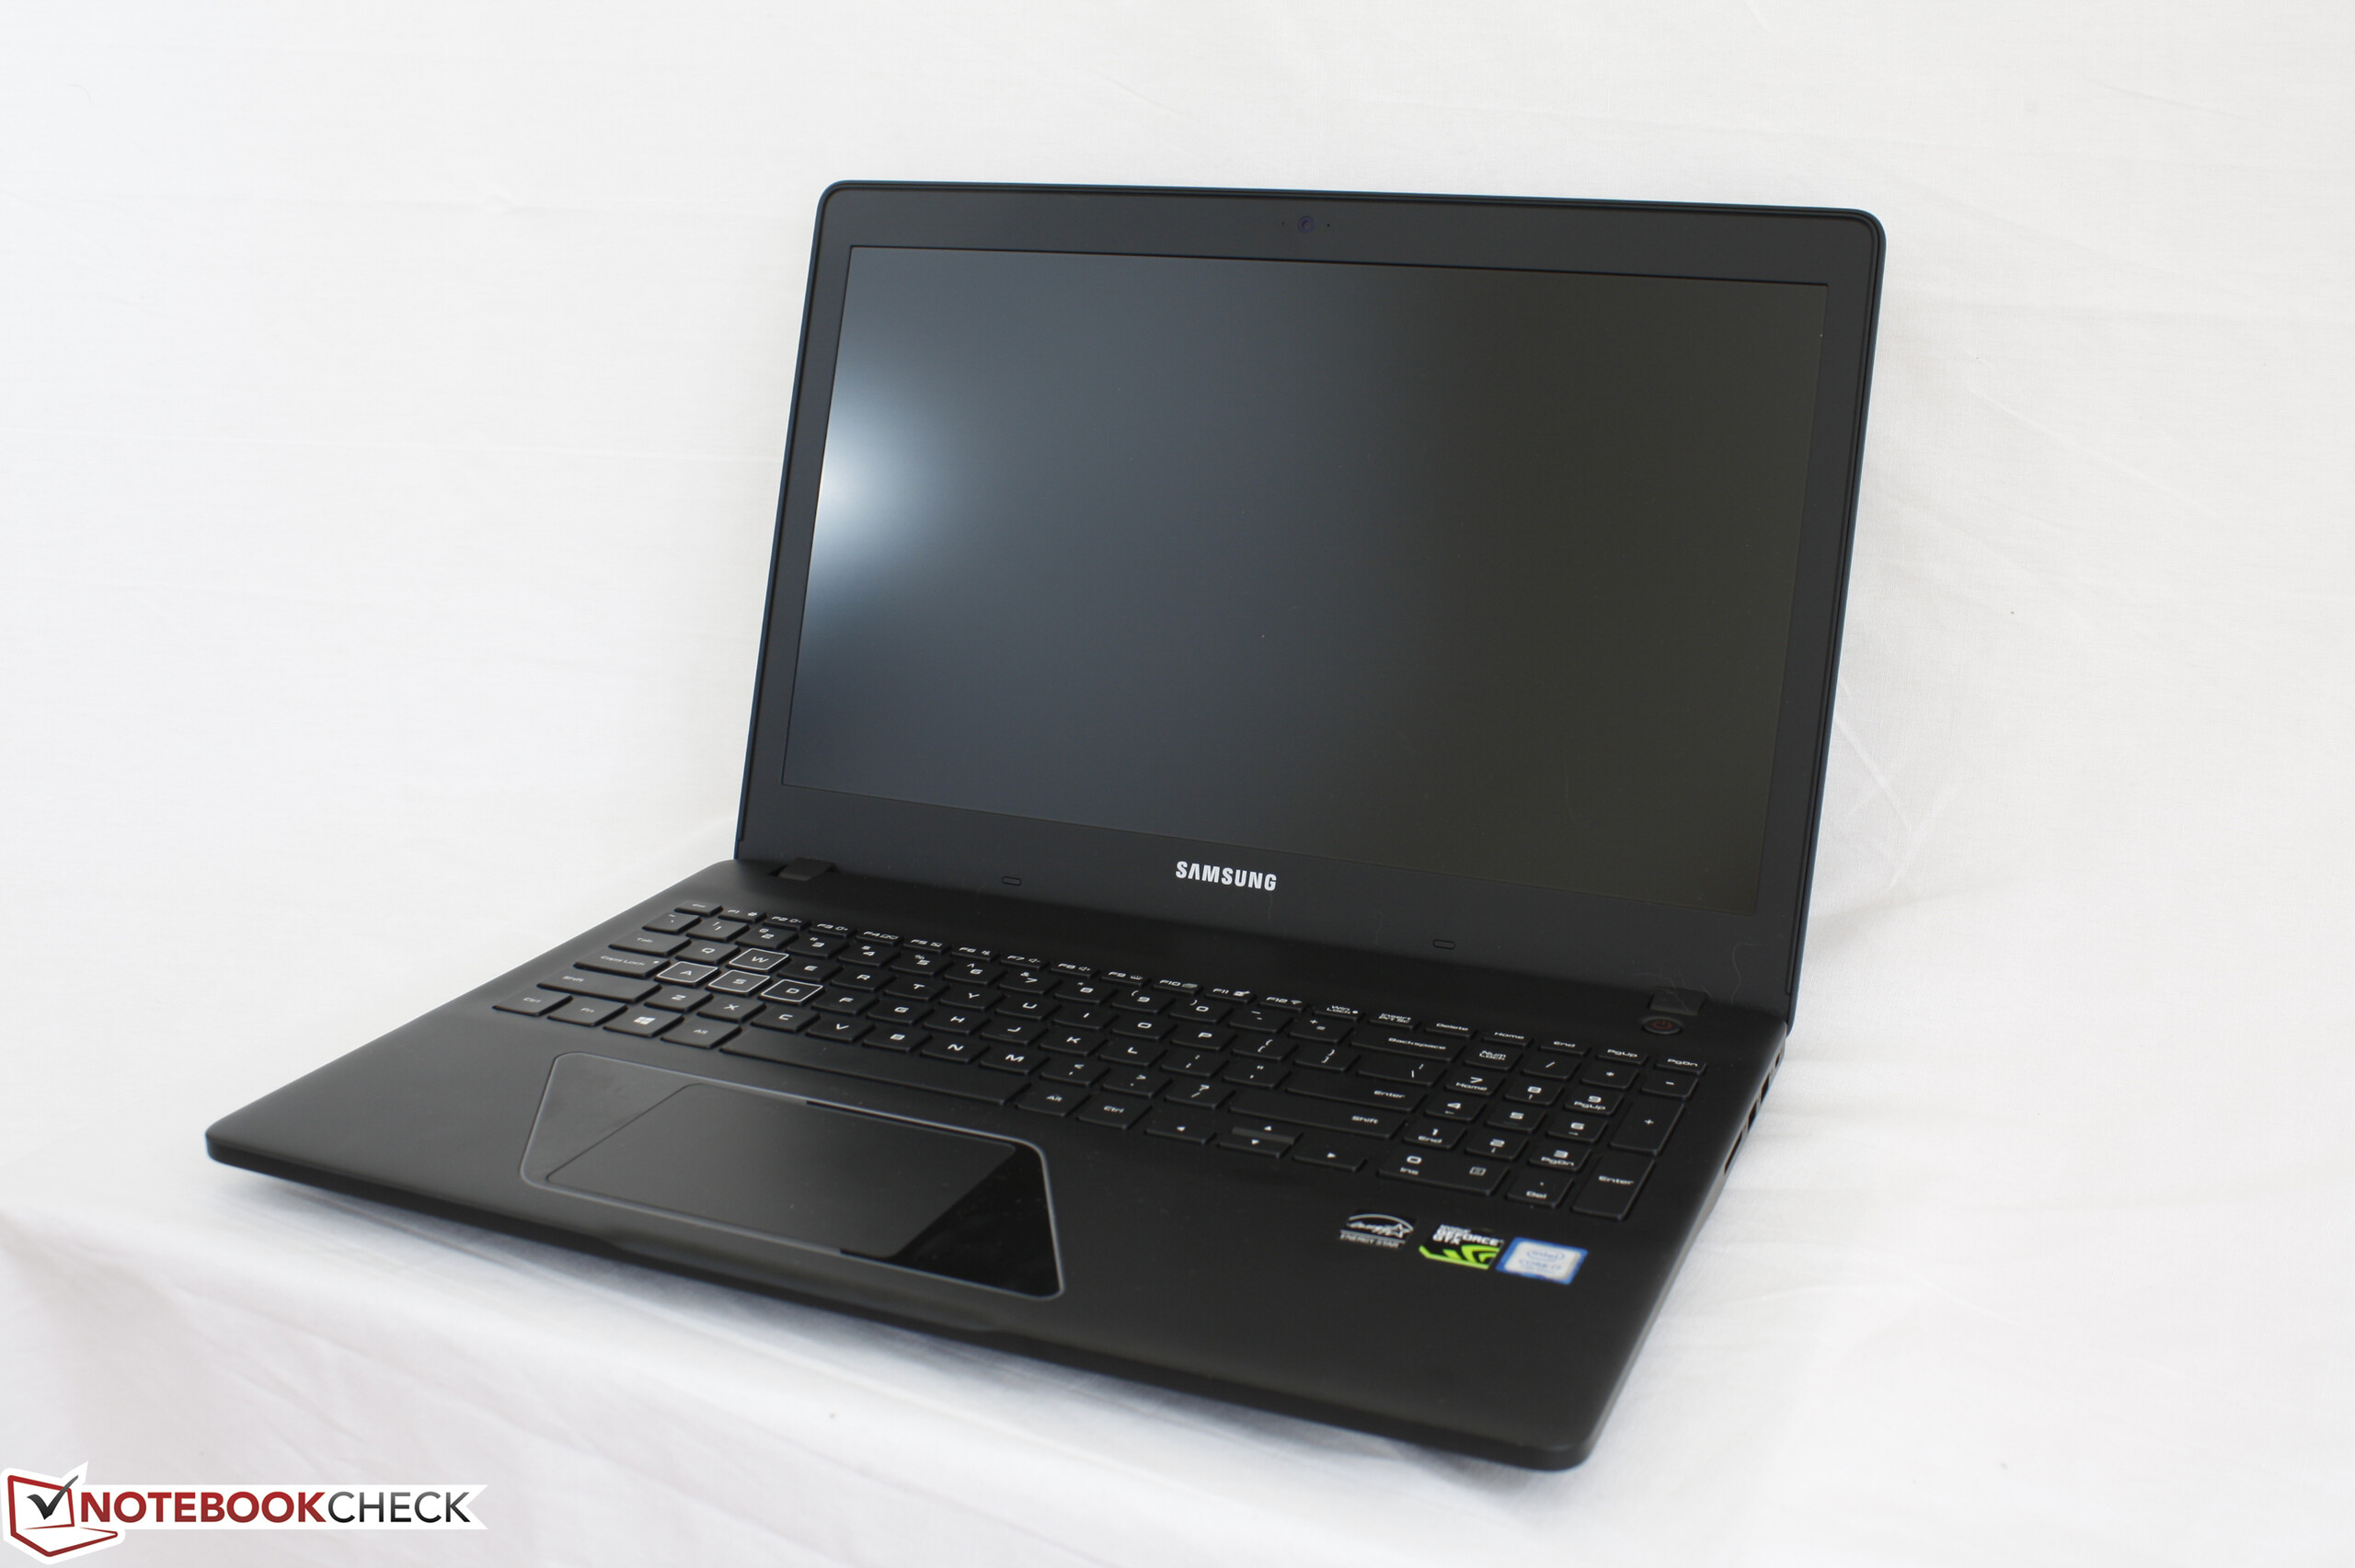
Recensione breve del Portatile Samsung Odyssey NP800G5M (7700HQ, FHD, GTX 1050)


| SD Card Reader | |
| average JPG Copy Test (av. of 3 runs) | |
| Dell XPS 15 9560 (i7-7700HQ, UHD) | |
| Asus FX502VM-AS73 | |
| Samsung Odyssey NP800G5M-X01US | |
| maximum AS SSD Seq Read Test (1GB) | |
| Dell XPS 15 9560 (i7-7700HQ, UHD) | |
| Asus FX502VM-AS73 | |
| Samsung Odyssey NP800G5M-X01US | |
| Networking | |
| iperf3 transmit AX12 | |
| HP Pavilion 15t-bc200 X7P44AV | |
| Asus FX502VM-AS73 | |
| Samsung Odyssey NP800G5M-X01US | |
| iperf3 receive AX12 | |
| HP Pavilion 15t-bc200 X7P44AV | |
| Asus FX502VM-AS73 | |
| Samsung Odyssey NP800G5M-X01US | |
| |||||||||||||||||||||||||
Distribuzione della luminosità: 90 %
Al centro con la batteria: 255.9 cd/m²
Contrasto: 533:1 (Nero: 0.48 cd/m²)
ΔE ColorChecker Calman: 5.9 | ∀{0.5-29.43 Ø4.71}
ΔE Greyscale Calman: 5.6 | ∀{0.09-98 Ø4.96}
70.1% sRGB (Argyll 1.6.3 3D)
44.8% AdobeRGB 1998 (Argyll 1.6.3 3D)
48.71% AdobeRGB 1998 (Argyll 3D)
70.4% sRGB (Argyll 3D)
47.11% Display P3 (Argyll 3D)
Gamma: 2.21
CCT: 7250 K
| Samsung Odyssey NP800G5M-X01US IPS, 15.6", 1920x1080 | Asus FX502VM-AS73 TN LED, 15.6", 1920x1080 | HP Pavilion 15t-bc200 X7P44AV LGD04D4, , 15.6", 3840x2160 | Dell XPS 15 2017 9560 (7300HQ, Full-HD) Sharp SHP1453 LQ156M1, LED IGZO IPS InfinityEdge, 15.6", 1920x1080 | Gigabyte P55W v7 LG Philips LP156WF6 (LGD046F), IPS, 15.6", 1920x1080 | Apple MacBook Pro 15 2016 (2.9 GHz, 460) Apple APPA030, IPS, 15.4", 2880x1800 | |
|---|---|---|---|---|---|---|
| Display | -19% | 34% | 44% | 25% | 77% | |
| Display P3 Coverage (%) | 47.11 | 38.28 -19% | 63 34% | 68.9 46% | 63.5 35% | 99 110% |
| sRGB Coverage (%) | 70.4 | 56.9 -19% | 94.4 34% | 98.9 40% | 82 16% | 100 42% |
| AdobeRGB 1998 Coverage (%) | 48.71 | 39.47 -19% | 64.8 33% | 70.9 46% | 59.9 23% | 87.3 79% |
| Response Times | 30% | 24% | -48% | 16% | -43% | |
| Response Time Grey 50% / Grey 80% * (ms) | 38.8 ? | 28.4 ? 27% | 30.4 ? 22% | 54 ? -39% | 37 ? 5% | 46 ? -19% |
| Response Time Black / White * (ms) | 33.6 ? | 22.4 ? 33% | 24.8 ? 26% | 52.4 ? -56% | 25 ? 26% | 56 ? -67% |
| PWM Frequency (Hz) | 19230 ? | 119000 ? | ||||
| Screen | -8% | 15% | 46% | 28% | 61% | |
| Brightness middle (cd/m²) | 255.9 | 209.5 -18% | 259 1% | 400 56% | 287 12% | 420 64% |
| Brightness (cd/m²) | 249 | 205 -18% | 255 2% | 392 57% | 289 16% | 401 61% |
| Brightness Distribution (%) | 90 | 92 2% | 87 -3% | 89 -1% | 87 -3% | 90 0% |
| Black Level * (cd/m²) | 0.48 | 0.69 -44% | 0.51 -6% | 0.26 46% | 0.29 40% | 0.3 37% |
| Contrast (:1) | 533 | 304 -43% | 508 -5% | 1538 189% | 990 86% | 1400 163% |
| Colorchecker dE 2000 * | 5.9 | 4.7 20% | 3.9 34% | 4.9 17% | 4.92 17% | 3.33 44% |
| Colorchecker dE 2000 max. * | 18.9 | 19.7 -4% | 6.9 63% | 11 42% | 11 42% | 5.11 73% |
| Greyscale dE 2000 * | 5.6 | 1.8 68% | 4.5 20% | 7.2 -29% | 3.66 35% | 2.73 51% |
| Gamma | 2.21 100% | 2.23 99% | 2.43 91% | 2.11 104% | 2.32 95% | 2.48 89% |
| CCT | 7250 90% | 6975 93% | 7257 90% | 6911 94% | 6482 100% | 6457 101% |
| Color Space (Percent of AdobeRGB 1998) (%) | 44.8 | 36.2 -19% | 59.5 33% | 64.2 43% | 54 21% | 78.09 74% |
| Color Space (Percent of sRGB) (%) | 70.1 | 56.6 -19% | 98.9 41% | 82 17% | 99.97 43% | |
| Media totale (Programma / Settaggio) | 1% /
-5% | 24% /
21% | 14% /
33% | 23% /
26% | 32% /
50% |
* ... Meglio usare valori piccoli
Tempi di risposta del Display
| ↔ Tempi di risposta dal Nero al Bianco | ||
|---|---|---|
| 33.6 ms ... aumenta ↗ e diminuisce ↘ combinato | ↗ 18.8 ms Incremento | 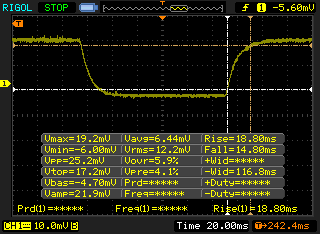 |
| ↘ 14.8 ms Calo | ||
| Lo schermo mostra tempi di risposta lenti nei nostri tests e sarà insoddisfacente per i gamers. In confronto, tutti i dispositivi di test variano da 0.1 (minimo) a 240 (massimo) ms. » 90 % di tutti i dispositivi è migliore. Questo significa che i tempi di risposta rilevati sono peggiori rispetto alla media di tutti i dispositivi testati (19.8 ms). | ||
| ↔ Tempo di risposta dal 50% Grigio all'80% Grigio | ||
| 38.8 ms ... aumenta ↗ e diminuisce ↘ combinato | ↗ 20.8 ms Incremento | 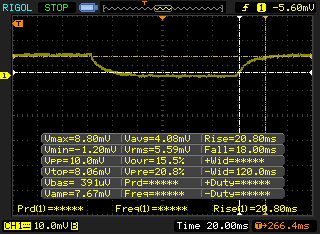 |
| ↘ 18 ms Calo | ||
| Lo schermo mostra tempi di risposta lenti nei nostri tests e sarà insoddisfacente per i gamers. In confronto, tutti i dispositivi di test variano da 0.165 (minimo) a 636 (massimo) ms. » 58 % di tutti i dispositivi è migliore. Questo significa che i tempi di risposta rilevati sono peggiori rispetto alla media di tutti i dispositivi testati (31 ms). | ||
Sfarfallio dello schermo / PWM (Pulse-Width Modulation)
| flickering dello schermo / PWM rilevato | 19230 Hz | ≤ 99 % settaggio luminosita' | 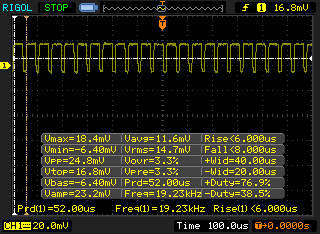 |
Il display sfarfalla a 19230 Hz (Probabilmente a causa dell'uso di PWM) Flickering rilevato ad una luminosita' di 99 % o inferiore. Non dovrebbe verificarsi flickering o PWM sopra questo valore di luminosita'. La frequenza di 19230 Hz è abbastanza alta, quindi la maggioranza degli utenti sensibili al PWM non dovrebbero notare alcun flickering. In confronto: 52 % di tutti i dispositivi testati non utilizza PWM per ridurre la luminosita' del display. Se è rilevato PWM, una media di 7757 (minimo: 5 - massimo: 343500) Hz è stata rilevata. | |||
| Cinebench R10 | |
| Rendering Multiple CPUs 32Bit | |
| Eurocom Tornado F5 | |
| Samsung Odyssey NP800G5M-X01US | |
| MSI GS63VR 7RF-228US | |
| MSI GT80 Titan SLI | |
| Asus GL702VM-GC102D | |
| Rendering Single 32Bit | |
| Eurocom Tornado F5 | |
| Samsung Odyssey NP800G5M-X01US | |
| MSI GS63VR 7RF-228US | |
| MSI GT80 Titan SLI | |
| Asus GL702VM-GC102D | |
| wPrime 2.10 - 1024m | |
| MSI GS63VR 7RF-228US | |
| Samsung Odyssey NP800G5M-X01US | |
| Eurocom Tornado F5 | |
* ... Meglio usare valori piccoli
| PCMark 8 | |
| Home Score Accelerated v2 | |
| Asus FX502VM-AS73 | |
| Gigabyte P55W v7 | |
| Samsung Odyssey NP800G5M-X01US | |
| Asus ROG Strix GL553VD-DS71 | |
| Dell XPS 15 2017 9560 (7300HQ, Full-HD) | |
| Work Score Accelerated v2 | |
| Gigabyte P55W v7 | |
| Samsung Odyssey NP800G5M-X01US | |
| Dell XPS 15 2017 9560 (7300HQ, Full-HD) | |
| Asus ROG Strix GL553VD-DS71 | |
| Asus FX502VM-AS73 | |
| Creative Score Accelerated v2 | |
| Asus FX502VM-AS73 | |
| Samsung Odyssey NP800G5M-X01US | |
| Asus ROG Strix GL553VD-DS71 | |
| PCMark 8 Home Score Accelerated v2 | 4001 punti | |
| PCMark 8 Creative Score Accelerated v2 | 5362 punti | |
| PCMark 8 Work Score Accelerated v2 | 5305 punti | |
Aiuto | ||
| Samsung Odyssey NP800G5M-X01US Samsung PM961 NVMe MZVLW128HEGR | Asus FX502VM-AS73 SK Hynix HFS256G39TND-N210A | HP Pavilion 15t-bc200 X7P44AV Intel SSD 600p SSDPEKKW256G7 | Asus ROG Strix GL553VD-DS71 HGST Travelstar 7K1000 HTS721010A9E630 | Dell XPS 15 9560 (i7-7700HQ, UHD) Lite-On CX2-8B512-Q11 | |
|---|---|---|---|---|---|
| CrystalDiskMark 3.0 | -46% | 19% | -93% | 94% | |
| Read Seq (MB/s) | 1518 | 503 -67% | 1115 -27% | 93.5 -94% | 1684 11% |
| Write Seq (MB/s) | 798 | 138.2 -83% | 311 -61% | 89.6 -89% | 1106 39% |
| Read 512 (MB/s) | 460.5 | 343.5 -25% | 706 53% | 39.06 -92% | 977 112% |
| Write 512 (MB/s) | 195.8 | 137.8 -30% | 472.3 141% | 51.1 -74% | 1119 472% |
| Read 4k (MB/s) | 47.16 | 29.36 -38% | 31.97 -32% | 0.57 -99% | 45.14 -4% |
| Write 4k (MB/s) | 143.1 | 70.9 -50% | 135.1 -6% | 1.05 -99% | 134.1 -6% |
| Read 4k QD32 (MB/s) | 521 | 369.9 -29% | 288.3 -45% | 1.06 -100% | 509 -2% |
| Write 4k QD32 (MB/s) | 176.4 | 99.7 -43% | 405.5 130% | 1.04 -99% | 398.1 126% |

| 3DMark 11 Performance | 7872 punti | |
| 3DMark Ice Storm Standard Score | 84774 punti | |
| 3DMark Cloud Gate Standard Score | 20291 punti | |
| 3DMark Fire Strike Score | 5455 punti | |
| 3DMark Fire Strike Extreme Score | 2678 punti | |
Aiuto | ||
| basso | medio | alto | ultra | |
|---|---|---|---|---|
| BioShock Infinite (2013) | 63.6 | |||
| Metro: Last Light (2013) | 78 | 43.8 | ||
| Thief (2014) | 73 | 40.4 | ||
| The Witcher 3 (2015) | 43 | 20.8 | ||
| Batman: Arkham Knight (2015) | 91 | 79 | 47 | 25 |
| Dota 2 Reborn (2015) | 115 | |||
| Fallout 4 (2015) | 41.5 | 34.2 | ||
| Rise of the Tomb Raider (2016) | 70.1 | 38.7 | 33.4 | |
| Ashes of the Singularity (2016) | 54.7 | 34.1 | 29.6 | |
| Doom (2016) | 47.5 | 43.5 | ||
| Overwatch (2016) | 95.3 | 54.2 |
Rumorosità
| Idle |
| 28.1 / 29.1 / 29.1 dB(A) |
| HDD |
| 29.1 dB(A) |
| Sotto carico |
| 49.2 / 49.2 dB(A) |
 | ||
30 dB silenzioso 40 dB(A) udibile 50 dB(A) rumoroso |
||
min: | ||
| Samsung Odyssey NP800G5M-X01US GeForce GTX 1050 Mobile, i7-7700HQ, Samsung PM961 NVMe MZVLW128HEGR | Asus FX502VM-AS73 GeForce GTX 1060 Mobile, i7-7700HQ, SK Hynix HFS256G39TND-N210A | HP Pavilion 15t-bc200 X7P44AV GeForce GTX 1050 Mobile, i7-7700HQ, Intel SSD 600p SSDPEKKW256G7 | Dell XPS 15 9560 (i7-7700HQ, UHD) GeForce GTX 1050 Mobile, i7-7700HQ, Lite-On CX2-8B512-Q11 | Gigabyte P55W v7 GeForce GTX 1060 Mobile, i7-7700HQ, Liteonit CV3-8D256 | Apple MacBook Pro 15 2016 (2.9 GHz, 460) Radeon Pro 460, 6920HQ, Apple SSD SM1024L | |
|---|---|---|---|---|---|---|
| Noise | -4% | -3% | -1% | -7% | 3% | |
| off /ambiente * (dB) | 28.1 | 28.7 -2% | 28.9 -3% | 28.4 -1% | 30 -7% | 29 -3% |
| Idle Minimum * (dB) | 28.1 | 30.6 -9% | 32.3 -15% | 29 -3% | 33 -17% | 30.3 -8% |
| Idle Average * (dB) | 29.1 | 30.6 -5% | 32.3 -11% | 29 -0% | 34 -17% | 30.3 -4% |
| Idle Maximum * (dB) | 29.1 | 31 -7% | 32.3 -11% | 32.2 -11% | 35 -20% | 30.3 -4% |
| Load Average * (dB) | 49.2 | 46.2 6% | 43.2 12% | 47.1 4% | 39 21% | 35.1 29% |
| Load Maximum * (dB) | 49.2 | 52.3 -6% | 45.2 8% | 47.1 4% | 50 -2% | 46 7% |
| Witcher 3 ultra * (dB) | 52 |
* ... Meglio usare valori piccoli
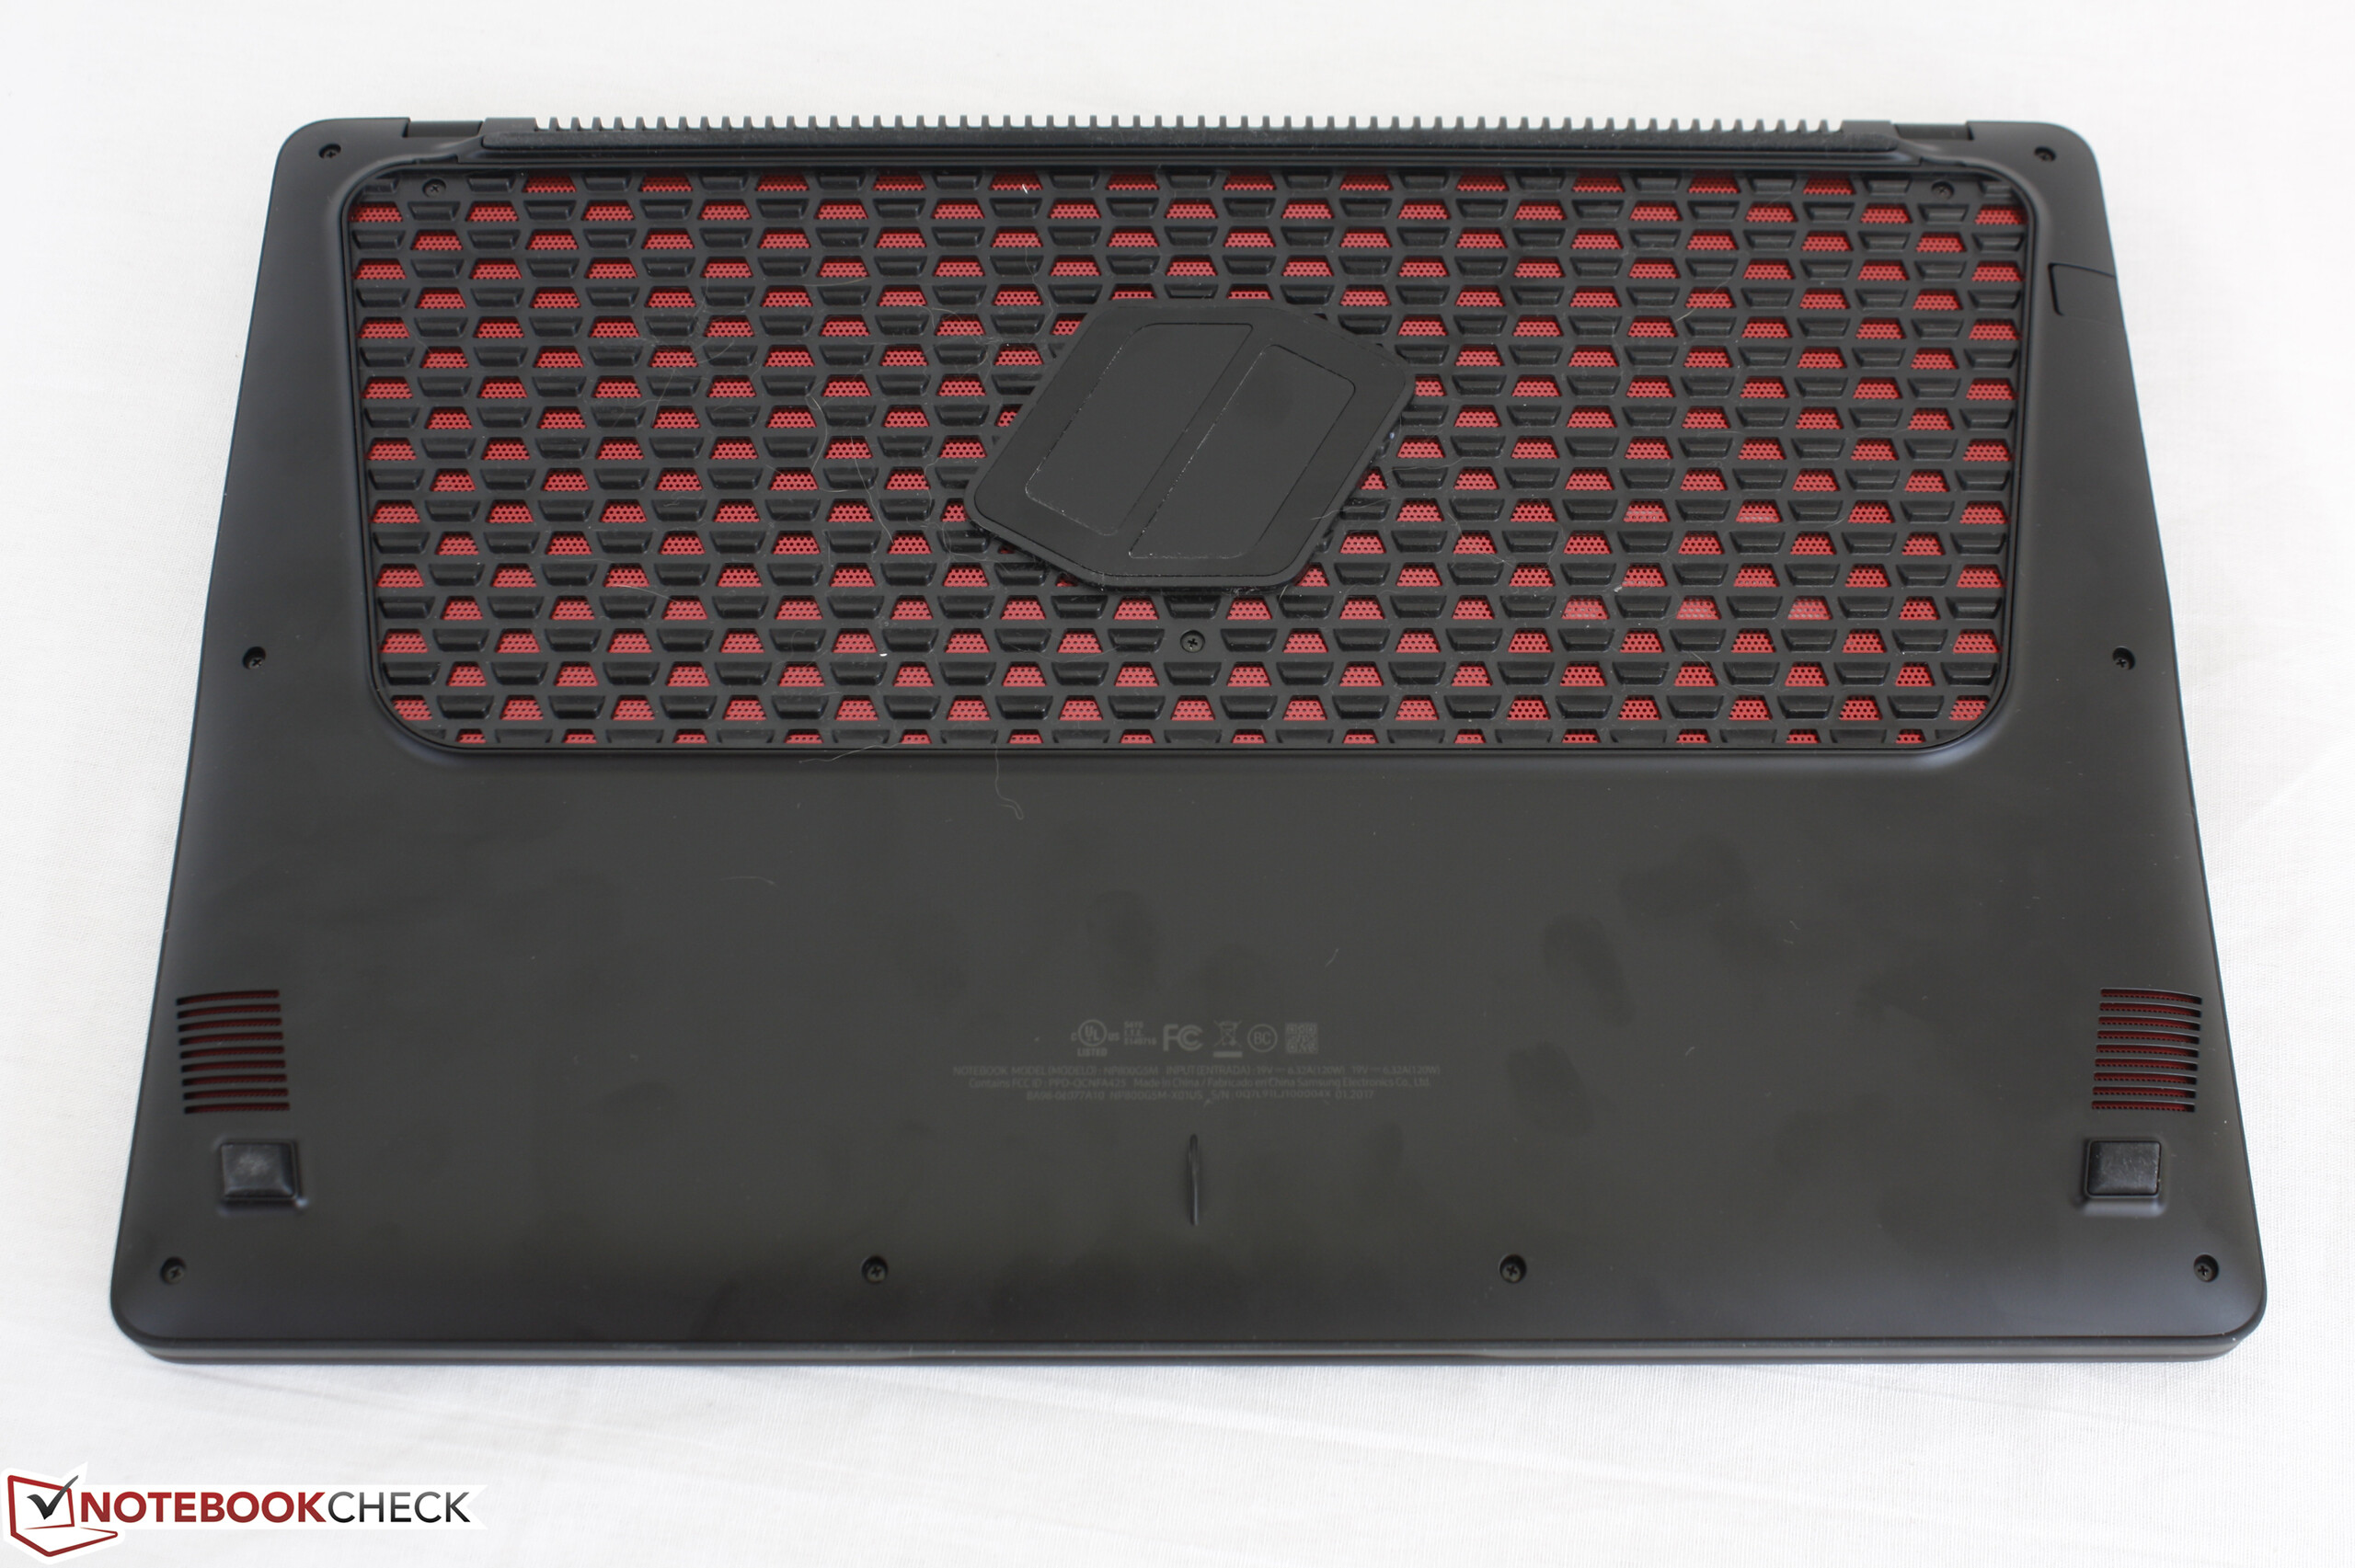
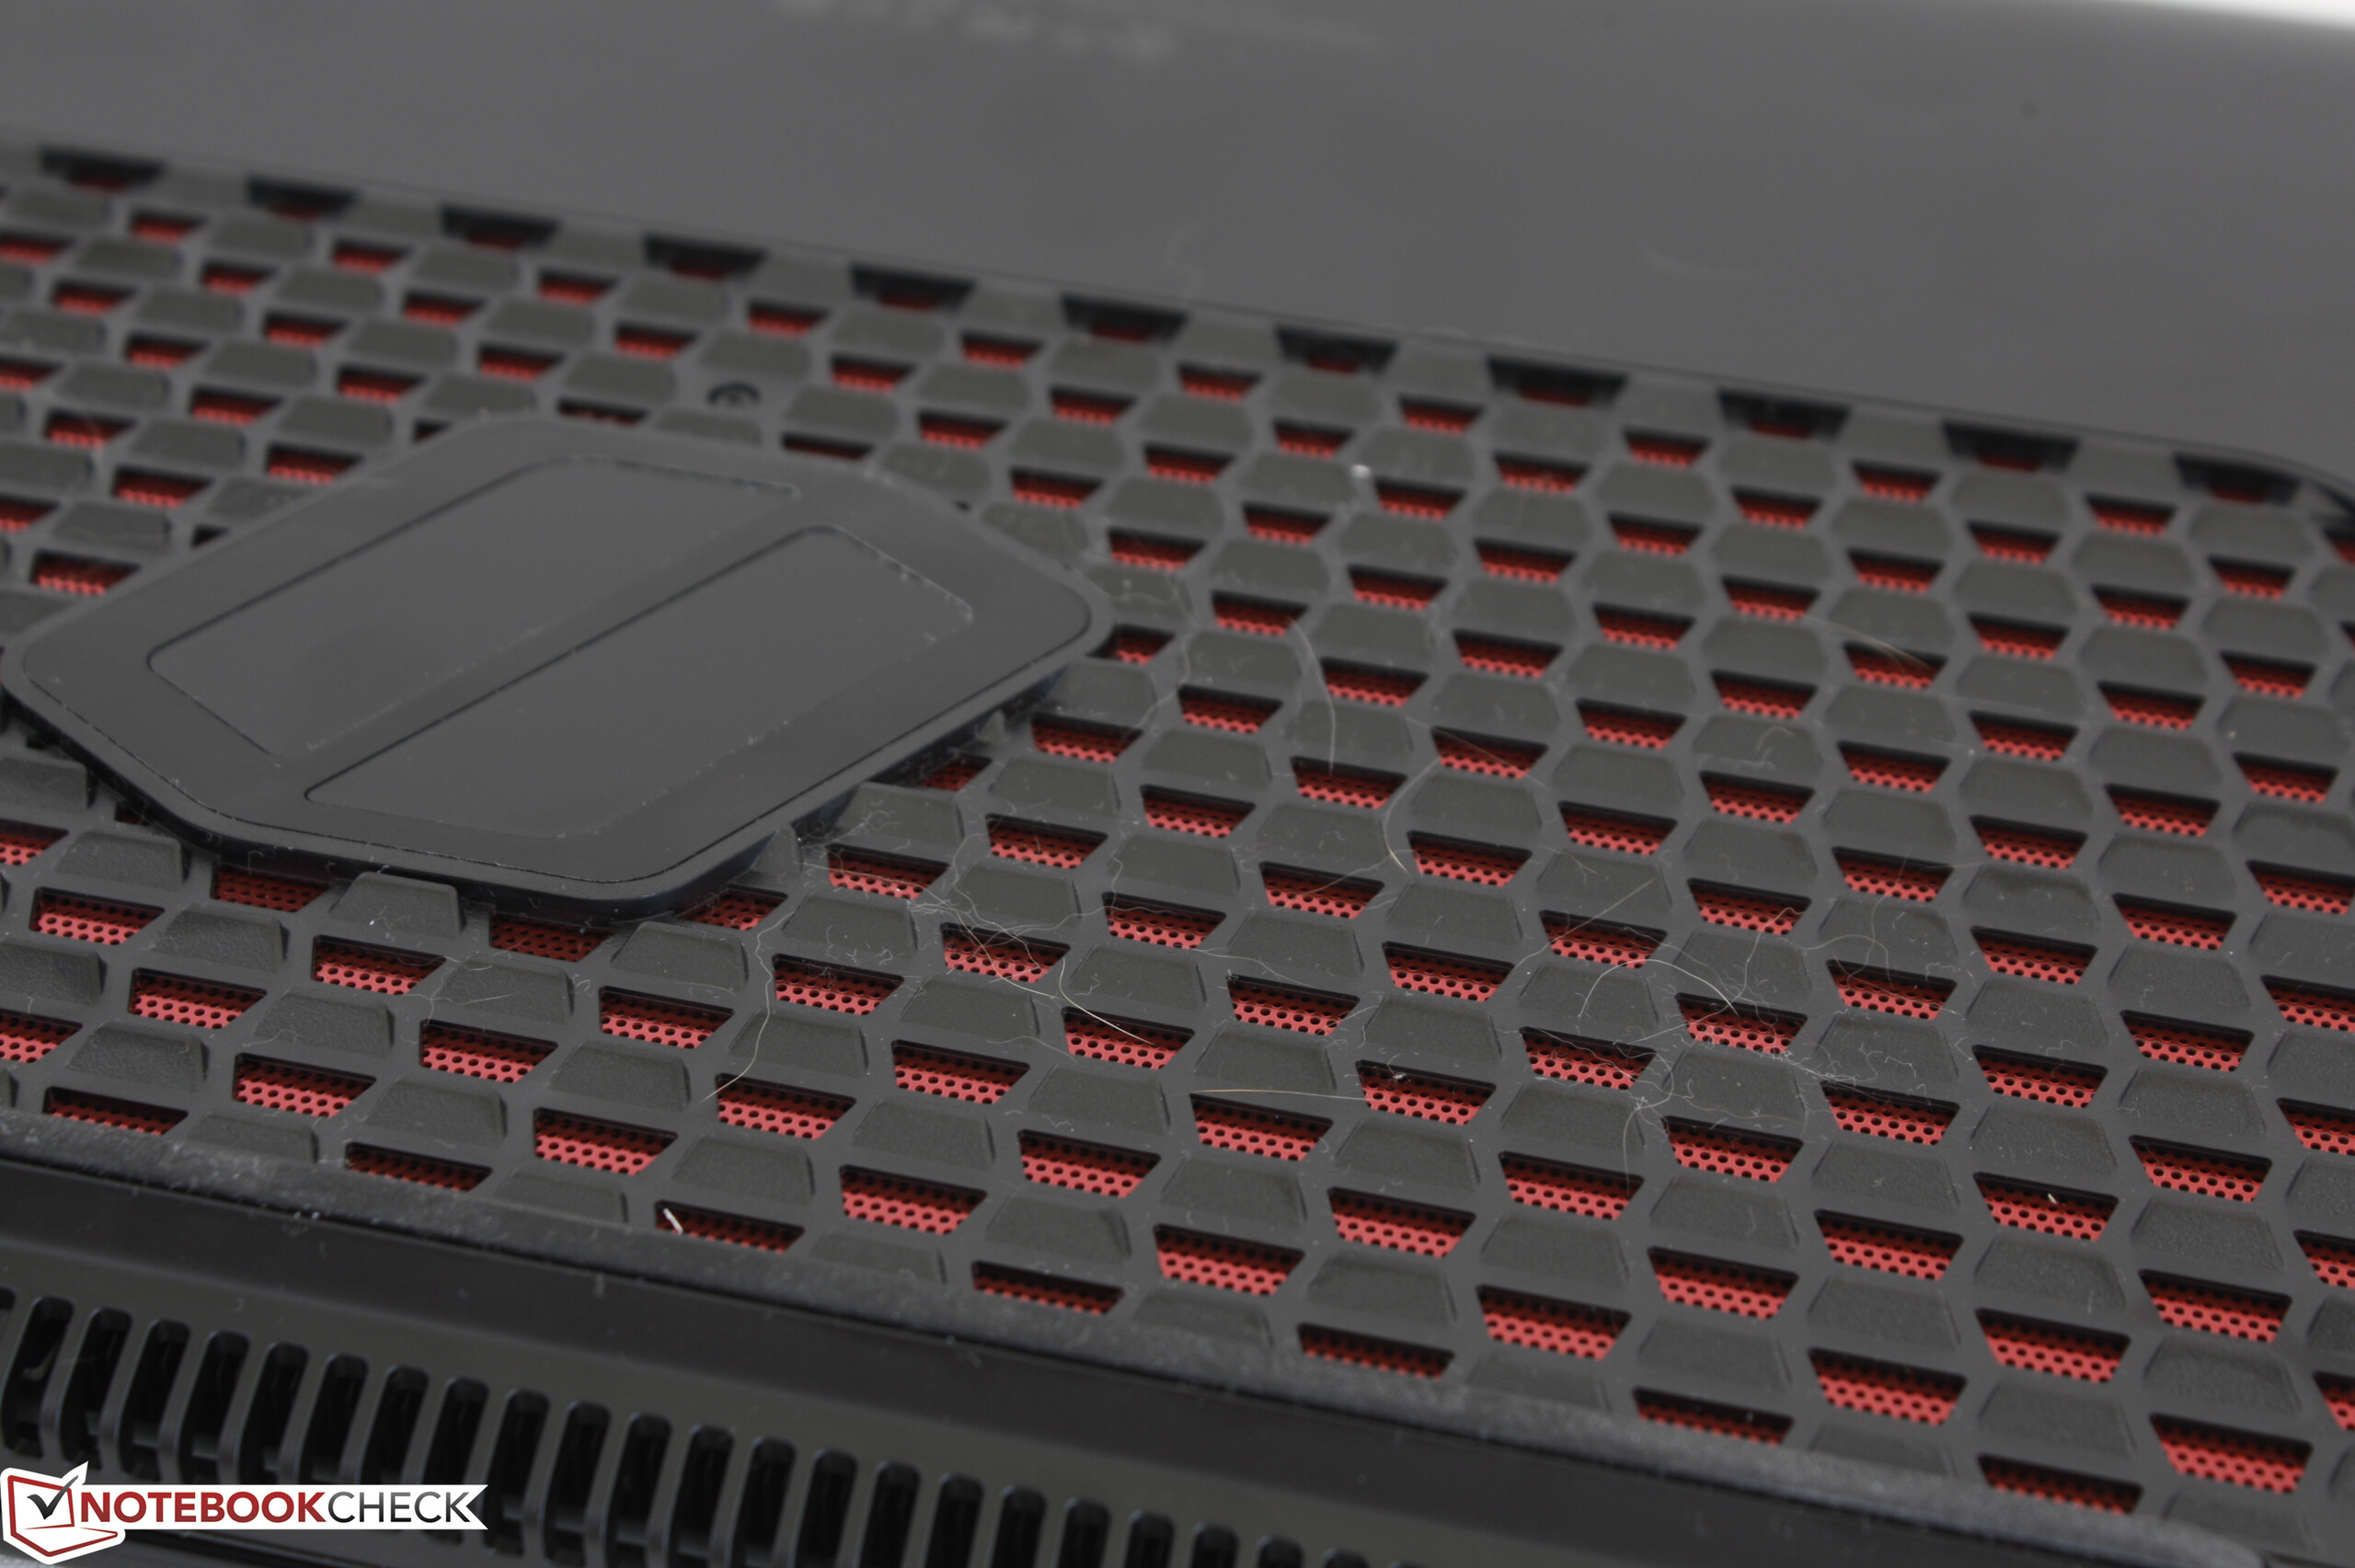
(-) La temperatura massima sul lato superiore è di 58.4 °C / 137 F, rispetto alla media di 40.4 °C / 105 F, che varia da 21.2 a 68.8 °C per questa classe Gaming.
(-) Il lato inferiore si riscalda fino ad un massimo di 54.2 °C / 130 F, rispetto alla media di 43.2 °C / 110 F
(+) In idle, la temperatura media del lato superiore è di 25.4 °C / 78 F, rispetto alla media deld ispositivo di 33.9 °C / 93 F.
(±) Riproducendo The Witcher 3, la temperatura media per il lato superiore e' di 33.8 °C / 93 F, rispetto alla media del dispositivo di 33.9 °C / 93 F.
(+) I poggiapolsi e il touchpad sono piu' freddi della temperatura della pelle con un massimo di 27 °C / 80.6 F e sono quindi freddi al tatto.
(±) La temperatura media della zona del palmo della mano di dispositivi simili e'stata di 28.8 °C / 83.8 F (+1.8 °C / 3.2 F).
Samsung Odyssey NP800G5M-X01US analisi audio
(-) | altoparlanti non molto potenti (63.1 dB)
Bassi 100 - 315 Hz
(-) | quasi nessun basso - in media 15.2% inferiori alla media
(±) | la linearità dei bassi è media (13.7% delta rispetto alla precedente frequenza)
Medi 400 - 2000 Hz
(+) | medi bilanciati - solo only 2% rispetto alla media
(±) | linearità dei medi adeguata (10.1% delta rispetto alla precedente frequenza)
Alti 2 - 16 kHz
(±) | alti elevati - circa 8.4% superiori alla media
(±) | la linearità degli alti è media (11.5% delta rispetto alla precedente frequenza)
Nel complesso 100 - 16.000 Hz
(-) | suono nel complesso non lineare (37.2% di differenza rispetto alla media
Rispetto alla stessa classe
» 99% di tutti i dispositivi testati in questa classe è stato migliore, 0% simile, 1% peggiore
» Il migliore ha avuto un delta di 6%, medio di 18%, peggiore di 132%
Rispetto a tutti i dispositivi testati
» 94% di tutti i dispositivi testati in questa classe è stato migliore, 1% similare, 5% peggiore
» Il migliore ha avuto un delta di 4%, medio di 23%, peggiore di 134%
Apple MacBook 12 (Early 2016) 1.1 GHz analisi audio
(+) | gli altoparlanti sono relativamente potenti (83.6 dB)
Bassi 100 - 315 Hz
(±) | bassi ridotti - in media 11.3% inferiori alla media
(±) | la linearità dei bassi è media (14.2% delta rispetto alla precedente frequenza)
Medi 400 - 2000 Hz
(+) | medi bilanciati - solo only 2.4% rispetto alla media
(+) | medi lineari (5.5% delta rispetto alla precedente frequenza)
Alti 2 - 16 kHz
(+) | Alti bilanciati - appena 2% dalla media
(+) | alti lineari (4.5% delta rispetto alla precedente frequenza)
Nel complesso 100 - 16.000 Hz
(+) | suono nel complesso lineare (10.2% differenza dalla media)
Rispetto alla stessa classe
» 7% di tutti i dispositivi testati in questa classe è stato migliore, 2% simile, 90% peggiore
» Il migliore ha avuto un delta di 5%, medio di 18%, peggiore di 53%
Rispetto a tutti i dispositivi testati
» 5% di tutti i dispositivi testati in questa classe è stato migliore, 1% similare, 94% peggiore
» Il migliore ha avuto un delta di 4%, medio di 23%, peggiore di 134%
| Off / Standby | |
| Idle | |
| Sotto carico |
|
Leggenda:
min: | |
| Samsung Odyssey NP800G5M-X01US | Asus FX502VM-AS73 | Dell XPS 15 2017 9560 (7300HQ, Full-HD) | Asus ROG Strix GL553VD-DS71 | Gigabyte P55W v7 | Apple MacBook Pro 15 2016 (2.9 GHz, 460) | |
|---|---|---|---|---|---|---|
| Power Consumption | -57% | 0% | -12% | -28% | 14% | |
| Idle Minimum * (Watt) | 6.7 | 14.9 -122% | 6.6 1% | 7.7 -15% | 8 -19% | 3 55% |
| Idle Average * (Watt) | 8.9 | 15.1 -70% | 9 -1% | 11.7 -31% | 13 -46% | 9.9 -11% |
| Idle Maximum * (Watt) | 10.8 | 15.2 -41% | 10.7 1% | 12 -11% | 18 -67% | 12.5 -16% |
| Load Average * (Watt) | 81.8 | 105.8 -29% | 77.5 5% | 80.5 2% | 76 7% | 70.6 14% |
| Witcher 3 ultra * (Watt) | 92.2 | |||||
| Load Maximum * (Watt) | 122.7 | 148.8 -21% | 130 -6% | 128.4 -5% | 143 -17% | 90.8 26% |
* ... Meglio usare valori piccoli
| Samsung Odyssey NP800G5M-X01US i7-7700HQ, GeForce GTX 1050 Mobile, 43 Wh | Asus FX502VM-AS73 i7-7700HQ, GeForce GTX 1060 Mobile, 64 Wh | Dell XPS 15 2017 9560 (7300HQ, Full-HD) i5-7300HQ, GeForce GTX 1050 Mobile, 56 Wh | Asus ROG Strix GL553VD-DS71 i7-7700HQ, GeForce GTX 1050 Mobile, 48 Wh | Gigabyte P55W v7 i7-7700HQ, GeForce GTX 1060 Mobile, 63 Wh | Apple MacBook Pro 15 2016 (2.9 GHz, 460) 6920HQ, Radeon Pro 460, 76 Wh | |
|---|---|---|---|---|---|---|
| Autonomia della batteria | -17% | 9% | -20% | 28% | 52% | |
| Reader / Idle (h) | 10.2 | 6.1 -40% | 9.4 -8% | 7.3 -28% | 13.2 29% | |
| WiFi v1.3 (h) | 4.4 | 4.6 5% | 5.6 27% | 4.6 5% | 5.8 32% | 10.3 134% |
| Load (h) | 1.3 | 1.1 -15% | 1.4 8% | 0.8 -38% | 1.6 23% | 0.9 -31% |
Pro
Contro
Le nostre impressioni sul primo portatile Odyssey sono miste. Da un lato il sistema ha prestazioni ammirabili senza throttling di CPU o GPU ed ha temperature basse per un portatile gaming. Le sue capacità di tenere elevati valori clock di Turbo Boost sono qualcosa che il portatili gaming supersottili non riescono a fare facilmente, quindi l'Odyssey ha mostrato buone capacità.
A parte le performance affidabili, l'Odyssey ha anche degli aspetti negativi. Innanzitutto la ventola rumorosa, anche per un portatile gaming. Con quasi 50 dB(A), siamo ai livelli di potenti GPUs come GTX 1070 o GTX 1080 - non della GTX 1050. I controlli manuali della ventola avrebbero consentito di bilanciare meglio la rumorosità e le temperature, in modo da godersi meglio i giochi.
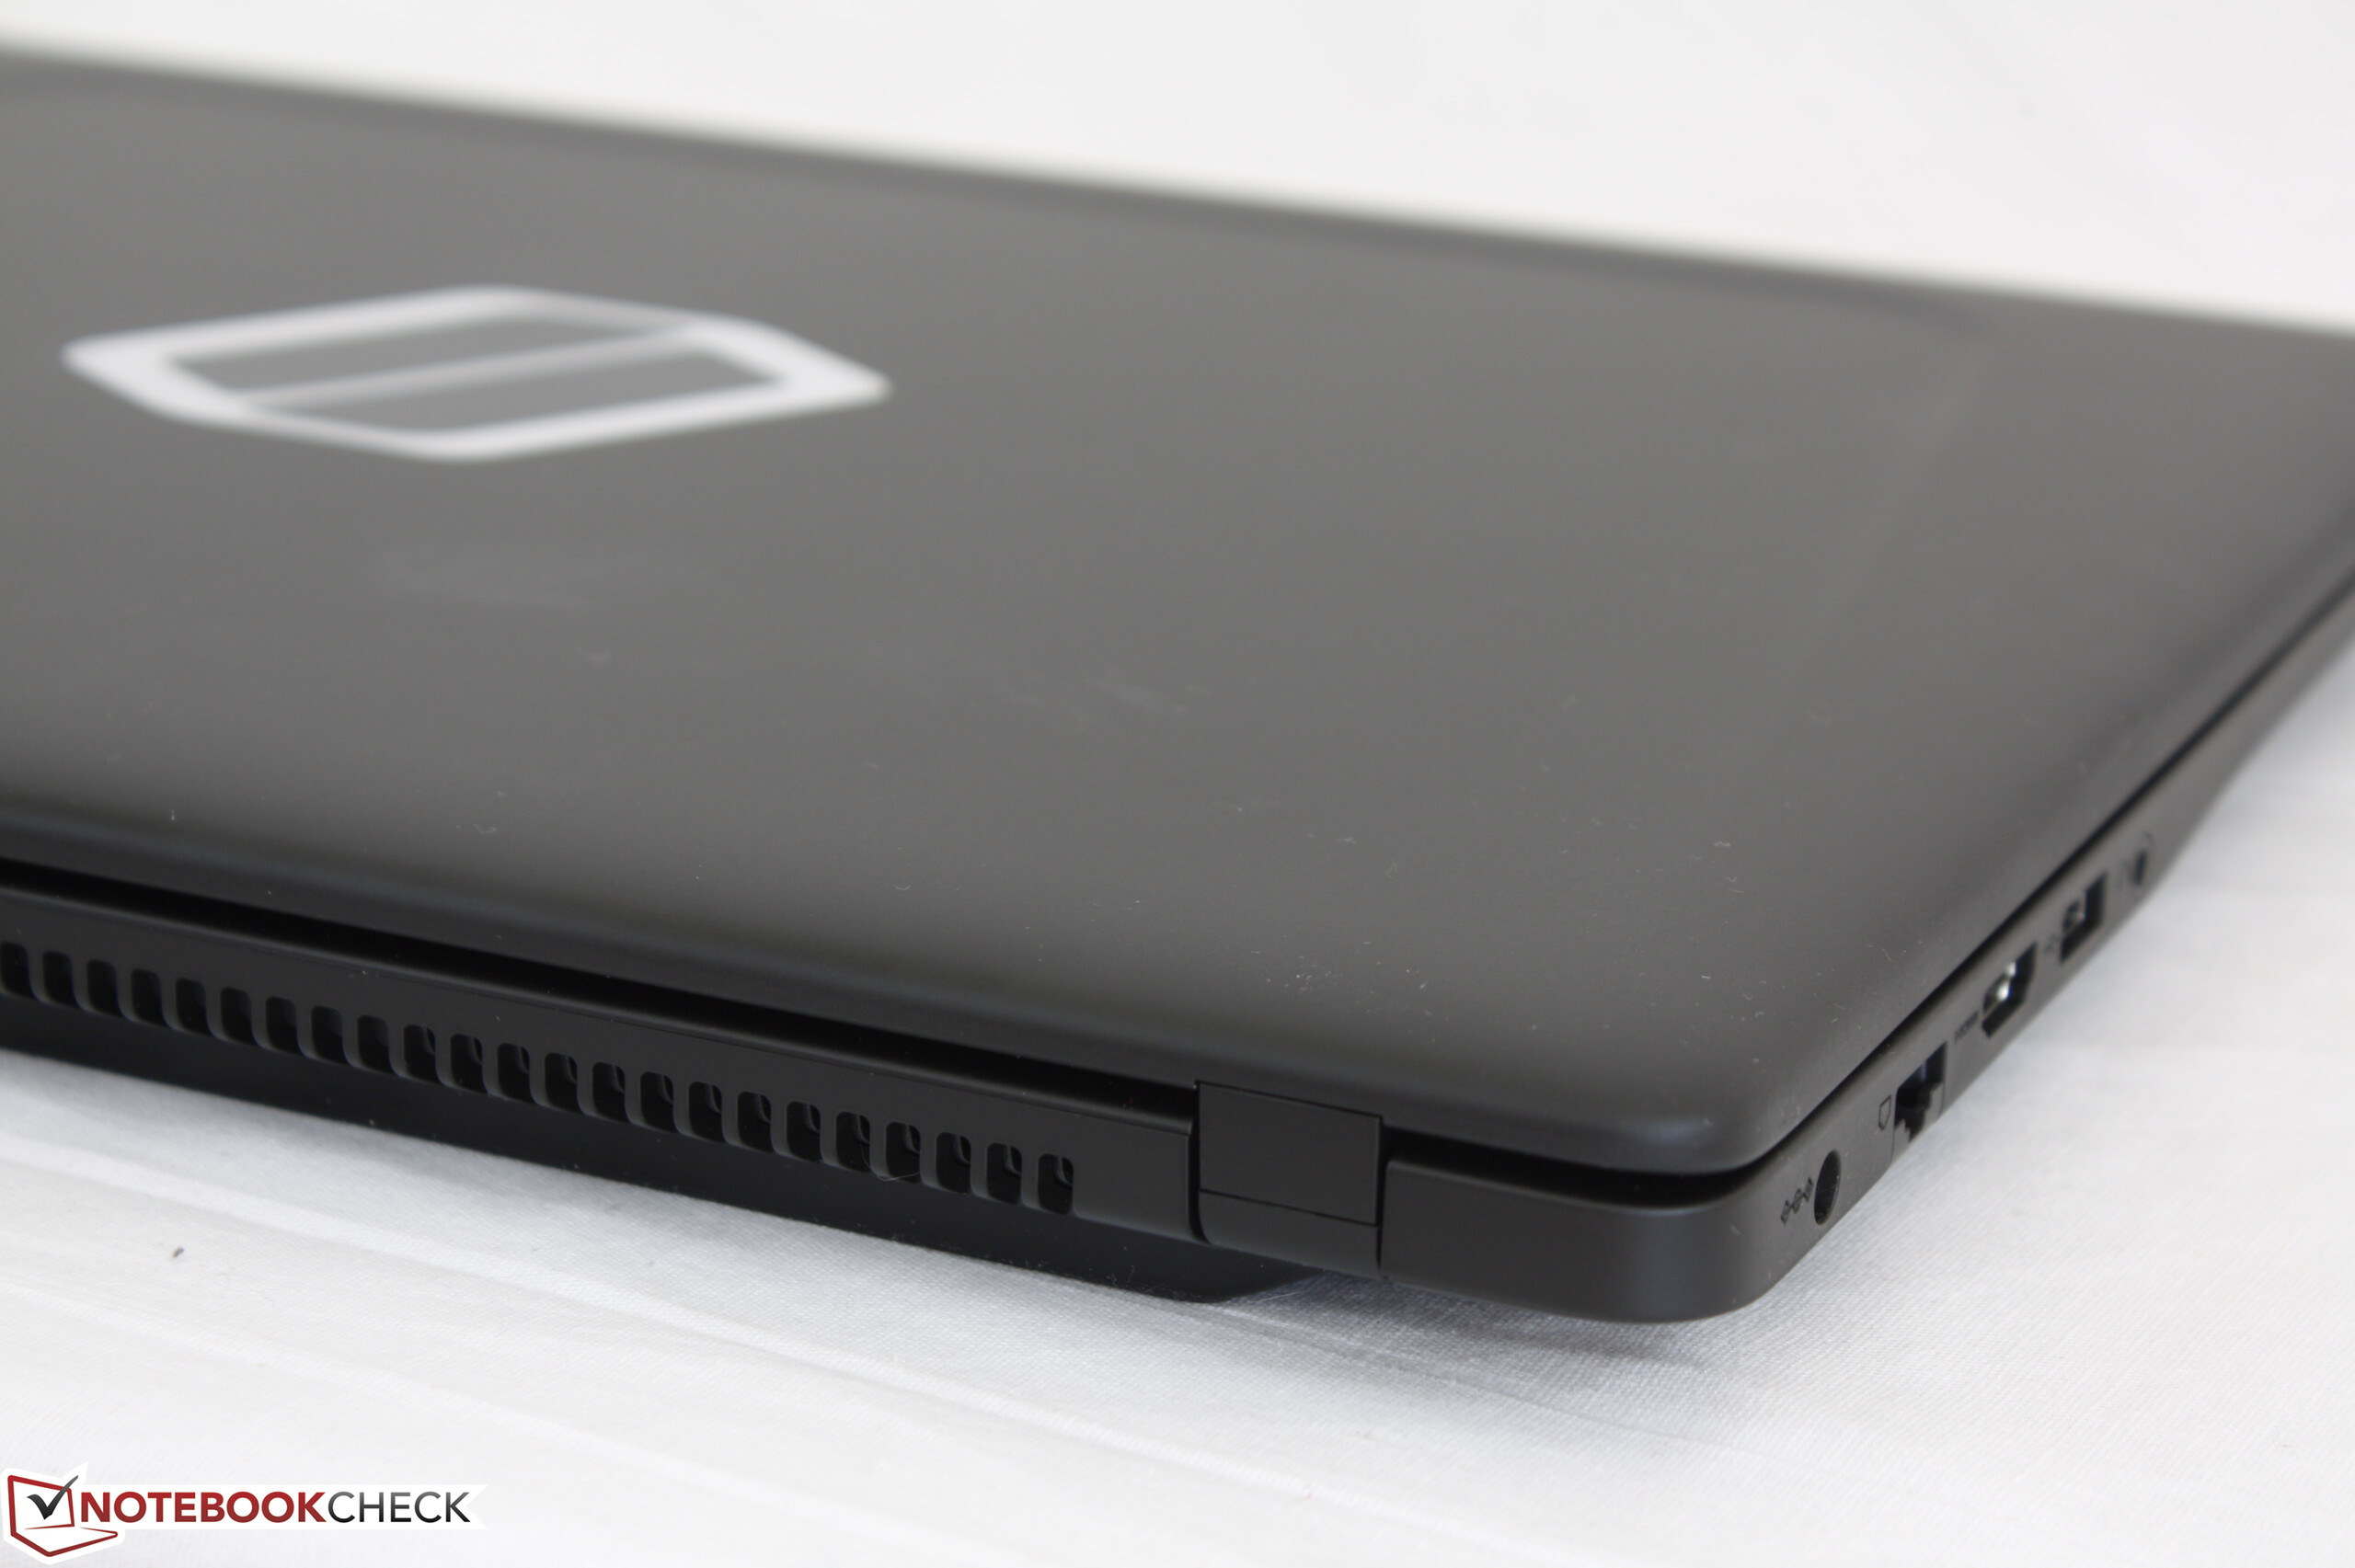
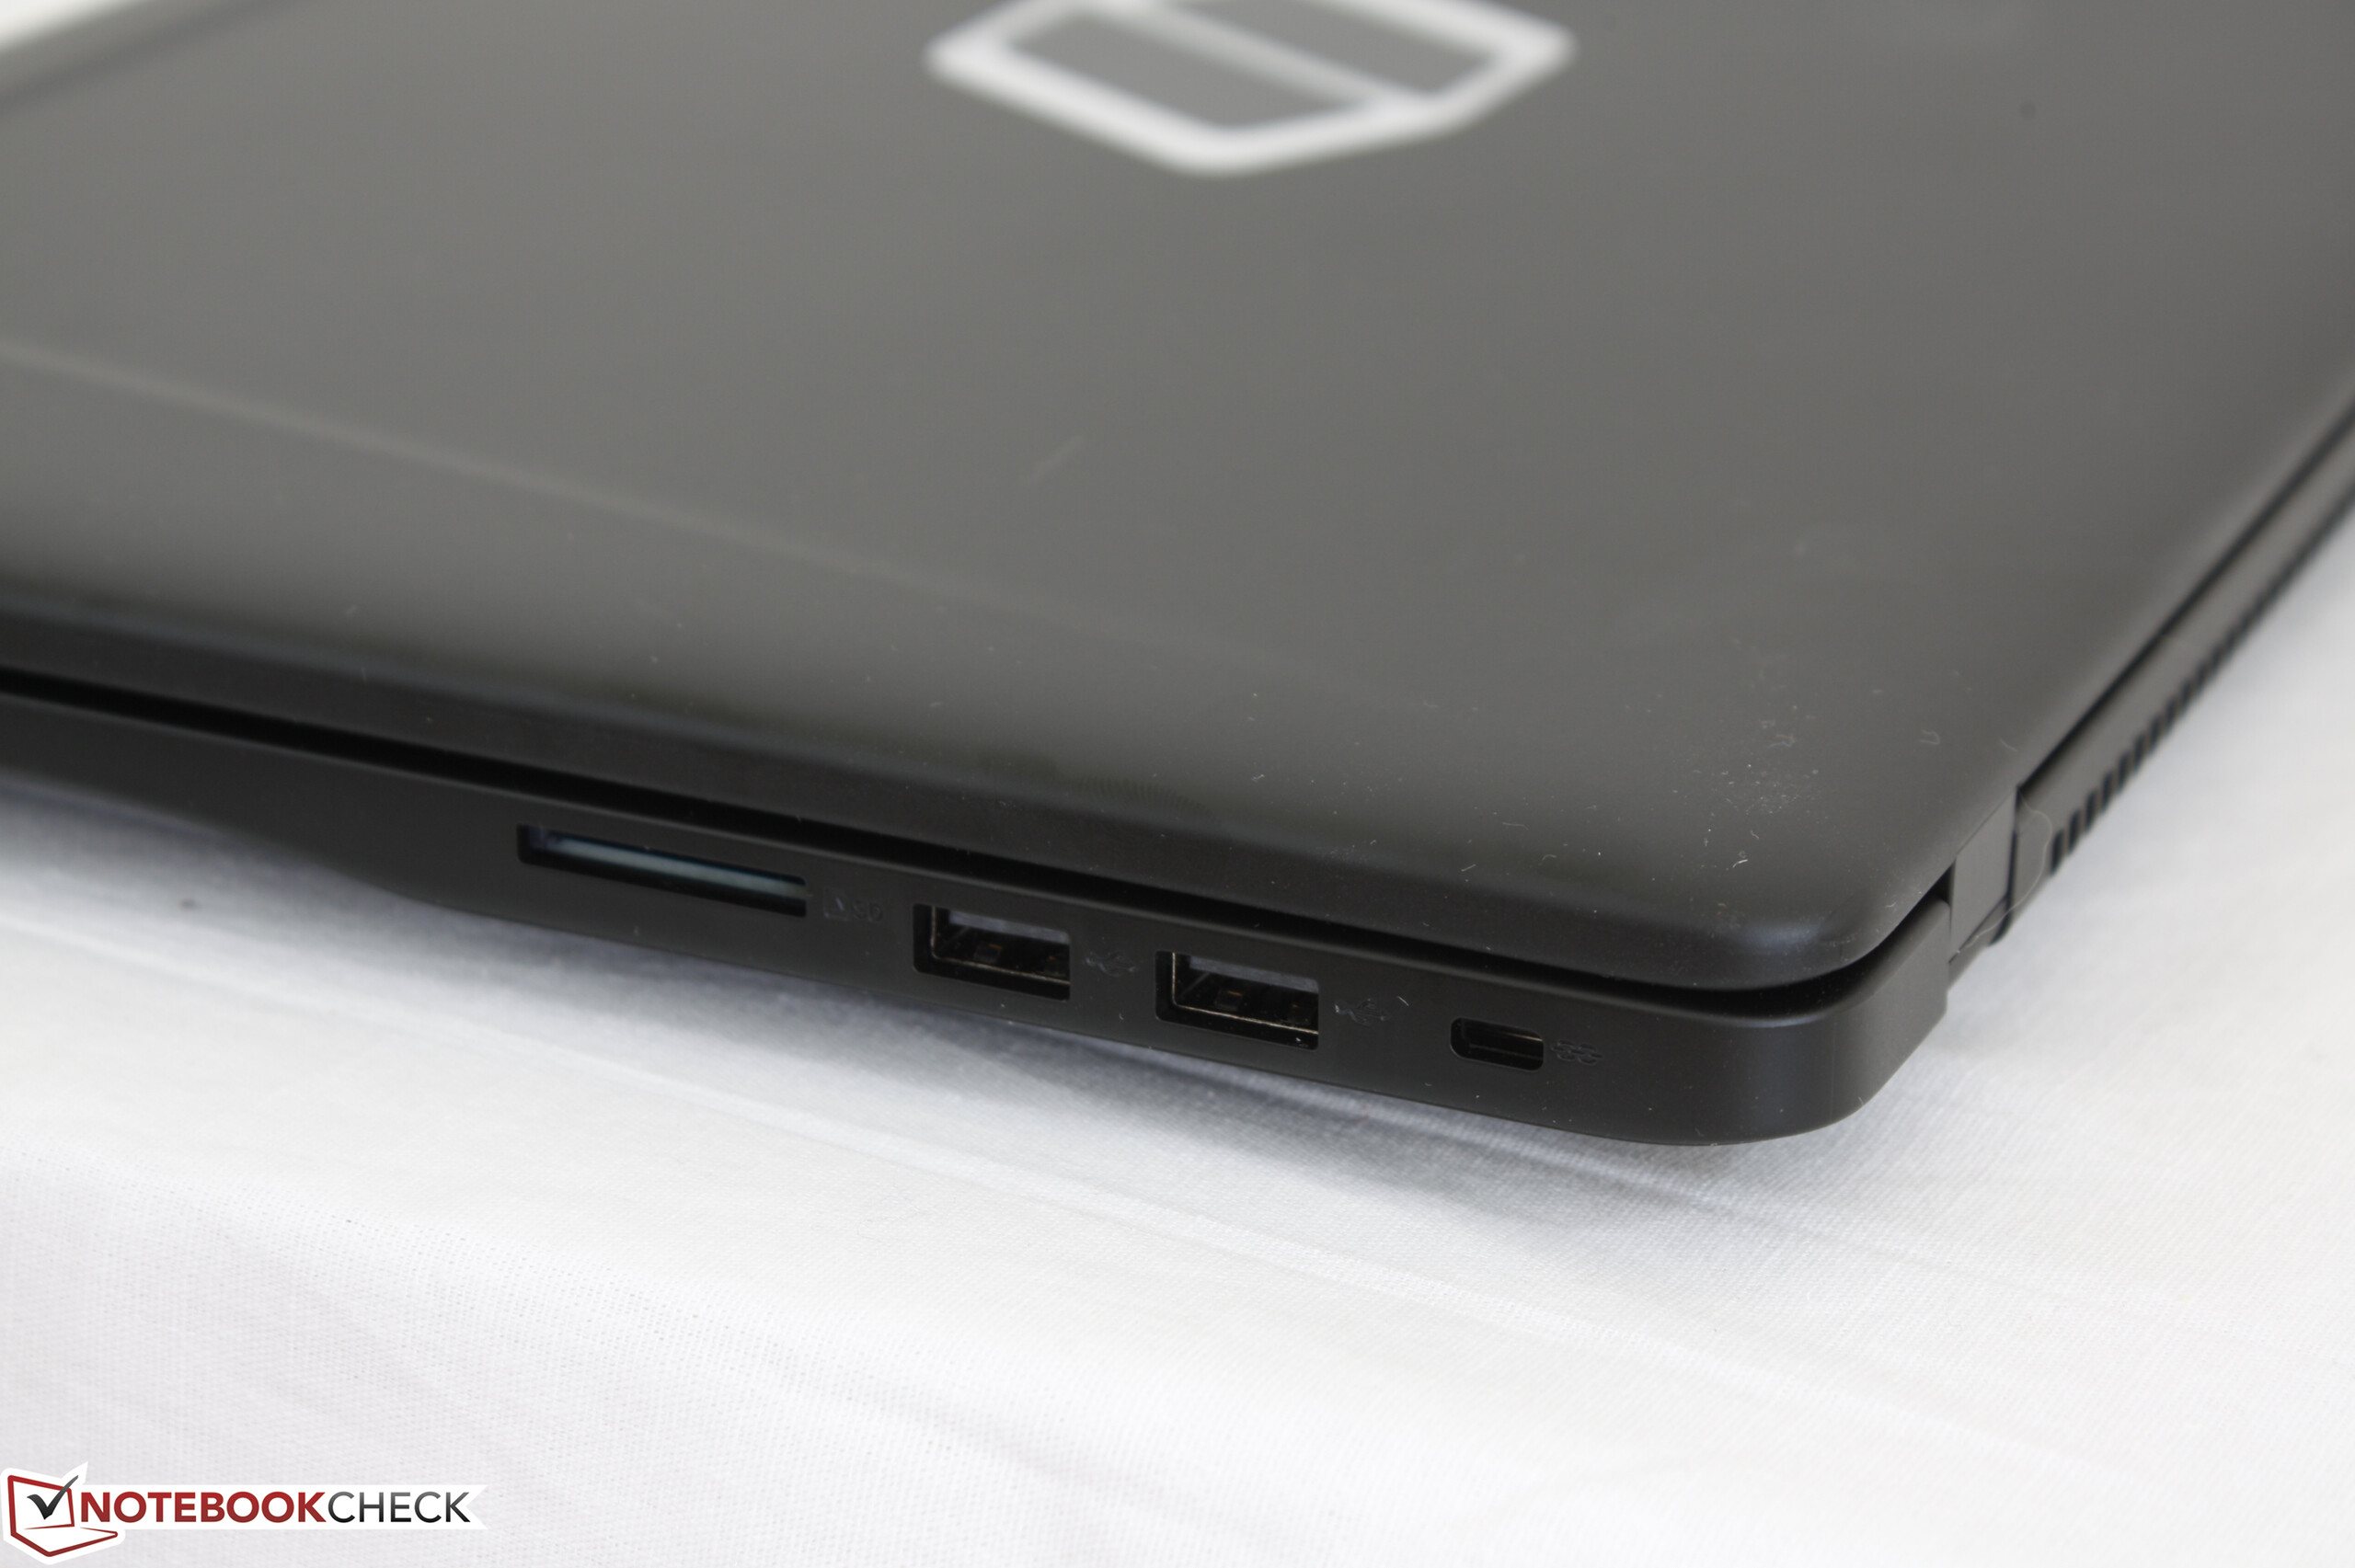
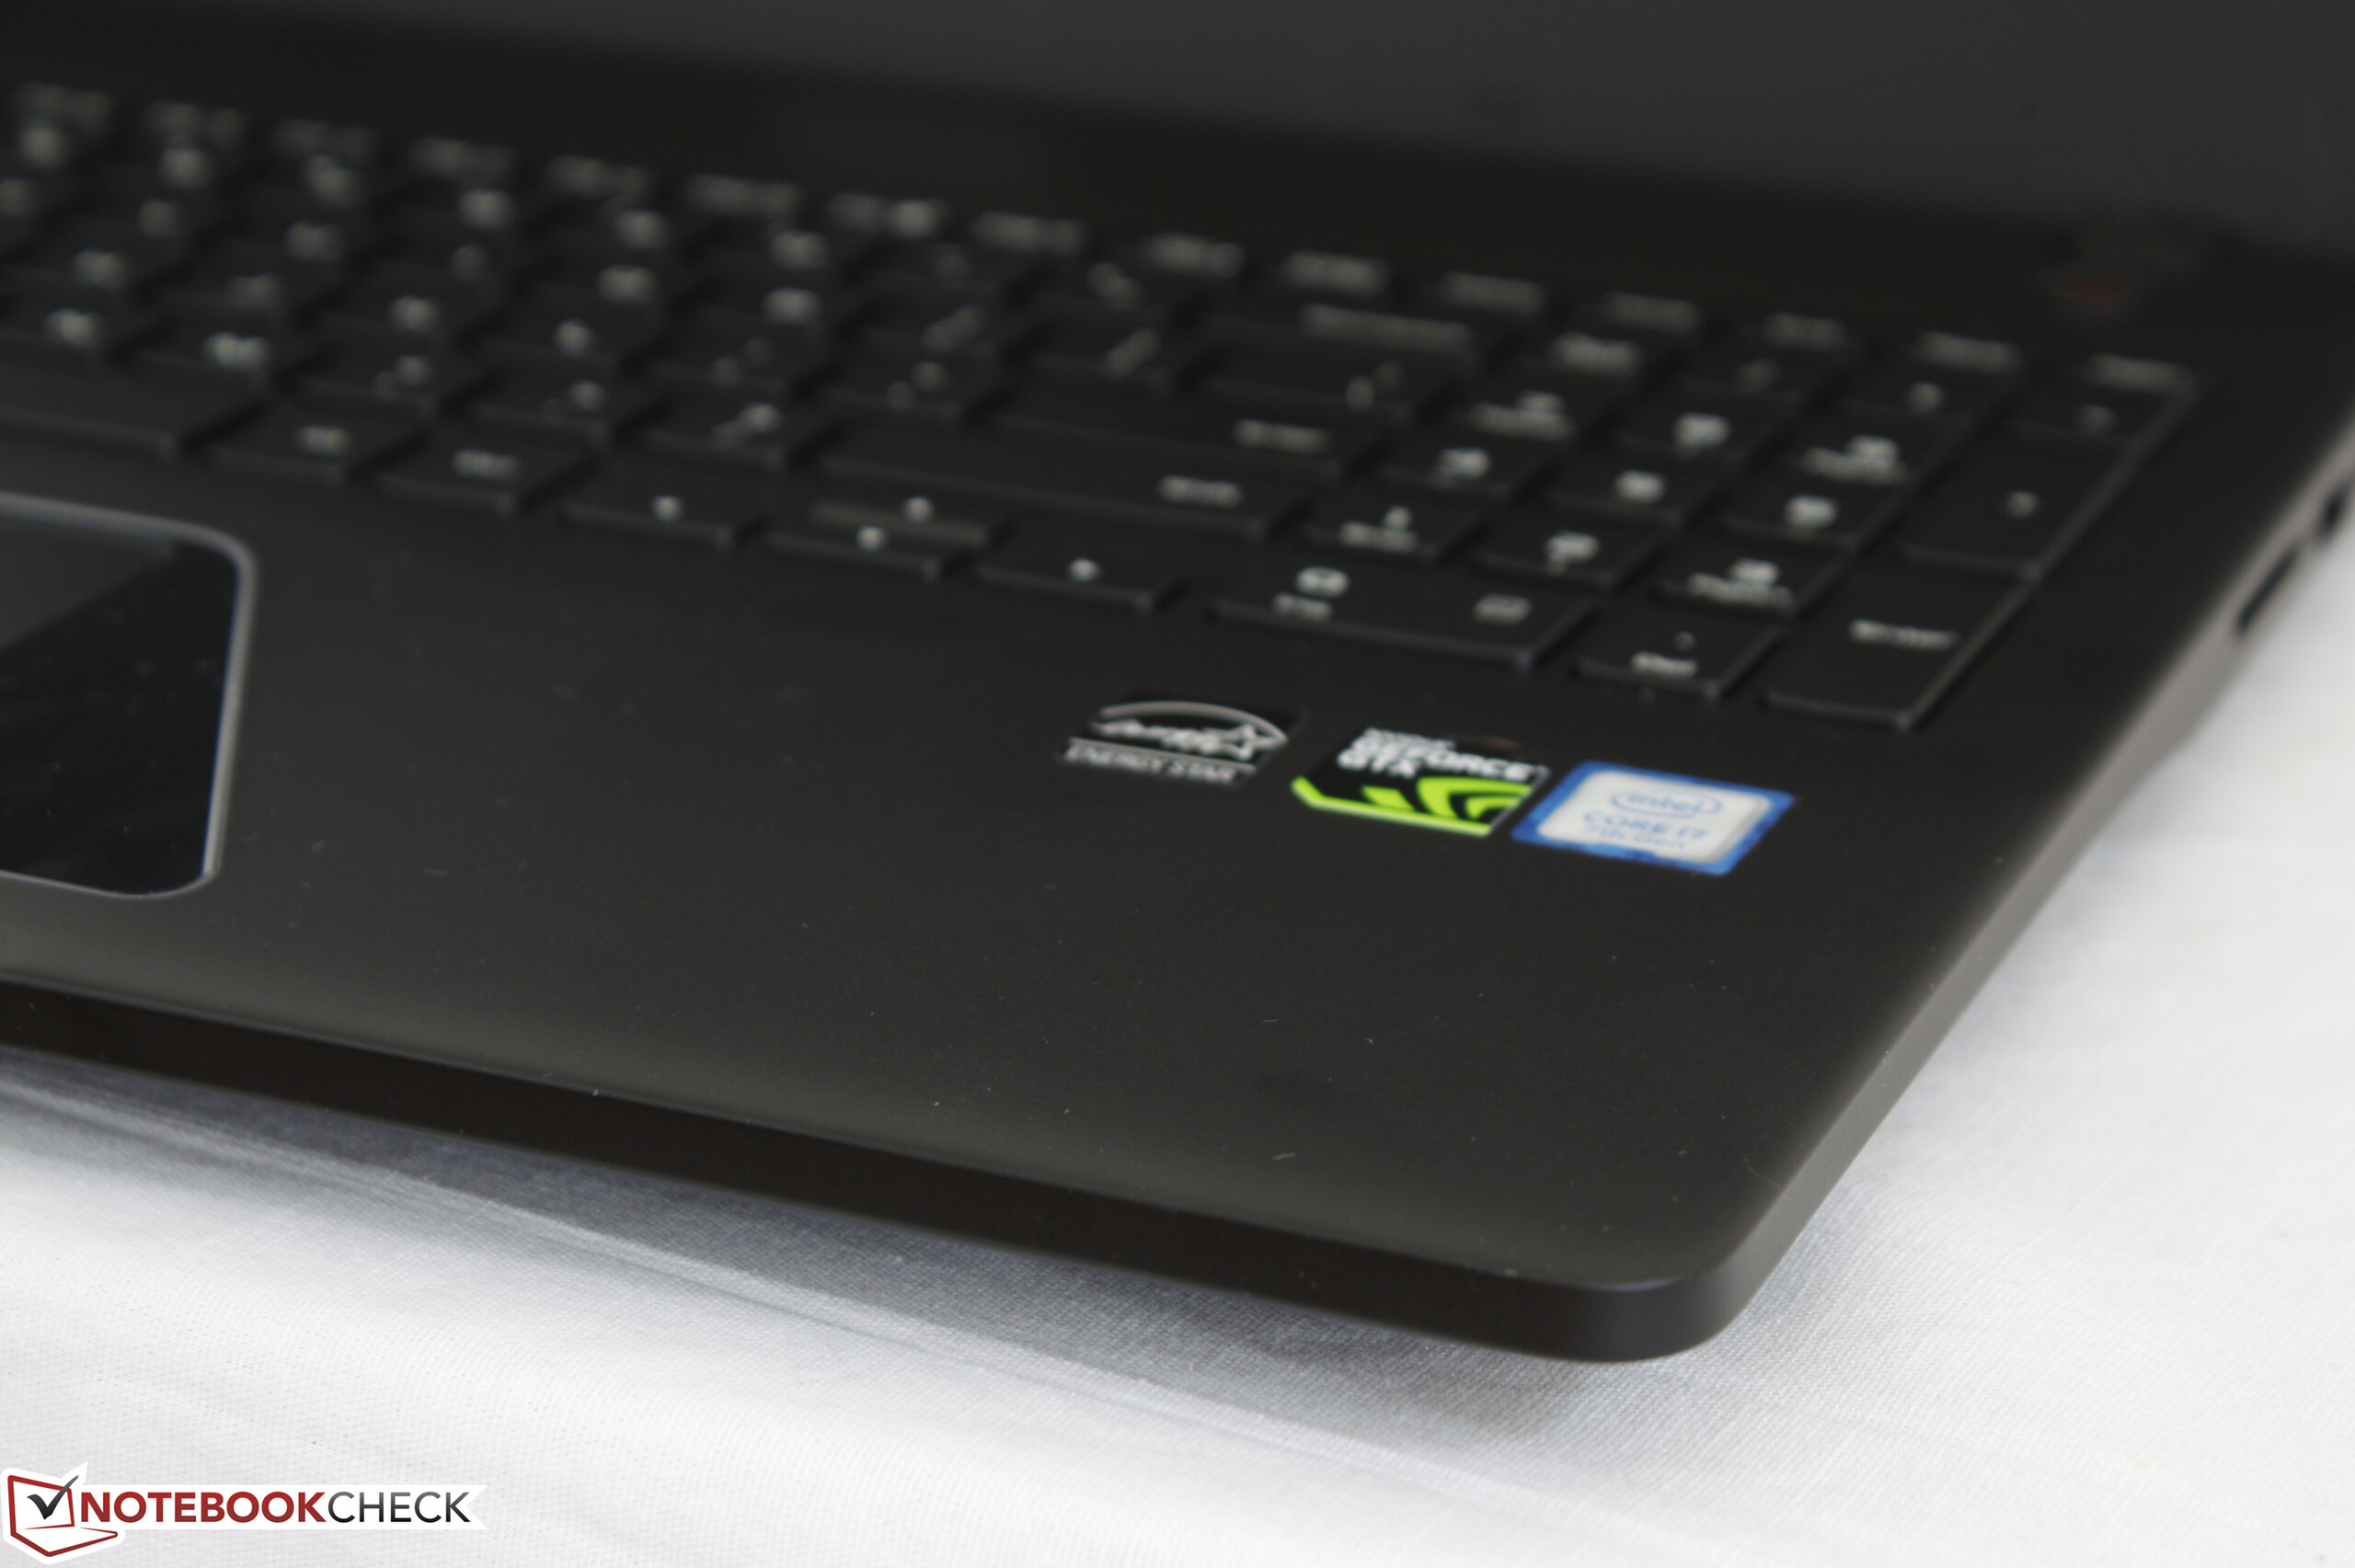
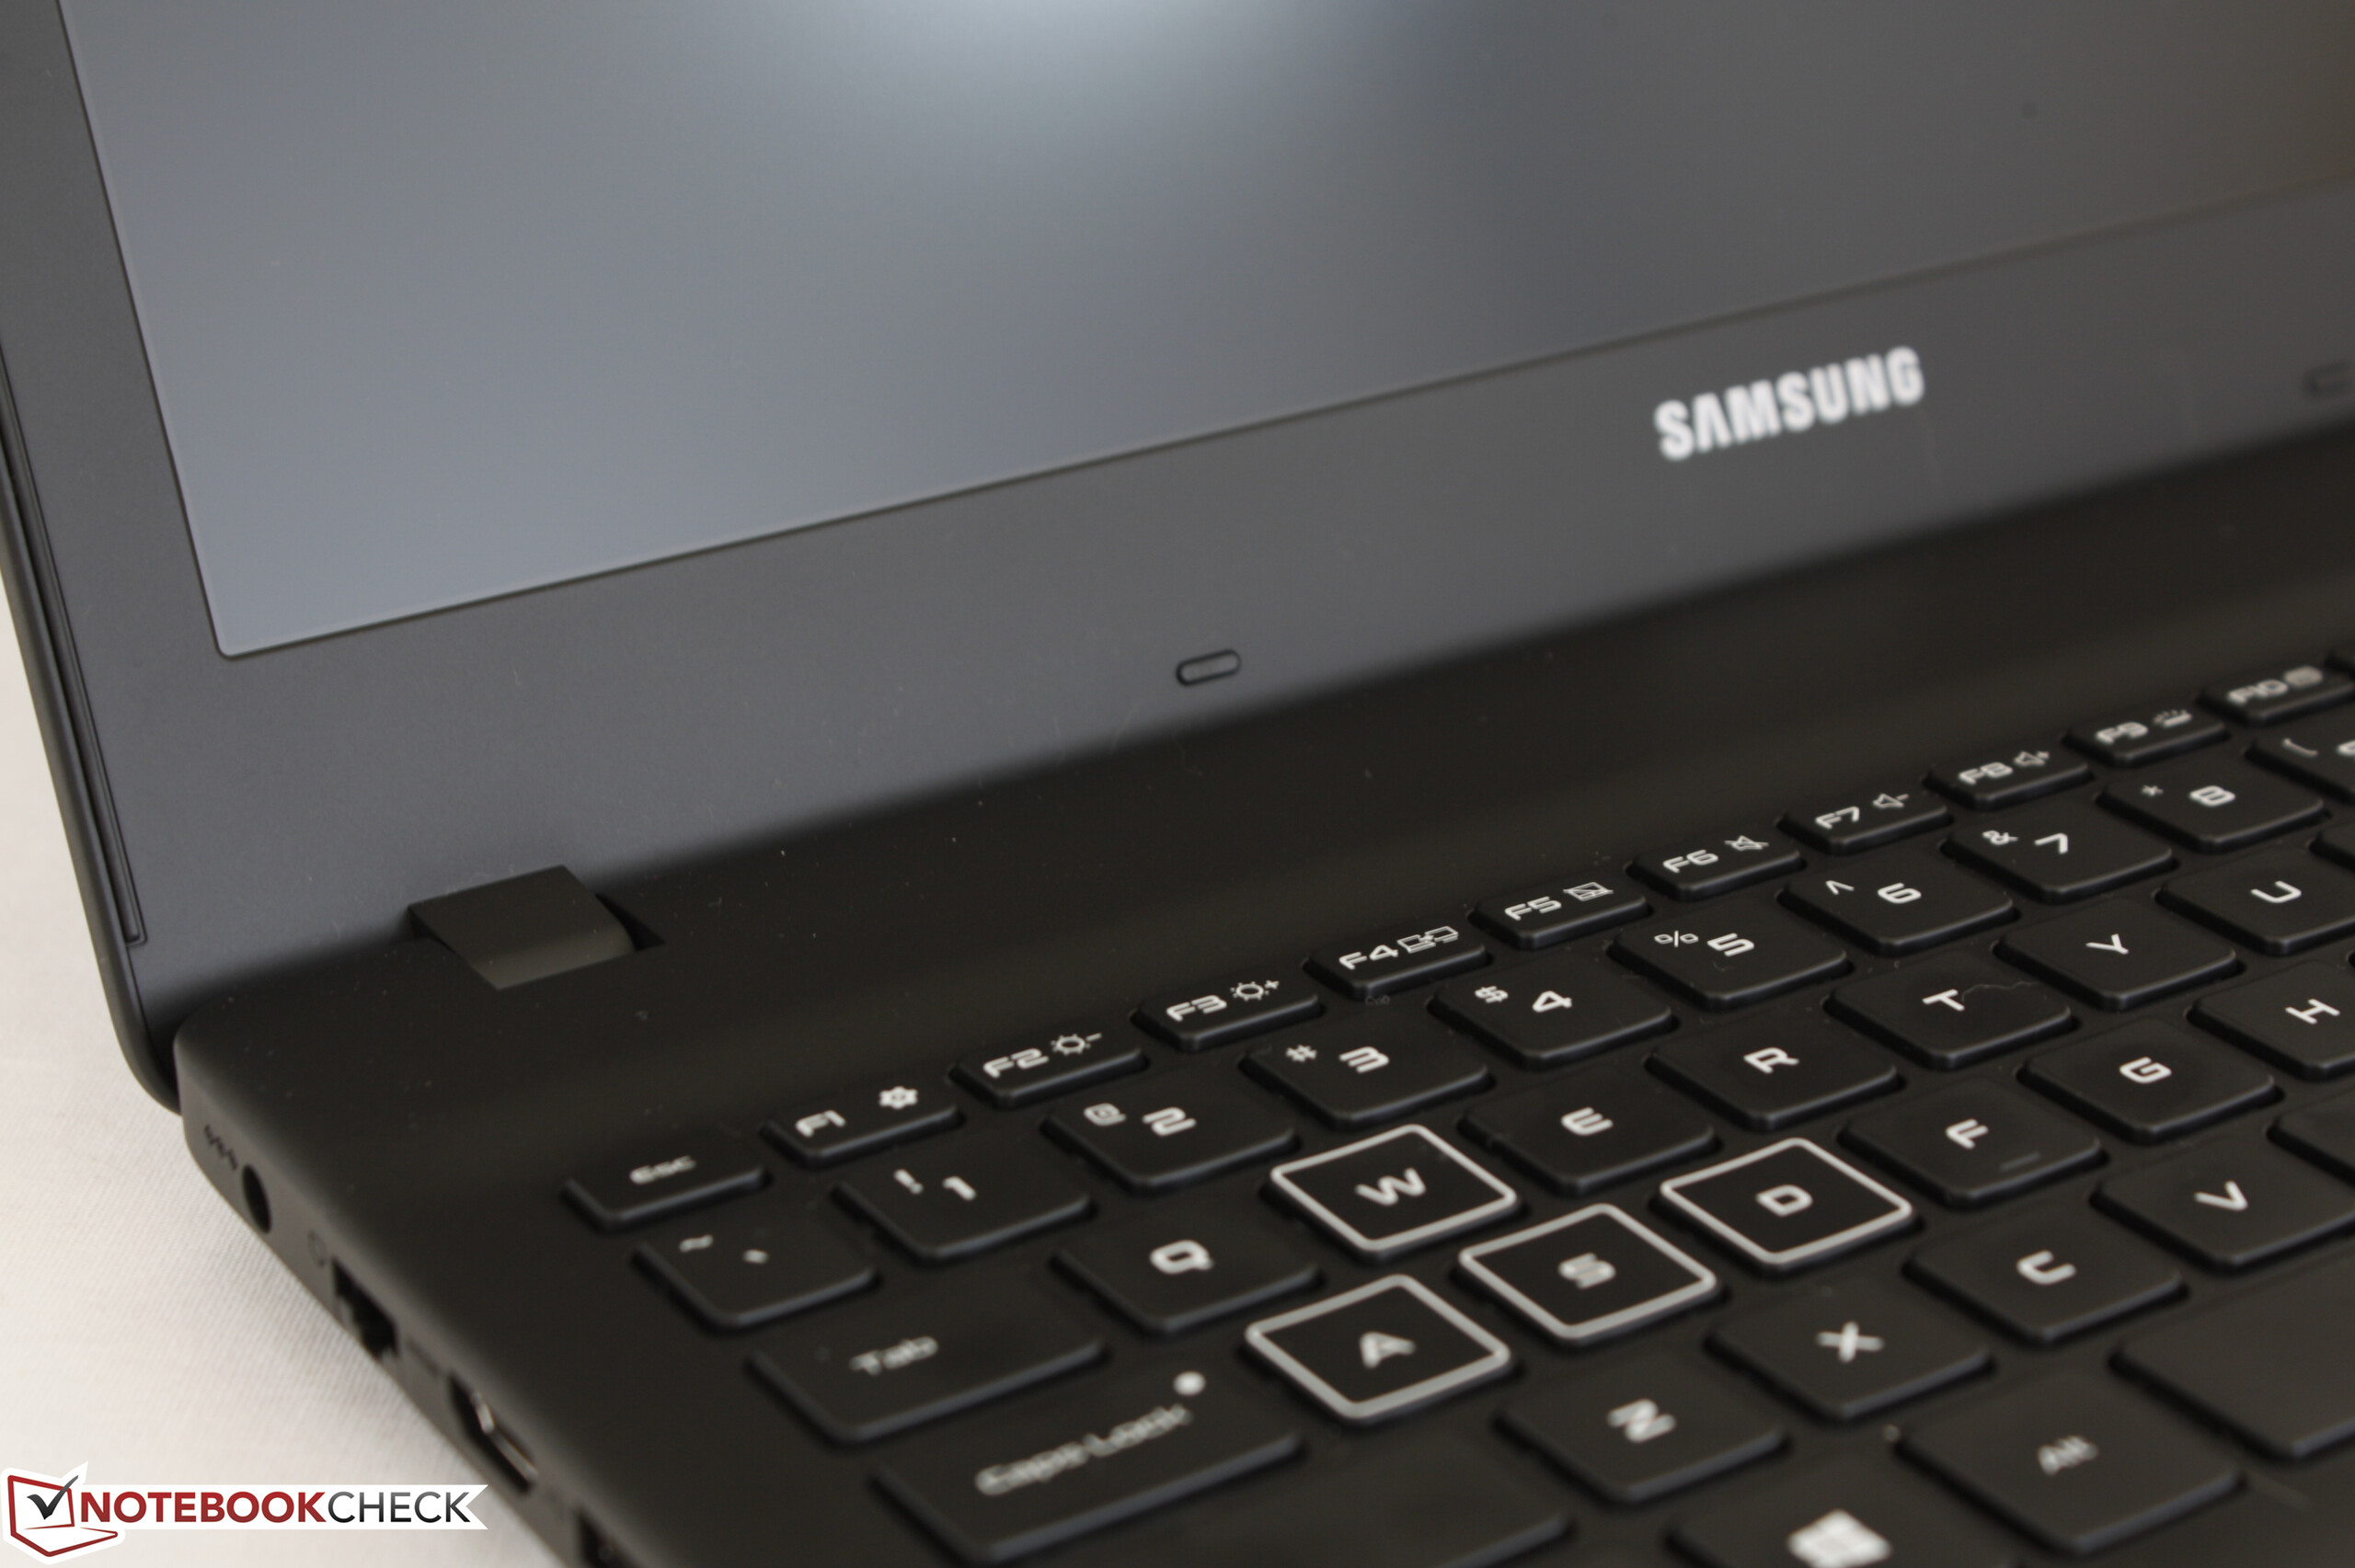
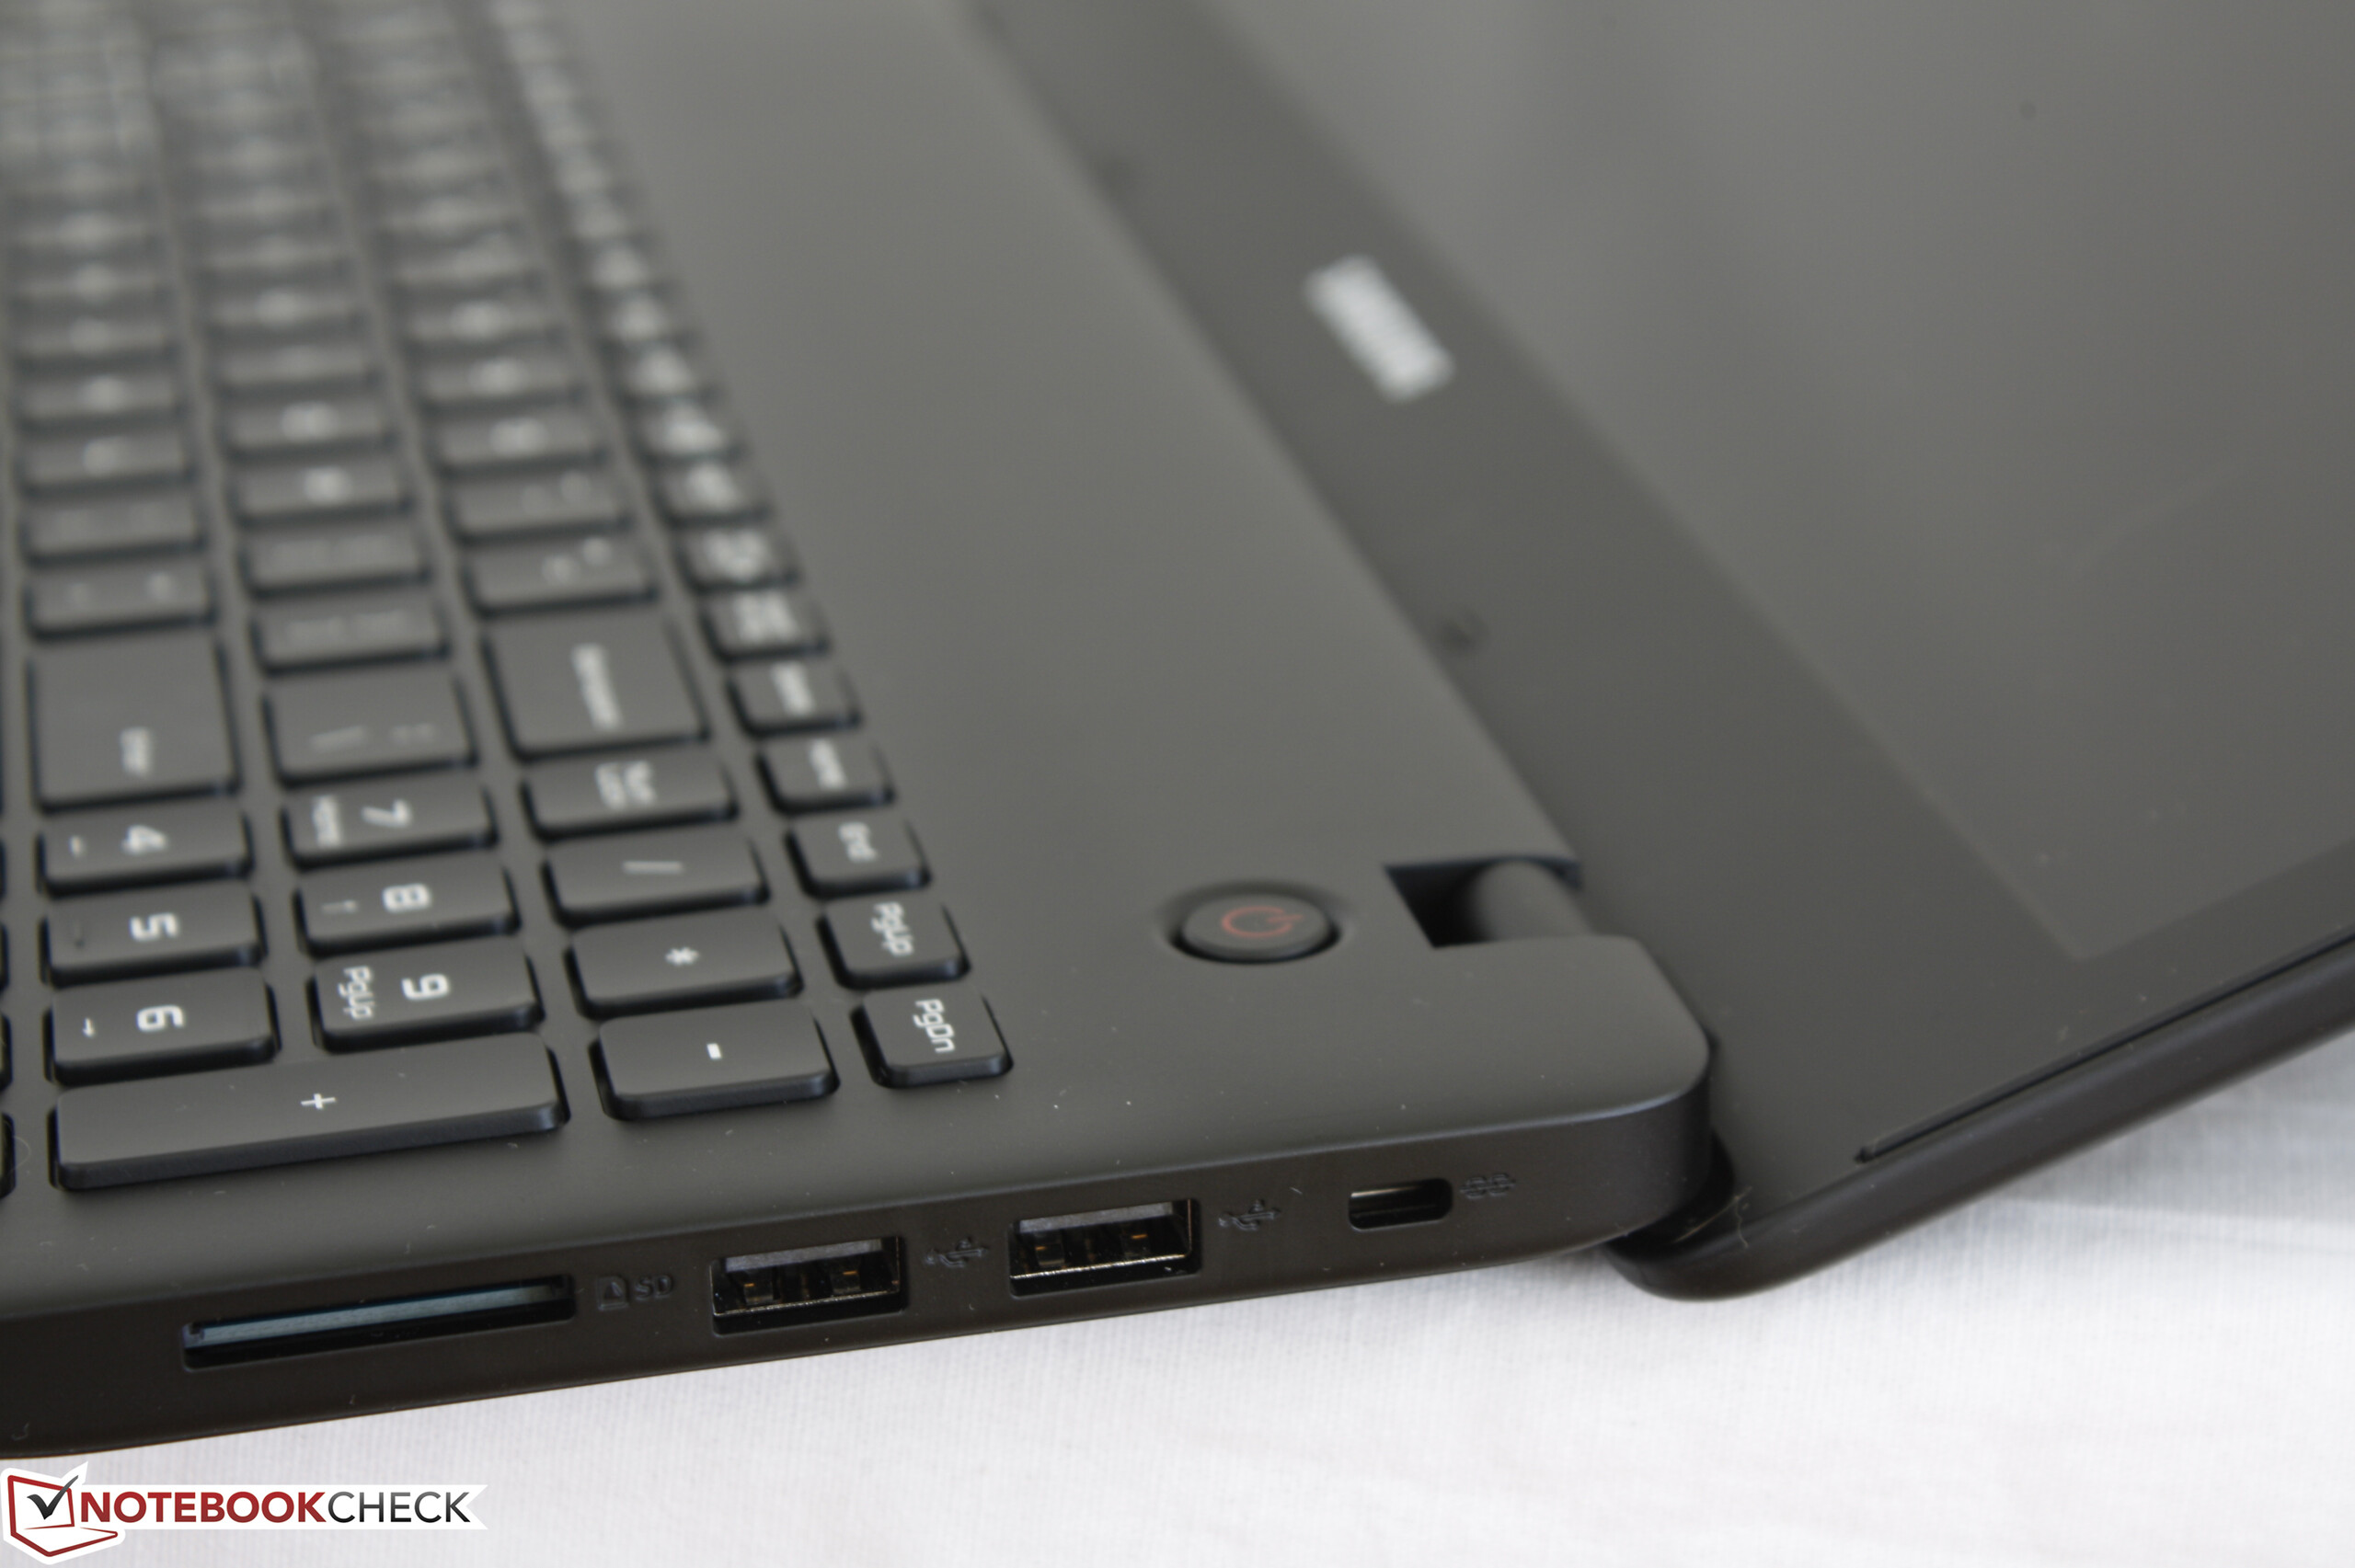
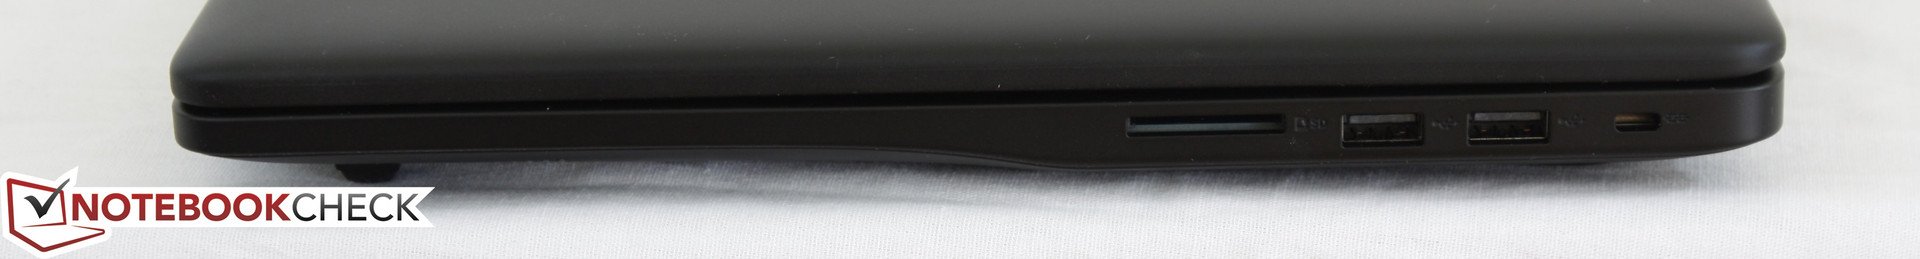
Altri aspetti riguardano lettore SD lento, features di connettività limitate, VRAM GPU dimezzata, batteria con capacità limitata, e sia contrasto che colori non sono profondi come nella concorrenza. I tasti WASD si scaldano ed è strana anche la decisione del design; così come un produttore di auto non farebbe mai uno sterzo scomodo, allo stesso modo un produttore di pc non dovrebbe mai realizzare tasti WASD scomodi.
L'HP Pavilion 15t con stesse CPU e GPU costa da $1100 a $1200 USD ed ha la stessa configurazione dell'Odyssey. Mentre Samsung eccelle nelle core performance, è assolutamente medio in quasi tutti gli altri aspetti e non offre molto rispetto ad altri portatili con GTX 1050.
Il primo portatile gaming Samsung Odyssey è finalmente disponibile .... ma non è nulla di speciale. Prestazioni CPU e GPU sono eccellenti e senza throttling, ma la rumorosità è eclatante.
Nota: si tratta di una recensione breve, con alcune sezioni non tradotte, per la versione integrale in inglese guardate qui.
Samsung Odyssey NP800G5M-X01US
- 04/24/2017 v6 (old)
Allen Ngo
Price comparison
