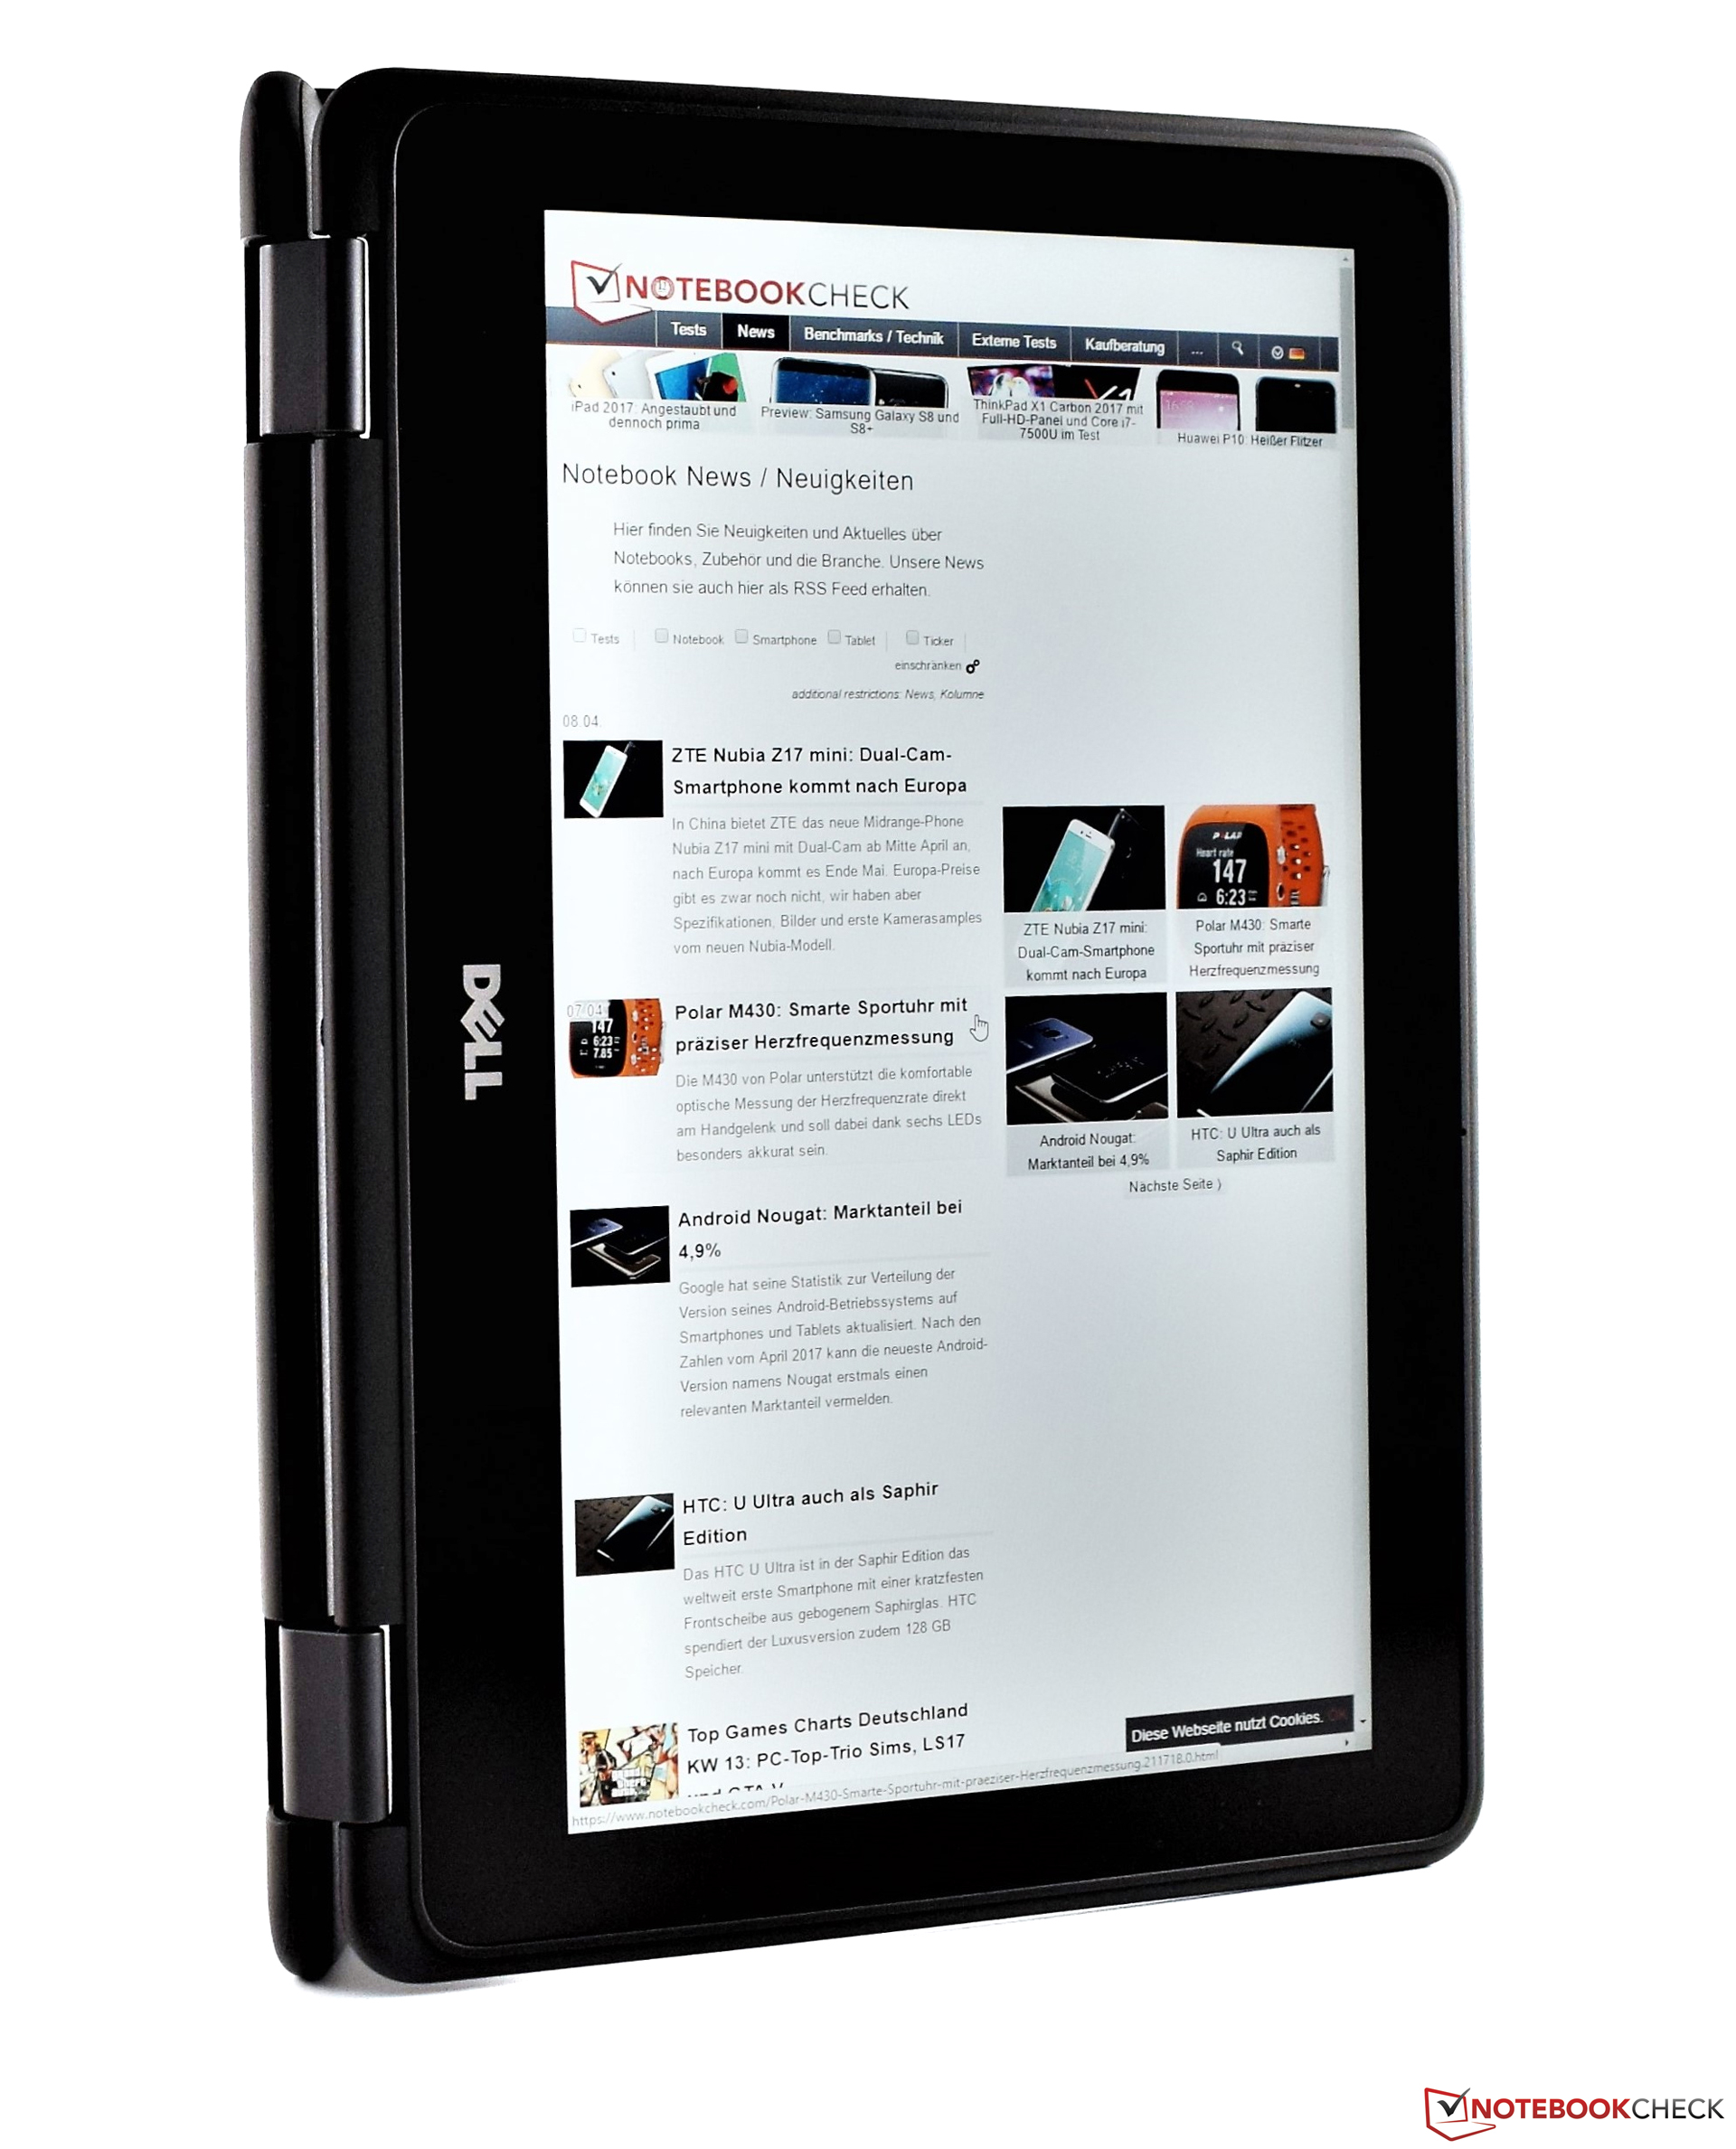
Recensione breve del Convertibile Dell Latitude 3189 (N4200, HD)


| SD Card Reader | |
| average JPG Copy Test (av. of 3 runs) | |
| HP Pavilion x360 13-u102ng | |
| Dell Latitude 3189 | |
| HP Pavilion 11-k103ng x360 | |
| Lenovo Yoga 700-11ISK | |
| maximum AS SSD Seq Read Test (1GB) | |
| HP Pavilion x360 13-u102ng | |
| Dell Latitude 3189 | |
| HP Pavilion 11-k103ng x360 | |
| Lenovo Yoga 700-11ISK | |
| Networking | |
| iperf3 transmit AX12 | |
| Medion Akoya P3401T 2in1 | |
| Dell Latitude 3189 | |
| iperf3 receive AX12 | |
| Dell Latitude 3189 | |
| Medion Akoya P3401T 2in1 | |
| |||||||||||||||||||||||||
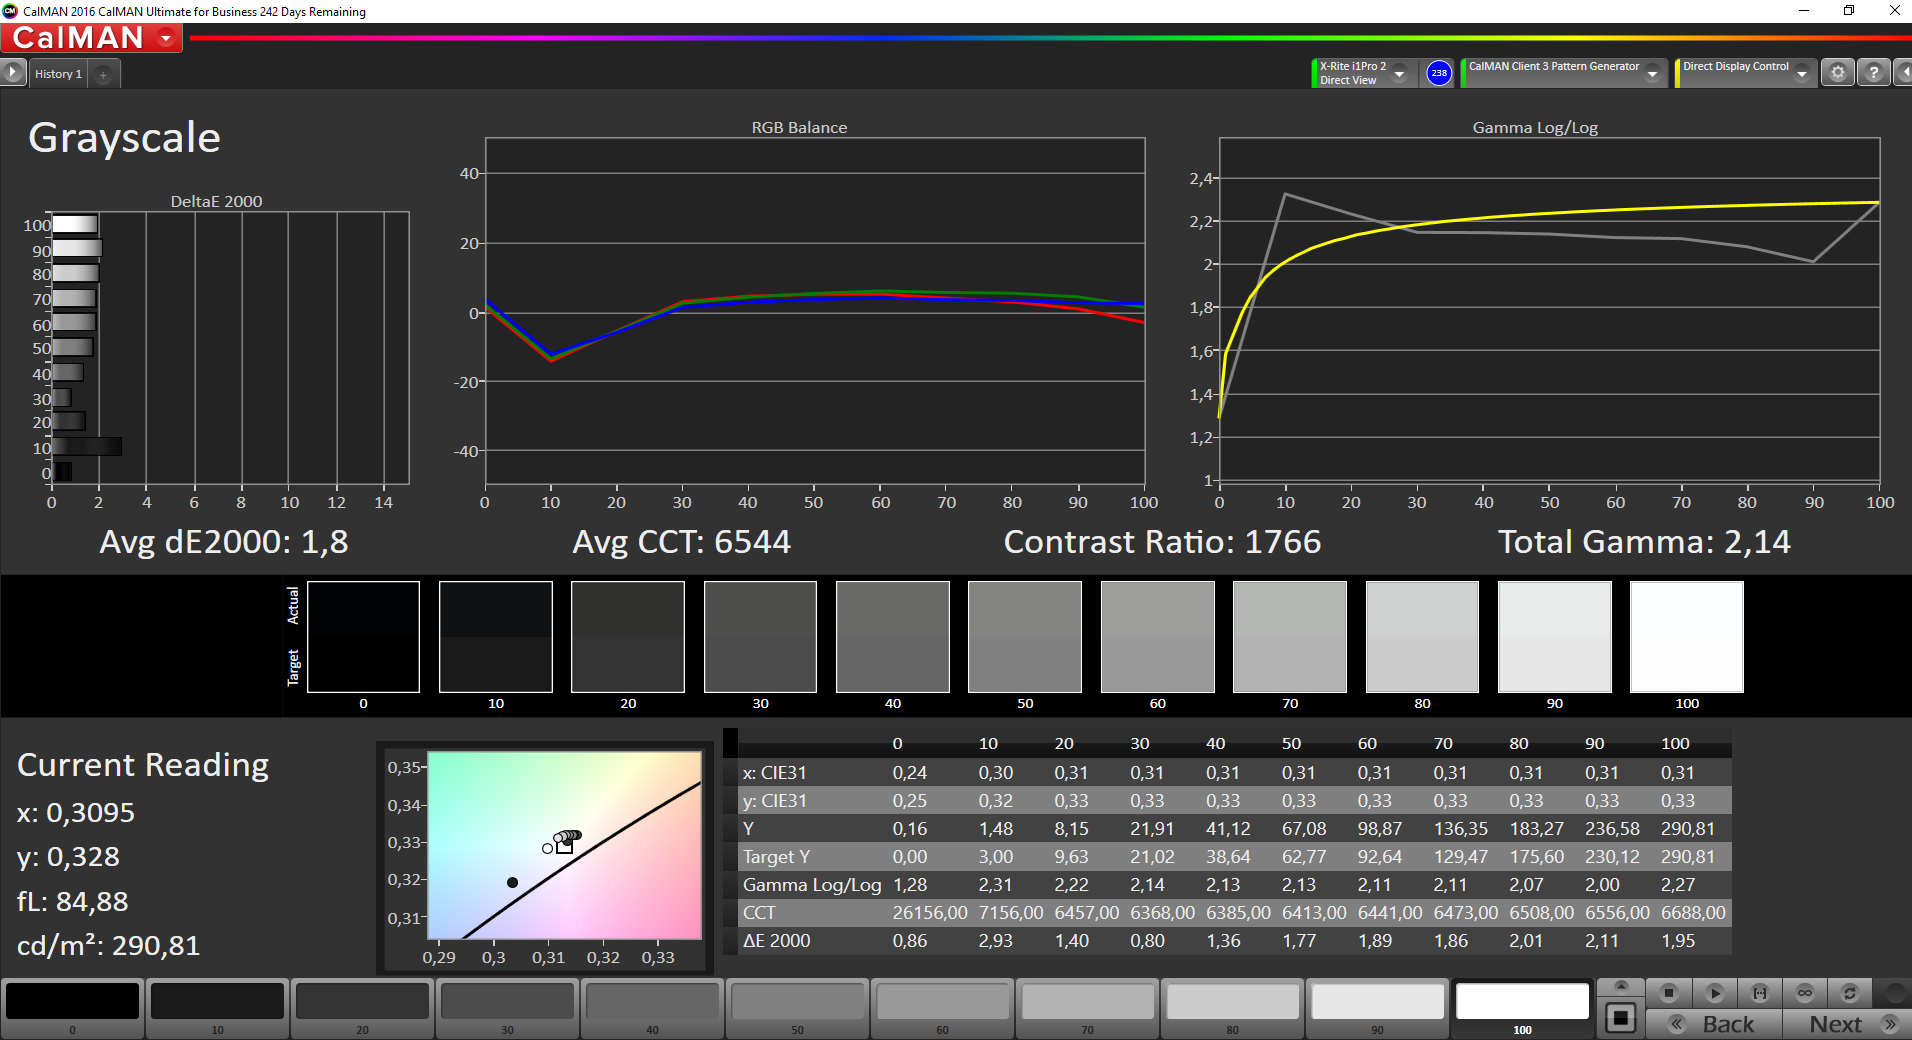
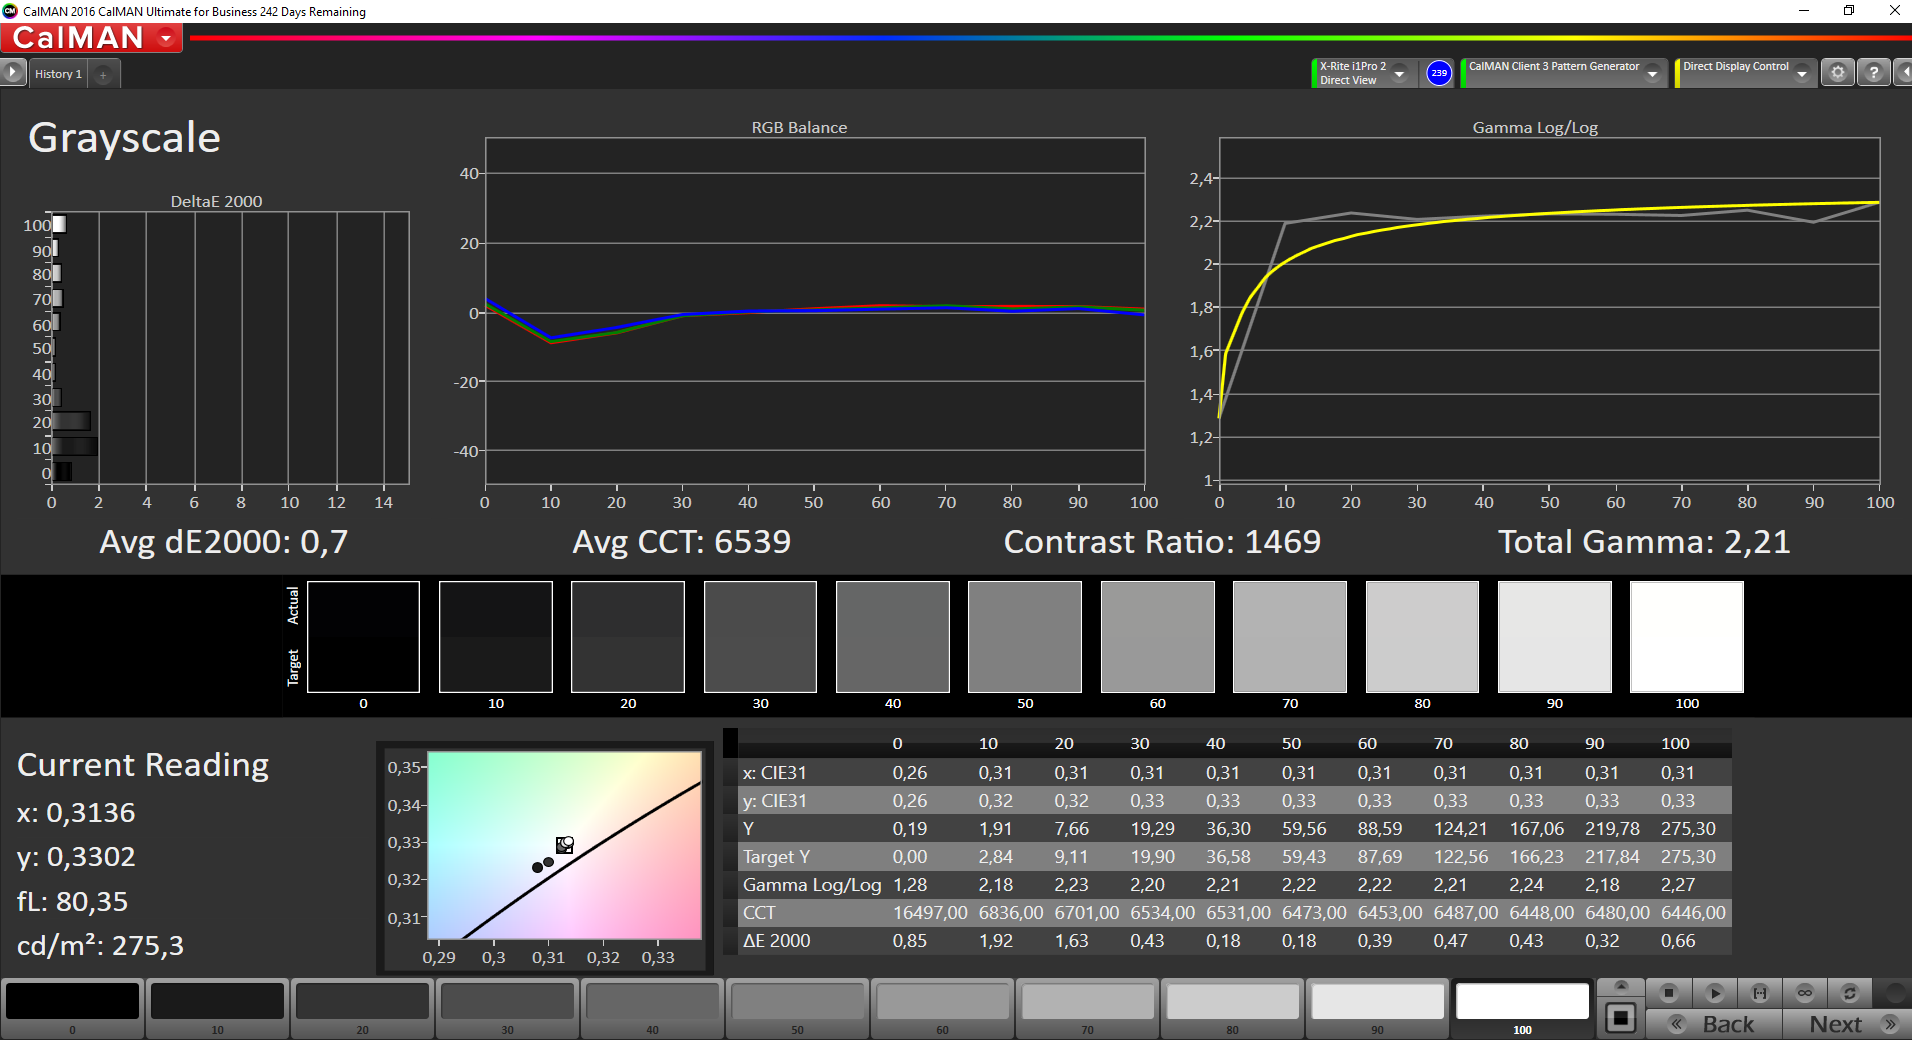
Distribuzione della luminosità: 92 %
Al centro con la batteria: 291 cd/m²
Contrasto: 1819:1 (Nero: 0.16 cd/m²)
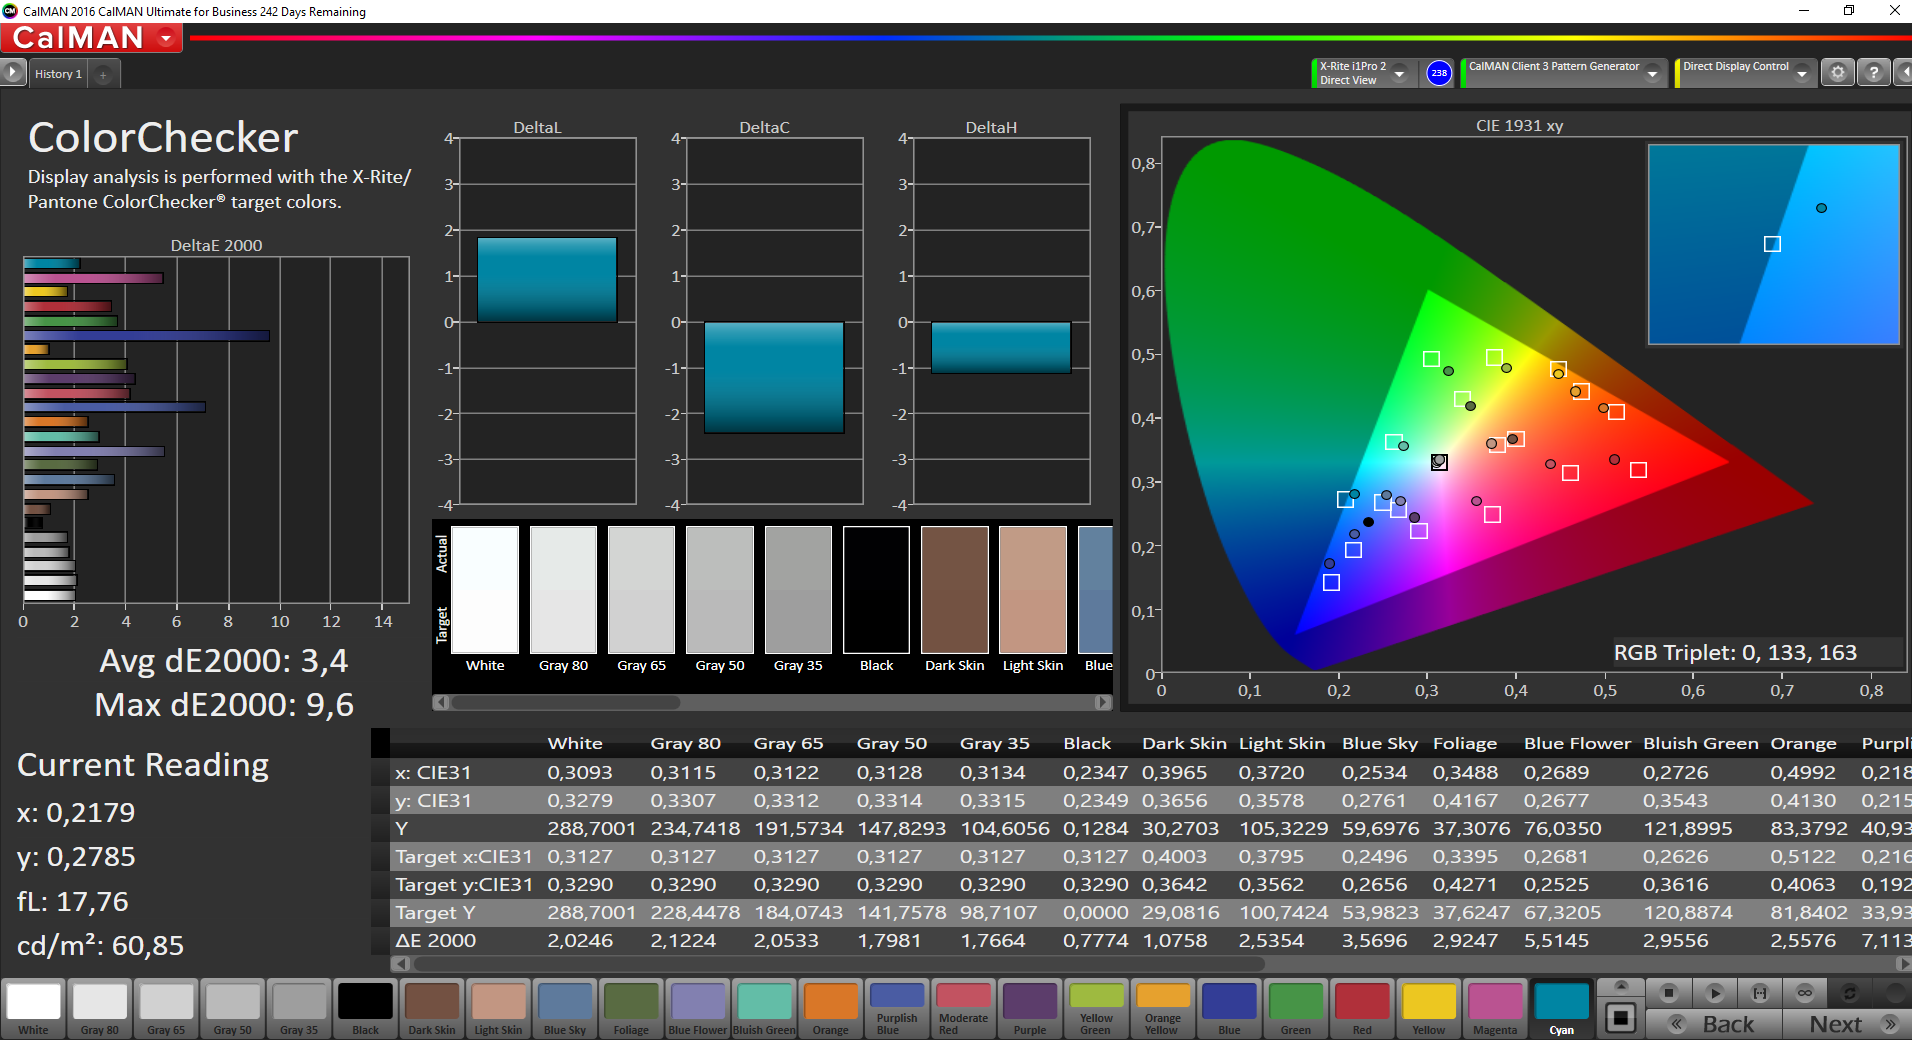
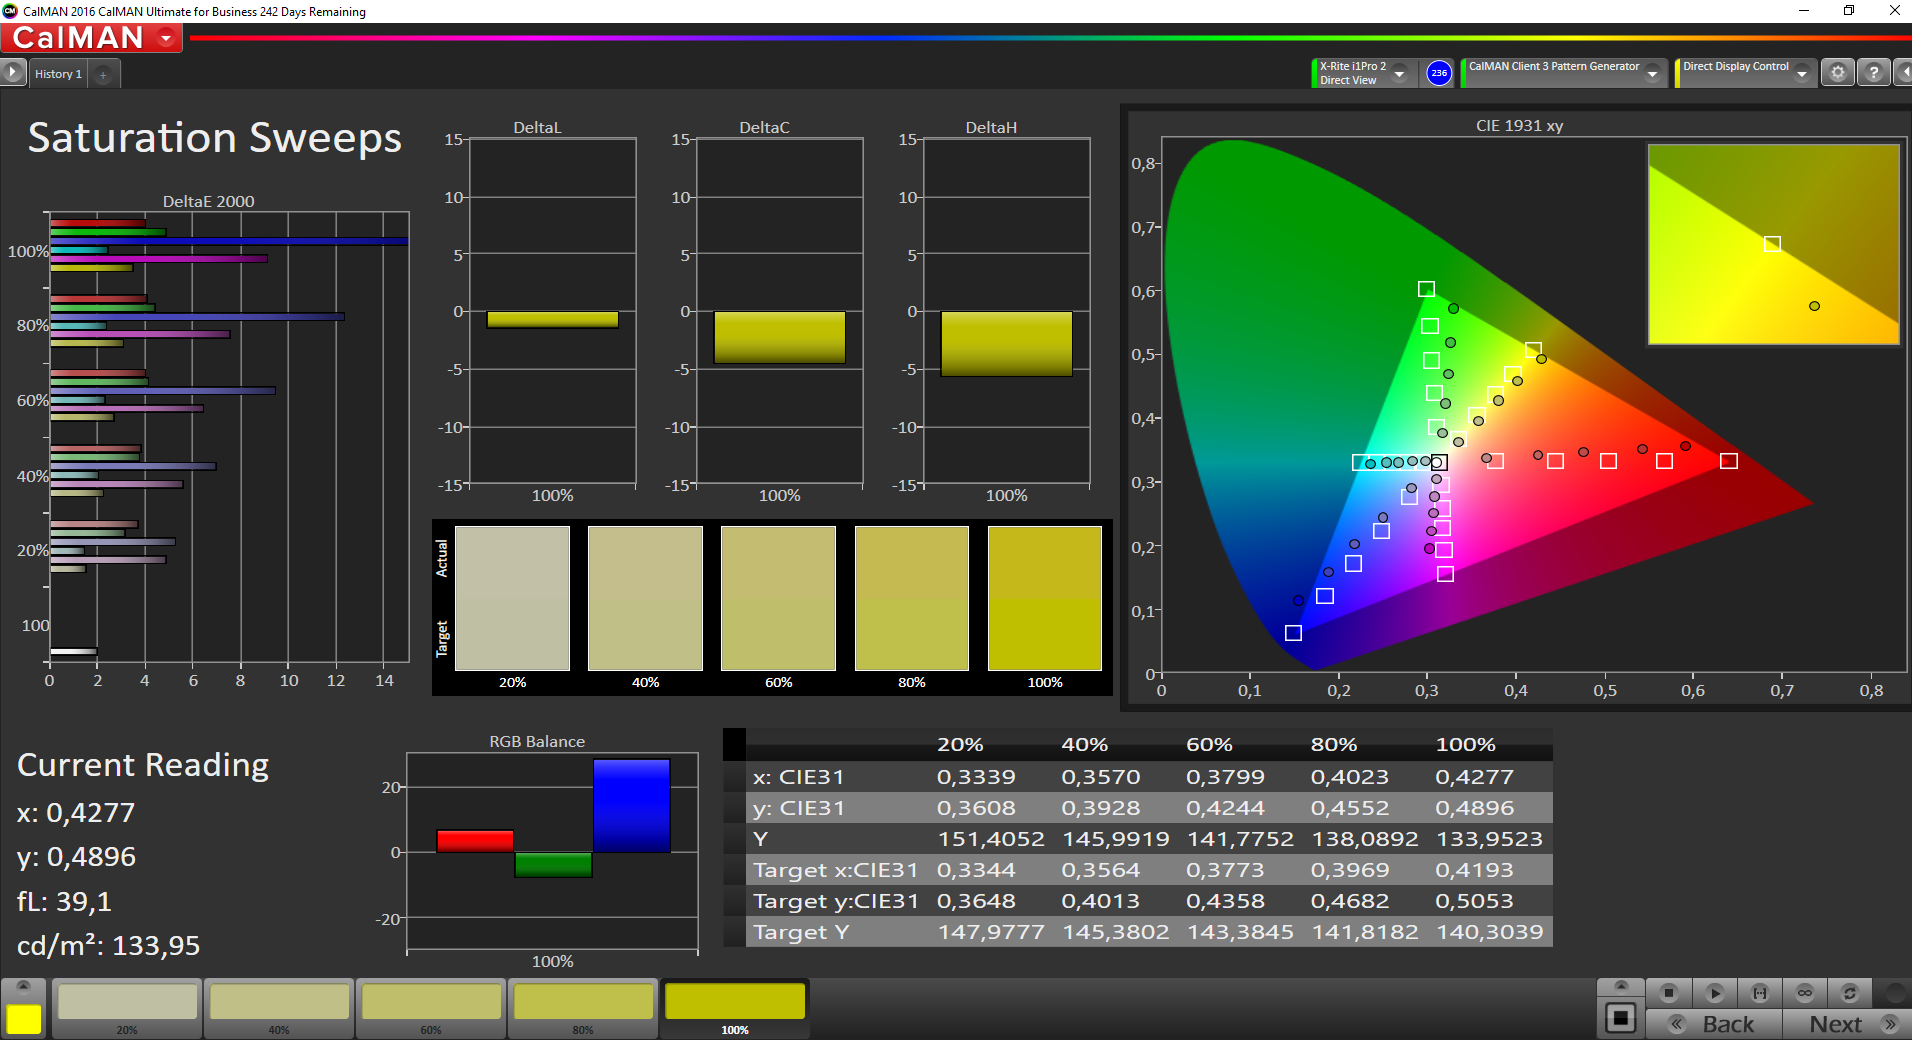
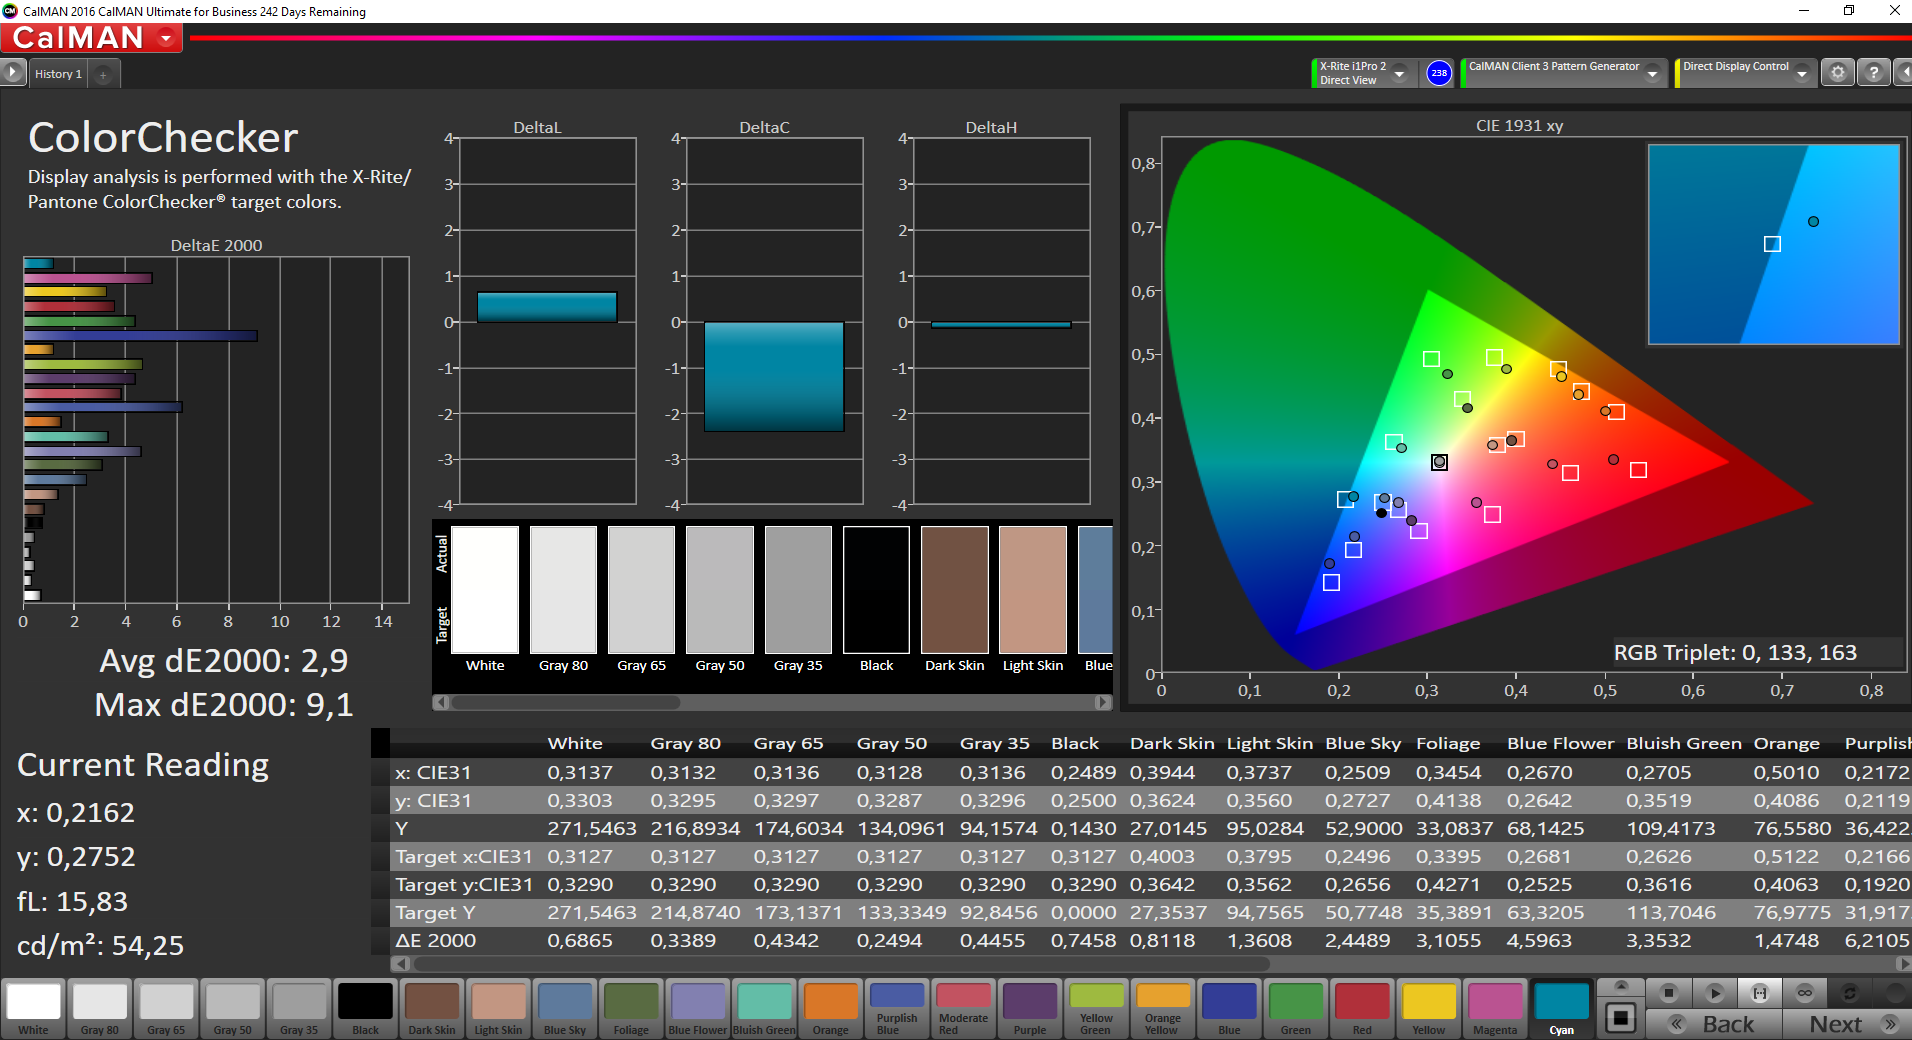
ΔE ColorChecker Calman: 3.4 | ∀{0.5-29.43 Ø4.71}
ΔE Greyscale Calman: 1.8 | ∀{0.09-98 Ø4.96}
67% sRGB (Argyll 1.6.3 3D)
42.8% AdobeRGB 1998 (Argyll 1.6.3 3D)
46.49% AdobeRGB 1998 (Argyll 3D)
67.3% sRGB (Argyll 3D)
44.96% Display P3 (Argyll 3D)
Gamma: 2.14
CCT: 6544 K
| Dell Latitude 3189 IPS, 1366x768, 11.6" | Medion Akoya P3401T 2in1 IPS, 1920x1080, 12.5" | HP Pavilion 11-k103ng x360 IPS, 1366x768, 11.6" | HP Pavilion x360 13-u102ng IPS, 1920x1080, 13.3" | Lenovo Yoga 700-11ISK IPS, 1920x1080, 11.6" | Acer Aspire Switch Alpha 12 SA5-271-56HM IPS, 2160x1440, 12" | |
|---|---|---|---|---|---|---|
| Display | -5% | 1% | -12% | -4% | 44% | |
| Display P3 Coverage (%) | 44.96 | 42.92 -5% | 45.21 1% | 39.43 -12% | 43.6 -3% | 65.5 46% |
| sRGB Coverage (%) | 67.3 | 64.3 -4% | 67.8 1% | 59.1 -12% | 64.2 -5% | 96.1 43% |
| AdobeRGB 1998 Coverage (%) | 46.49 | 44.35 -5% | 46.73 1% | 40.76 -12% | 45.17 -3% | 66.9 44% |
| Response Times | 7% | 39% | 12% | 40% | 19% | |
| Response Time Grey 50% / Grey 80% * (ms) | 40 ? | 40 ? -0% | 18.8 ? 53% | 38 ? 5% | 23 ? 43% | 20 ? 50% |
| Response Time Black / White * (ms) | 30.4 ? | 26 ? 14% | 23.2 ? 24% | 25 ? 18% | 19 ? 37% | 34 ? -12% |
| PWM Frequency (Hz) | 50 ? | 1000 ? | ||||
| Screen | -27% | -13% | -44% | -76% | -47% | |
| Brightness middle (cd/m²) | 291 | 392 35% | 194 -33% | 277 -5% | 300 3% | 345 19% |
| Brightness (cd/m²) | 284 | 392 38% | 186 -35% | 263 -7% | 284 0% | 328 15% |
| Brightness Distribution (%) | 92 | 93 1% | 86 -7% | 88 -4% | 82 -11% | 91 -1% |
| Black Level * (cd/m²) | 0.16 | 0.33 -106% | 0.22 -38% | 0.31 -94% | 0.33 -106% | 0.38 -138% |
| Contrast (:1) | 1819 | 1188 -35% | 882 -52% | 894 -51% | 909 -50% | 908 -50% |
| Colorchecker dE 2000 * | 3.4 | 4.99 -47% | 3.06 10% | 5.57 -64% | 7.87 -131% | 8.4 -147% |
| Colorchecker dE 2000 max. * | 9.6 | 9.08 5% | 8.81 8% | 13.6 -42% | 17.75 -85% | 11.9 -24% |
| Greyscale dE 2000 * | 1.8 | 4.53 -152% | 1.42 21% | 4.56 -153% | 8.45 -369% | 4.3 -139% |
| Gamma | 2.14 103% | 2.46 89% | 2.34 94% | 2.28 96% | 2.42 91% | 2.63 84% |
| CCT | 6544 99% | 7394 88% | 6432 101% | 6648 98% | 6856 95% | 7368 88% |
| Color Space (Percent of AdobeRGB 1998) (%) | 42.8 | 41 -4% | 42.98 0% | 38 -11% | 41 -4% | 62 45% |
| Color Space (Percent of sRGB) (%) | 67 | 64 -4% | 67.56 1% | 59 -12% | 64 -4% | |
| Media totale (Programma / Settaggio) | -8% /
-18% | 9% /
-3% | -15% /
-30% | -13% /
-46% | 5% /
-18% |
* ... Meglio usare valori piccoli

Tempi di risposta del Display
| ↔ Tempi di risposta dal Nero al Bianco | ||
|---|---|---|
| 30.4 ms ... aumenta ↗ e diminuisce ↘ combinato | ↗ 16.4 ms Incremento | 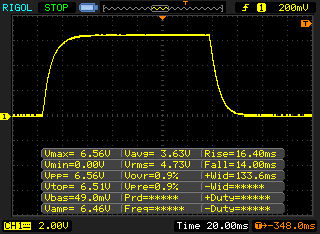 |
| ↘ 14 ms Calo | ||
| Lo schermo mostra tempi di risposta lenti nei nostri tests e sarà insoddisfacente per i gamers. In confronto, tutti i dispositivi di test variano da 0.1 (minimo) a 240 (massimo) ms. » 82 % di tutti i dispositivi è migliore. Questo significa che i tempi di risposta rilevati sono peggiori rispetto alla media di tutti i dispositivi testati (19.8 ms). | ||
| ↔ Tempo di risposta dal 50% Grigio all'80% Grigio | ||
| 40 ms ... aumenta ↗ e diminuisce ↘ combinato | ↗ 18.8 ms Incremento | 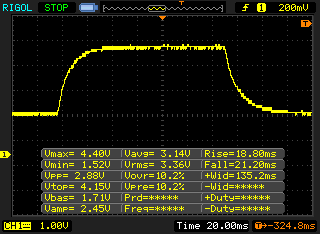 |
| ↘ 21.2 ms Calo | ||
| Lo schermo mostra tempi di risposta lenti nei nostri tests e sarà insoddisfacente per i gamers. In confronto, tutti i dispositivi di test variano da 0.165 (minimo) a 636 (massimo) ms. » 61 % di tutti i dispositivi è migliore. Questo significa che i tempi di risposta rilevati sono peggiori rispetto alla media di tutti i dispositivi testati (31 ms). | ||
Sfarfallio dello schermo / PWM (Pulse-Width Modulation)
| flickering dello schermo / PWM non rilevato | 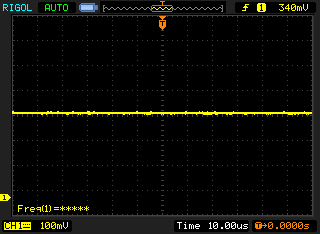 | ||
In confronto: 52 % di tutti i dispositivi testati non utilizza PWM per ridurre la luminosita' del display. Se è rilevato PWM, una media di 7754 (minimo: 5 - massimo: 343500) Hz è stata rilevata. | |||
| Cinebench R11.5 | |
| CPU Single 64Bit | |
| HP Pavilion x360 13-u102ng | |
| Dell Latitude 3189 | |
| CPU Multi 64Bit | |
| HP Pavilion x360 13-u102ng | |
| Dell Latitude 3189 | |
| JetStream 1.1 - 1.1 Total | |
| HP Pavilion x360 13-u102ng | |
| Medion Akoya P3401T 2in1 | |
| Acer Aspire Switch Alpha 12 SA5-271-56HM | |
| Lenovo Yoga 700-11ISK | |
| Dell Latitude 3189 | |
| HP Pavilion 11-k103ng x360 | |
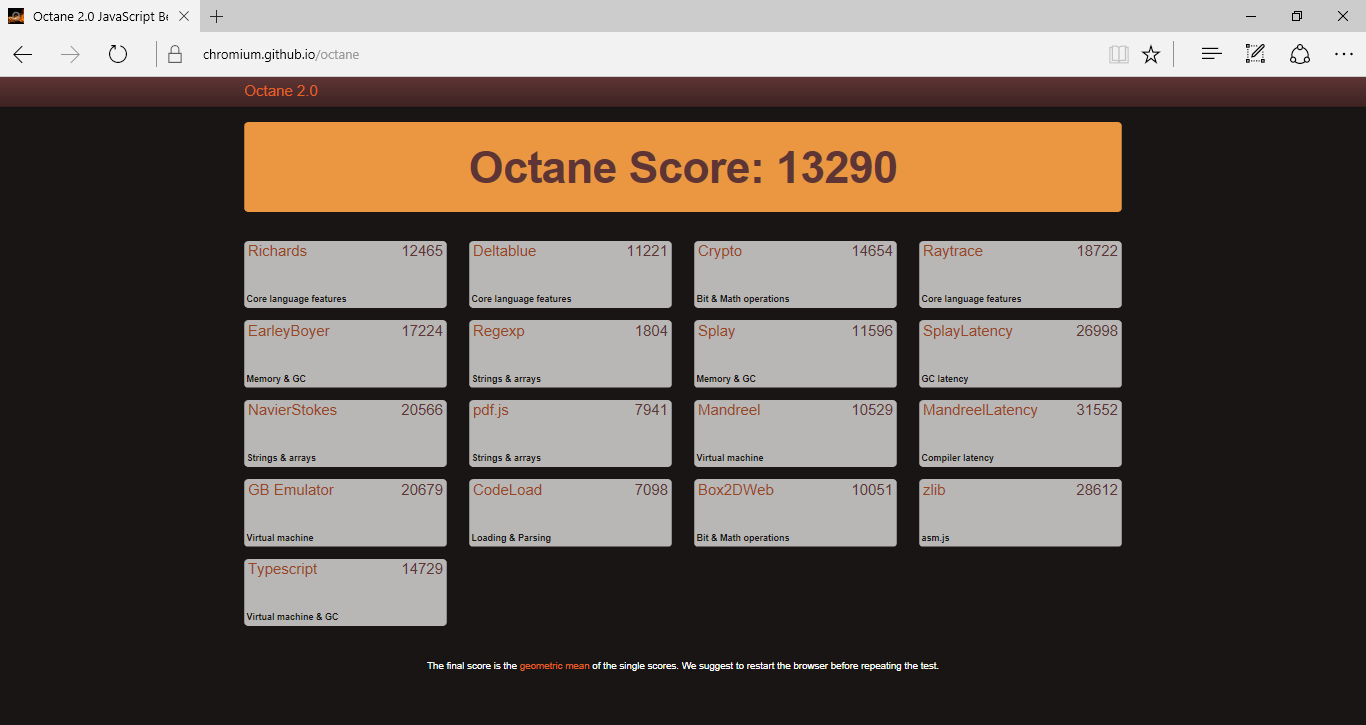
| Octane V2 - Total Score | |
| HP Pavilion x360 13-u102ng | |
| Acer Aspire Switch Alpha 12 SA5-271-56HM | |
| Lenovo Yoga 700-11ISK | |
| Dell Latitude 3189 | |
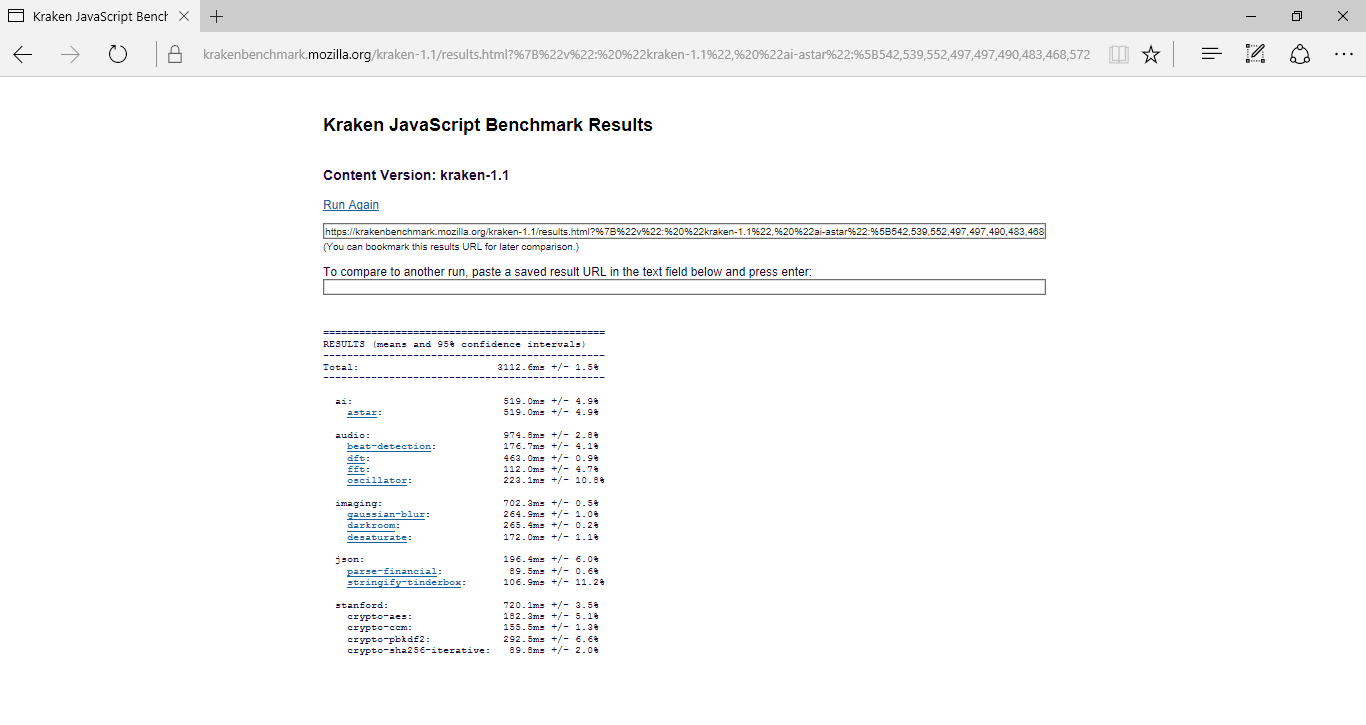
| Mozilla Kraken 1.1 - Total | |
| Dell Latitude 3189 | |
| Lenovo Yoga 700-11ISK | |
| Acer Aspire Switch Alpha 12 SA5-271-56HM | |
| HP Pavilion x360 13-u102ng | |
* ... Meglio usare valori piccoli
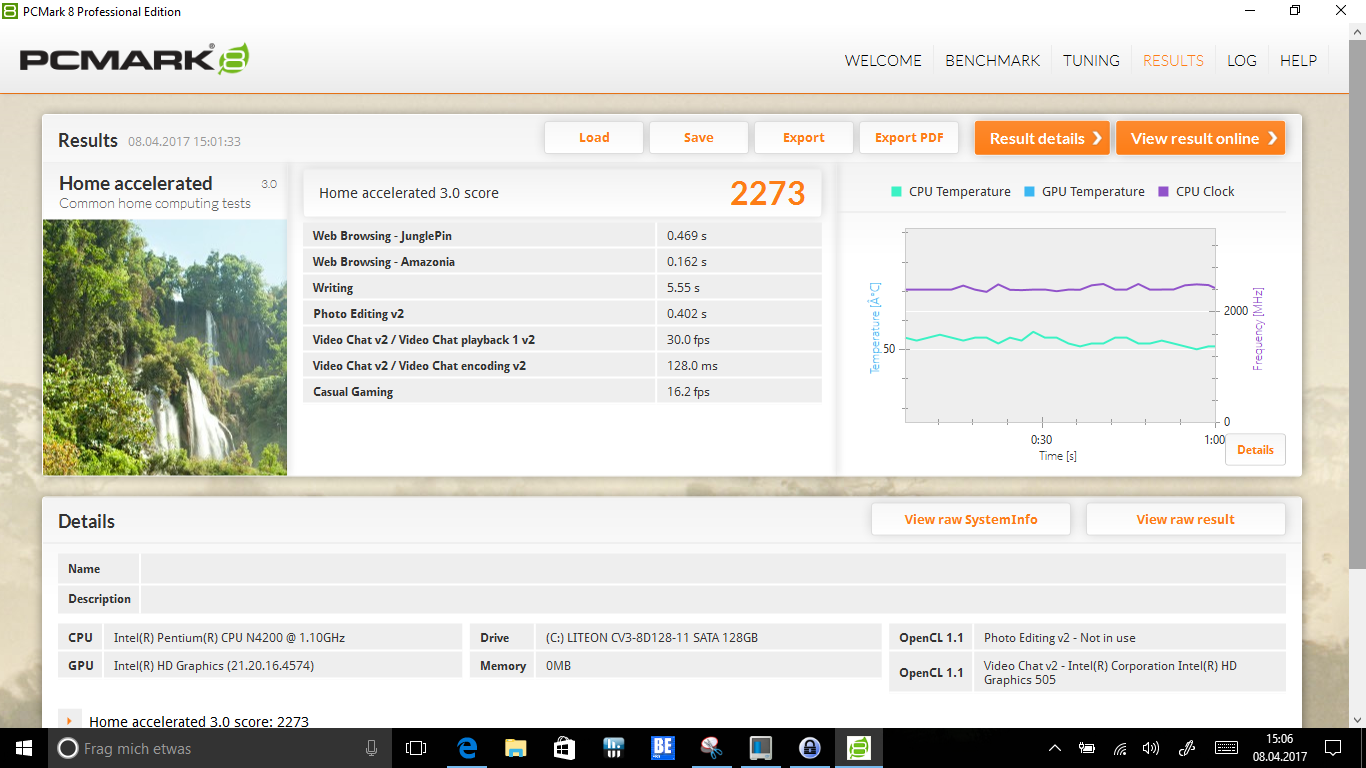
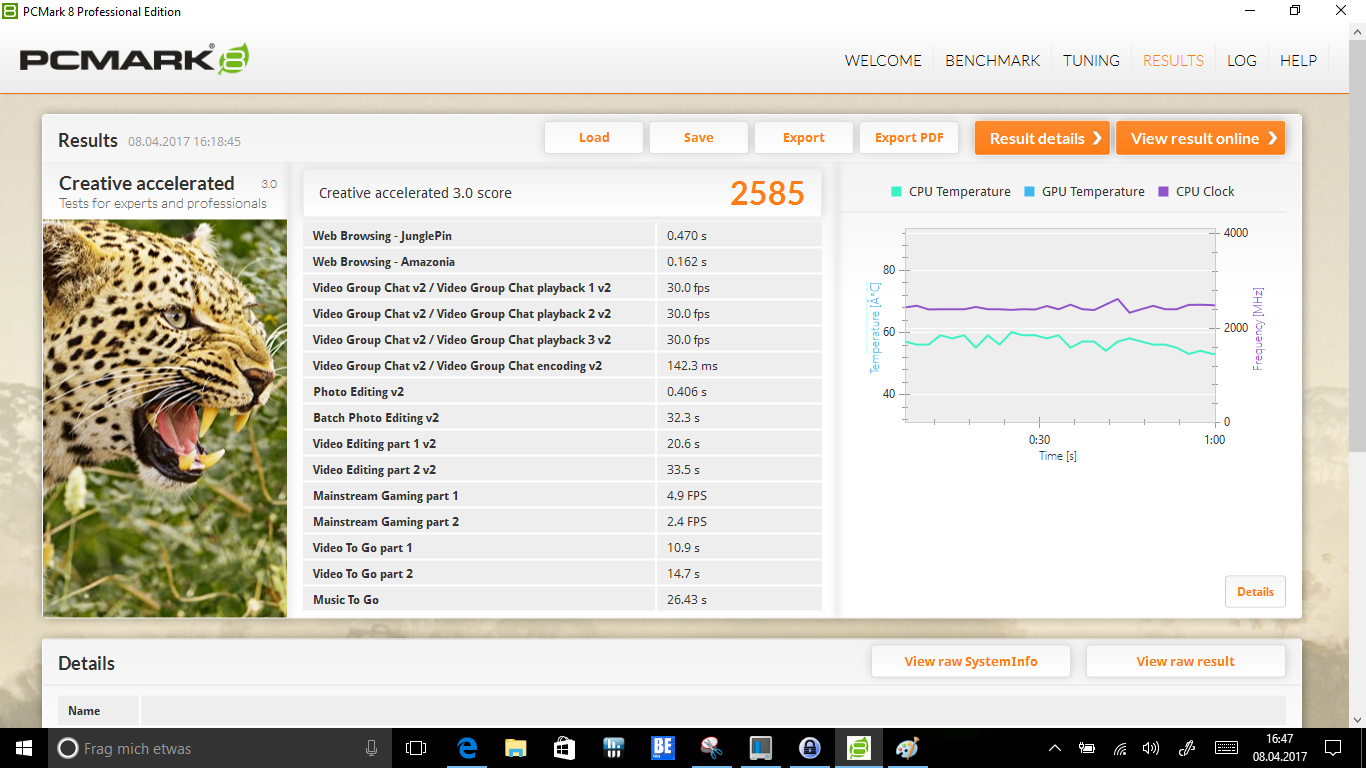
| PCMark 8 | |
| Home Score Accelerated v2 | |
| Acer Aspire Switch Alpha 12 SA5-271-56HM | |
| HP Pavilion x360 13-u102ng | |
| Medion Akoya P3401T 2in1 | |
| Lenovo Yoga 700-11ISK | |
| Dell Latitude 3189 | |
| HP Pavilion 11-k103ng x360 | |
| Work Score Accelerated v2 | |
| HP Pavilion x360 13-u102ng | |
| Acer Aspire Switch Alpha 12 SA5-271-56HM | |
| Lenovo Yoga 700-11ISK | |
| Dell Latitude 3189 | |
| Creative Score Accelerated v2 | |
| HP Pavilion x360 13-u102ng | |
| Lenovo Yoga 700-11ISK | |
| Dell Latitude 3189 | |
| PCMark 7 | |
| Score | |
| Dell Latitude 3189 | |
| HP Pavilion x360 13-u102ng | |
| Productivity | |
| Dell Latitude 3189 | |
| HP Pavilion x360 13-u102ng | |
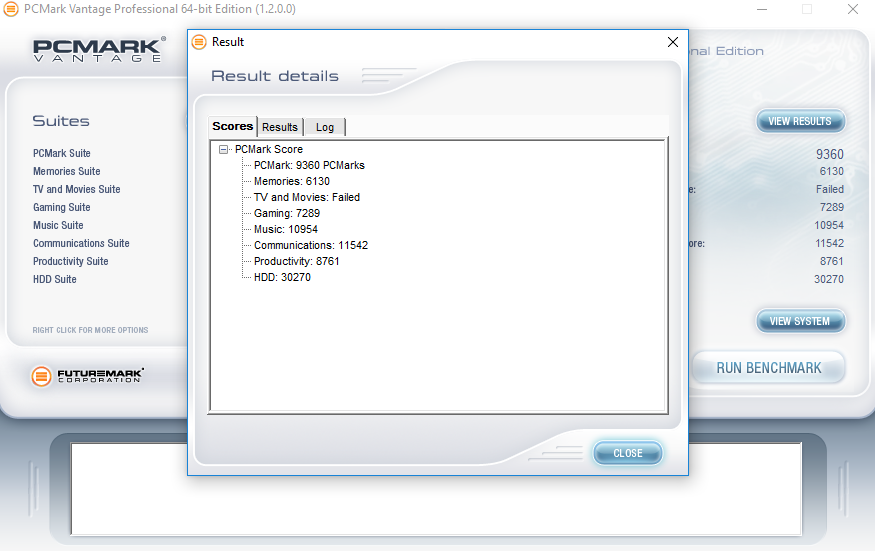
| PCMark Vantage Result | 9360 punti | |
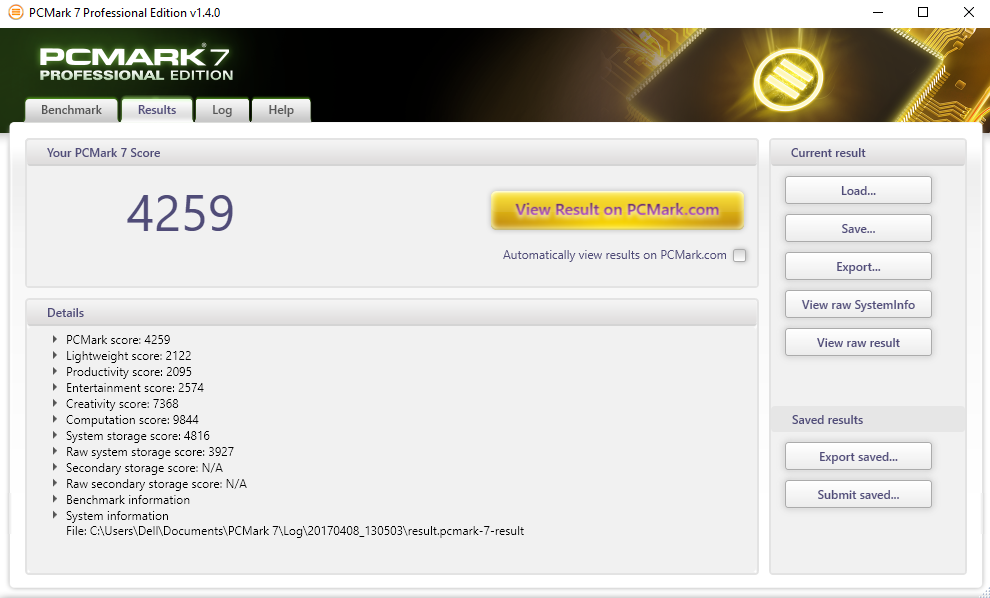
| PCMark 7 Score | 4259 punti | |
| PCMark 8 Home Score Accelerated v2 | 2273 punti | |
| PCMark 8 Creative Score Accelerated v2 | 2585 punti | |
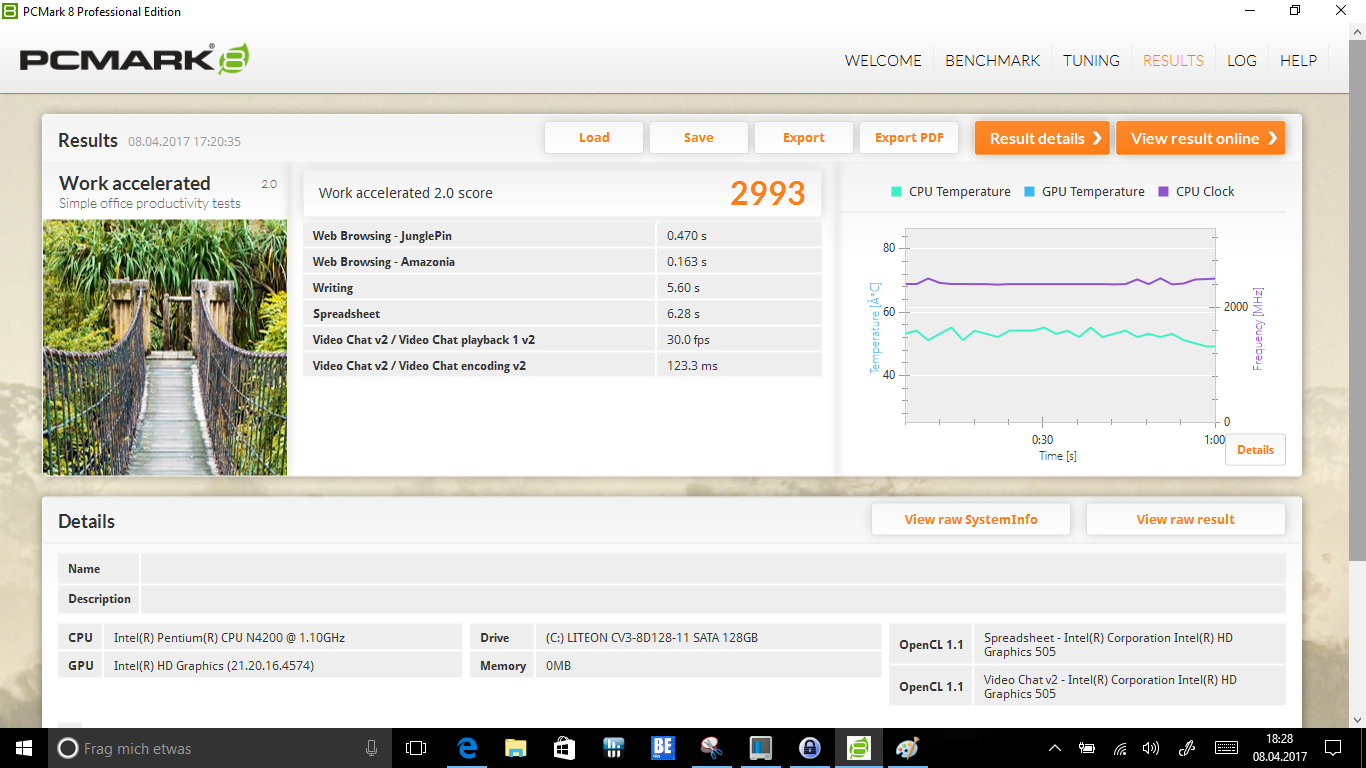
| PCMark 8 Work Score Accelerated v2 | 2993 punti | |
Aiuto | ||
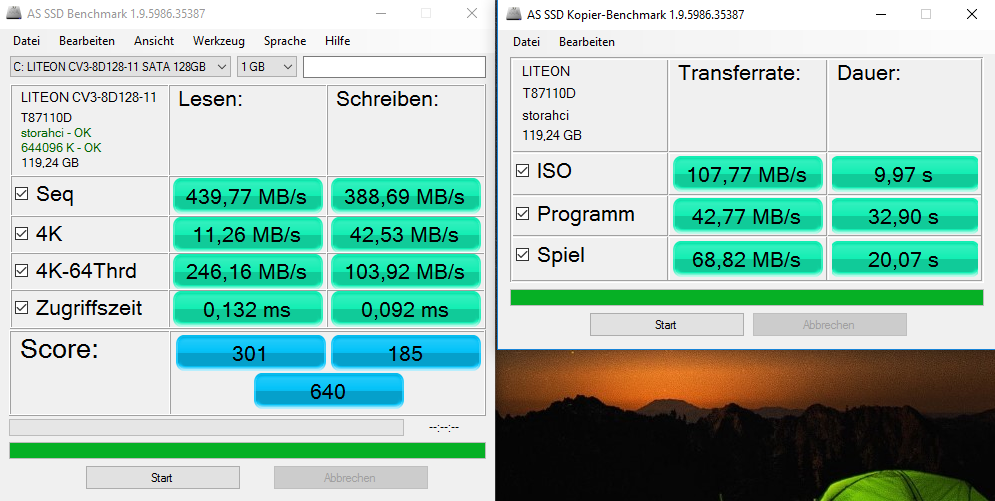
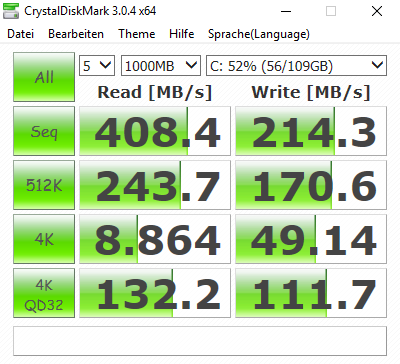
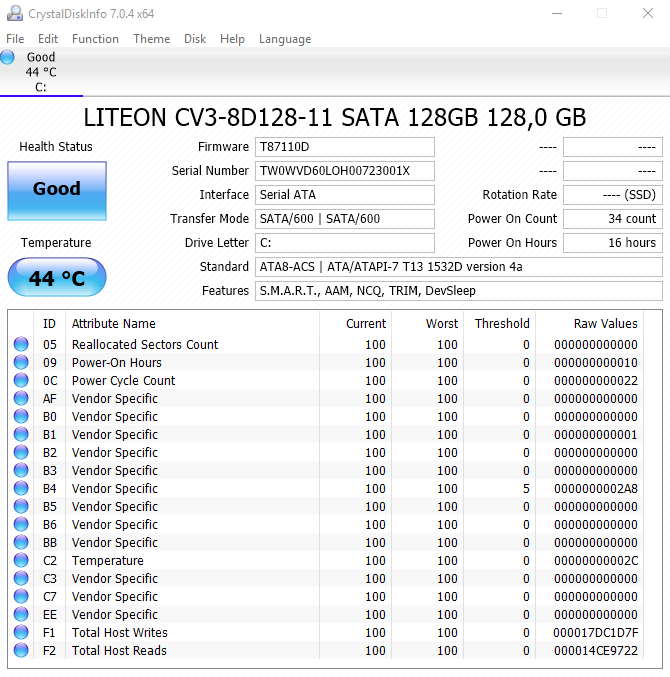
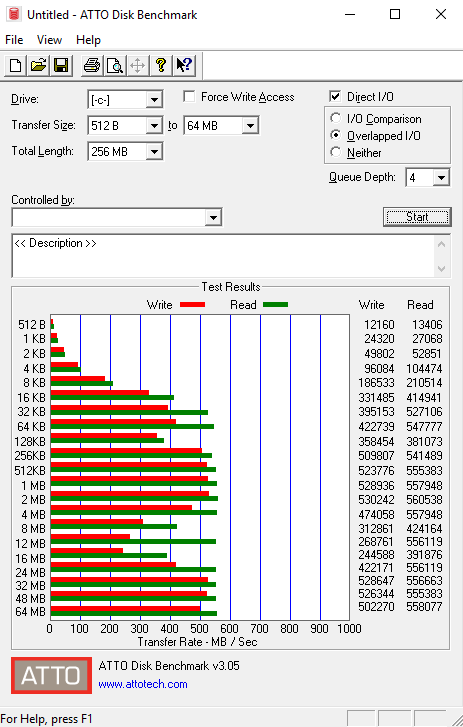
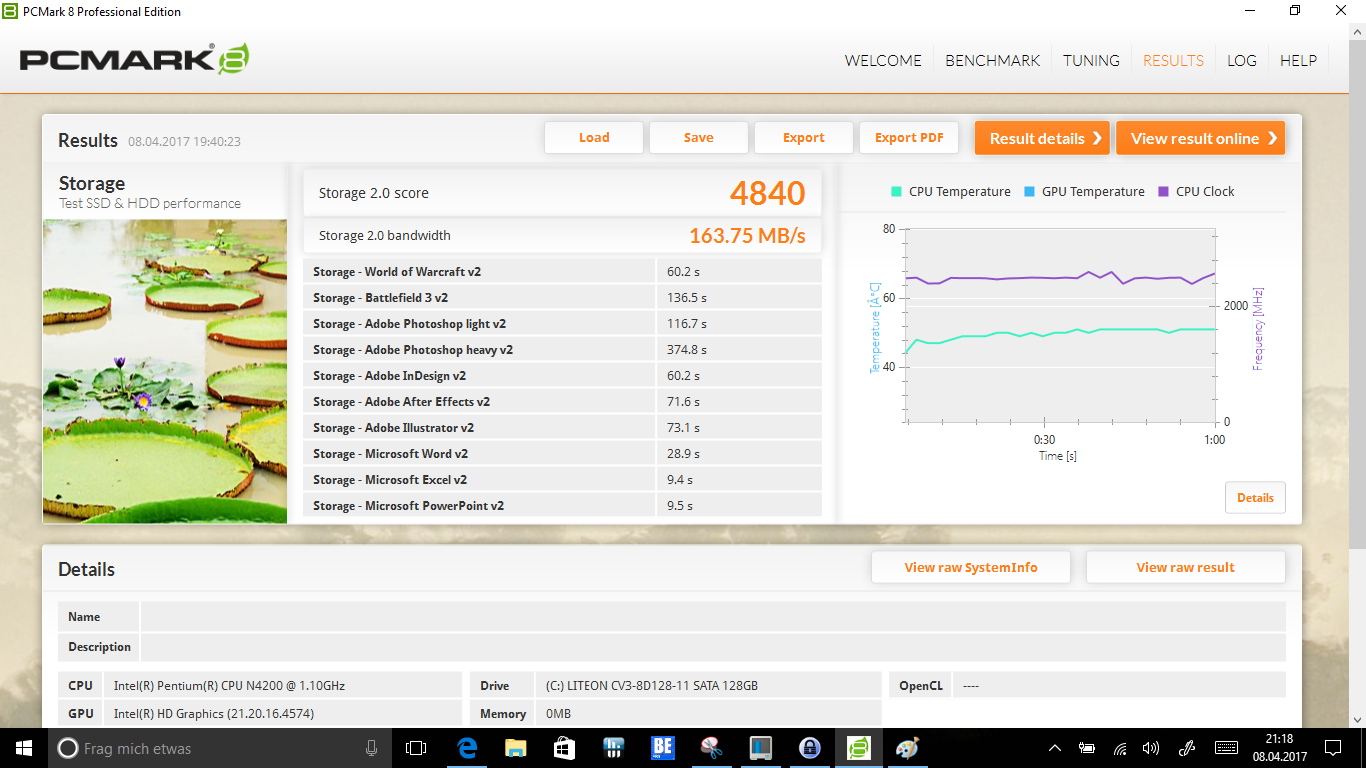
| Dell Latitude 3189 Liteonit CV3-8D128 | Medion Akoya P3401T 2in1 | HP Pavilion 11-k103ng x360 Hitachi Travelstar Z5K500 HTS545050A7E680 | HP Pavilion x360 13-u102ng HGST Travelstar 5K1000 HTS541010A7E630 | Lenovo Yoga 700-11ISK Samsung SSD PM871 MZNLN256HCHP | Acer Aspire Switch Alpha 12 SA5-271-56HM Kingston RBU-SNS8152S3256GG2 | |
|---|---|---|---|---|---|---|
| CrystalDiskMark 3.0 | 37% | -85% | -87% | 97% | 70% | |
| Read Seq (MB/s) | 408.4 | 427.6 5% | 106 -74% | 104.8 -74% | 456.2 12% | 518 27% |
| Write Seq (MB/s) | 214.3 | 286.5 34% | 106.1 -50% | 91 -58% | 302.8 41% | 199.9 -7% |
| Read 512 (MB/s) | 243.7 | 324.1 33% | 33.53 -86% | 20.67 -92% | 385.7 58% | 374.9 54% |
| Write 512 (MB/s) | 170.6 | 121.8 -29% | 39.03 -77% | 45.05 -74% | 301.9 77% | 201 18% |
| Read 4k (MB/s) | 8.864 | 28.11 217% | 0.407 -95% | 0.215 -98% | 31.27 253% | 29.3 231% |
| Write 4k (MB/s) | 49.14 | 41.68 -15% | 1.026 -98% | 1.037 -98% | 73.6 50% | 76.8 56% |
| Read 4k QD32 (MB/s) | 132.2 | 249.2 89% | 0.898 -99% | 0.968 -99% | 324.2 145% | 272 106% |
| Write 4k QD32 (MB/s) | 111.7 | 68.8 -38% | 1.003 -99% | 1.09 -99% | 268.6 140% | 197.1 76% |

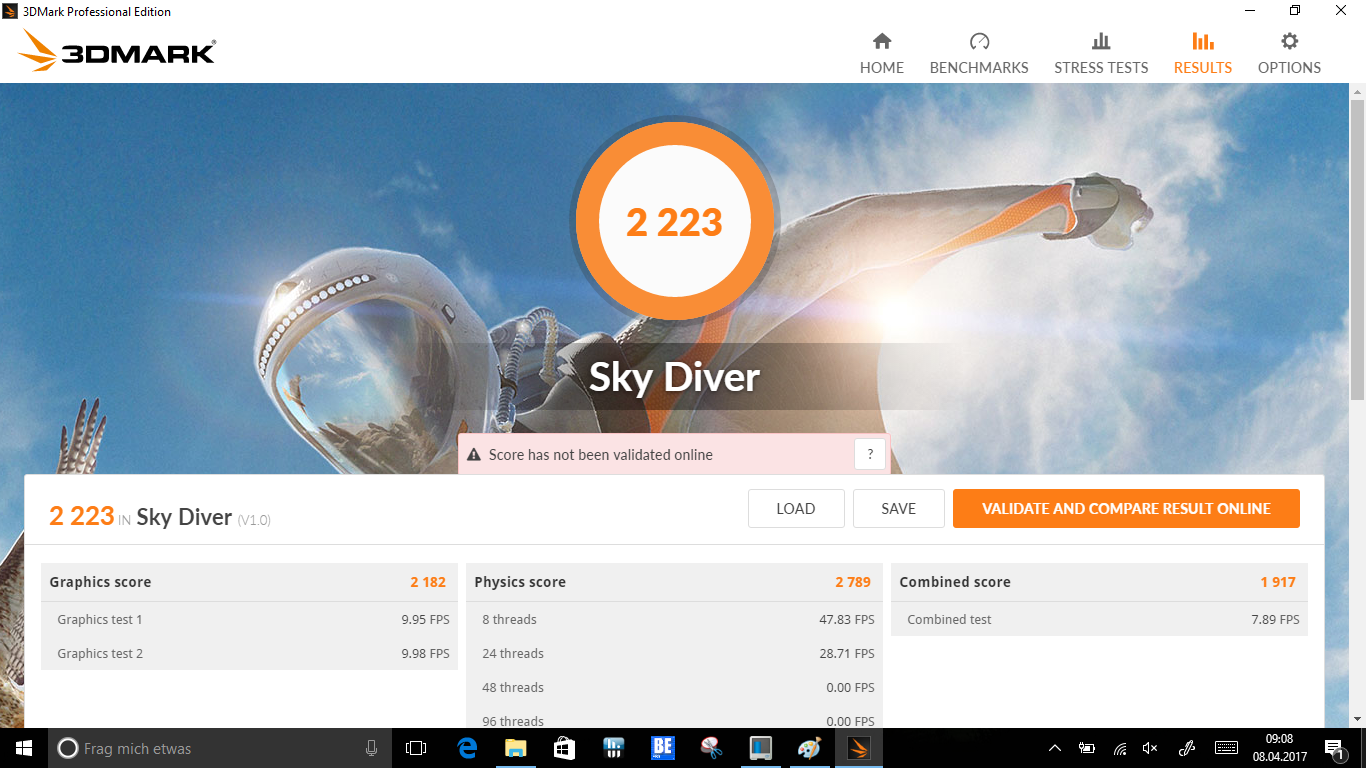
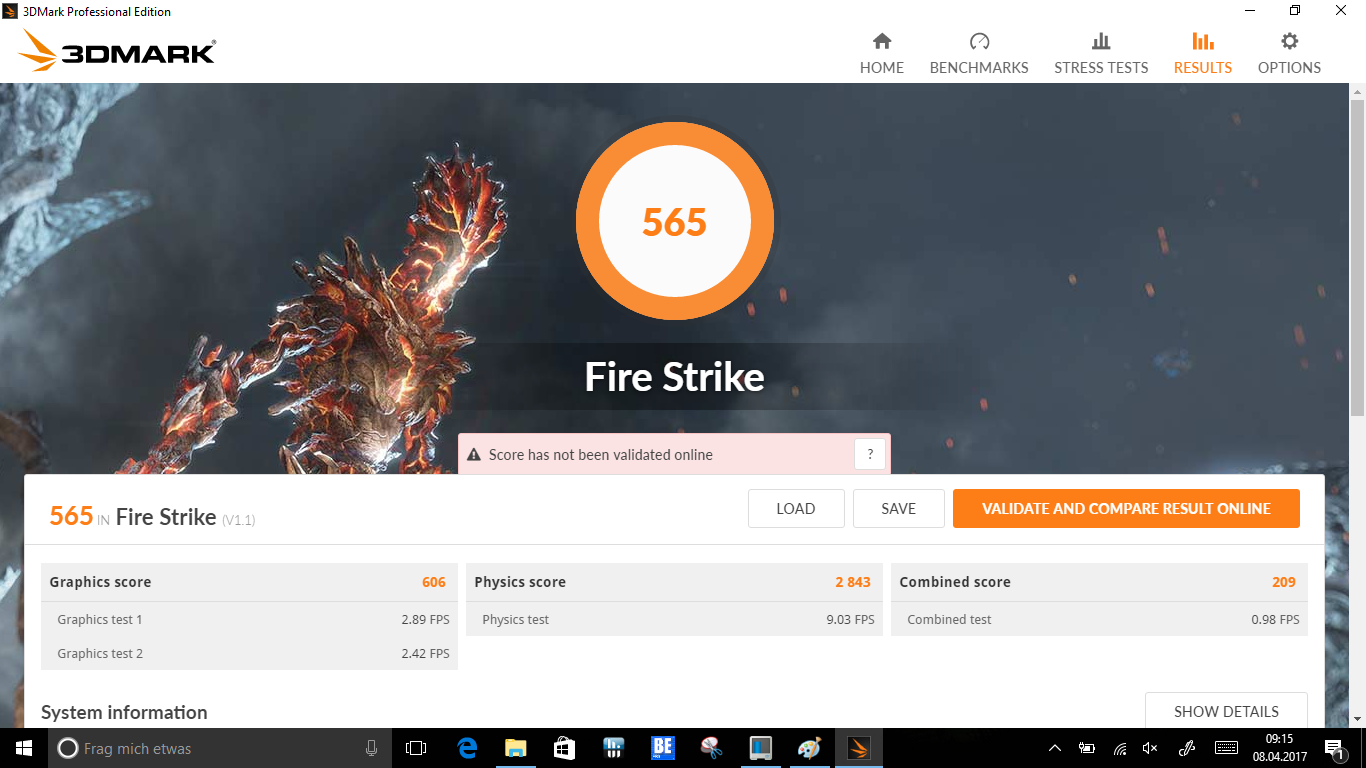
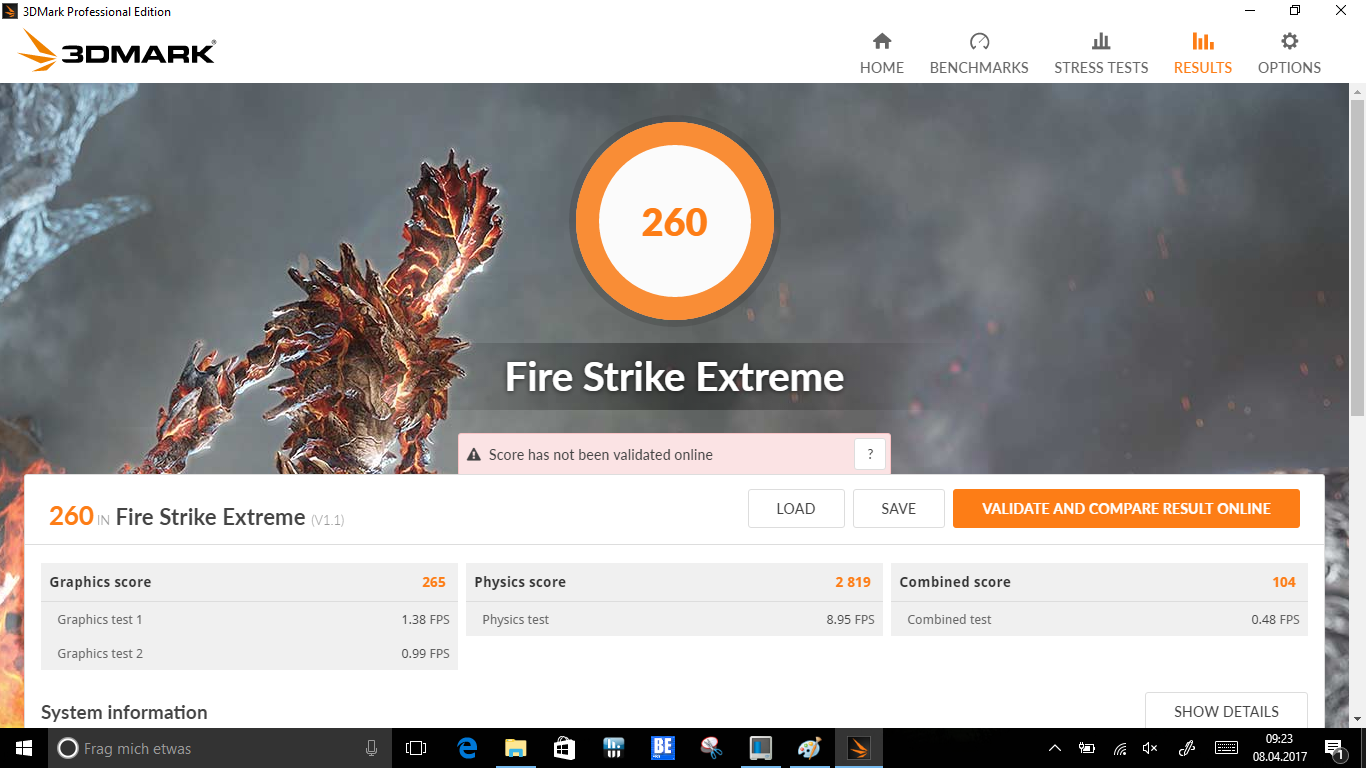
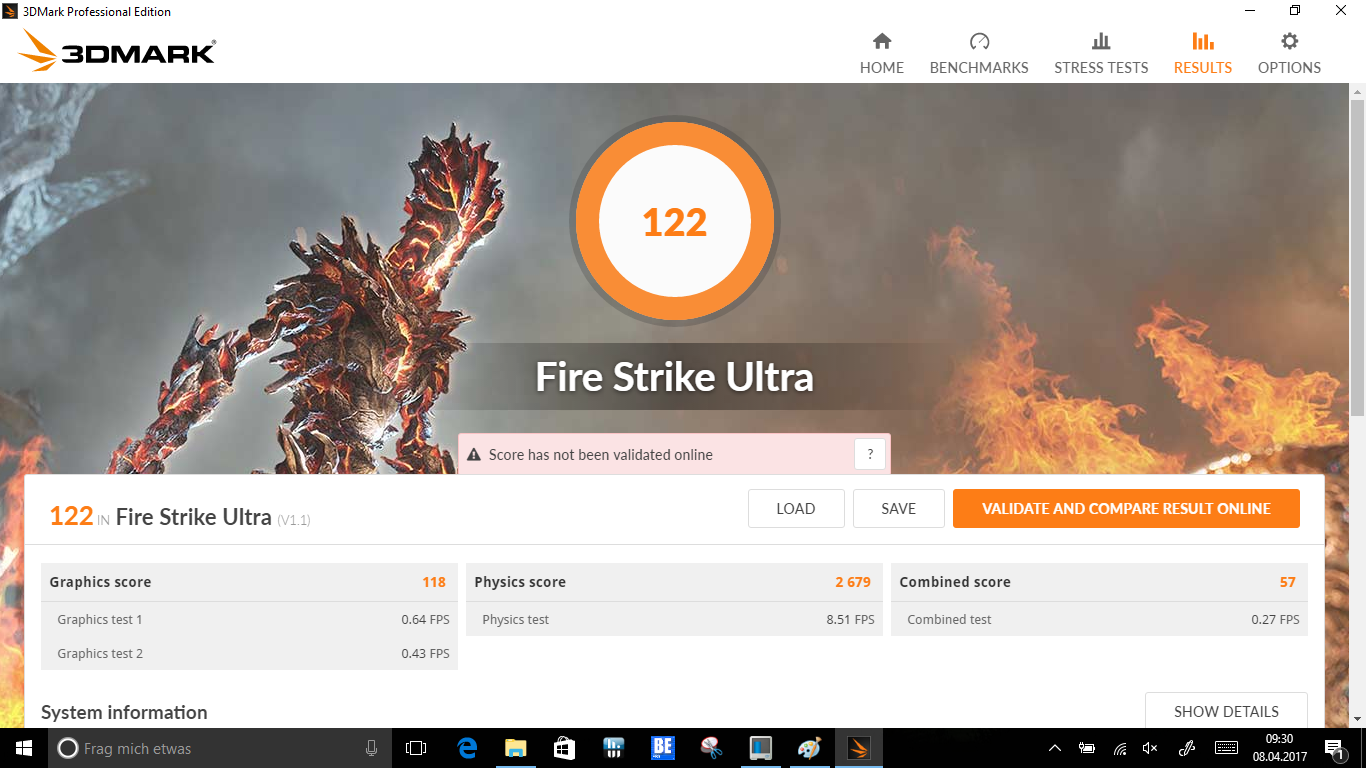
| 3DMark | |
| 1280x720 Cloud Gate Standard Graphics | |
| Acer Aspire Switch Alpha 12 SA5-271-56HM | |
| HP Pavilion x360 13-u102ng | |
| Dell Latitude 3189 | |
| Lenovo Yoga 700-11ISK | |
| 1920x1080 Fire Strike Graphics | |
| HP Pavilion x360 13-u102ng | |
| Dell Latitude 3189 | |
| Lenovo Yoga 700-11ISK | |
| 3DMark 11 - 1280x720 Performance GPU | |
| Acer Aspire Switch Alpha 12 SA5-271-56HM | |
| HP Pavilion x360 13-u102ng | |
| Medion Akoya P3401T 2in1 | |
| Lenovo Yoga 700-11ISK | |
| Dell Latitude 3189 | |
| HP Pavilion 11-k103ng x360 | |
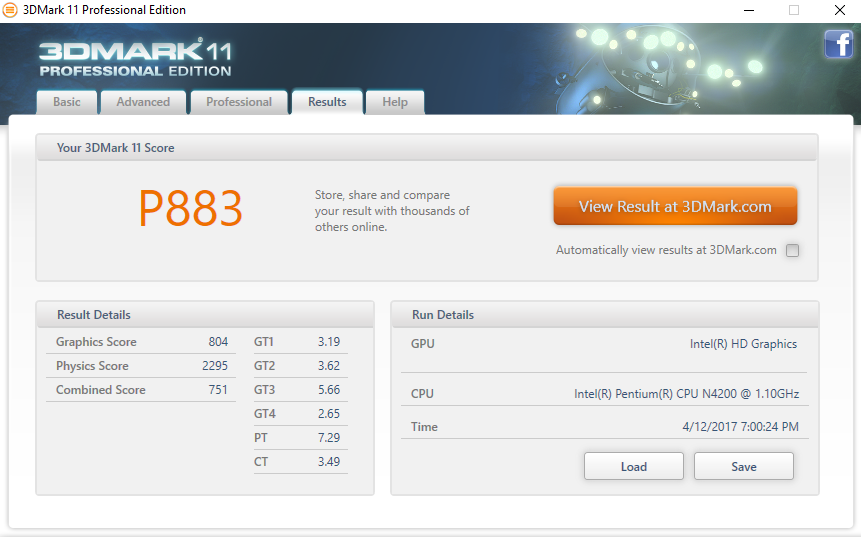
| 3DMark 11 Performance | 883 punti | |
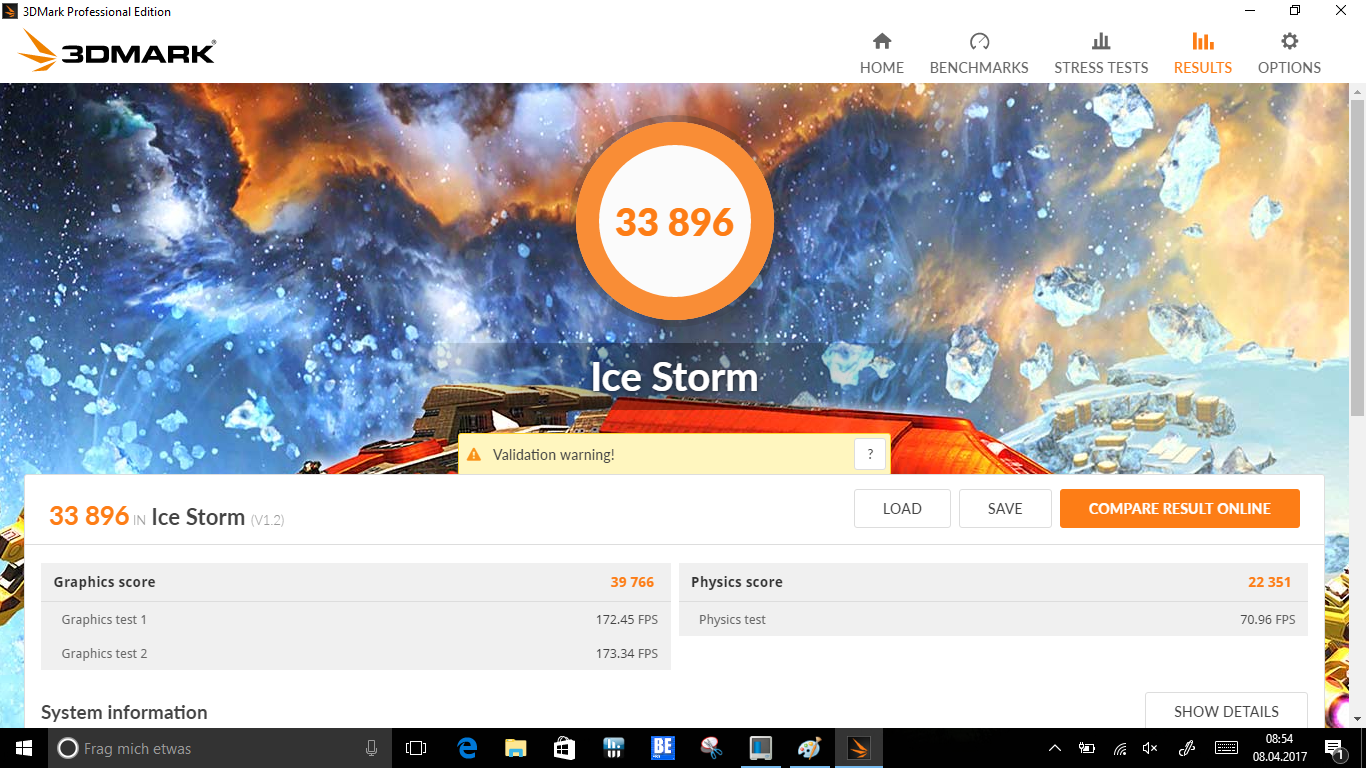
| 3DMark Ice Storm Standard Score | 33896 punti | |
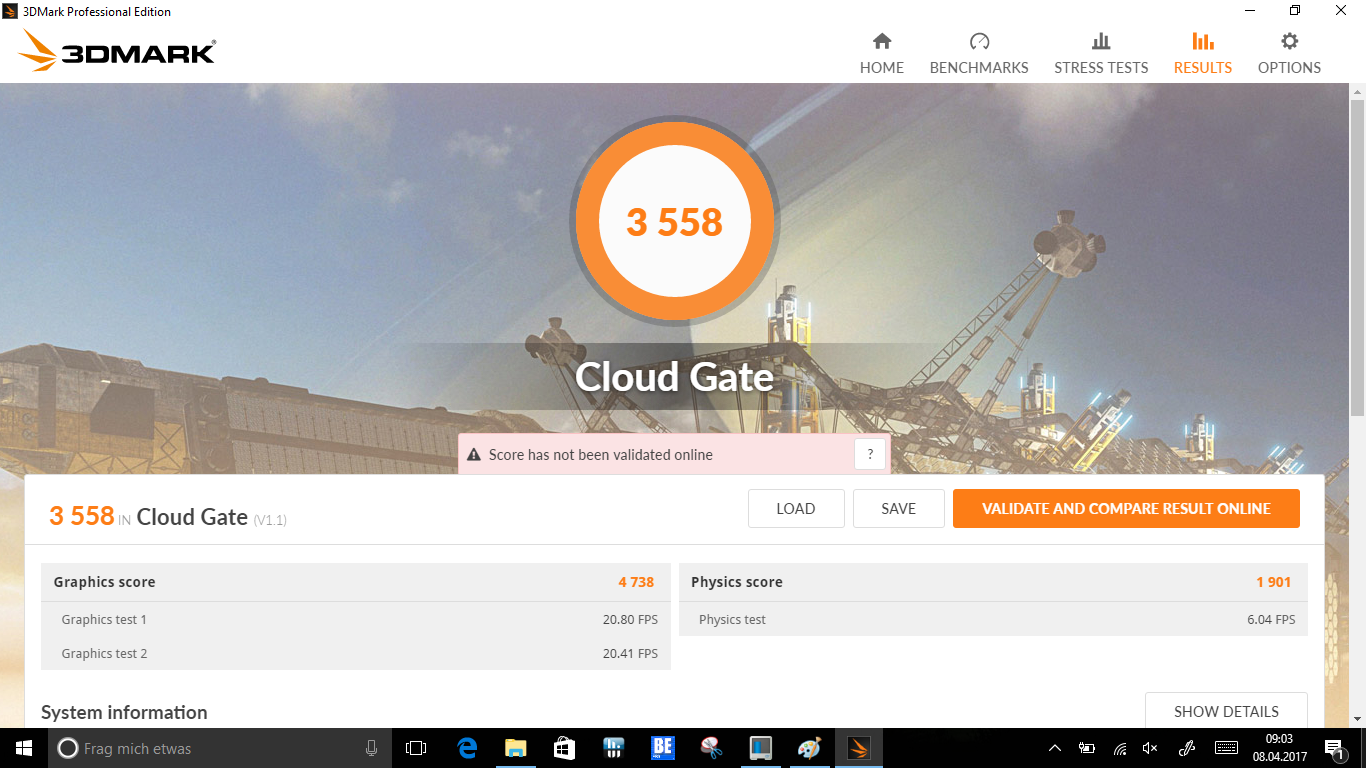
| 3DMark Cloud Gate Standard Score | 3558 punti | |
| 3DMark Fire Strike Score | 565 punti | |
| 3DMark Fire Strike Extreme Score | 260 punti | |
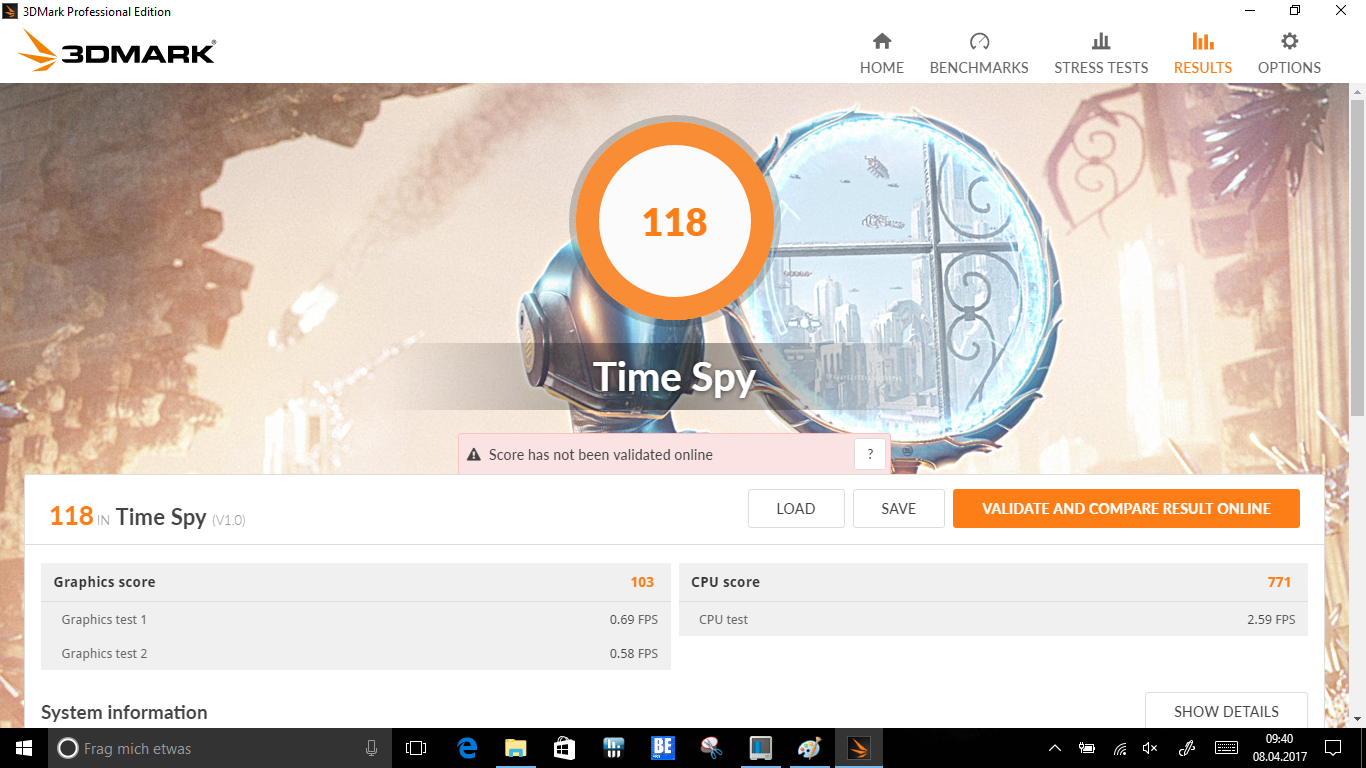
| 3DMark Time Spy Score | 118 punti | |
Aiuto | ||
| basso | medio | alto | ultra | |
|---|---|---|---|---|
| BioShock Infinite (2013) | 30.6 | 17.3 | 15.1 | |
| Battlefield 4 (2013) | 20.9 | 15.2 | 9.5 | |
| Rise of the Tomb Raider (2016) | 6.1 | 4 |
| Dell Latitude 3189 Pentium N4200, HD Graphics 505 | Medion Akoya P3401T 2in1 6Y54, HD Graphics 515 | HP Pavilion 11-k103ng x360 N3050, HD Graphics (Braswell) | HP Pavilion x360 13-u102ng i5-7200U, HD Graphics 620 | Lenovo Yoga 700-11ISK 6Y30, HD Graphics 515 | Acer Aspire Switch Alpha 12 SA5-271-56HM 6200U, HD Graphics 520 | |
|---|---|---|---|---|---|---|
| Emissions | ||||||
| Fan Noise (dB(A)) | 37.3 |
(±) La temperatura massima sul lato superiore è di 43.3 °C / 110 F, rispetto alla media di 35.4 °C / 96 F, che varia da 19.6 a 60 °C per questa classe Convertible.
(-) Il lato inferiore si riscalda fino ad un massimo di 54.9 °C / 131 F, rispetto alla media di 36.9 °C / 98 F
(+) In idle, la temperatura media del lato superiore è di 26 °C / 79 F, rispetto alla media deld ispositivo di 30.3 °C / 87 F.
(±) I poggiapolsi e il touchpad possono diventare molto caldi al tatto con un massimo di 37.9 °C / 100.2 F.
(-) La temperatura media della zona del palmo della mano di dispositivi simili e'stata di 28 °C / 82.4 F (-9.9 °C / -17.8 F).
| Dell Latitude 3189 Pentium N4200, HD Graphics 505 | Medion Akoya P3401T 2in1 6Y54, HD Graphics 515 | HP Pavilion 11-k103ng x360 N3050, HD Graphics (Braswell) | HP Pavilion x360 13-u102ng i5-7200U, HD Graphics 620 | Lenovo Yoga 700-11ISK 6Y30, HD Graphics 515 | Acer Aspire Switch Alpha 12 SA5-271-56HM 6200U, HD Graphics 520 | |
|---|---|---|---|---|---|---|
| Heat | 12% | -17% | 15% | -1% | -3% | |
| Maximum Upper Side * (°C) | 43.3 | 38.1 12% | 44.6 -3% | 34.6 20% | 36.8 15% | 46.7 -8% |
| Maximum Bottom * (°C) | 54.9 | 41.7 24% | 53.1 3% | 36.4 34% | 42 23% | 51 7% |
| Idle Upper Side * (°C) | 27.5 | 27.9 -1% | 35.2 -28% | 26.6 3% | 32.1 -17% | 29.5 -7% |
| Idle Bottom * (°C) | 27.9 | 24.1 14% | 38.6 -38% | 27.7 1% | 34.4 -23% | 28.6 -3% |
* ... Meglio usare valori piccoli
Dell Latitude 3189 analisi audio
(+) | gli altoparlanti sono relativamente potenti (83 dB)
Bassi 100 - 315 Hz
(-) | quasi nessun basso - in media 23.3% inferiori alla media
(±) | la linearità dei bassi è media (8.3% delta rispetto alla precedente frequenza)
Medi 400 - 2000 Hz
(±) | medi ridotti - circa 5% inferiori alla media
(±) | linearità dei medi adeguata (8.1% delta rispetto alla precedente frequenza)
Alti 2 - 16 kHz
(+) | Alti bilanciati - appena 4.5% dalla media
(+) | alti lineari (6.5% delta rispetto alla precedente frequenza)
Nel complesso 100 - 16.000 Hz
(±) | la linearità complessiva del suono è media (19.2% di differenza rispetto alla media
Rispetto alla stessa classe
» 46% di tutti i dispositivi testati in questa classe è stato migliore, 7% simile, 47% peggiore
» Il migliore ha avuto un delta di 6%, medio di 20%, peggiore di 57%
Rispetto a tutti i dispositivi testati
» 46% di tutti i dispositivi testati in questa classe è stato migliore, 7% similare, 46% peggiore
» Il migliore ha avuto un delta di 4%, medio di 23%, peggiore di 134%
Apple MacBook 12 (Early 2016) 1.1 GHz analisi audio
(+) | gli altoparlanti sono relativamente potenti (83.6 dB)
Bassi 100 - 315 Hz
(±) | bassi ridotti - in media 11.3% inferiori alla media
(±) | la linearità dei bassi è media (14.2% delta rispetto alla precedente frequenza)
Medi 400 - 2000 Hz
(+) | medi bilanciati - solo only 2.4% rispetto alla media
(+) | medi lineari (5.5% delta rispetto alla precedente frequenza)
Alti 2 - 16 kHz
(+) | Alti bilanciati - appena 2% dalla media
(+) | alti lineari (4.5% delta rispetto alla precedente frequenza)
Nel complesso 100 - 16.000 Hz
(+) | suono nel complesso lineare (10.2% differenza dalla media)
Rispetto alla stessa classe
» 7% di tutti i dispositivi testati in questa classe è stato migliore, 2% simile, 90% peggiore
» Il migliore ha avuto un delta di 5%, medio di 18%, peggiore di 53%
Rispetto a tutti i dispositivi testati
» 5% di tutti i dispositivi testati in questa classe è stato migliore, 1% similare, 94% peggiore
» Il migliore ha avuto un delta di 4%, medio di 23%, peggiore di 134%
| Off / Standby | |
| Idle | |
| Sotto carico |
|
Leggenda:
min: | |
| Dell Latitude 3189 Pentium N4200, HD Graphics 505, Liteonit CV3-8D128, IPS, 1366x768, 11.6" | Medion Akoya P3401T 2in1 6Y54, HD Graphics 515, , IPS, 1920x1080, 12.5" | HP Pavilion 11-k103ng x360 N3050, HD Graphics (Braswell), Hitachi Travelstar Z5K500 HTS545050A7E680, IPS, 1366x768, 11.6" | HP Pavilion x360 13-u102ng i5-7200U, HD Graphics 620, HGST Travelstar 5K1000 HTS541010A7E630, IPS, 1920x1080, 13.3" | Lenovo Yoga 700-11ISK 6Y30, HD Graphics 515, Samsung SSD PM871 MZNLN256HCHP, IPS, 1920x1080, 11.6" | Acer Aspire Switch Alpha 12 SA5-271-56HM 6200U, HD Graphics 520, Kingston RBU-SNS8152S3256GG2, IPS, 2160x1440, 12" | |
|---|---|---|---|---|---|---|
| Power Consumption | -37% | -45% | -66% | -29% | -105% | |
| Idle Minimum * (Watt) | 2.17 | 3.8 -75% | 5.3 -144% | 4.7 -117% | 4.3 -98% | 7.3 -236% |
| Idle Average * (Watt) | 4.31 | 7.1 -65% | 7.1 -65% | 7.2 -67% | 7.1 -65% | 10 -132% |
| Idle Maximum * (Watt) | 5.79 | 8.1 -40% | 8.2 -42% | 7.9 -36% | 7.2 -24% | 10.15 -75% |
| Load Average * (Watt) | 15.8 | 19.1 -21% | 15.5 2% | 30 -90% | 14.6 8% | 25.2 -59% |
| Load Maximum * (Watt) | 24.2 | 20.2 17% | 18.9 22% | 29 -20% | 15.7 35% | 29.3 -21% |
* ... Meglio usare valori piccoli
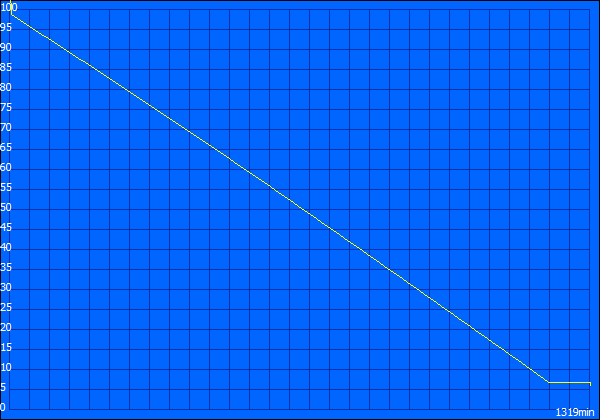
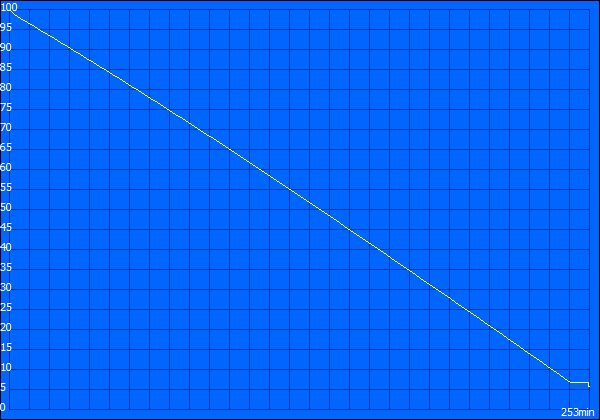
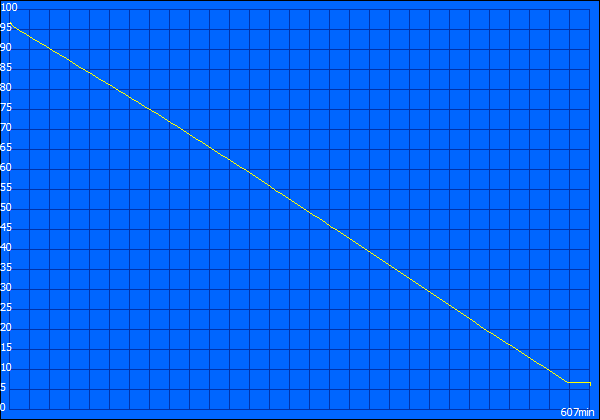

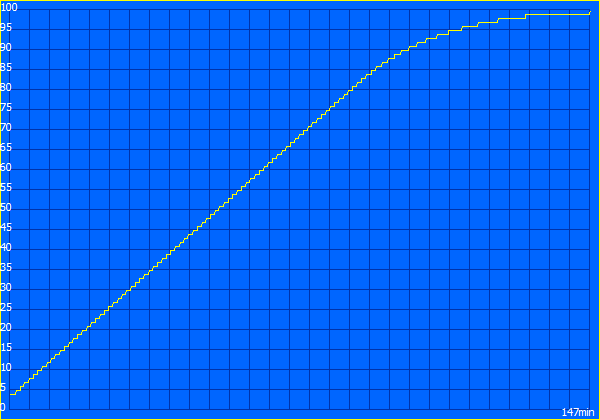
| Dell Latitude 3189 Pentium N4200, HD Graphics 505, 42 Wh | Medion Akoya P3401T 2in1 6Y54, HD Graphics 515, 51 Wh | HP Pavilion 11-k103ng x360 N3050, HD Graphics (Braswell), 32 Wh | HP Pavilion x360 13-u102ng i5-7200U, HD Graphics 620, 41 Wh | Lenovo Yoga 700-11ISK 6Y30, HD Graphics 515, 40 Wh | Acer Aspire Switch Alpha 12 SA5-271-56HM 6200U, HD Graphics 520, 37 Wh | |
|---|---|---|---|---|---|---|
| Autonomia della batteria | -28% | -52% | -52% | -21% | -40% | |
| Reader / Idle (h) | 22 | 9.3 -58% | 14.4 -35% | 10.7 -51% | ||
| H.264 (h) | 8.4 | 5.3 -37% | 7.7 -8% | 7.8 -7% | ||
| WiFi v1.3 (h) | 10.1 | 7.3 -28% | 4.8 -52% | 5.4 -47% | 7 -31% | 5.4 -47% |
| Load (h) | 4.2 | 1.4 -67% | 3.8 -10% | 1.9 -55% |
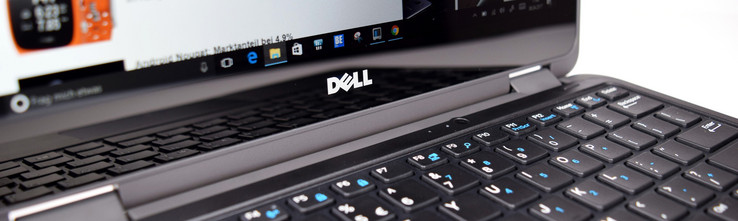
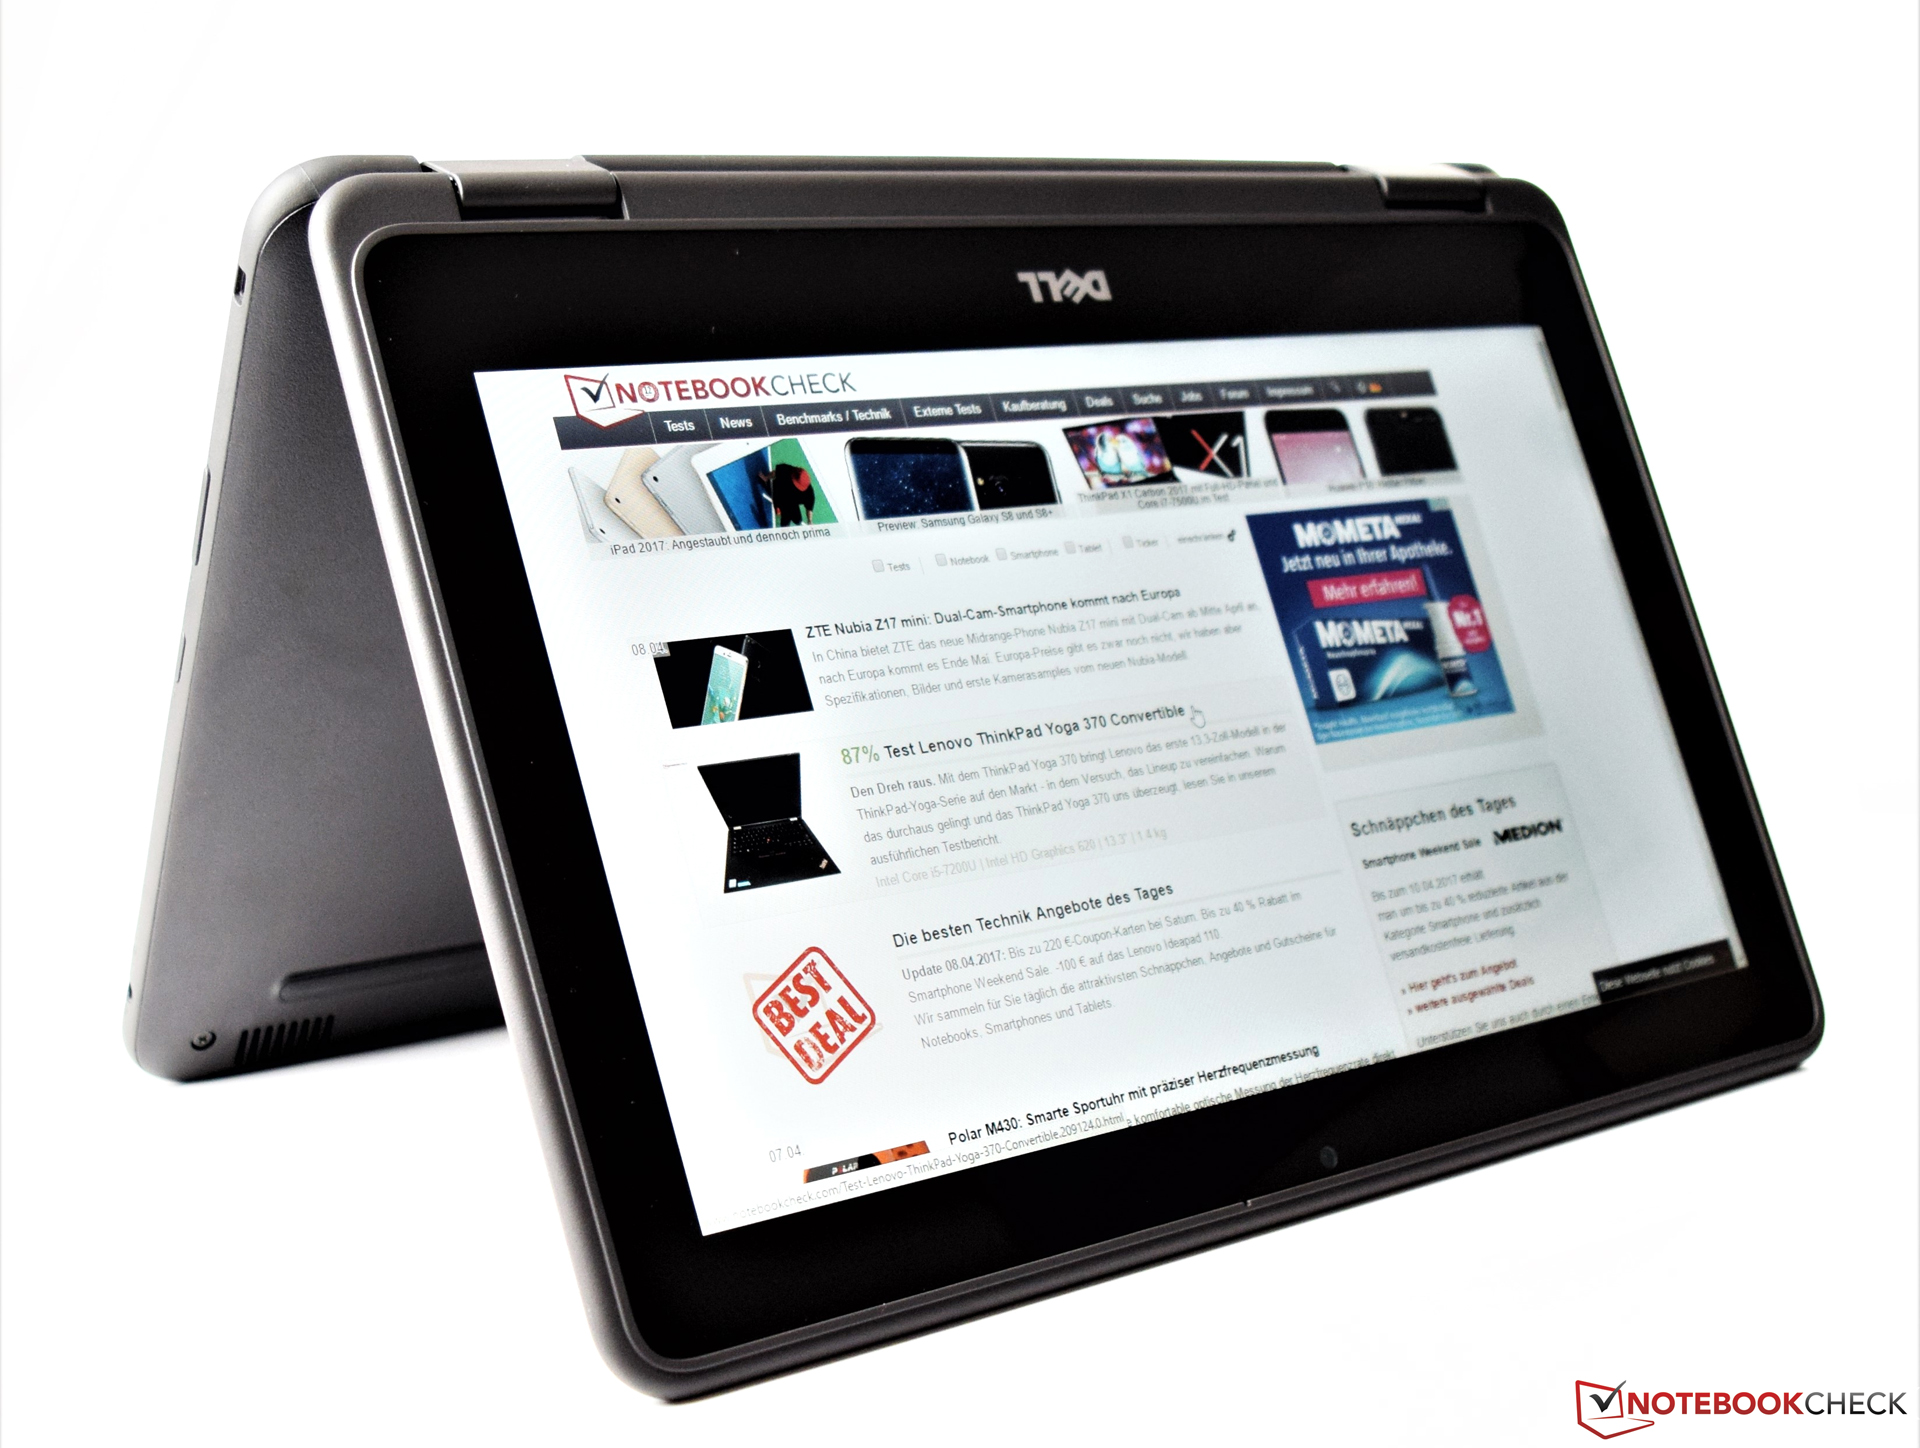
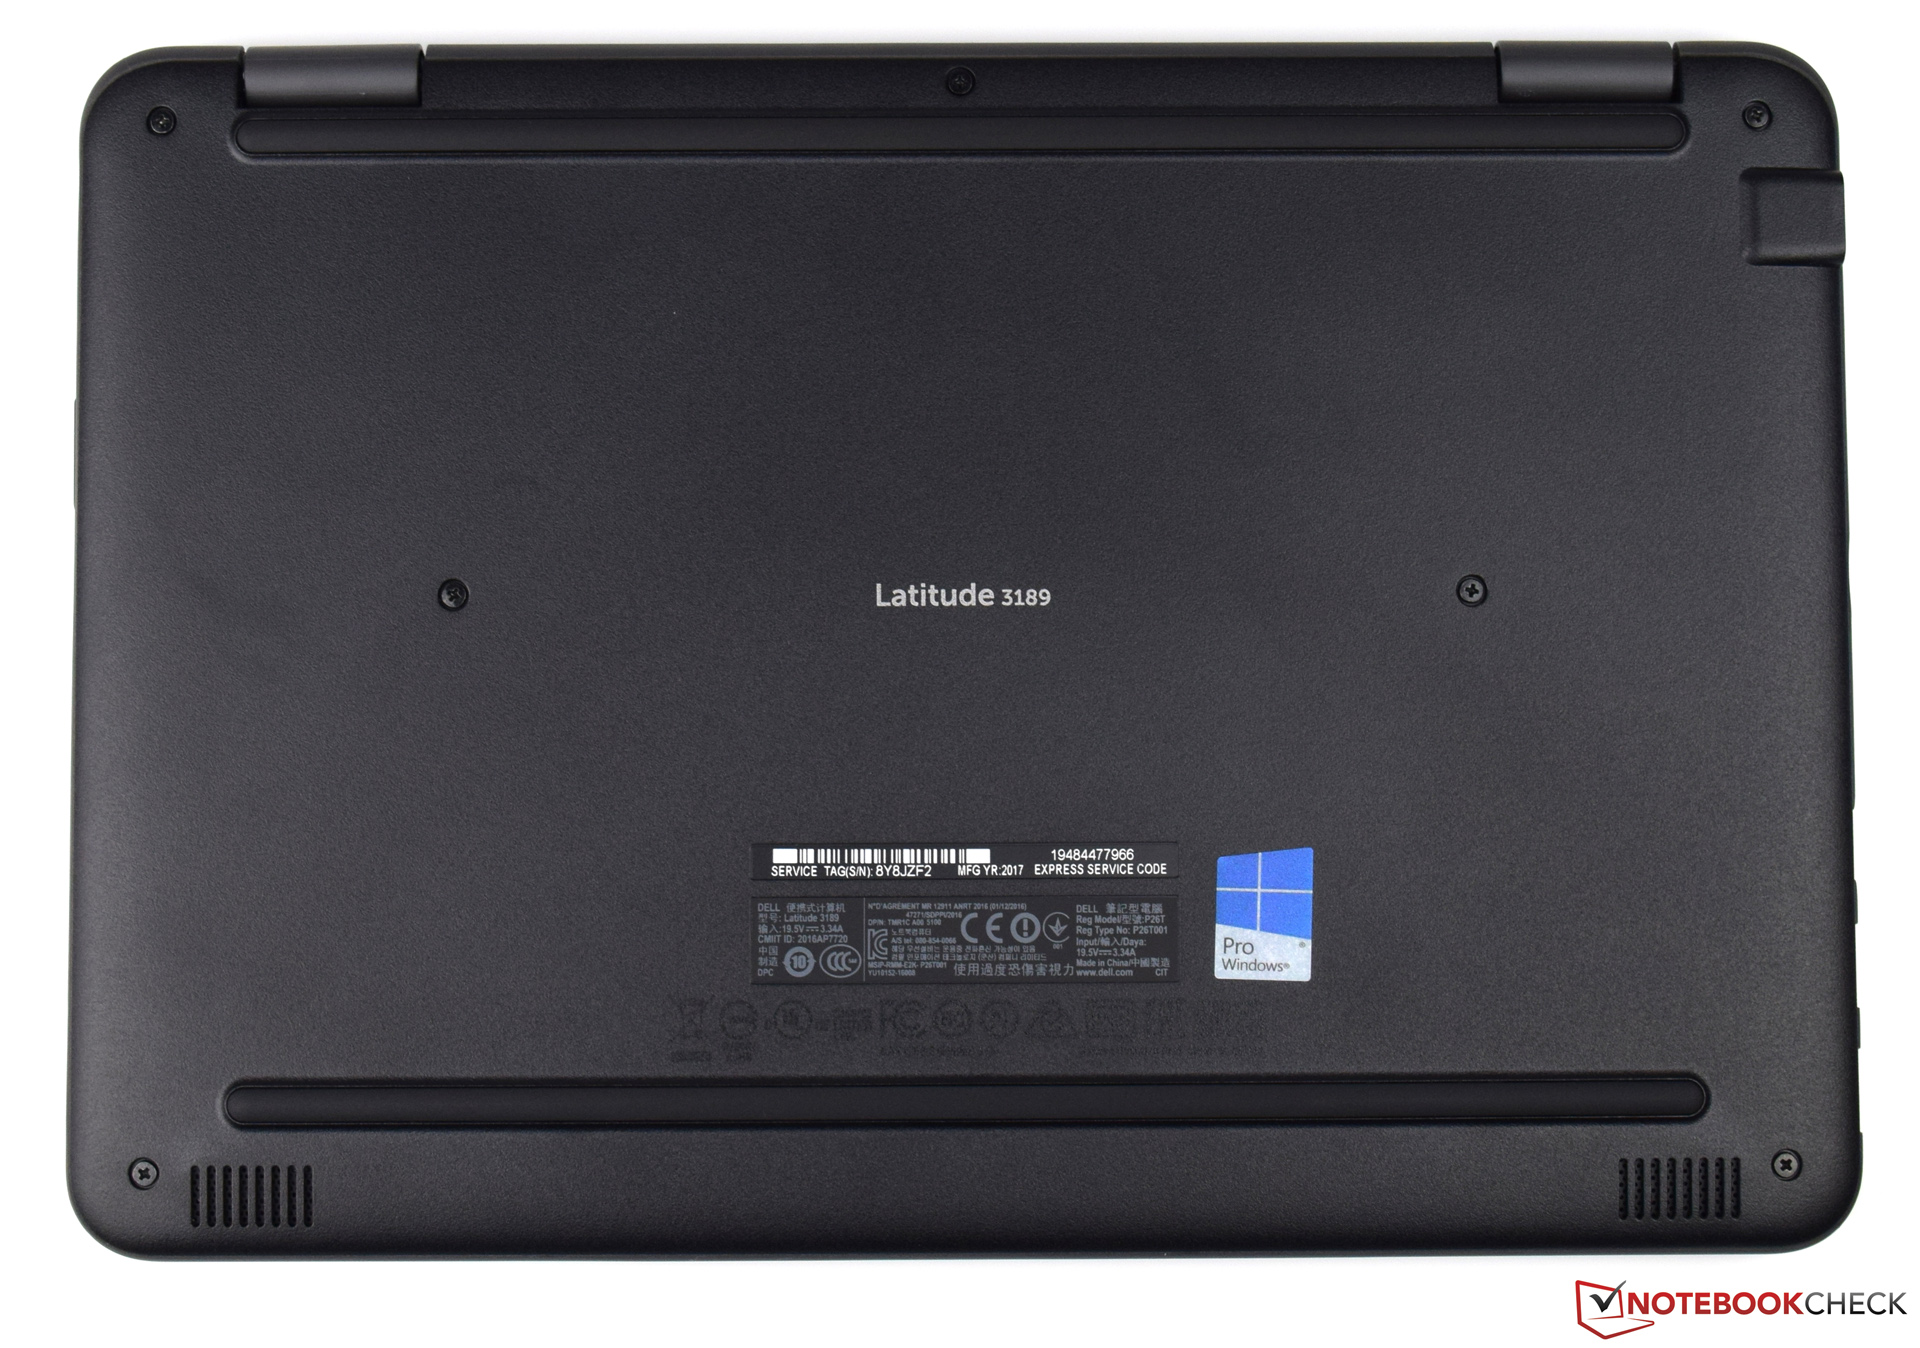
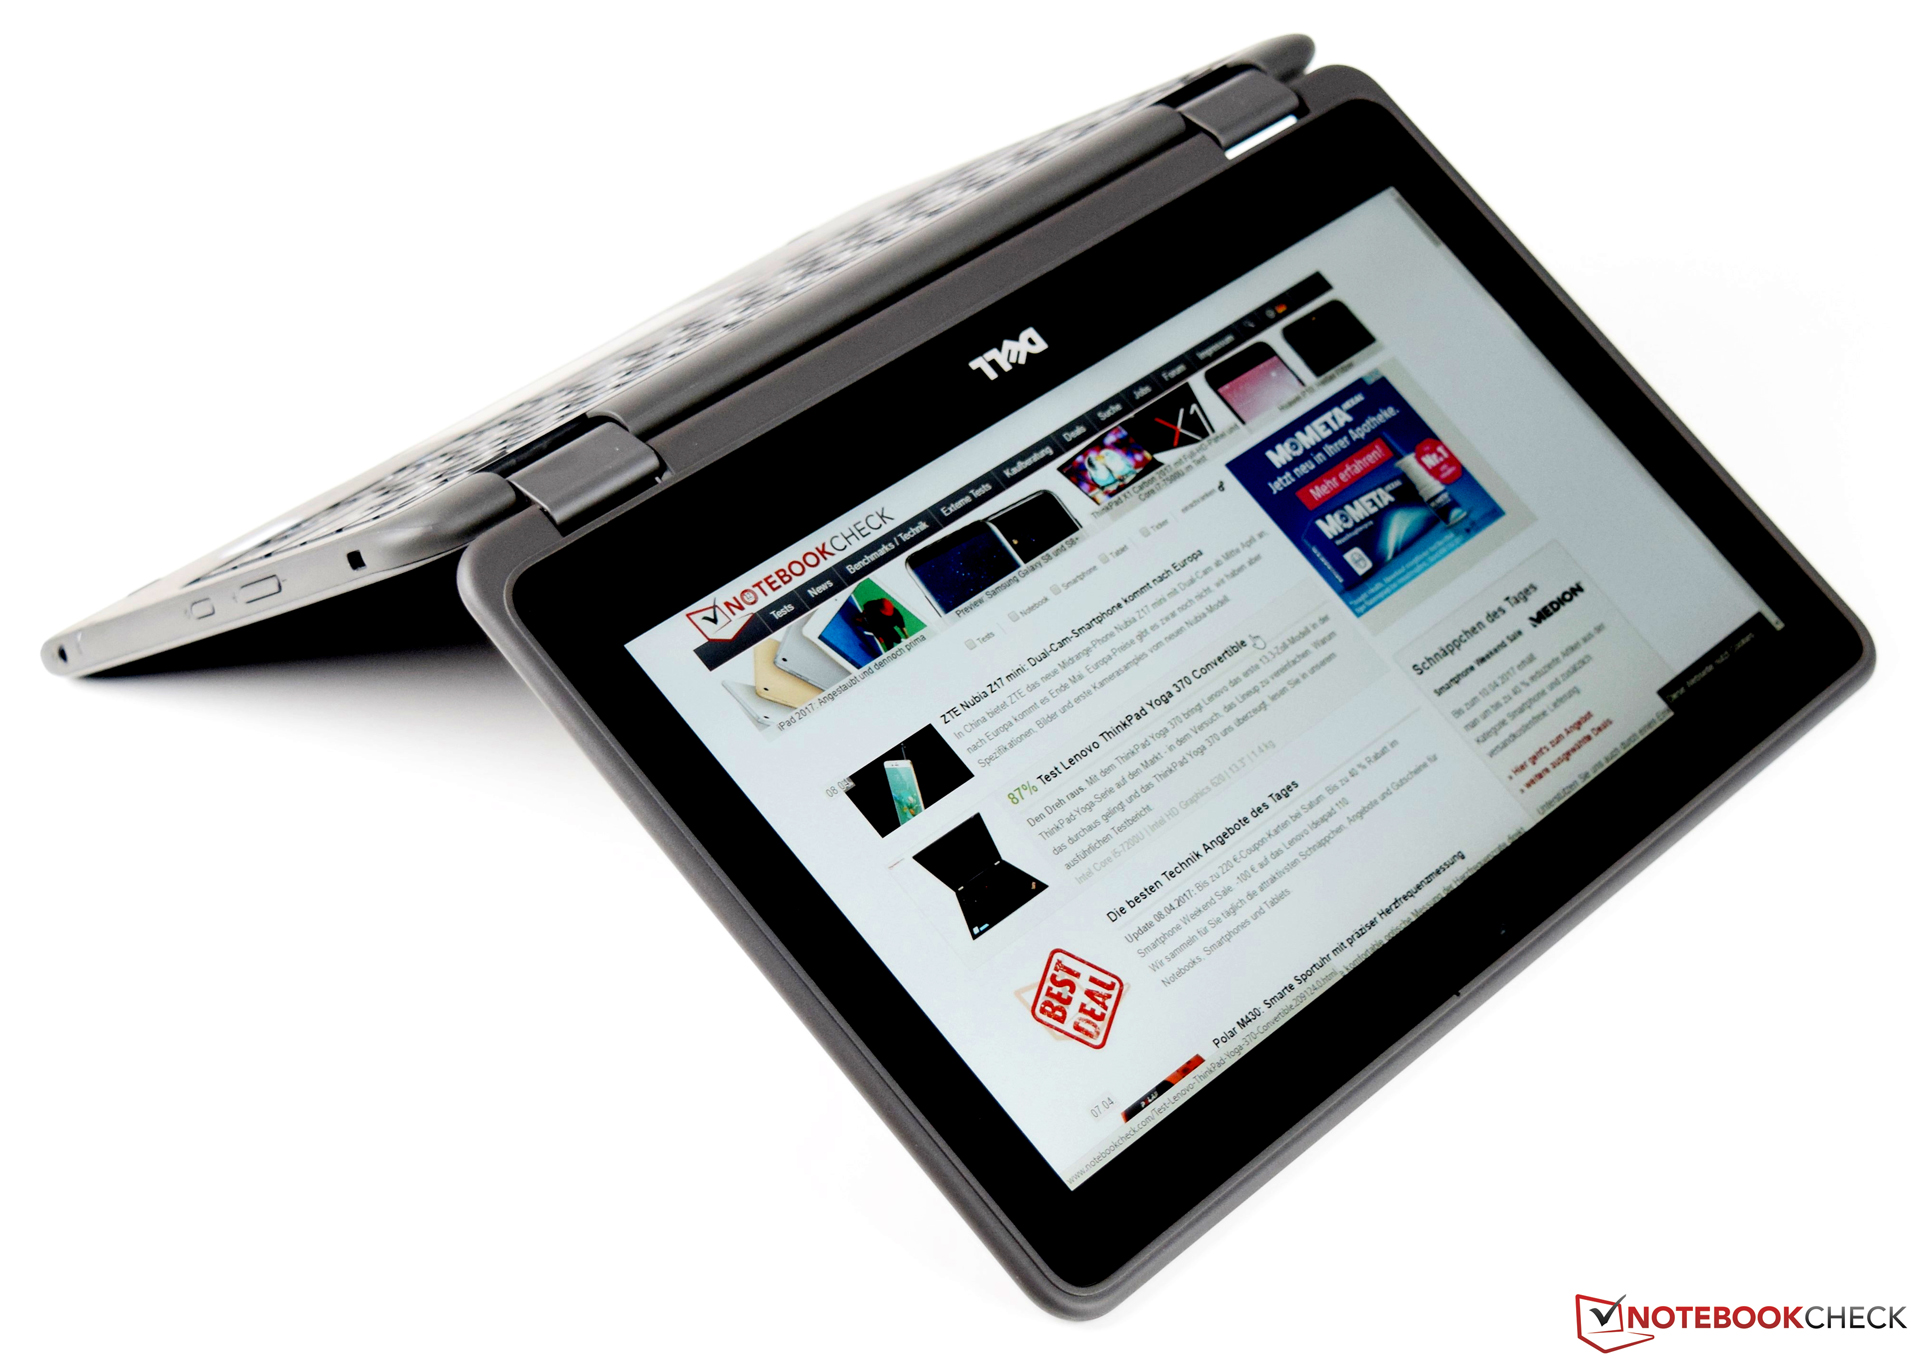
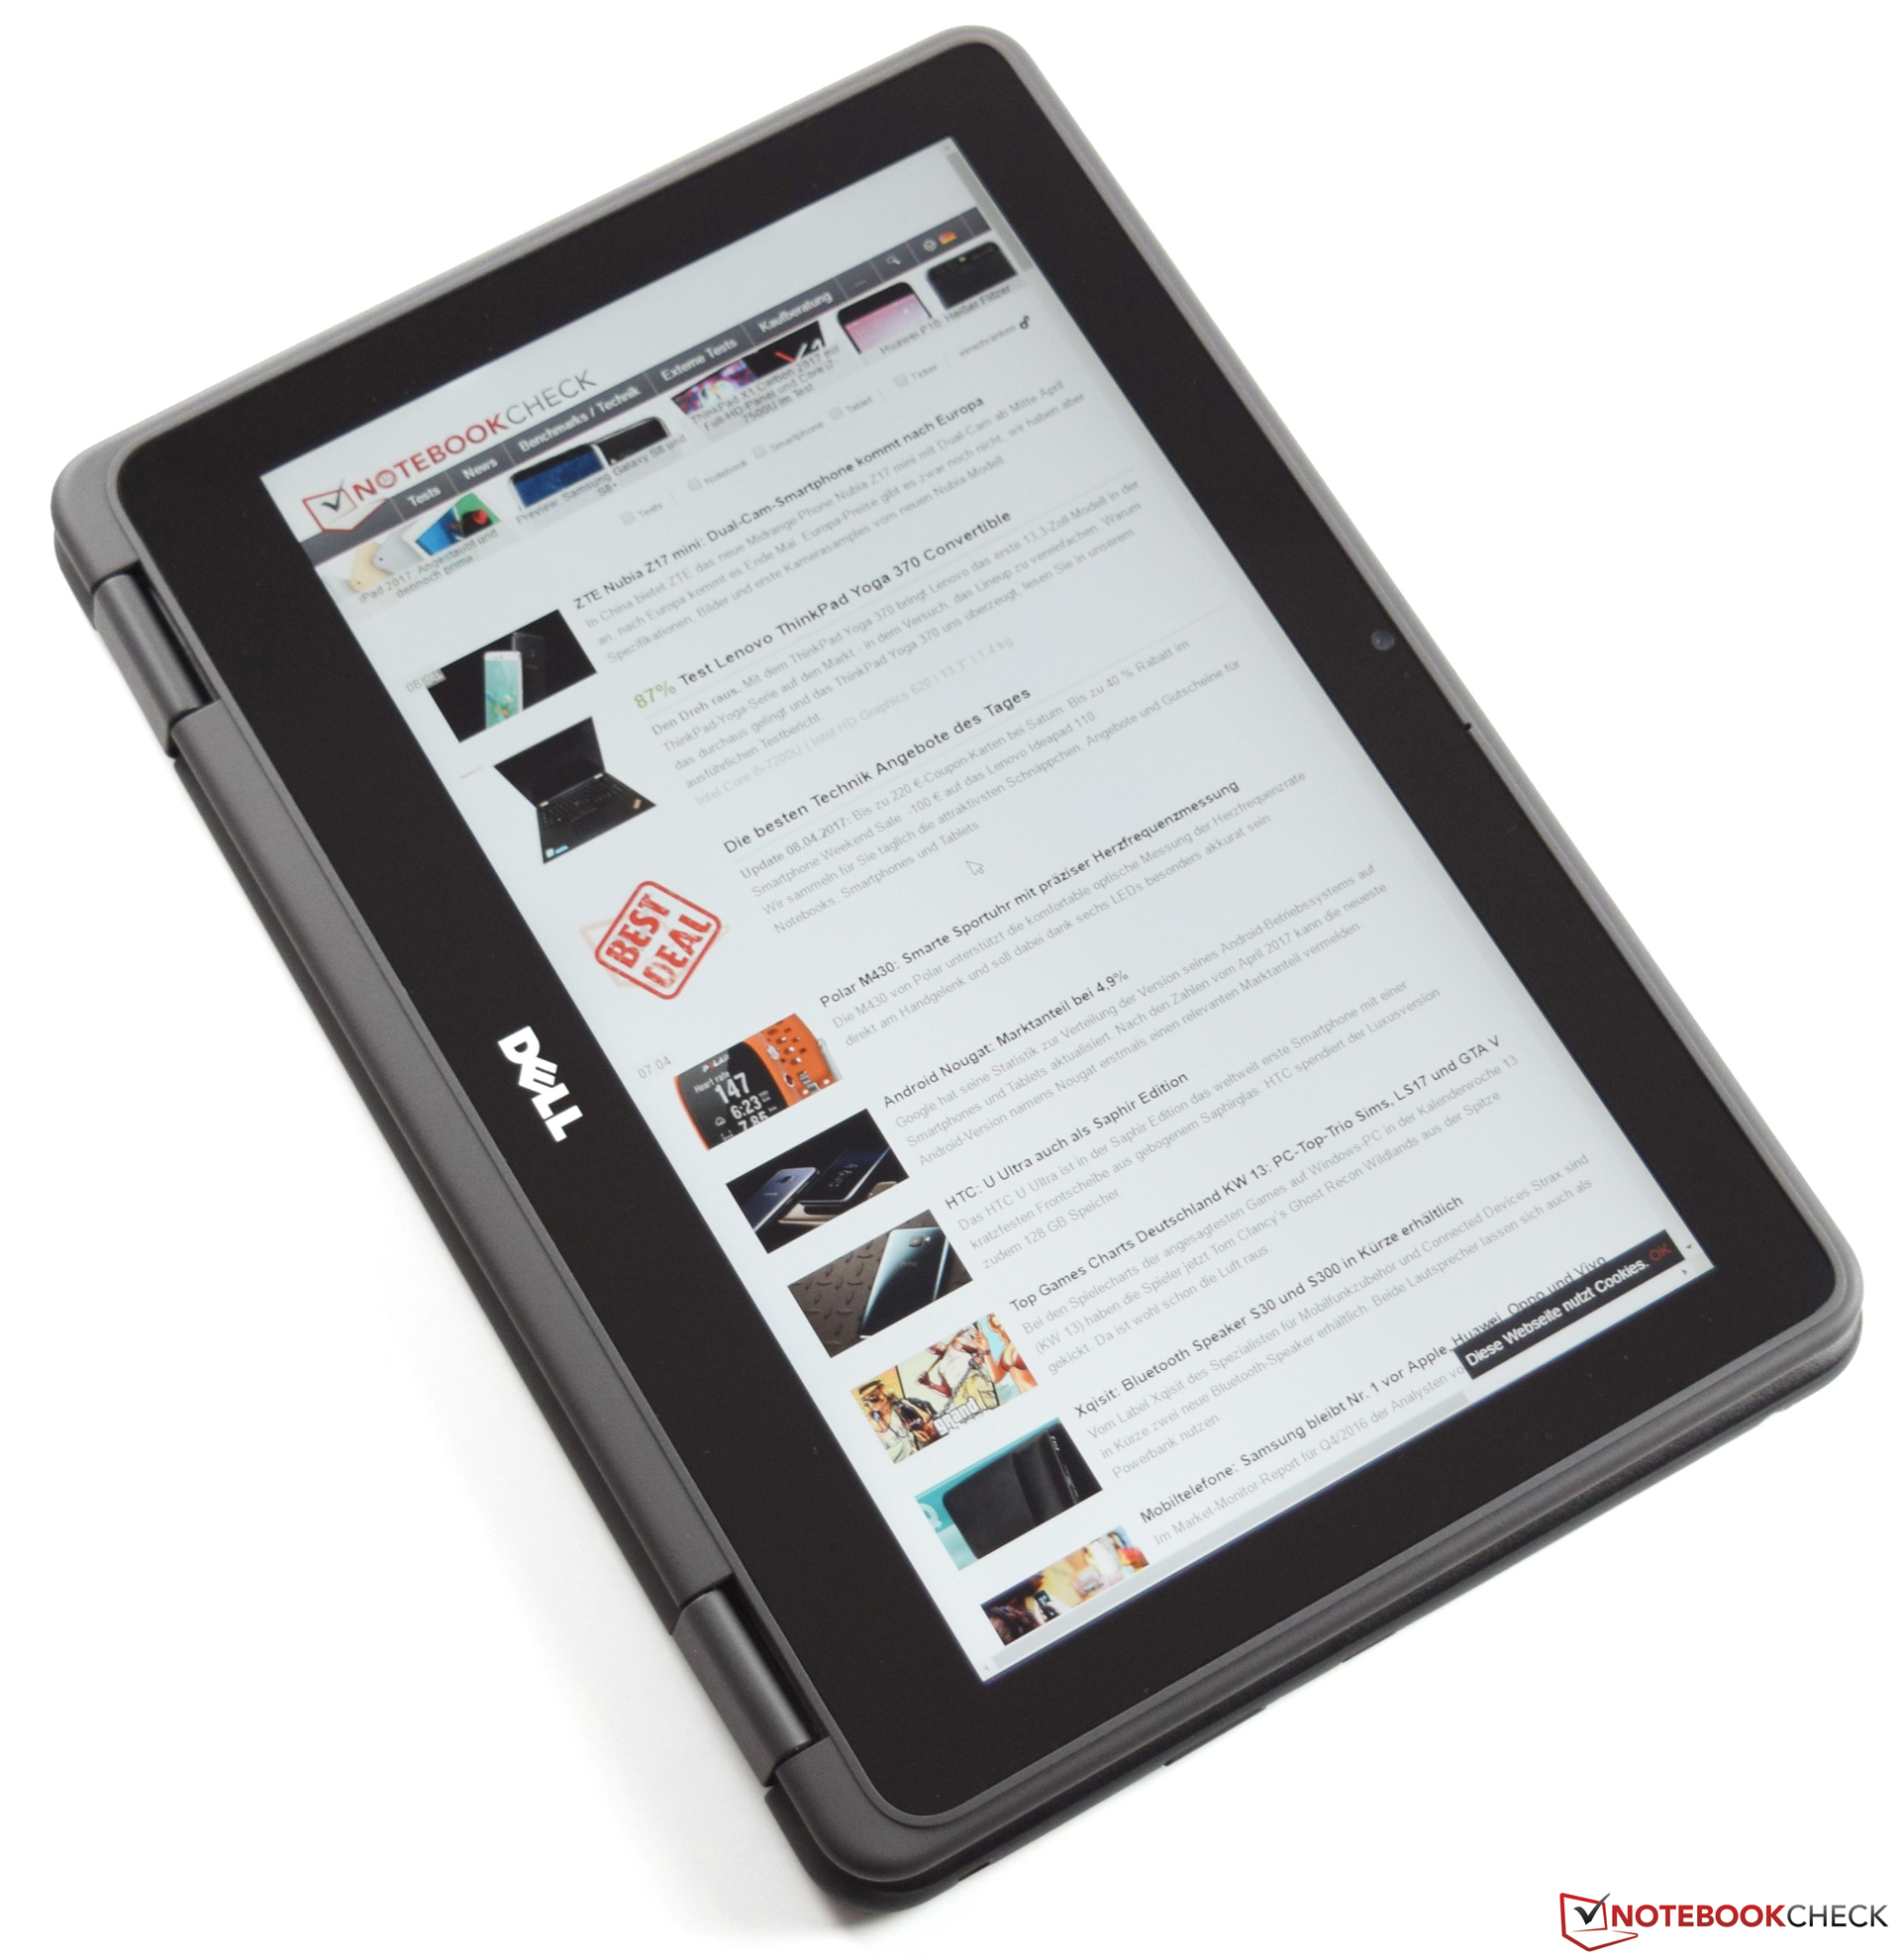
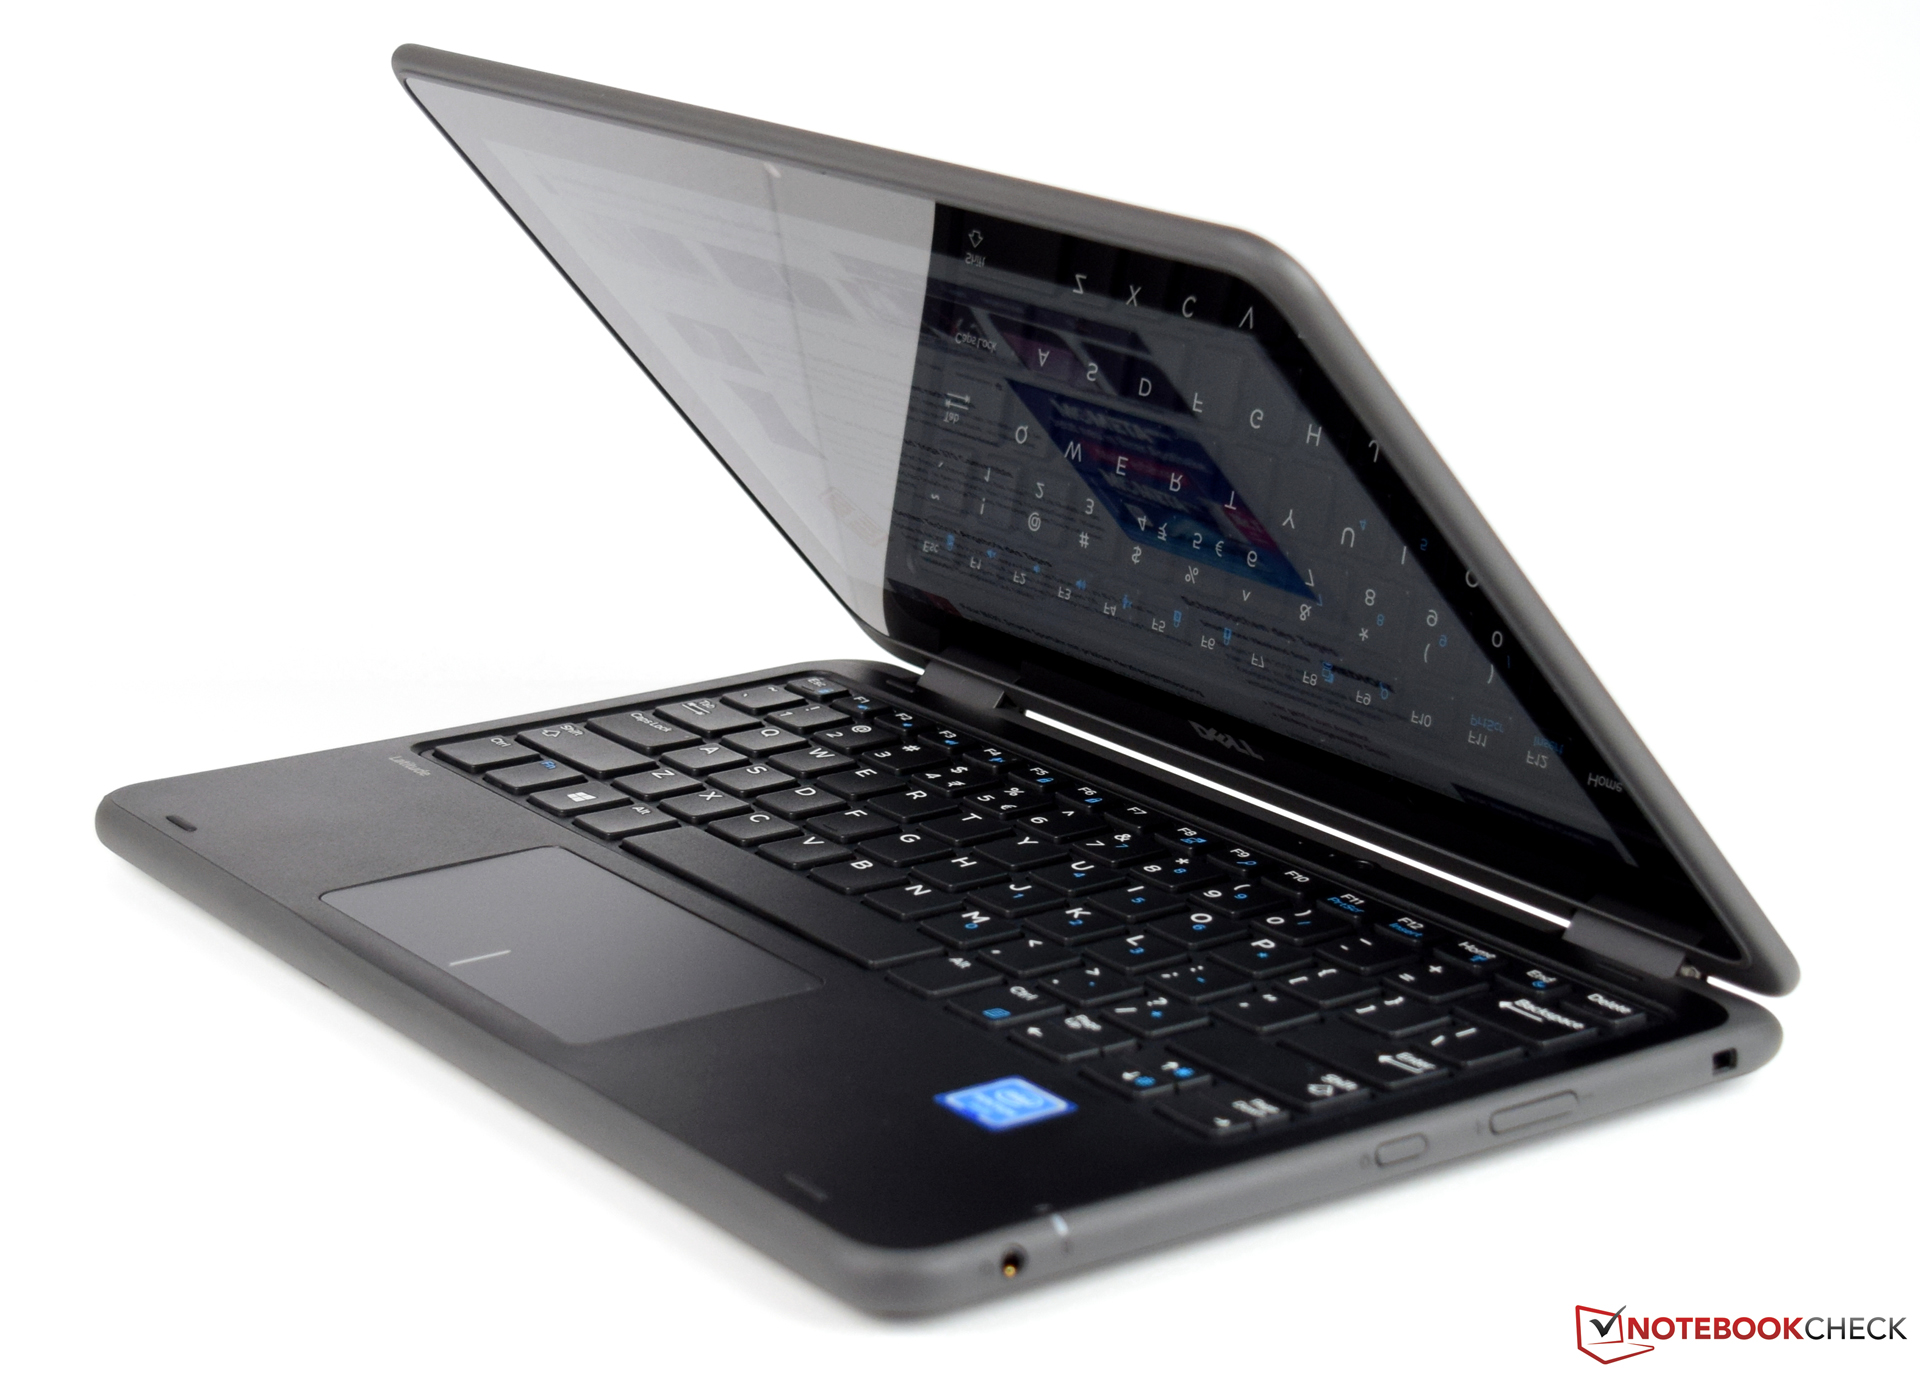
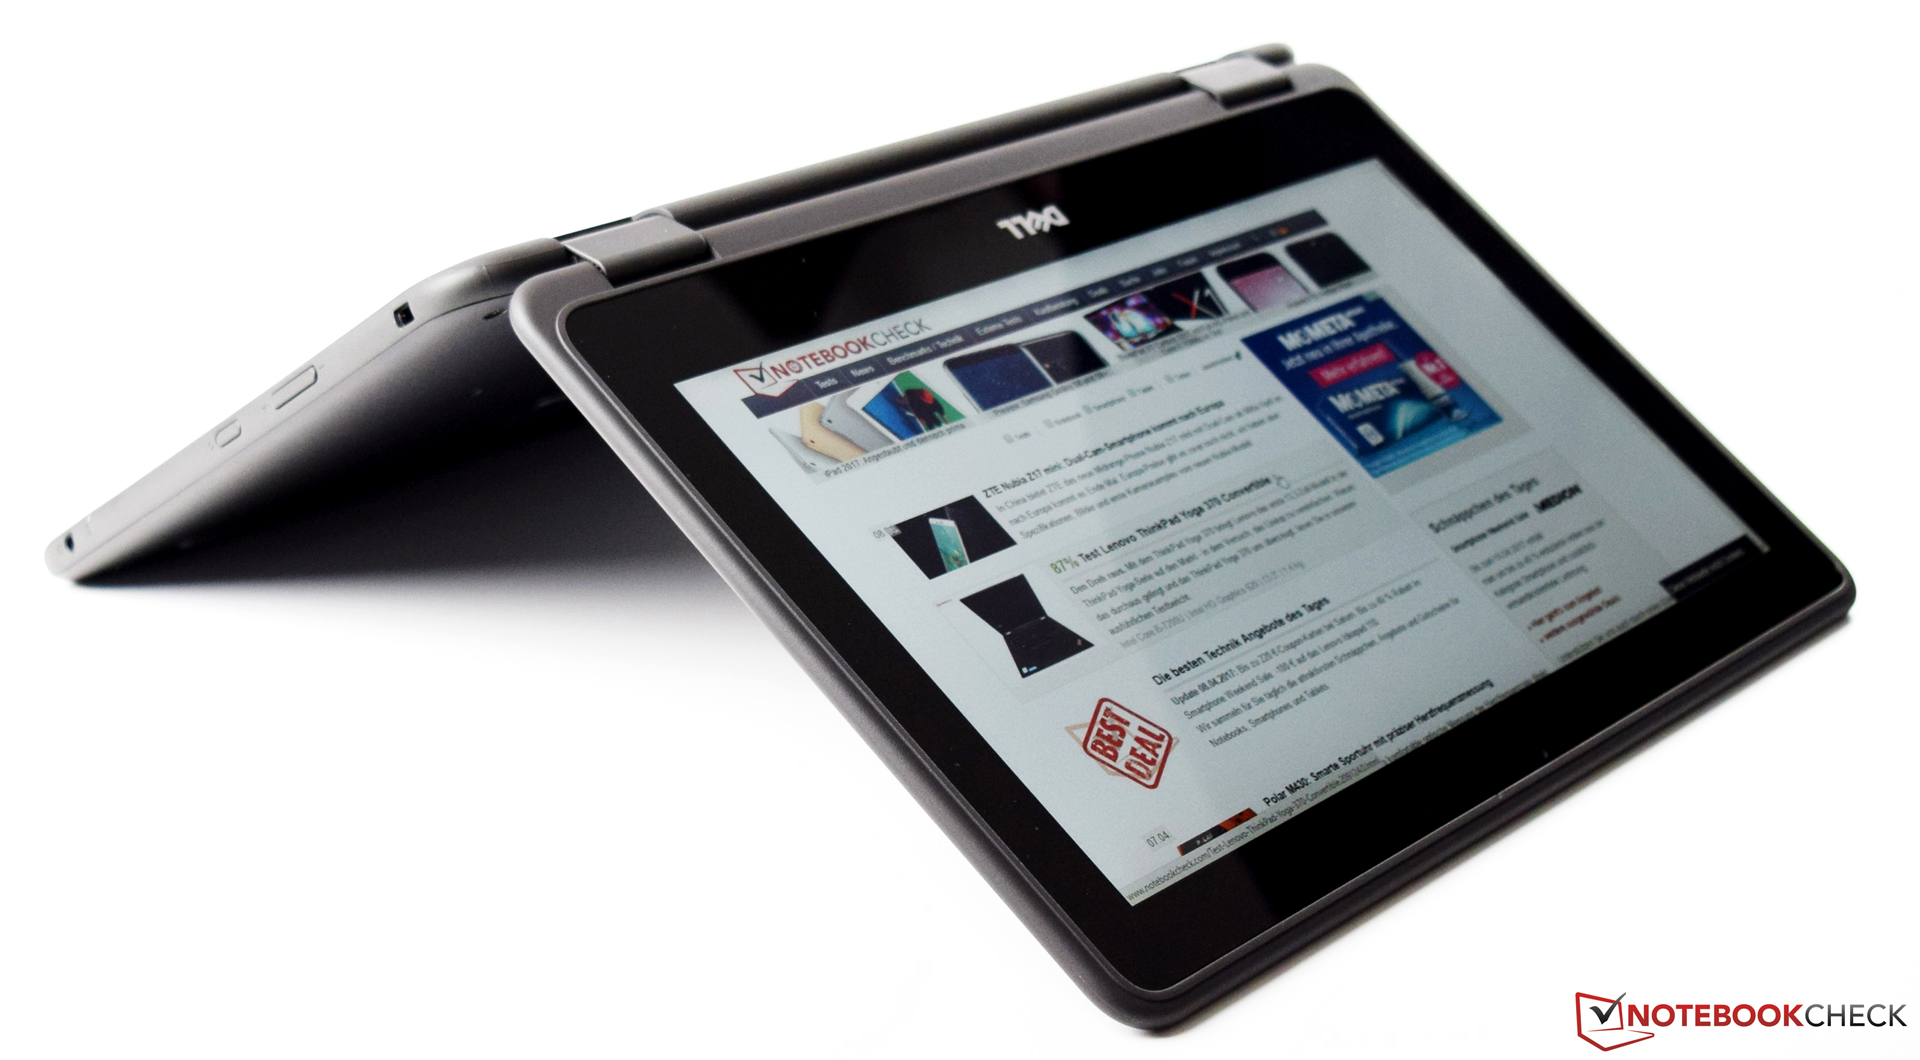
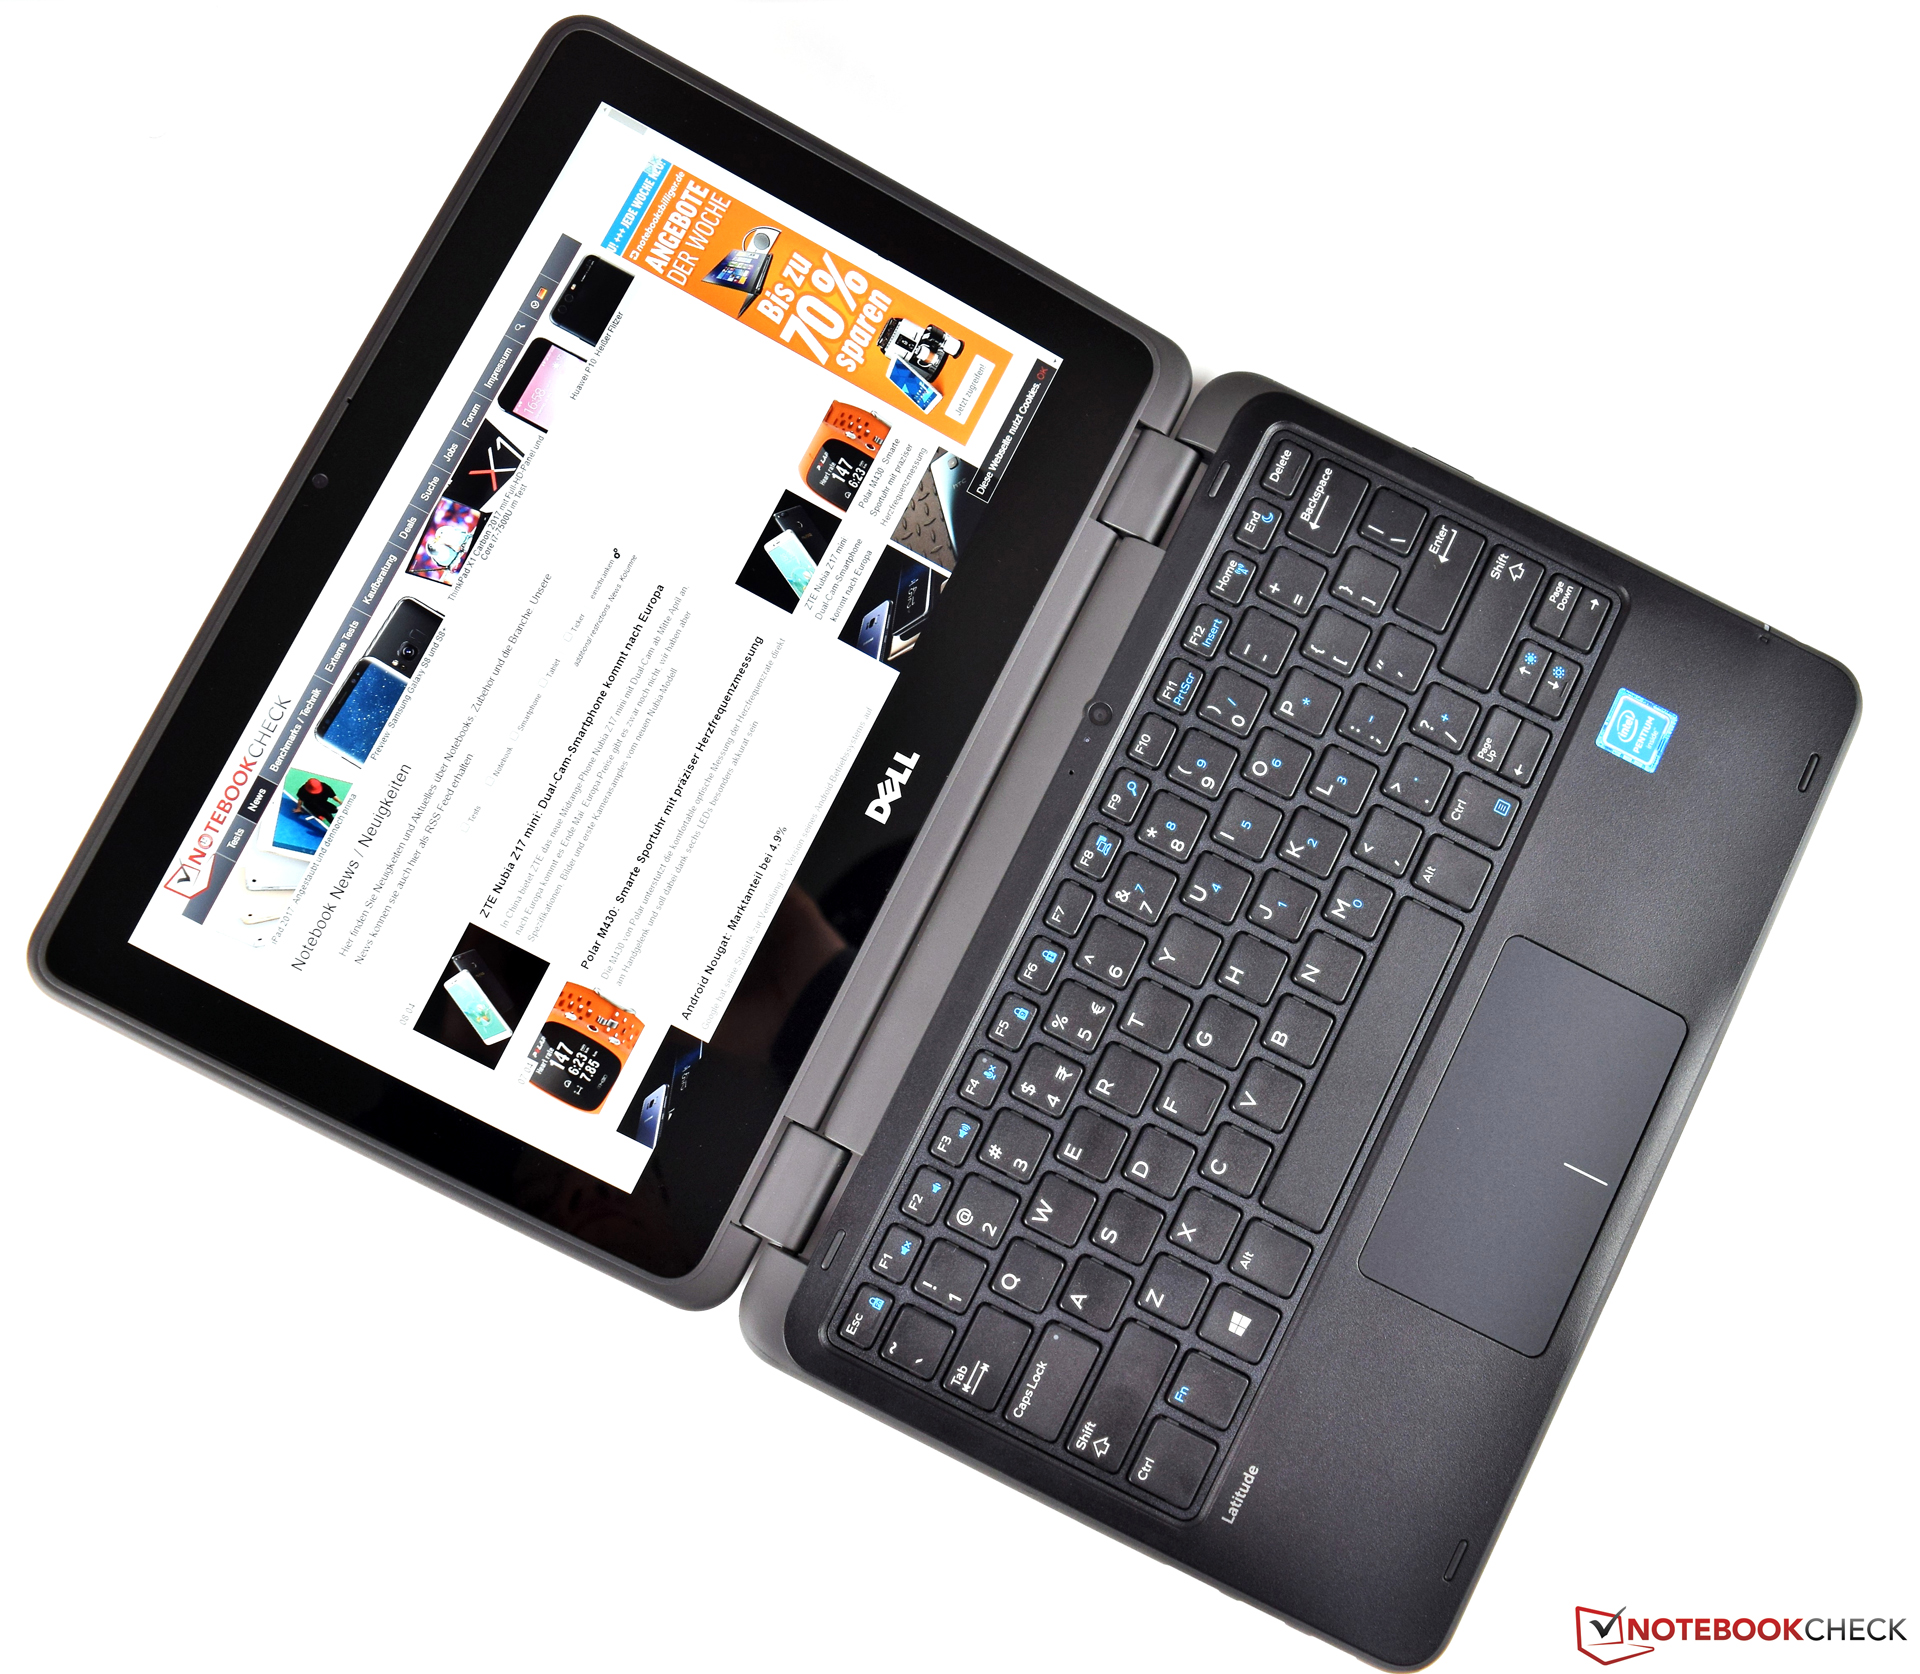
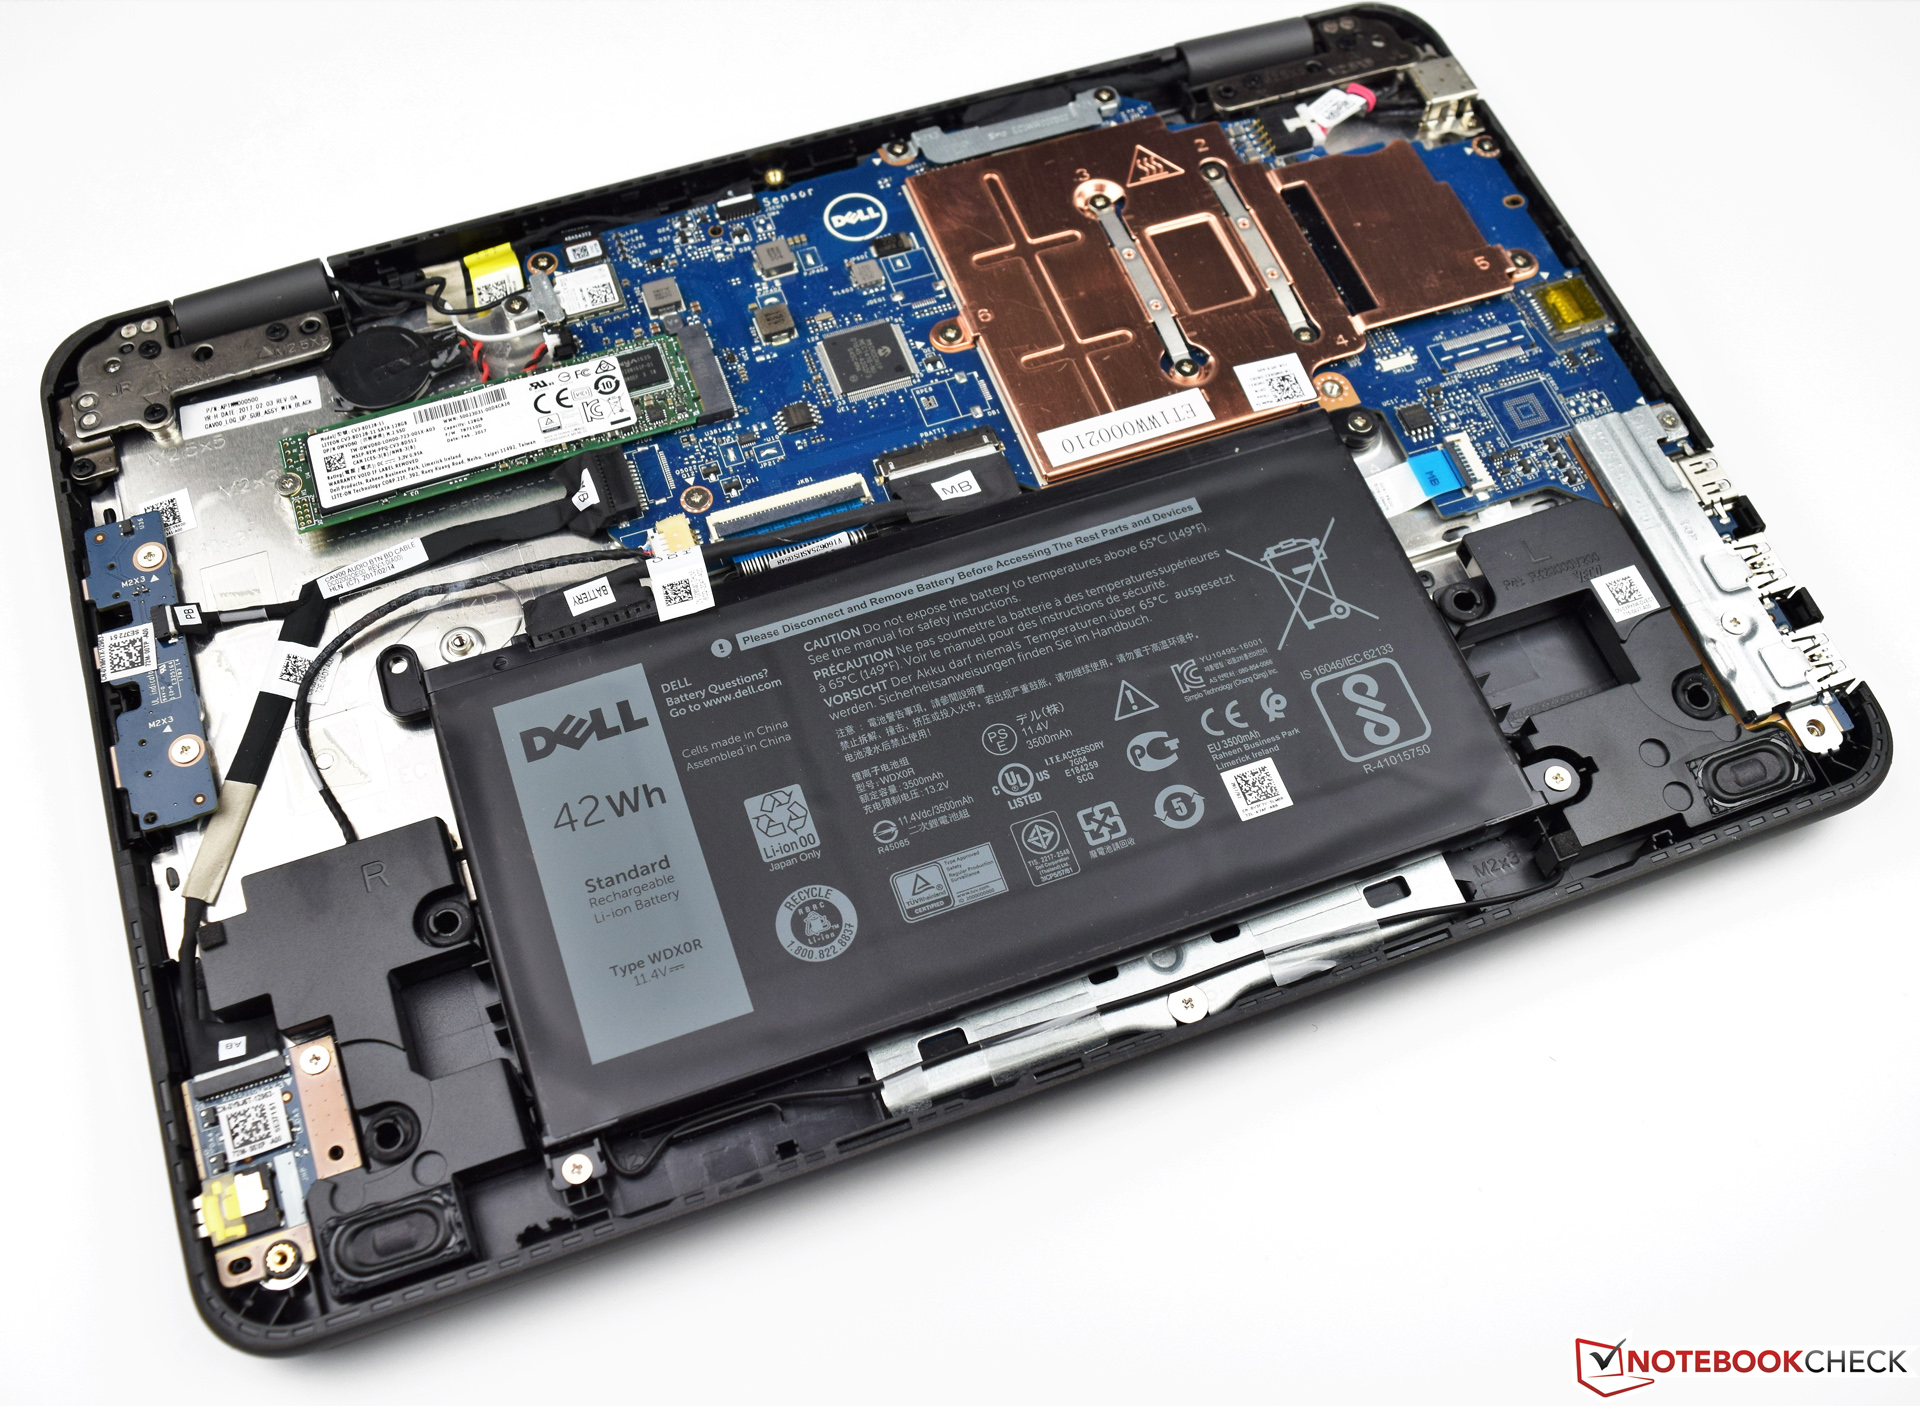
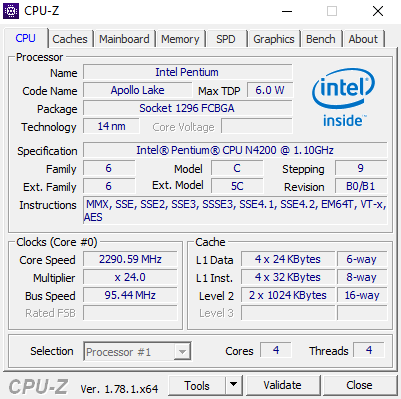
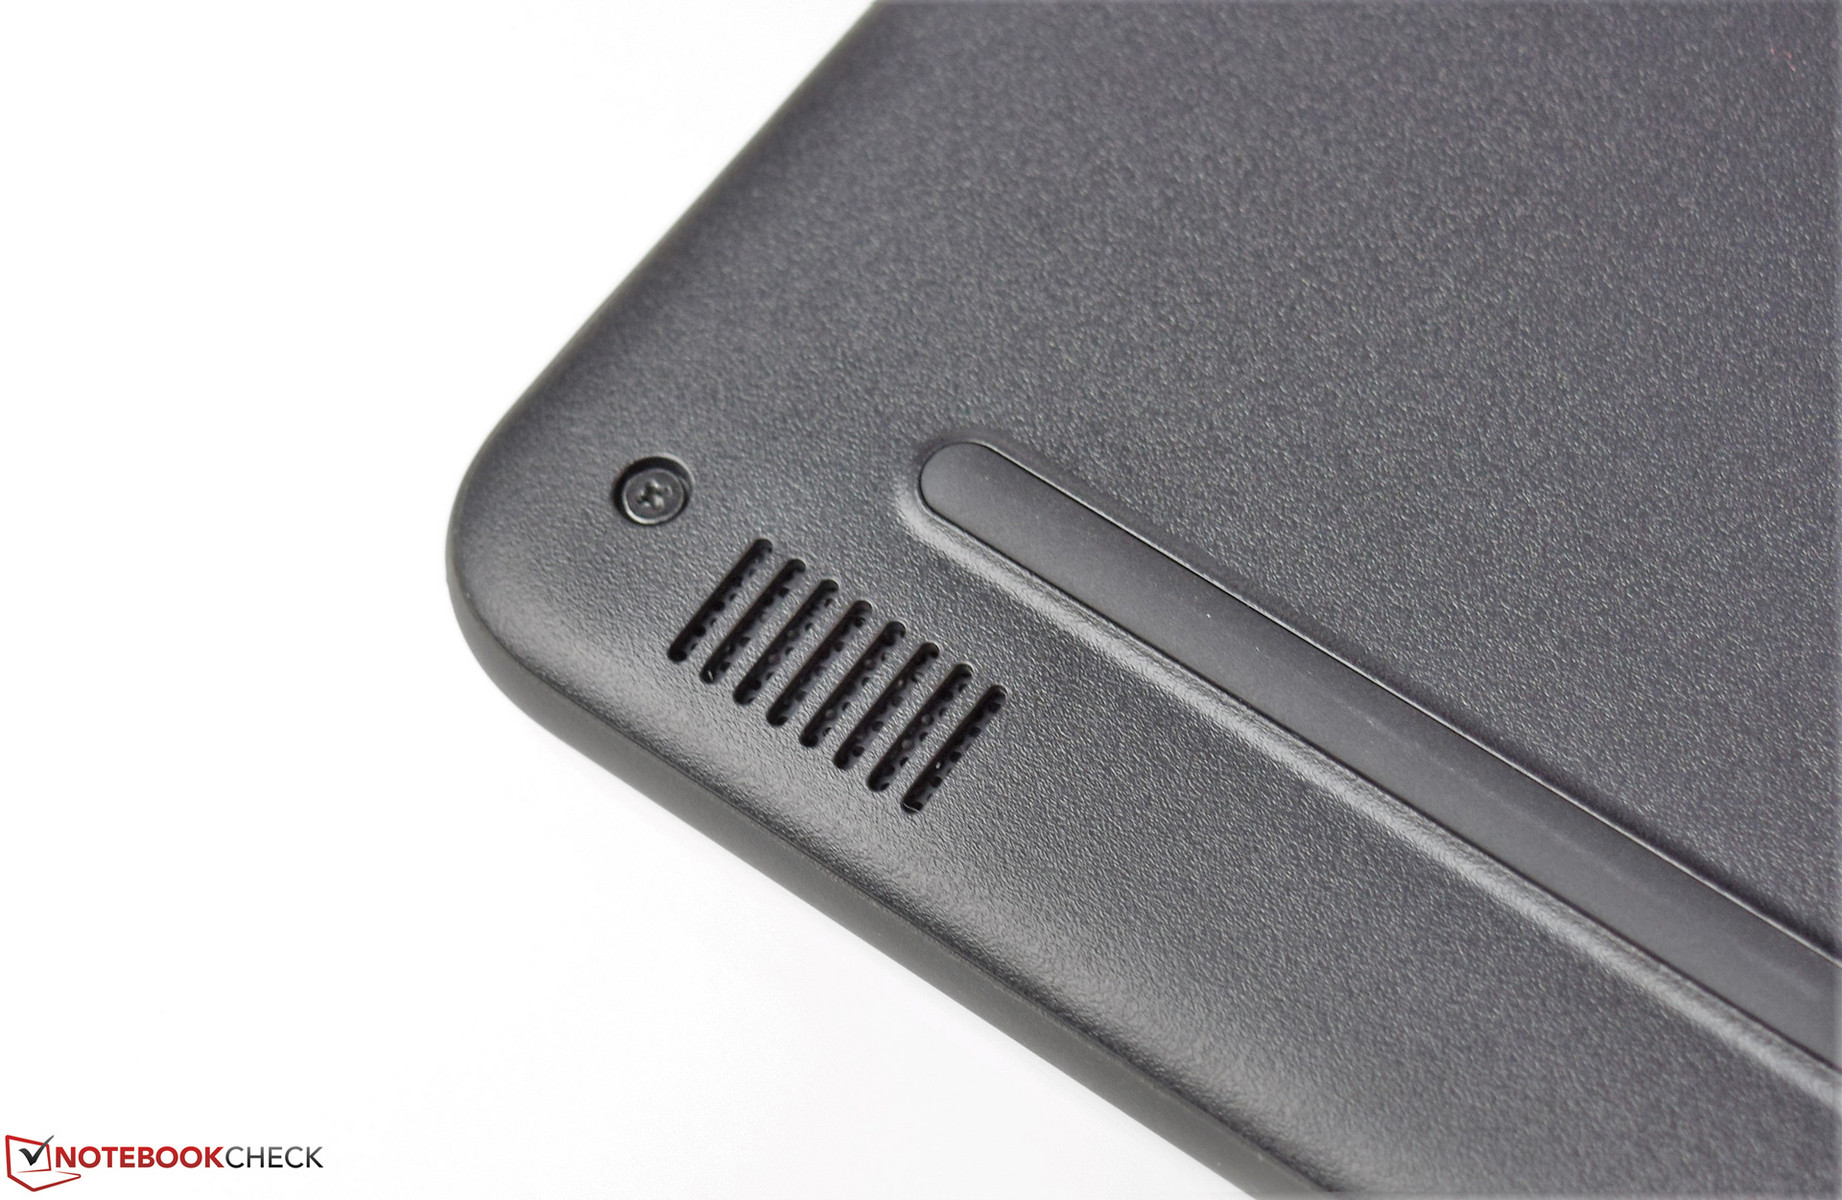
Dell ha realizzato il Latitude 3189 prevalentemente per il settore educativo. La base di questa scelta ha comportato la creazione di un design robusto. Ulteriori features come un touchscreen sono positive ed aggiungono valore al dispositivo. Questo rende il dispositivo anche molto versatile. L'Intel Pentium N4200, che si avvale di 4 GB di DDR3 RAM, è il massimo che il produttore ha da offrire in termini di prestazioni. Non raccomandiamo la configurazione alternativa con CPU Intel Celeron N3350. Il nostro modello di test, che non è il più economico con 799 Euro (~$857), è silenzioso, ma con un Intel Celeron N3350 (dual core processor), le performance sarebbero nettamente peggiori.
Il Dell Latitude 3189 è un dispositivo robusto, che aiuta gli studenti ad apprendere con i nuovi media. La base stabile si maneggia facilmente e la sua ottima autonomia, riesce a durare anche una giornata intera a scuola.
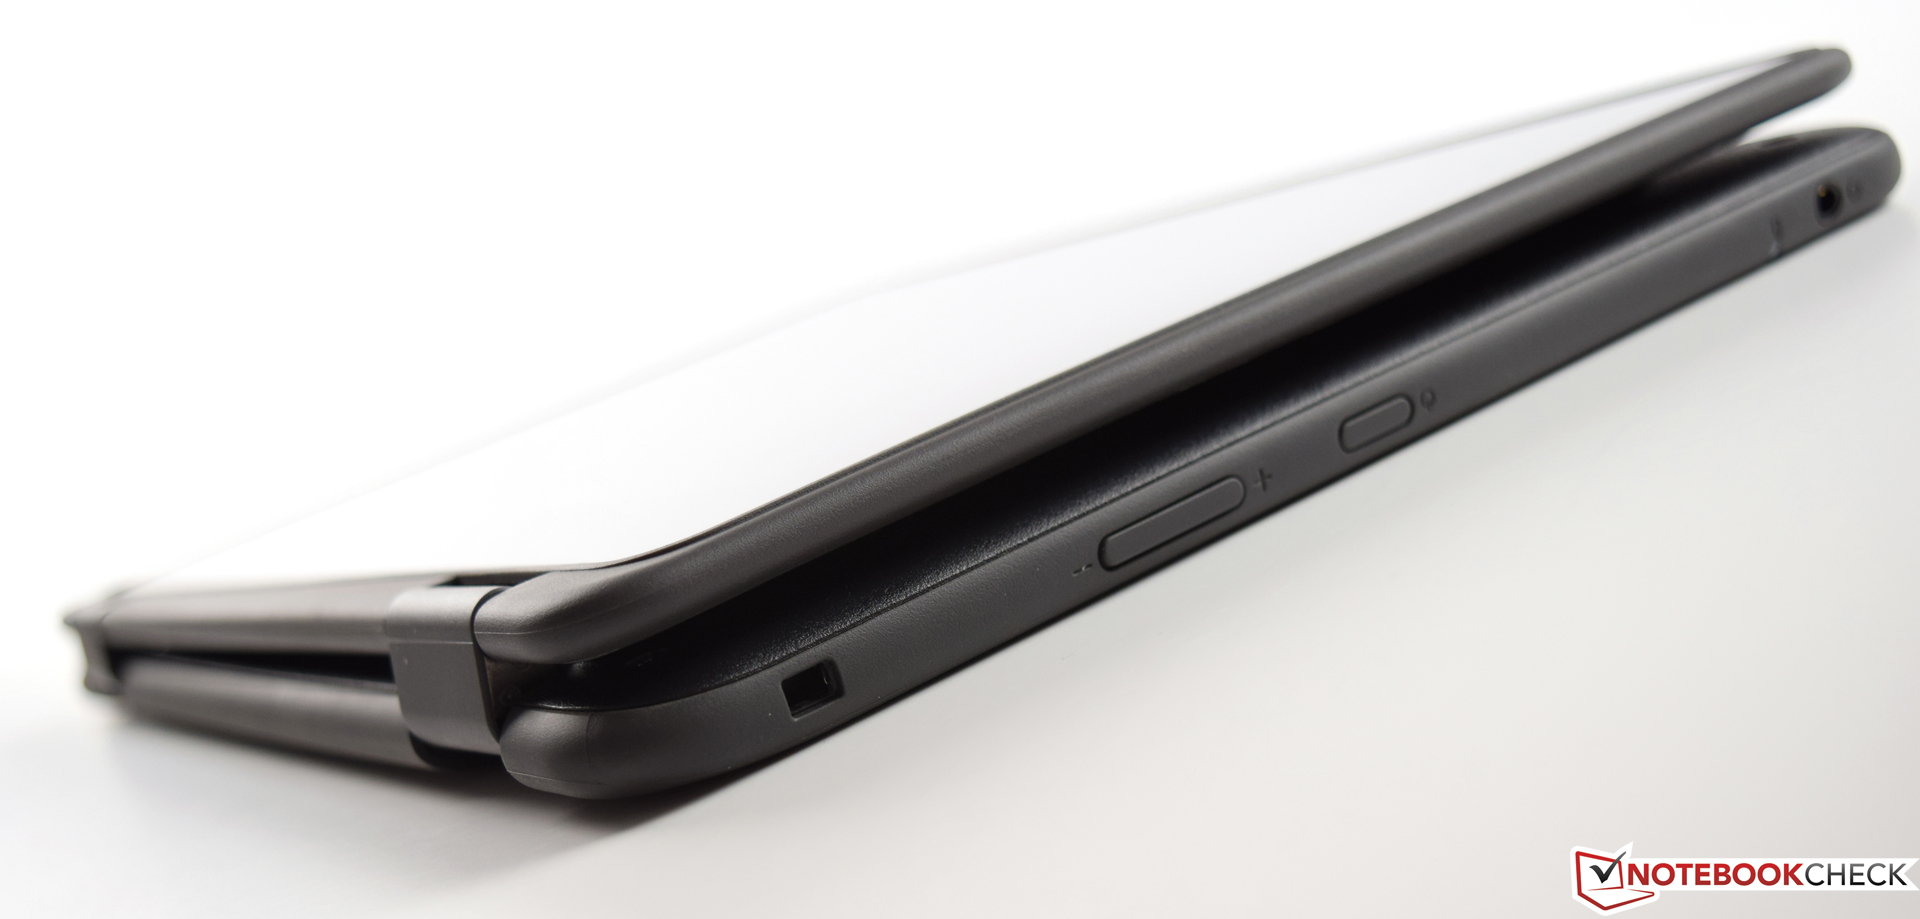
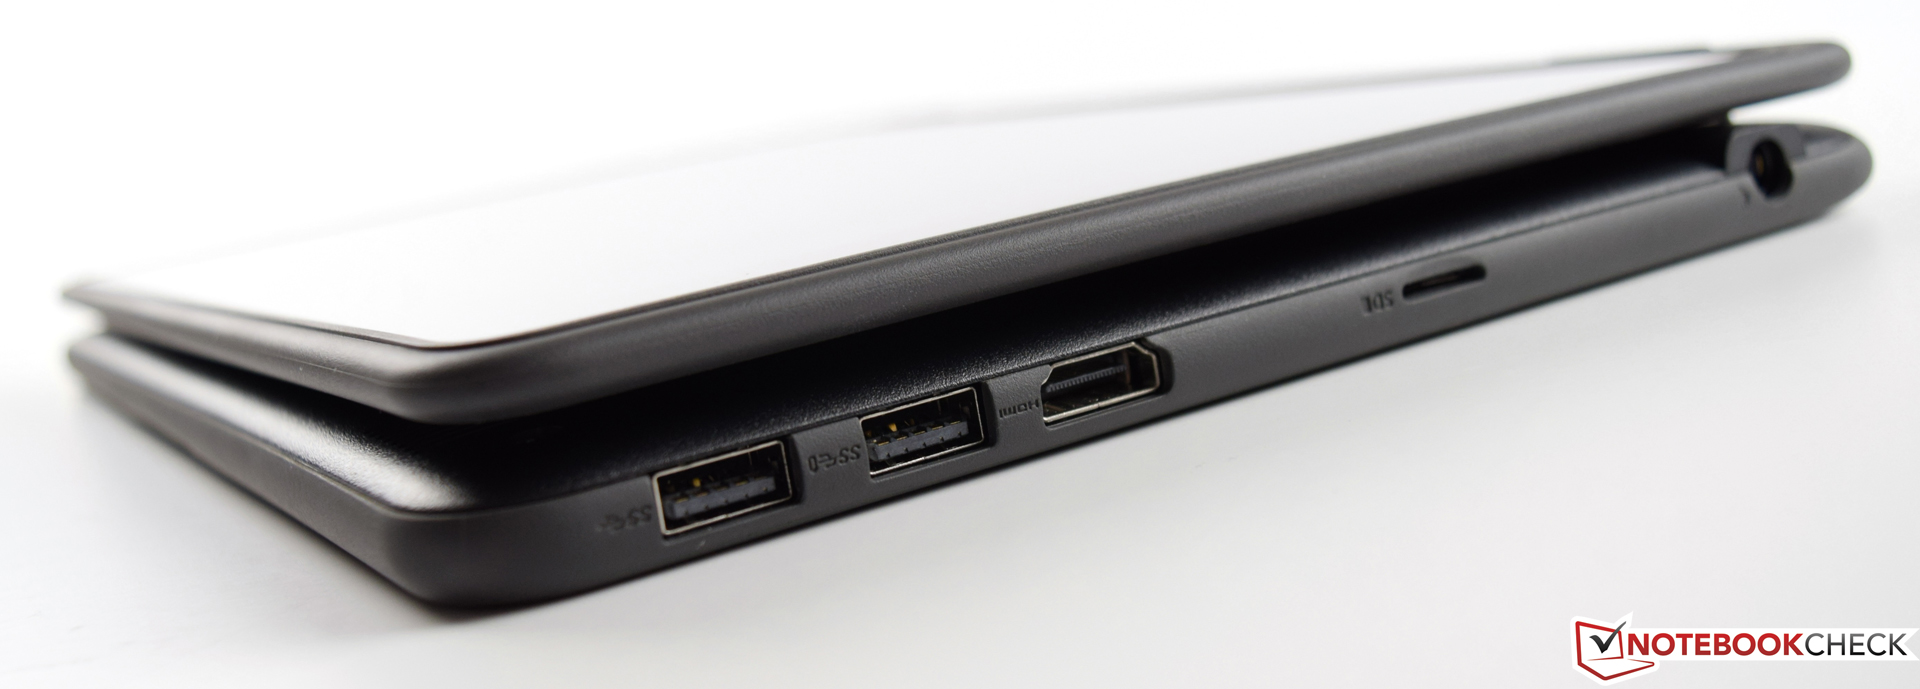
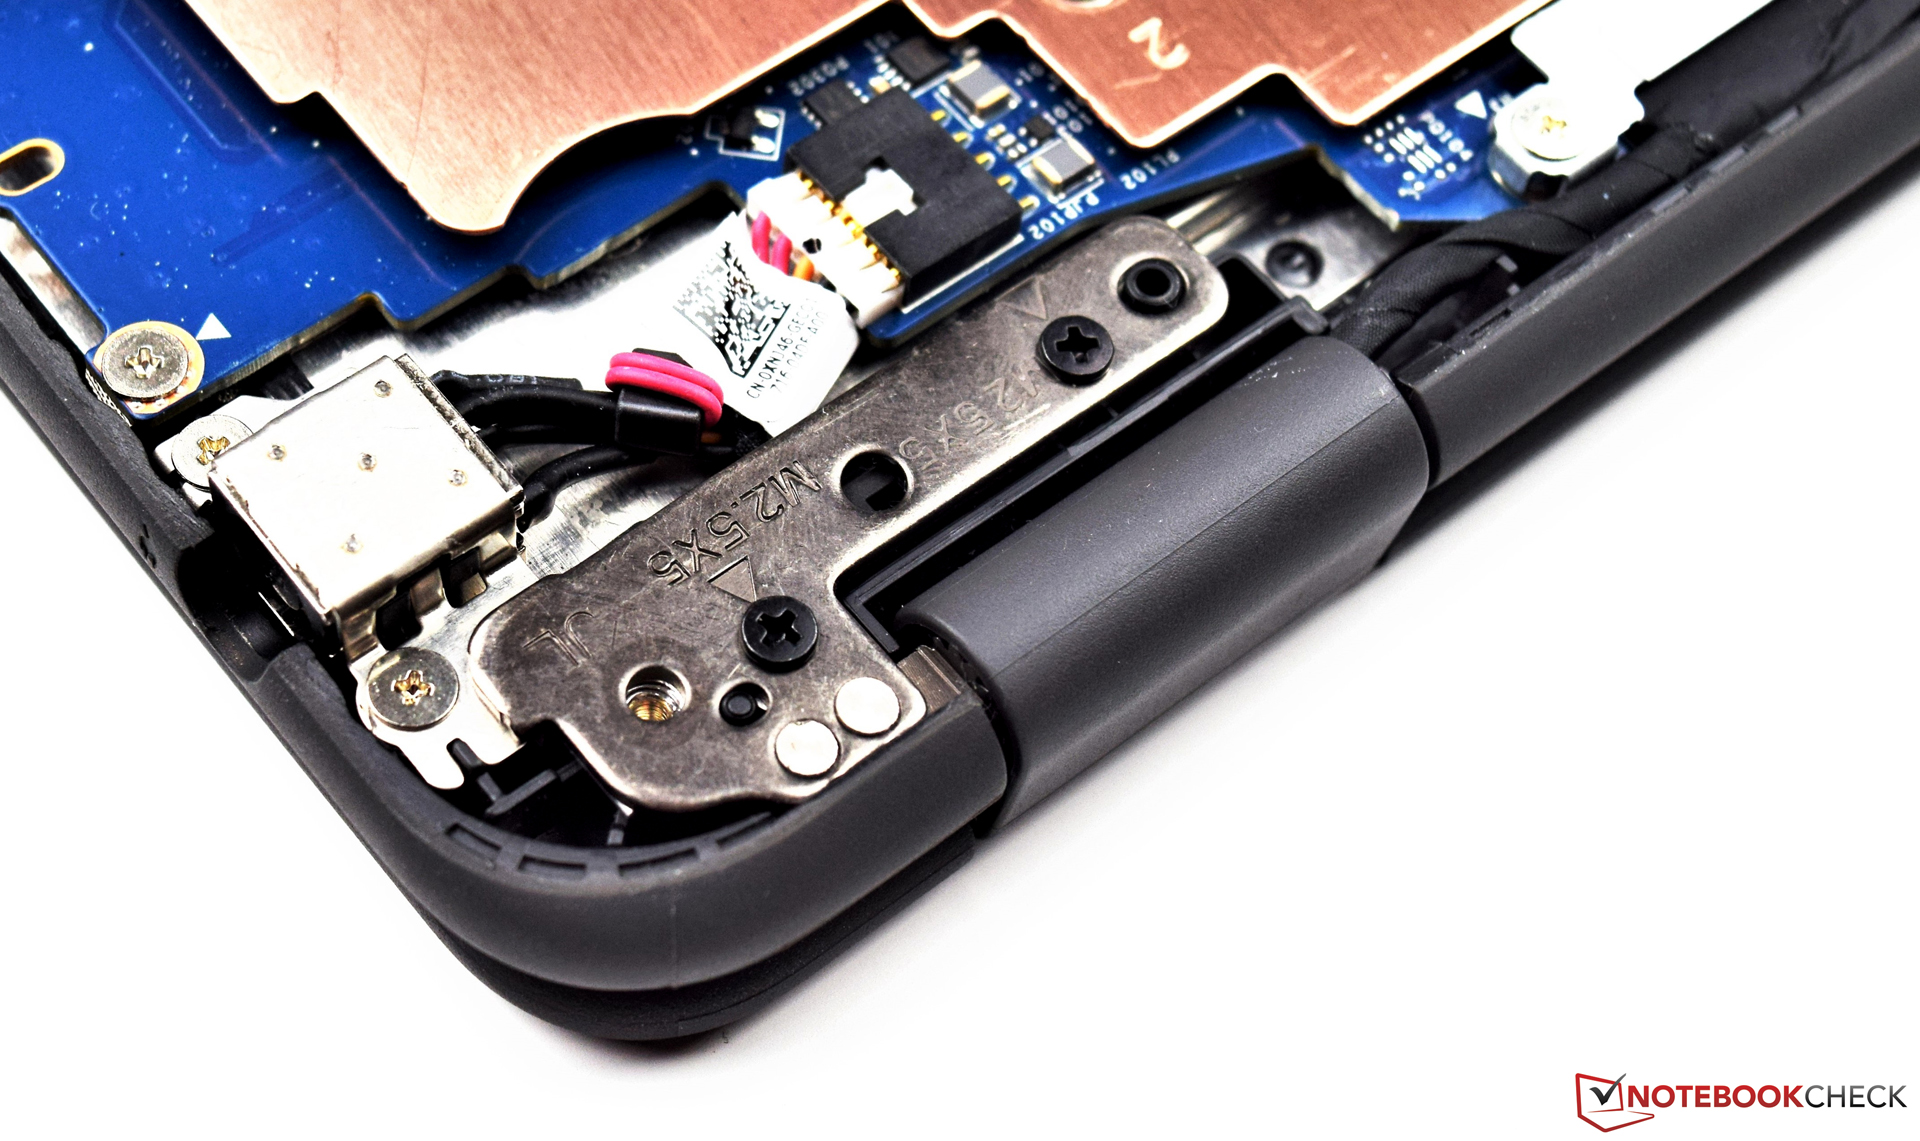
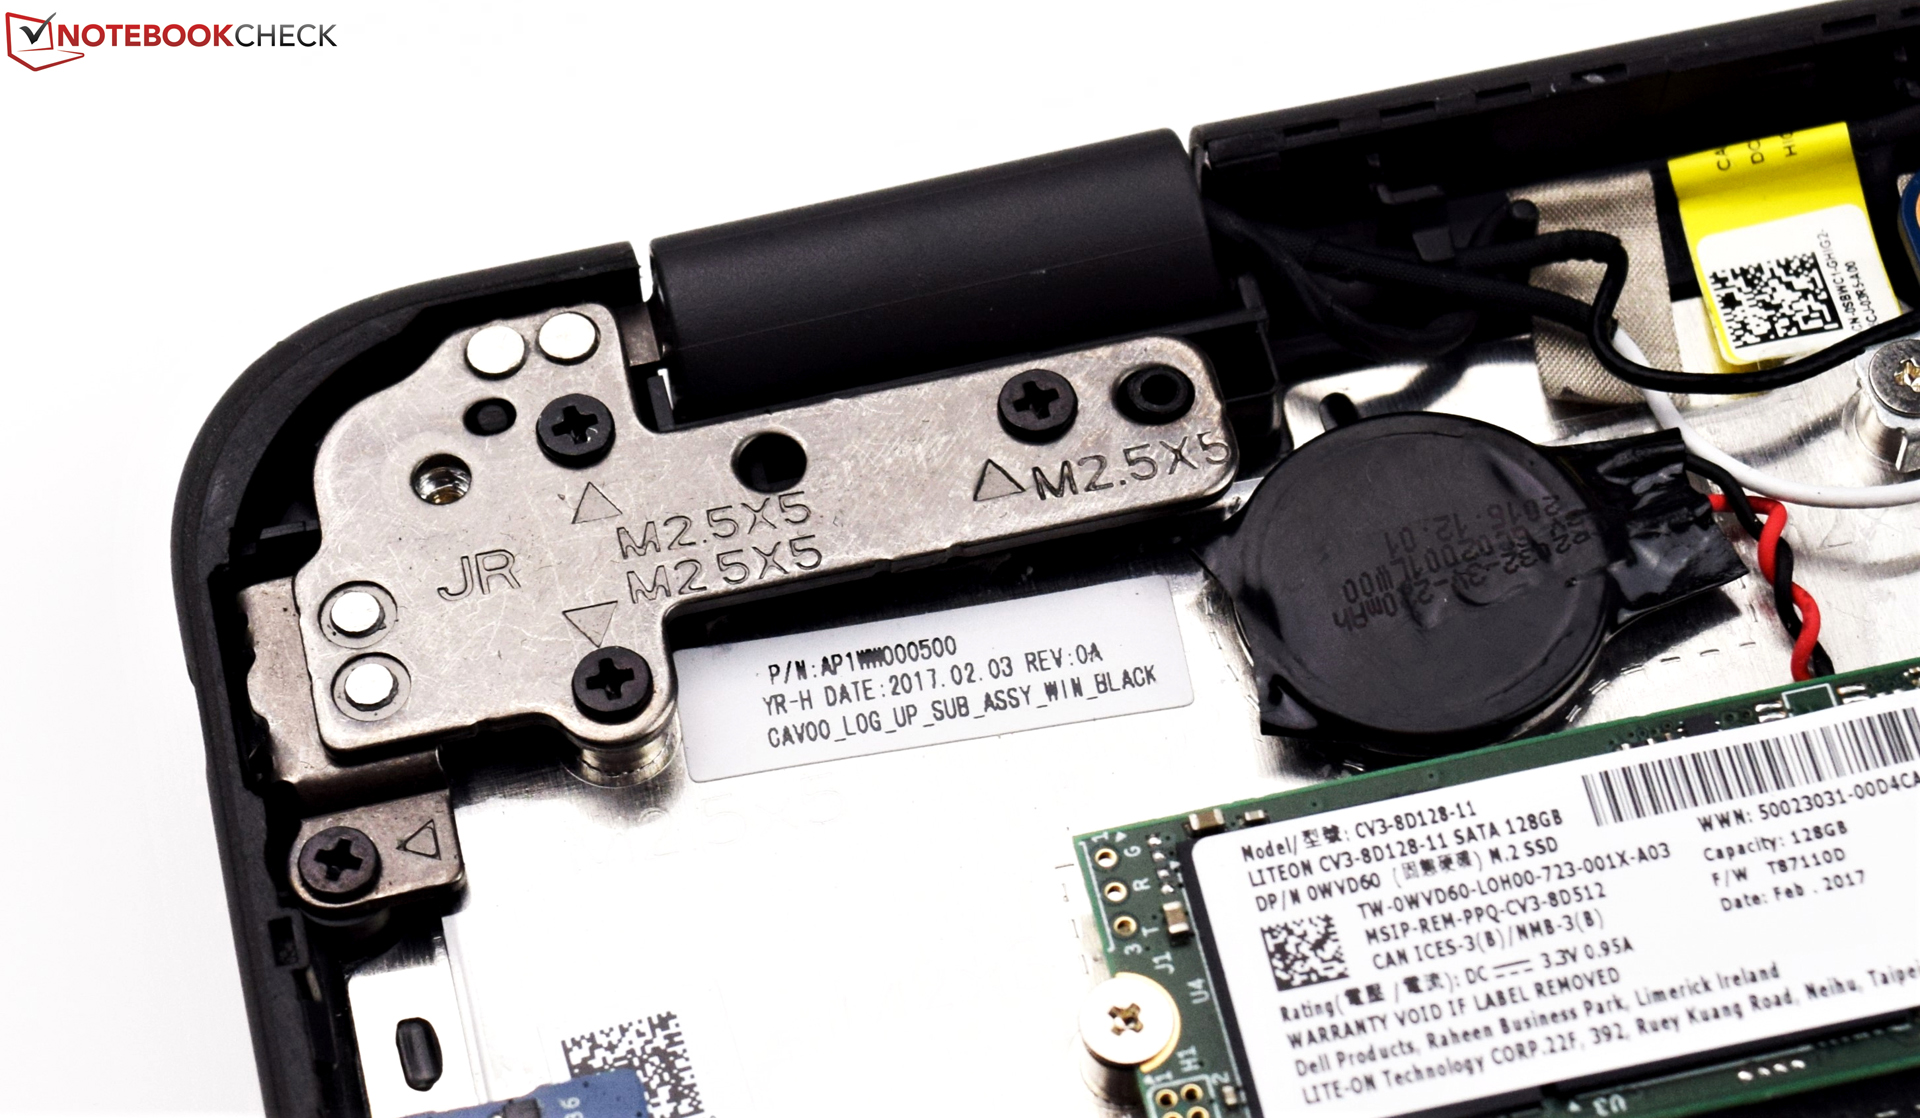
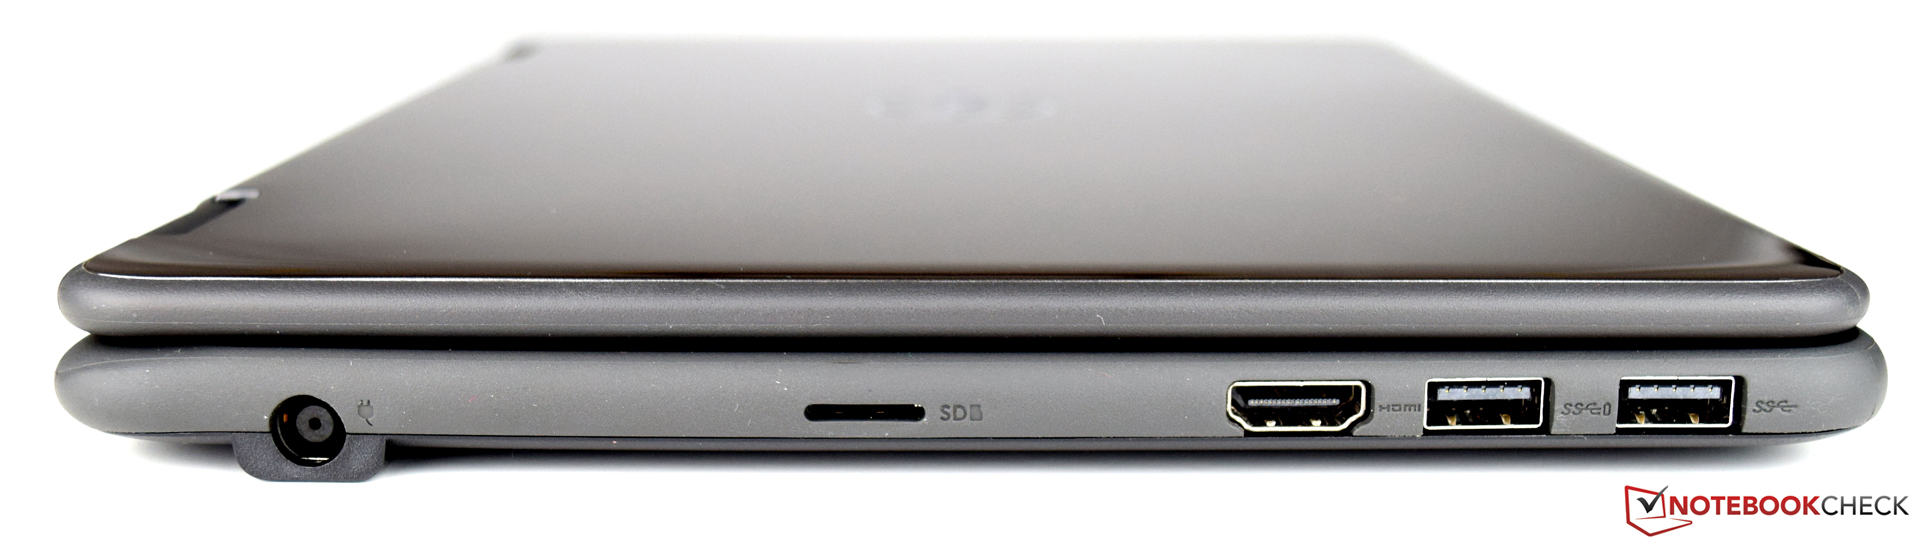
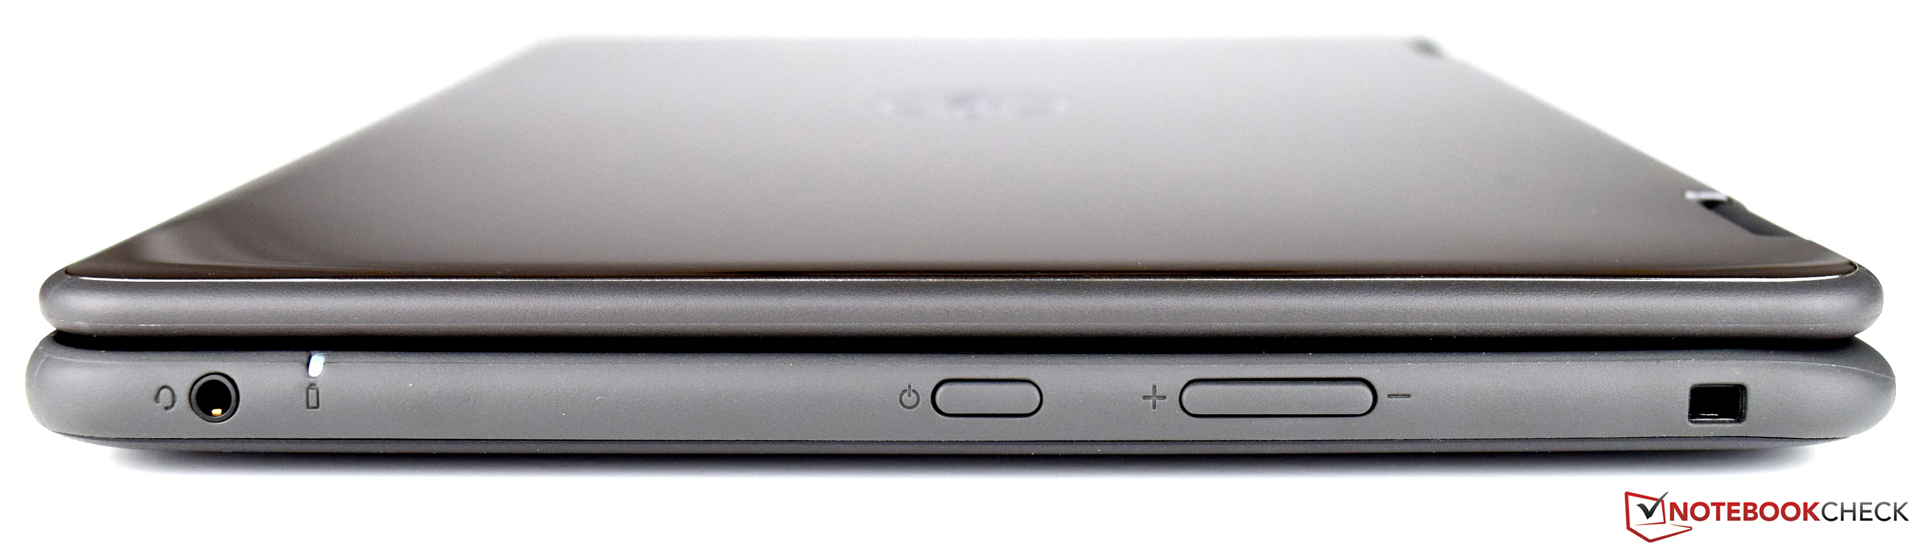
Abbiamo poche cose da criticare per il Dell Latitude 3189: ad esempio l'assenza di una porta USB Type-C, che serviva anche per il futuro, e il display molto riflettente, che potrebbe irritare e rendere difficile il lavoro in ambienti aperti. Il dispositivo di archiviazione ha vantaggi e svantaggi. Una volta che si installano sistema operativo ed alcuni programmi, non resta molto dei 128 GB. Nel complesso, possiamo dire che nonostante non sia eccezionale in alcune aree rispetto ad altri dispositivi, il Dell Latitude 3189 fa un buon lavoro. Le prestazioni di sistema soggettivamente sono nettamente migliori rispetto a quello che avevano mostrato i benchmarks.
Nota: si tratta di una recensione breve, con alcune sezioni non tradotte, per la versione integrale in inglese guardate qui.
Pro
Contro
Dell has aimed the Latitude 3189 mainly at the education sector. The basis for this has been established with its robust design. Additional features such as a touchscreen are good and add additional value to the device. This also makes the device a lot more versatile. The Intel Pentium N4200, which can rely on 4 GB of DDR3 RAM, is the maximum of what the manufacturer has to offer concerning performance. We would not recommend the alternative CPU configuration with the Intel Celeron N3350. Our test unit, which is not the cheapest at 799 Euros (~$857), runs quite well, but with an Intel Celeron N3350 (dual core processor), the performance would be significantly worse.
The Dell Latitude 3189 is a very robust device, which helps children learn how to handle the new media. The stable base unit can handle quite a lot and thanks to its great battery runtime, one battery charge easily lasts an entire day at school.
We have got a few things to criticize about the Dell Latitude 3189: for example the missing USB Type-C port, which would secure the device's future, and the very reflective display, which can be irritating and make it difficult to work in light spaces. The storage device has advantages and disadvantages. Once the operating system and some programs are installed, not much is left of the 128 GB storage capacity. Overall, we can say that despite it not doing so well in some areas compared with the other test units, the Dell Latitude 3189 does a solid job. The subjective system performance was definitely better than the results the benchmarks showed.
Dell Latitude 3189
- 04/25/2017 v6 (old)
Sebastian Bade