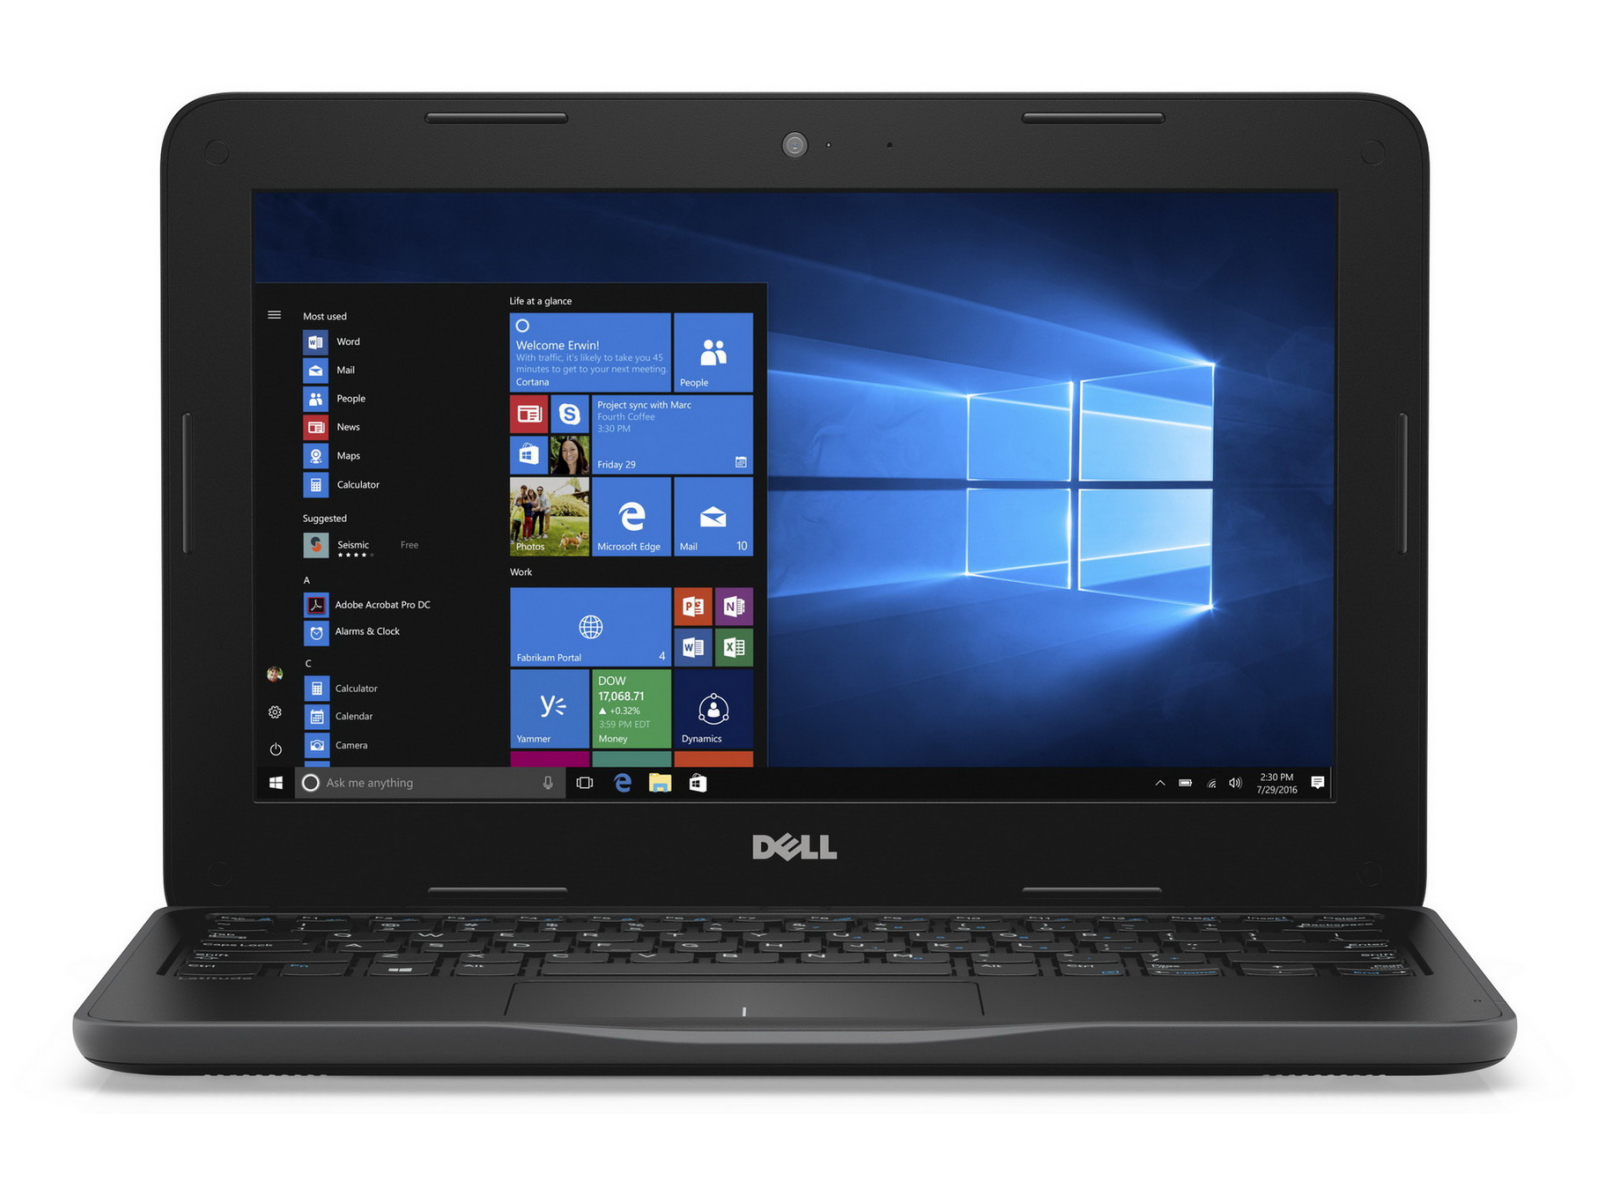
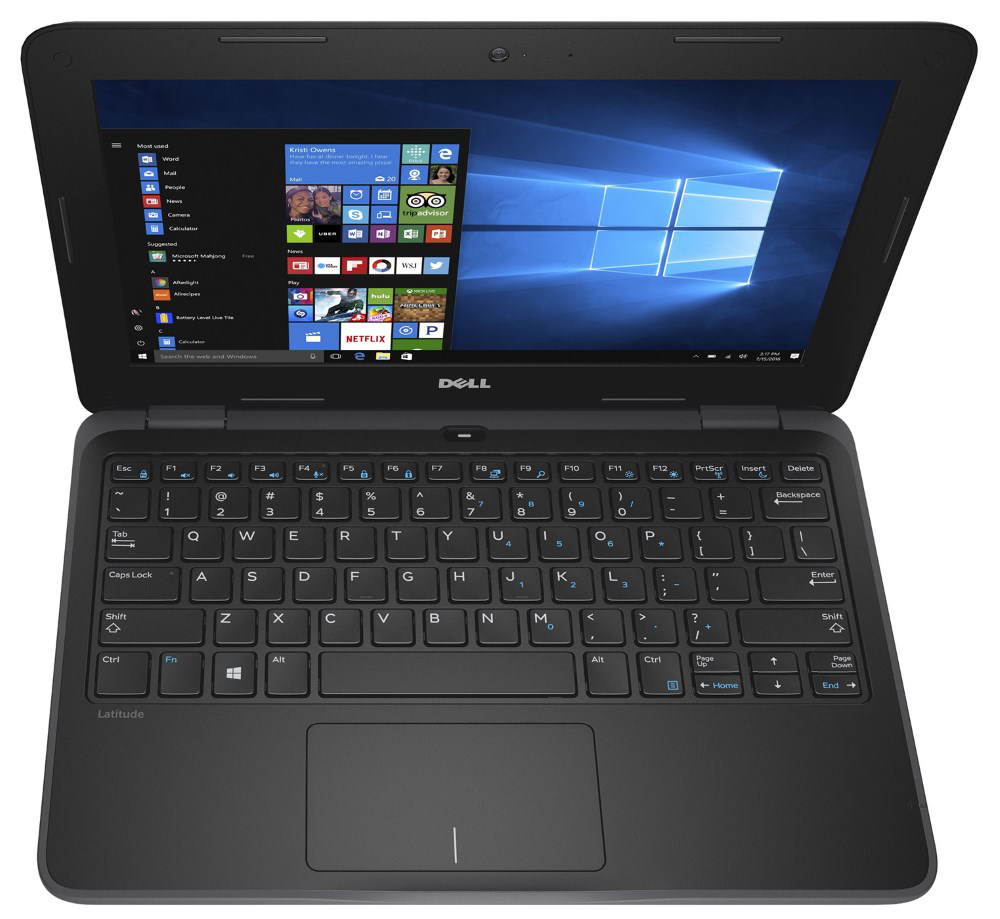
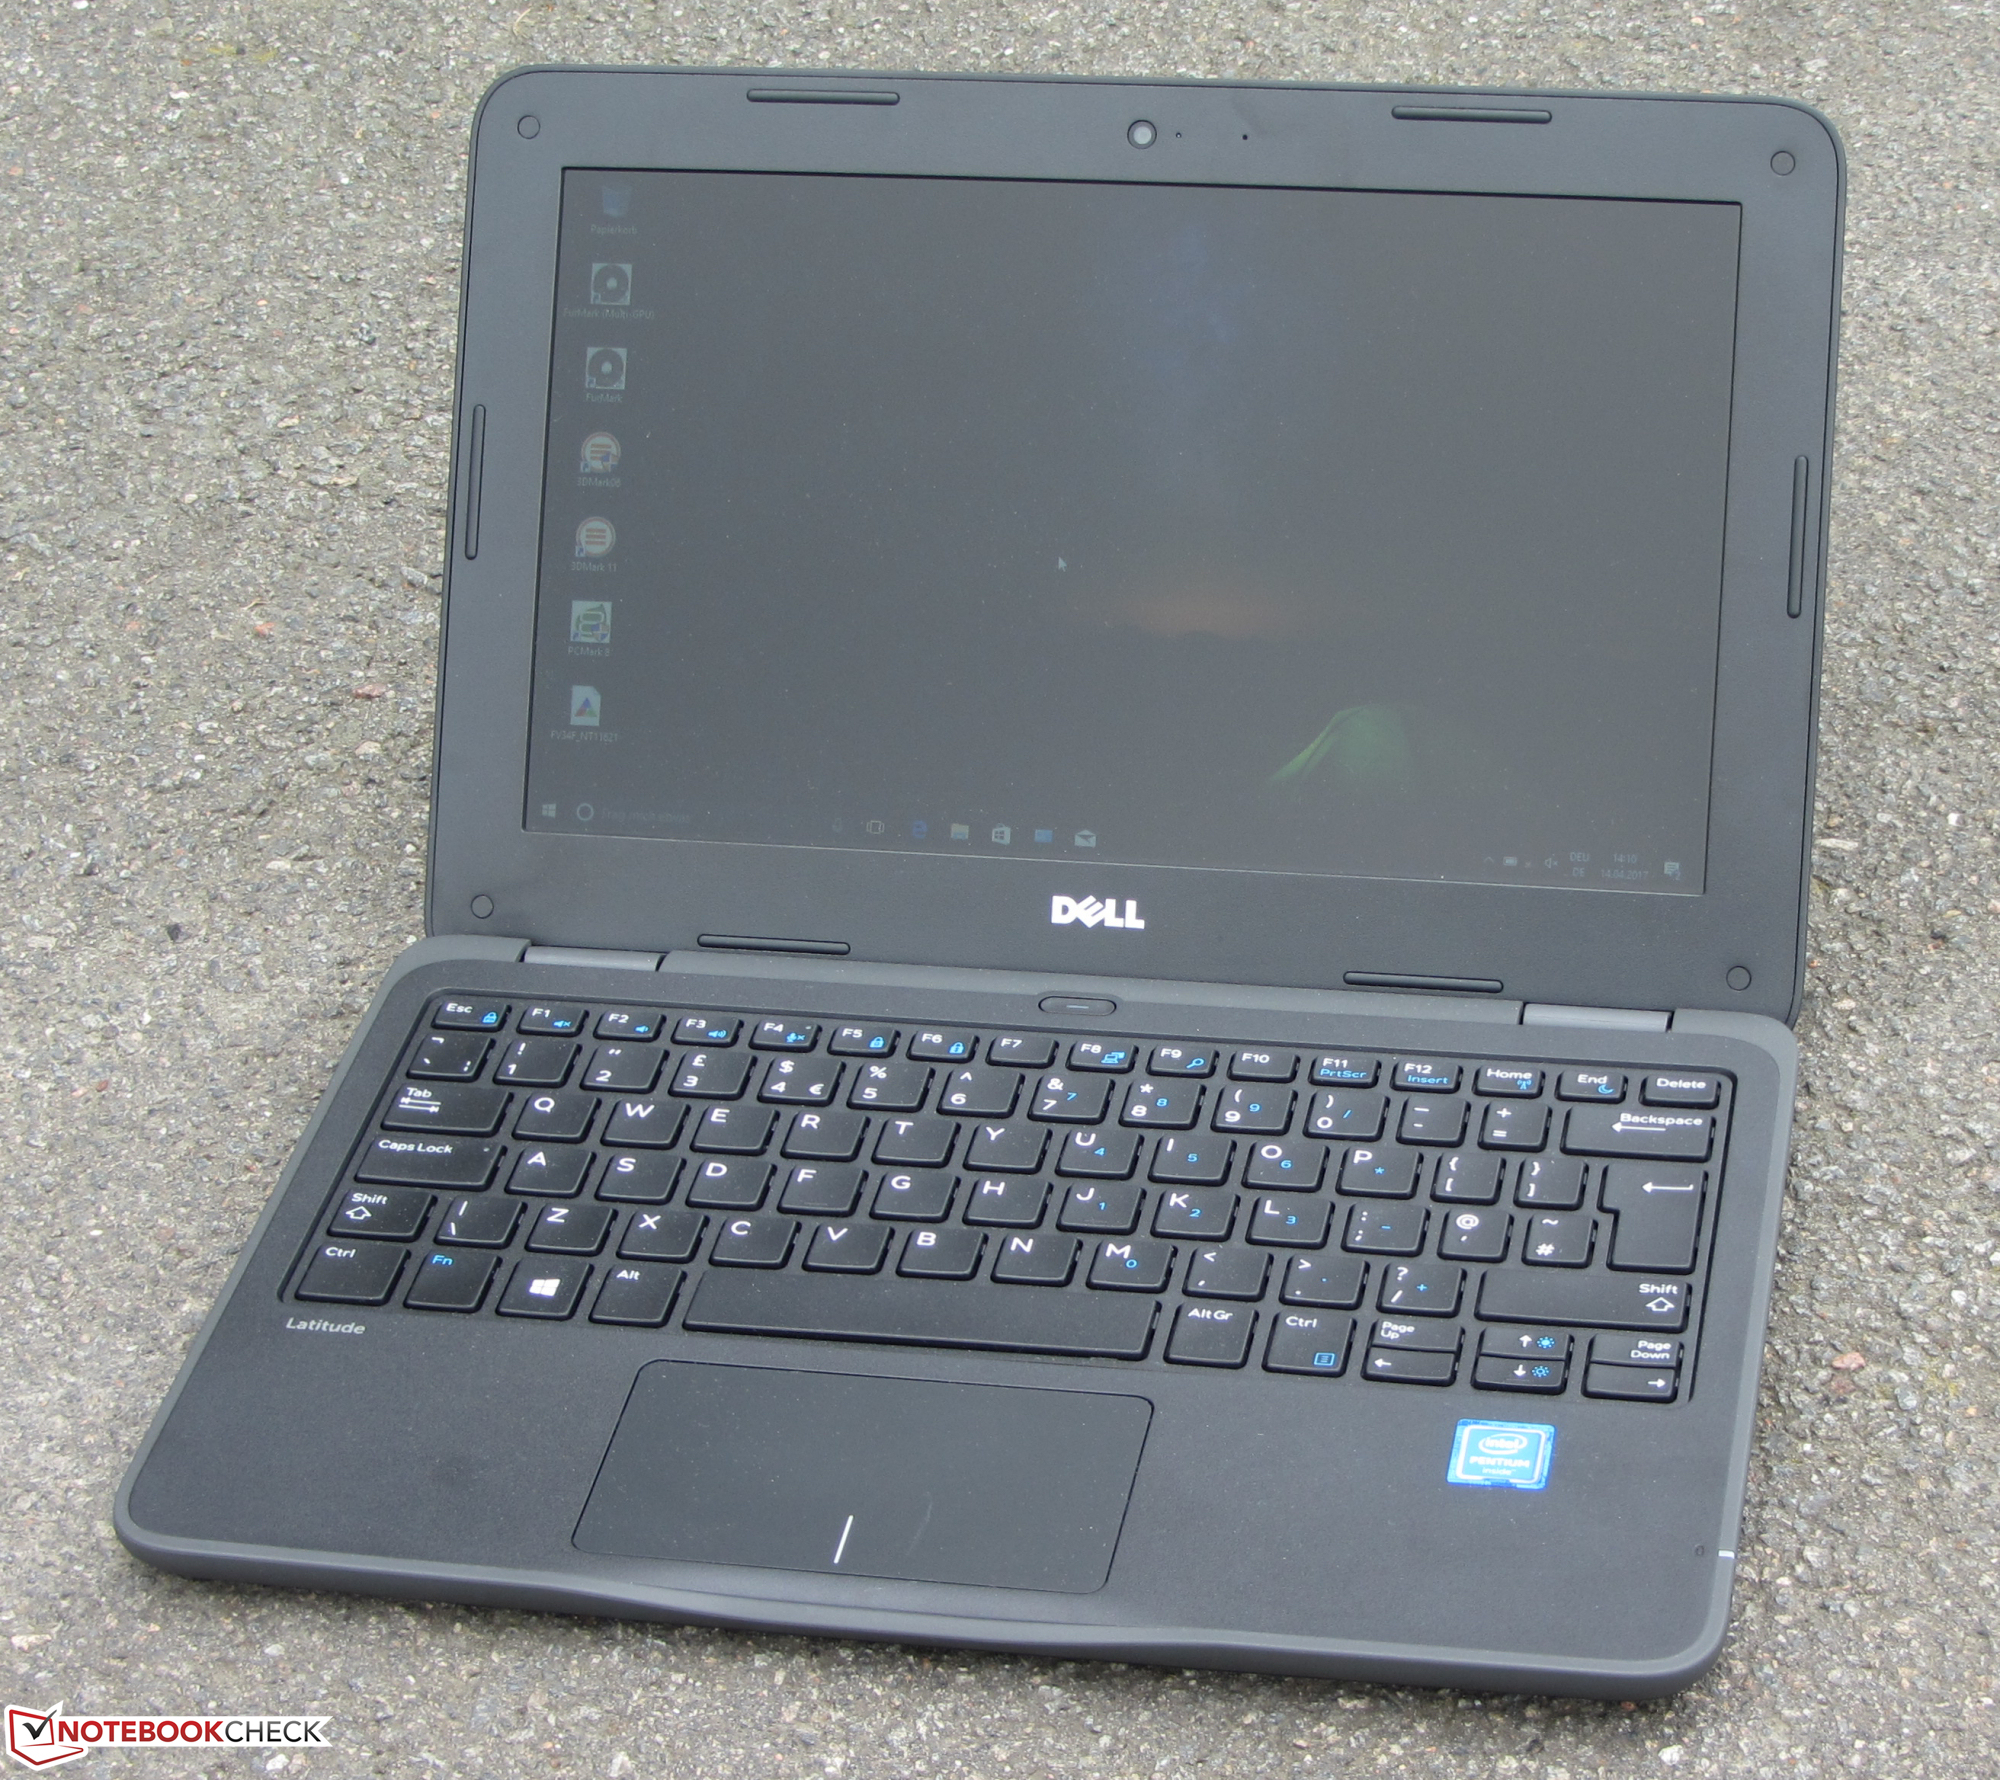
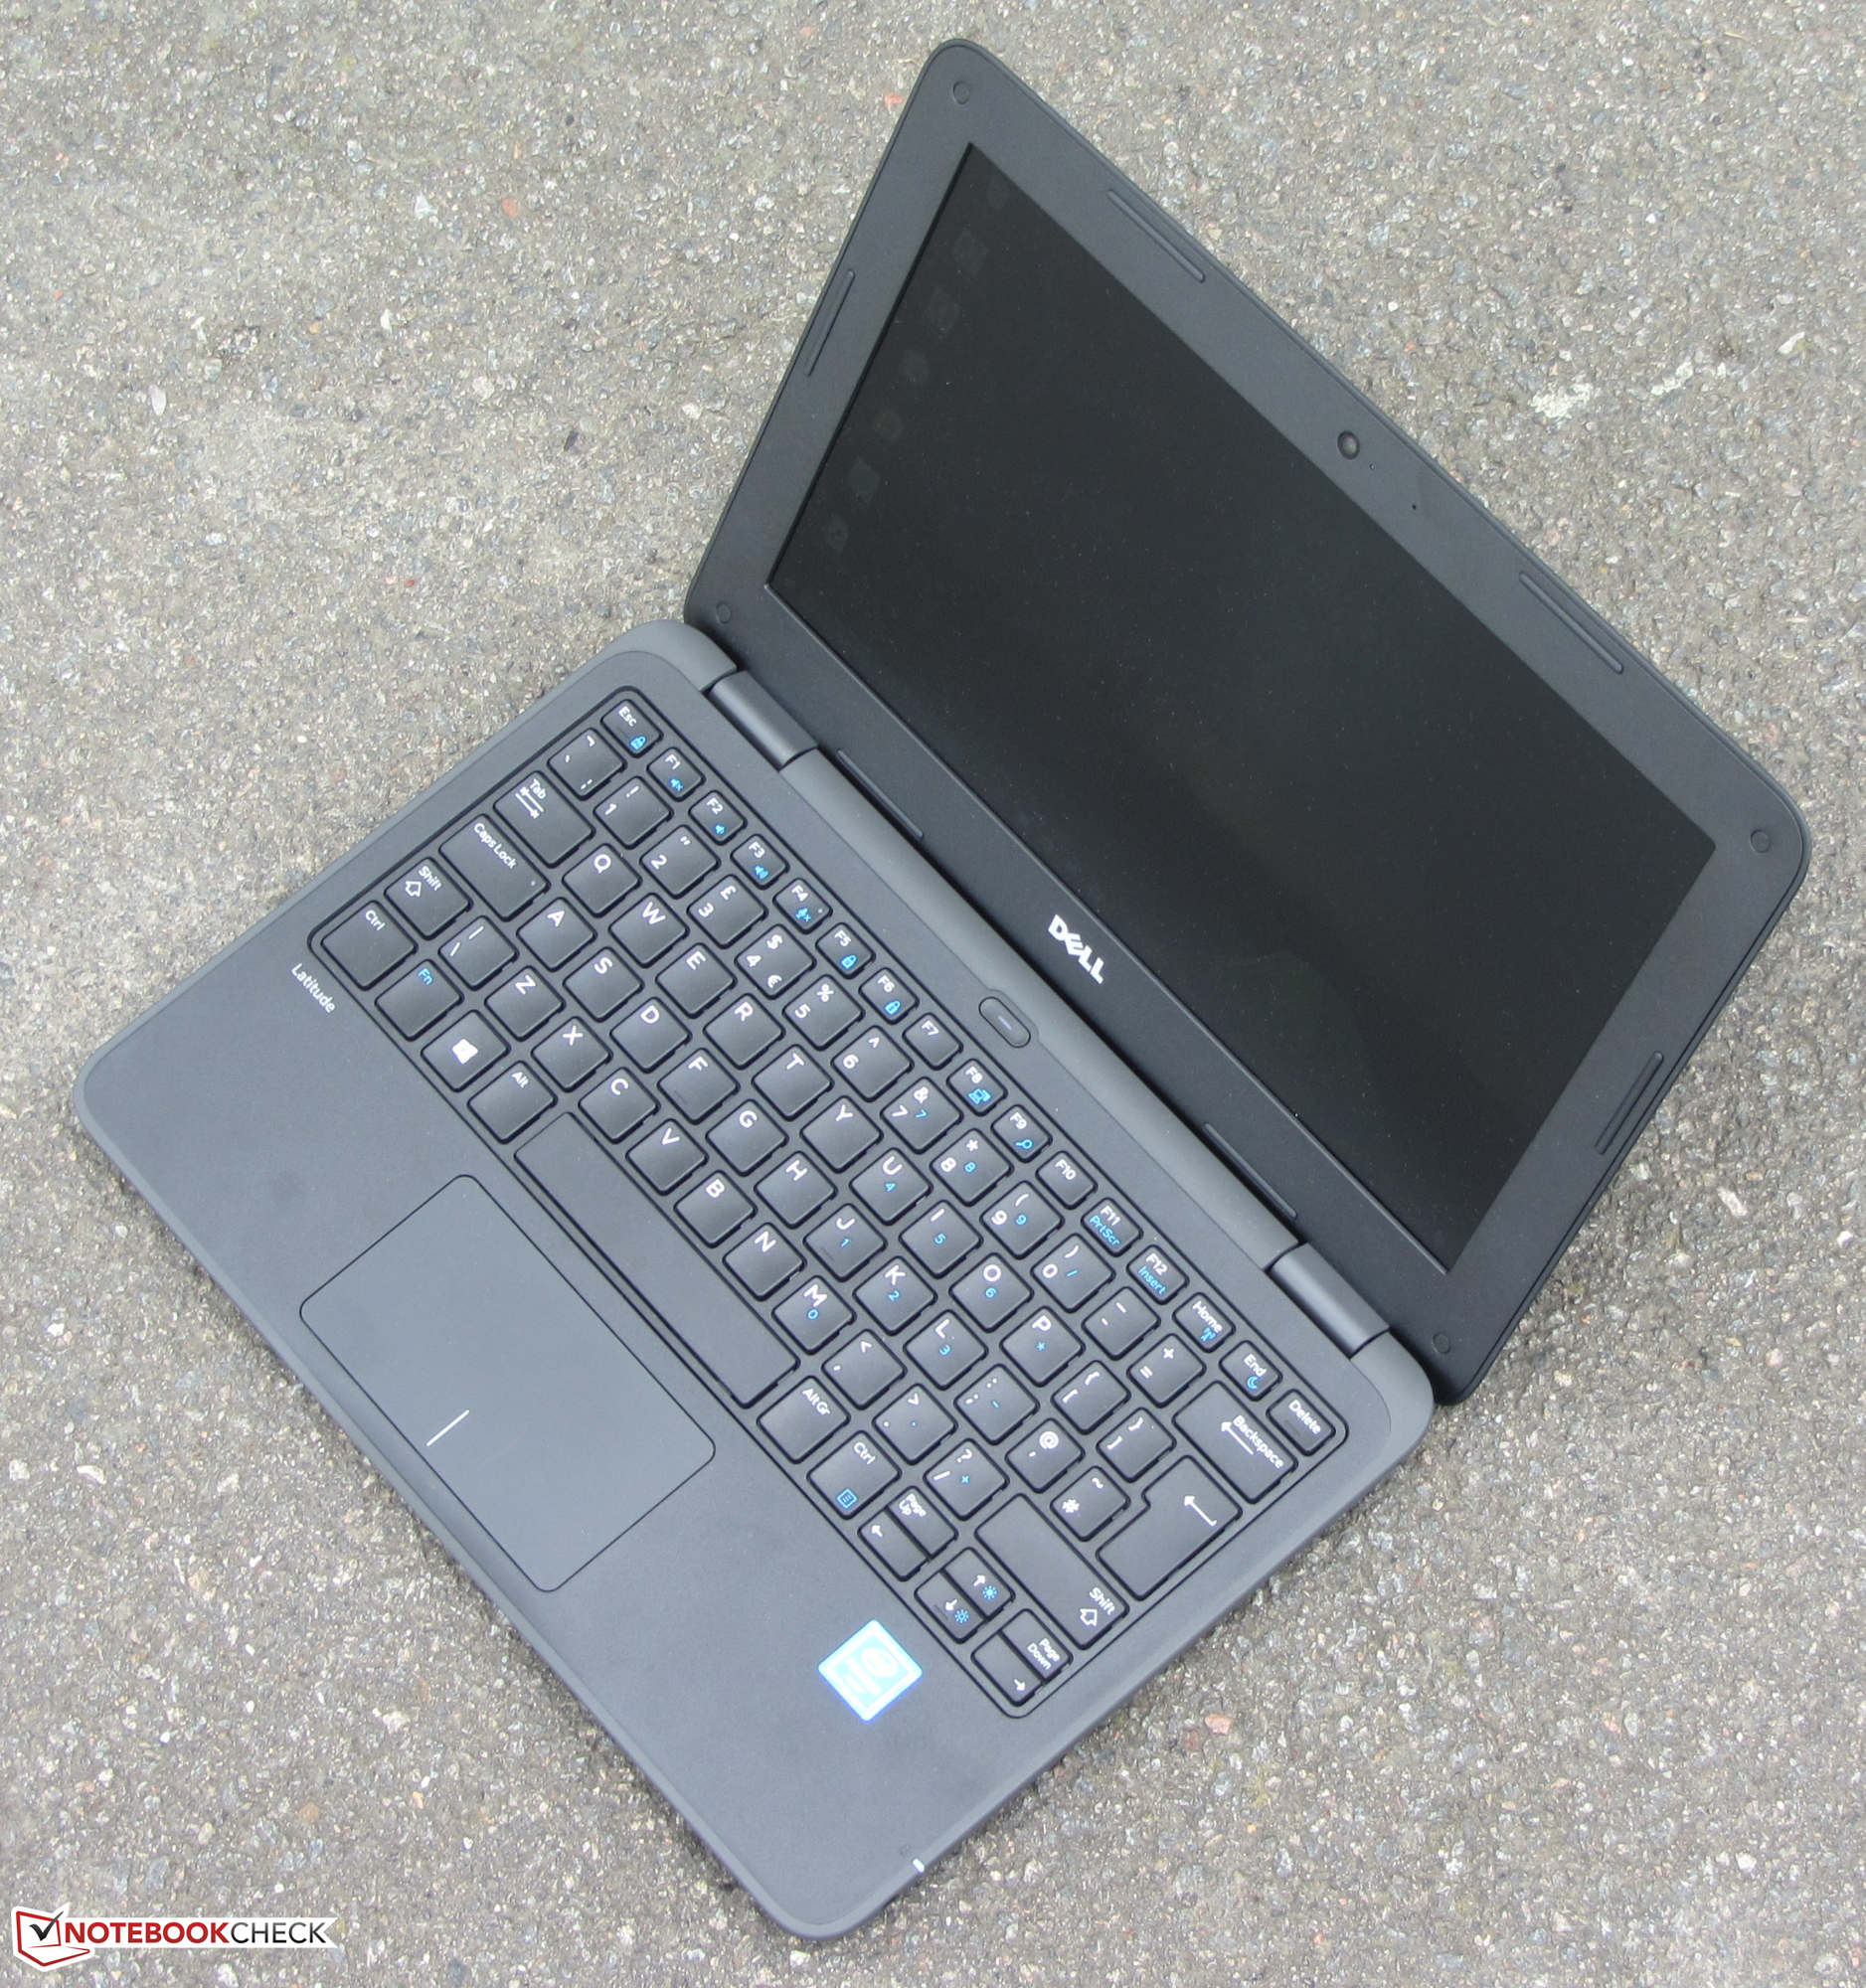
Recensione breve del Portatile Dell Latitude 3180 (N4200, HD)
Connectivity
| SD Card Reader | |
| maximum SDCardreader Maximum Transfer Rate | |
| average SDCardreader Average Transfer Rate |
| Networking | |
| iperf3 transmit AX12 | |
| Dell Latitude 3180 | |
| iperf3 receive AX12 | |
| Dell Latitude 3180 | |
| iperf Client (transmit) TCP 1 m | |
| Acer TravelMate B117-M-P16Q (seb) | |
| iperf Server (receive) TCP 1 m | |
| Acer TravelMate B117-M-P16Q (seb) | |
| |||||||||||||||||||||||||
Distribuzione della luminosità: 85 %
Al centro con la batteria: 253 cd/m²
Contrasto: 538:1 (Nero: 0.47 cd/m²)
ΔE ColorChecker Calman: 12.87 | ∀{0.5-29.43 Ø4.72}
ΔE Greyscale Calman: 13.97 | ∀{0.09-98 Ø4.97}
61% sRGB (Argyll 1.6.3 3D)
39% AdobeRGB 1998 (Argyll 1.6.3 3D)
42.13% AdobeRGB 1998 (Argyll 3D)
61.4% sRGB (Argyll 3D)
40.78% Display P3 (Argyll 3D)
Gamma: 2.46
CCT: 18336 K
| Dell Latitude 3180 TN LED, 1366x768, 11.6" | Dell Latitude 11 3150 TN, 1366x768, 11" | Acer TravelMate B117-M-P16Q TN LED, 1366x768, 11.6" | HP Stream 11-r000ng TN, 1366x768, 11.6" | Medion Akoya S2218 IPS, 1920x1080, 11.6" | |
|---|---|---|---|---|---|
| Display | -5% | 3% | 4% | 17% | |
| Display P3 Coverage (%) | 40.78 | 38.93 -5% | 42.04 3% | 42.52 4% | 48.34 19% |
| sRGB Coverage (%) | 61.4 | 58.5 -5% | 62.9 2% | 63.5 3% | 70.1 14% |
| AdobeRGB 1998 Coverage (%) | 42.13 | 40.23 -5% | 43.46 3% | 43.97 4% | 50 19% |
| Response Times | -7% | -1% | 3% | ||
| Response Time Grey 50% / Grey 80% * (ms) | 40 ? | 38 ? 5% | 44 ? -10% | 27 ? 32% | |
| Response Time Black / White * (ms) | 26 ? | 31 ? -19% | 24 ? 8% | 33 ? -27% | |
| PWM Frequency (Hz) | 200 ? | 200 ? | |||
| Screen | -13% | 7% | 8% | 39% | |
| Brightness middle (cd/m²) | 253 | 235 -7% | 218 -14% | 264 4% | 417 65% |
| Brightness (cd/m²) | 236 | 219 -7% | 215 -9% | 248 5% | 394 67% |
| Brightness Distribution (%) | 85 | 72 -15% | 85 0% | 84 -1% | 88 4% |
| Black Level * (cd/m²) | 0.47 | 0.81 -72% | 0.38 19% | 0.5 -6% | 0.43 9% |
| Contrast (:1) | 538 | 290 -46% | 574 7% | 528 -2% | 970 80% |
| Colorchecker dE 2000 * | 12.87 | 9.67 25% | 10.29 20% | 9.78 24% | 6.7 48% |
| Colorchecker dE 2000 max. * | 21.99 | 17.68 20% | 16.39 25% | 15.07 31% | |
| Greyscale dE 2000 * | 13.97 | 11 21% | 11.71 16% | 11.16 20% | 6.25 55% |
| Gamma | 2.46 89% | 2.2 100% | 2.45 90% | 2.44 90% | 2.48 89% |
| CCT | 18336 35% | 11769 55% | 14164 46% | 12954 50% | 5954 109% |
| Color Space (Percent of AdobeRGB 1998) (%) | 39 | 37 -5% | 40 3% | 41 5% | 46 18% |
| Color Space (Percent of sRGB) (%) | 61 | 63 3% | 63 3% | 69 13% | |
| Media totale (Programma / Settaggio) | -9% /
-11% | 1% /
4% | 4% /
6% | 20% /
30% |
* ... Meglio usare valori piccoli
Sfarfallio dello schermo / PWM (Pulse-Width Modulation)
| flickering dello schermo / PWM rilevato | 200 Hz | ≤ 90 % settaggio luminosita' | 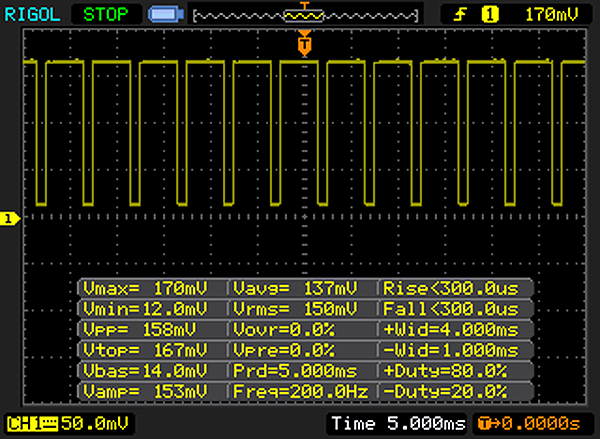 |
Il display sfarfalla a 200 Hz (Probabilmente a causa dell'uso di PWM) Flickering rilevato ad una luminosita' di 90 % o inferiore. Non dovrebbe verificarsi flickering o PWM sopra questo valore di luminosita'. La frequenza di 200 Hz è relativamente bassa, quindi gli utenti sensibili potrebbero notare il flickering ed accusare stanchezza agli occhi a questo livello di luminosità e a livelli inferiori. In confronto: 52 % di tutti i dispositivi testati non utilizza PWM per ridurre la luminosita' del display. Se è rilevato PWM, una media di 7769 (minimo: 5 - massimo: 343500) Hz è stata rilevata. | |||
Tempi di risposta del Display
| ↔ Tempi di risposta dal Nero al Bianco | ||
|---|---|---|
| 26 ms ... aumenta ↗ e diminuisce ↘ combinato | ↗ 20 ms Incremento | 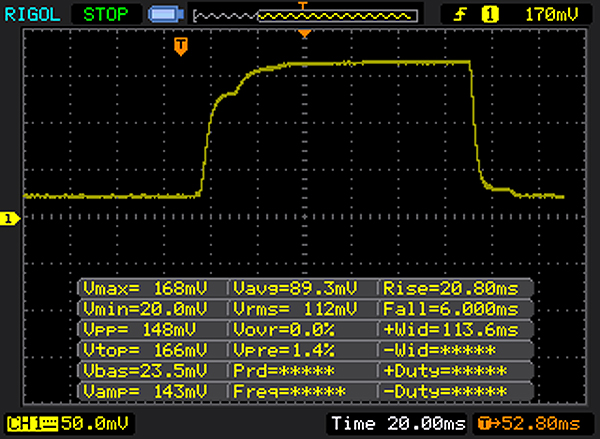 |
| ↘ 6 ms Calo | ||
| Lo schermo mostra tempi di risposta relativamente lenti nei nostri tests e potrebbe essere troppo lento per i gamers. In confronto, tutti i dispositivi di test variano da 0.1 (minimo) a 240 (massimo) ms. » 62 % di tutti i dispositivi è migliore. Questo significa che i tempi di risposta rilevati sono peggiori rispetto alla media di tutti i dispositivi testati (19.8 ms). | ||
| ↔ Tempo di risposta dal 50% Grigio all'80% Grigio | ||
| 40 ms ... aumenta ↗ e diminuisce ↘ combinato | ↗ 22 ms Incremento | 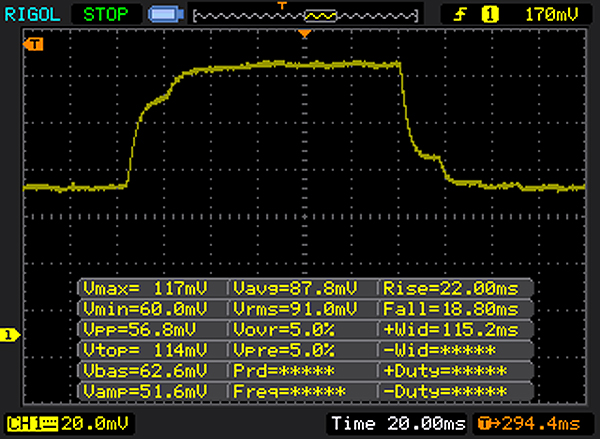 |
| ↘ 18 ms Calo | ||
| Lo schermo mostra tempi di risposta lenti nei nostri tests e sarà insoddisfacente per i gamers. In confronto, tutti i dispositivi di test variano da 0.165 (minimo) a 636 (massimo) ms. » 61 % di tutti i dispositivi è migliore. Questo significa che i tempi di risposta rilevati sono peggiori rispetto alla media di tutti i dispositivi testati (31 ms). | ||
| Cinebench R10 | |
| Rendering Multiple CPUs 32Bit | |
| Dell Latitude 3180 | |
| Dell Latitude 3189 | |
| Acer Aspire ES1-332-P91H | |
| Acer Aspire ES1-533-P7WA | |
| Acer TravelMate B117-M-P16Q | |
| Dell Latitude 11 3150 | |
| Rendering Single 32Bit | |
| Acer Aspire ES1-332-P91H | |
| Acer Aspire ES1-533-P7WA | |
| Dell Latitude 3180 | |
| Dell Latitude 3189 | |
| Dell Latitude 11 3150 | |
| Acer TravelMate B117-M-P16Q | |
| Geekbench 3 | |
| 32 Bit Single-Core Score | |
| Dell Latitude 3180 | |
| Acer Aspire ES1-533-P7WA | |
| Acer Aspire ES1-332-P91H | |
| Acer TravelMate B117-M-P16Q | |
| 32 Bit Multi-Core Score | |
| Dell Latitude 3180 | |
| Acer Aspire ES1-533-P7WA | |
| Acer Aspire ES1-332-P91H | |
| Acer TravelMate B117-M-P16Q | |
| Geekbench 4.0 | |
| 64 Bit Single-Core Score | |
| Acer Aspire ES1-533-P7WA | |
| Acer Aspire ES1-332-P91H | |
| Dell Latitude 3180 | |
| 64 Bit Multi-Core Score | |
| Dell Latitude 3180 | |
| Acer Aspire ES1-533-P7WA | |
| Acer Aspire ES1-332-P91H | |
| Geekbench 4.4 | |
| 64 Bit Single-Core Score | |
| Dell Latitude 3180 | |
| 64 Bit Multi-Core Score | |
| Dell Latitude 3180 | |
| JetStream 1.1 - 1.1 Total | |
| Acer Aspire ES1-533-P7WA | |
| Acer Aspire ES1-332-P91H | |
| Dell Latitude 3180 | |
| Dell Latitude 3189 | |
| Acer TravelMate B117-M-P16Q | |
| PCMark 8 Home Score Accelerated v2 | 2314 punti | |
Aiuto | ||
| PCMark 8 - Home Score Accelerated v2 | |
| Dell Latitude 3180 | |
| Acer TravelMate B117-M-P16Q | |
| HP Stream 11-r000ng | |
| Medion Akoya S2218 | |

| Dell Latitude 3180 Liteonit CV3-8D128 | Dell Latitude 11 3150 Samsung SSD PM851 128 GB MZ7TE128HMGR | Acer TravelMate B117-M-P16Q Liteonit CV3-8D256 | HP Stream 11-r000ng 32 GB eMMC Flash | Medion Akoya S2218 64 GB eMMC Flash | |
|---|---|---|---|---|---|
| CrystalDiskMark 3.0 | -25% | 25% | -58% | -67% | |
| Read Seq (MB/s) | 482.6 | 251.5 -48% | 506 5% | 154.2 -68% | 140.2 -71% |
| Write Seq (MB/s) | 213.2 | 124.4 -42% | 393.4 85% | 76.6 -64% | 52.7 -75% |
| Read 512 (MB/s) | 276.5 | 229.2 -17% | 329.1 19% | 165.8 -40% | 98.4 -64% |
| Write 512 (MB/s) | 162.6 | 124.8 -23% | 282.5 74% | 59.9 -63% | 58.7 -64% |
| Read 4k (MB/s) | 18.17 | 13.5 -26% | 23.35 29% | 18.25 0% | 15.25 -16% |
| Write 4k (MB/s) | 44.77 | 39.21 -12% | 45.56 2% | 13.16 -71% | 9.817 -78% |
| Read 4k QD32 (MB/s) | 132.7 | 117.4 -12% | 123.5 -7% | 46.51 -65% | 37.24 -72% |
| Write 4k QD32 (MB/s) | 118.1 | 98.6 -17% | 111.2 -6% | 13.21 -89% | 8.734 -93% |
| 3DMark 11 Performance | 899 punti | |
Aiuto | ||
| 3DMark 11 - 1280x720 Performance GPU | |
| Dell Latitude 3180 | |
| Acer Aspire ES1-533-P7WA | |
| Acer Aspire ES1-332-P91H | |
| Acer TravelMate B117-M-P16Q | |
| HP Stream 11-r000ng | |
| Dell Latitude 11 3150 | |
| basso | medio | alto | ultra | |
|---|---|---|---|---|
| BioShock Infinite (2013) | 32.3 | 18.6 | 16.2 | |
| Deus Ex Mankind Divided (2016) | 5.1 | |||
| Resident Evil 7 (2017) | 14.4 | |||
| For Honor (2017) | 12.1 | |||
| Ghost Recon Wildlands (2017) | 5.9 |
(±) La temperatura massima sul lato superiore è di 40.6 °C / 105 F, rispetto alla media di 35.9 °C / 97 F, che varia da 21.4 a 59 °C per questa classe Subnotebook.
(-) Il lato inferiore si riscalda fino ad un massimo di 48.4 °C / 119 F, rispetto alla media di 39.2 °C / 103 F
(+) In idle, la temperatura media del lato superiore è di 23.2 °C / 74 F, rispetto alla media deld ispositivo di 30.8 °C / 87 F.
(+) I poggiapolsi e il touchpad sono piu' freddi della temperatura della pelle con un massimo di 27.1 °C / 80.8 F e sono quindi freddi al tatto.
(±) La temperatura media della zona del palmo della mano di dispositivi simili e'stata di 28.2 °C / 82.8 F (+1.1 °C / 2 F).
Dell Latitude 3180 analisi audio
(-) | altoparlanti non molto potenti (68 dB)
Bassi 100 - 315 Hz
(±) | bassi ridotti - in media 12.2% inferiori alla media
(+) | bassi in lineaa (5.9% delta rispetto alla precedente frequenza)
Medi 400 - 2000 Hz
(+) | medi bilanciati - solo only 4.5% rispetto alla media
(+) | medi lineari (6.9% delta rispetto alla precedente frequenza)
Alti 2 - 16 kHz
(+) | Alti bilanciati - appena 3.9% dalla media
(+) | alti lineari (6% delta rispetto alla precedente frequenza)
Nel complesso 100 - 16.000 Hz
(±) | la linearità complessiva del suono è media (17.8% di differenza rispetto alla media
Rispetto alla stessa classe
» 50% di tutti i dispositivi testati in questa classe è stato migliore, 7% simile, 43% peggiore
» Il migliore ha avuto un delta di 5%, medio di 18%, peggiore di 53%
Rispetto a tutti i dispositivi testati
» 36% di tutti i dispositivi testati in questa classe è stato migliore, 8% similare, 56% peggiore
» Il migliore ha avuto un delta di 4%, medio di 24%, peggiore di 134%
Apple MacBook 12 (Early 2016) 1.1 GHz analisi audio
(+) | gli altoparlanti sono relativamente potenti (83.6 dB)
Bassi 100 - 315 Hz
(±) | bassi ridotti - in media 11.3% inferiori alla media
(±) | la linearità dei bassi è media (14.2% delta rispetto alla precedente frequenza)
Medi 400 - 2000 Hz
(+) | medi bilanciati - solo only 2.4% rispetto alla media
(+) | medi lineari (5.5% delta rispetto alla precedente frequenza)
Alti 2 - 16 kHz
(+) | Alti bilanciati - appena 2% dalla media
(+) | alti lineari (4.5% delta rispetto alla precedente frequenza)
Nel complesso 100 - 16.000 Hz
(+) | suono nel complesso lineare (10.2% differenza dalla media)
Rispetto alla stessa classe
» 7% di tutti i dispositivi testati in questa classe è stato migliore, 2% simile, 91% peggiore
» Il migliore ha avuto un delta di 5%, medio di 18%, peggiore di 53%
Rispetto a tutti i dispositivi testati
» 5% di tutti i dispositivi testati in questa classe è stato migliore, 1% similare, 94% peggiore
» Il migliore ha avuto un delta di 4%, medio di 24%, peggiore di 134%
| Off / Standby | |
| Idle | |
| Sotto carico |
|
Leggenda:
min: | |
| Battery Runtime - WiFi Websurfing | |
| Dell Latitude 3180 | |
| Dell Latitude 11 3150 | |
| Acer TravelMate B117-M-P16Q | |
| HP Stream 11-r000ng | |
| Medion Akoya S2218 | |
Pro
Contro
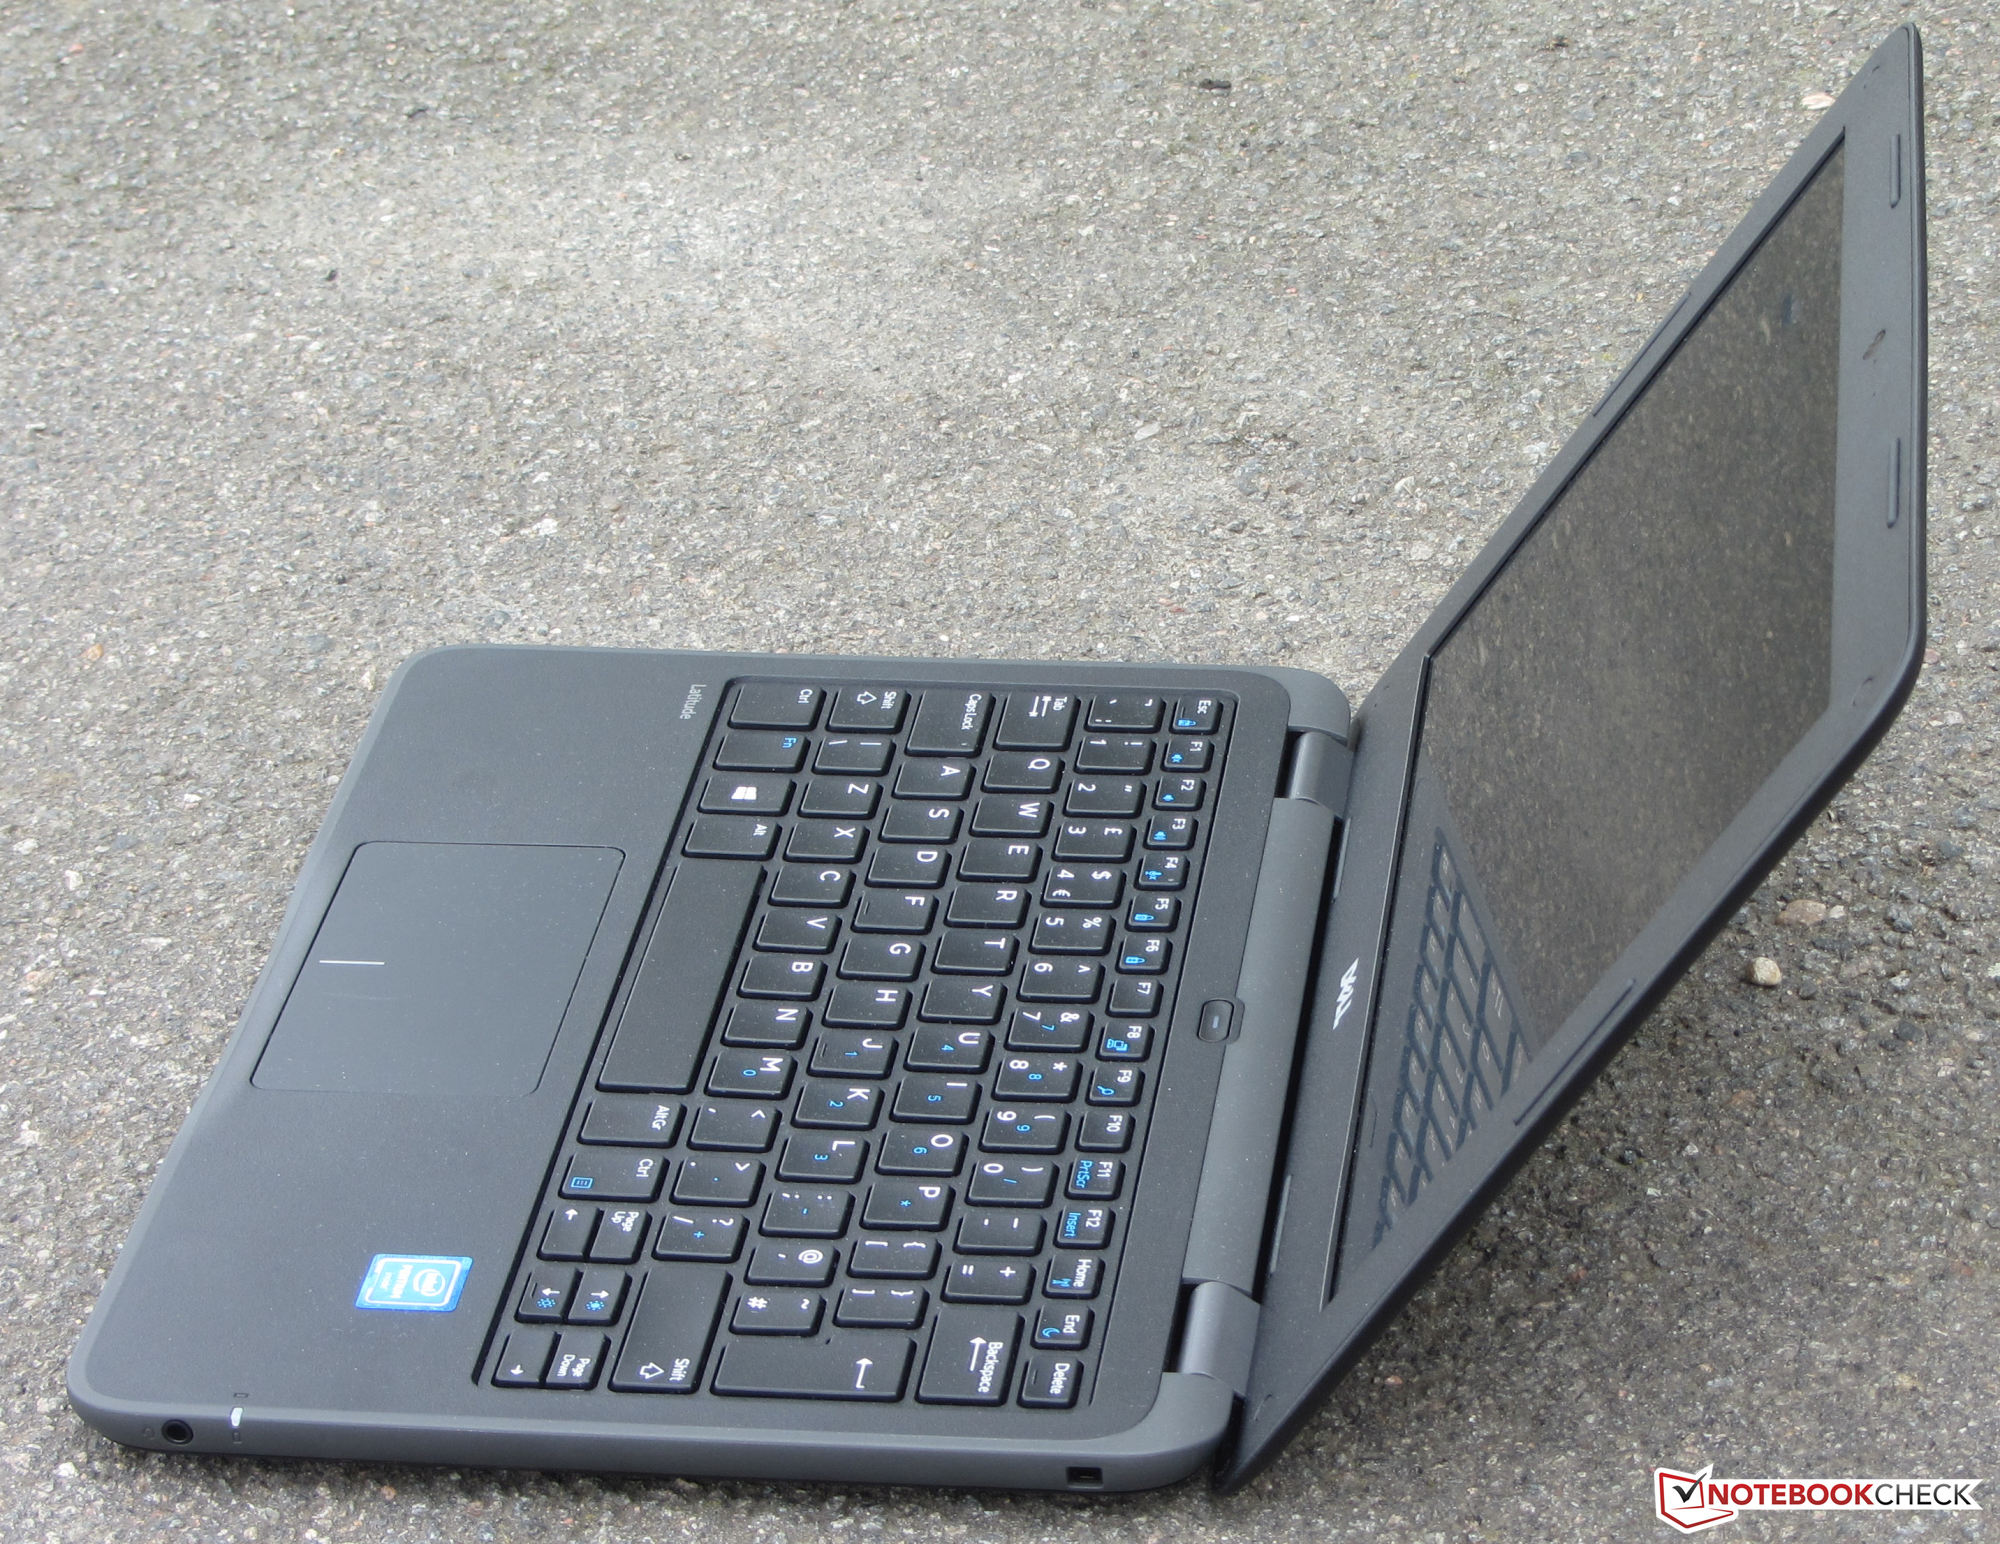
Dell realizza un portatile da 11.6" pensando alla scuola con il suo Latitude 11 3180. Pertanto, ha un robusto case in plastica. Il processore Apollo Lake ha abbastanza potenza di calcolo per ufficio e applicazioni Internet. Il portatile è silenzioso e non si scalda molto.
Dell realizza una macchina compatta e duratura per gli istituti scolastici con il suo Latitude 11 3180.
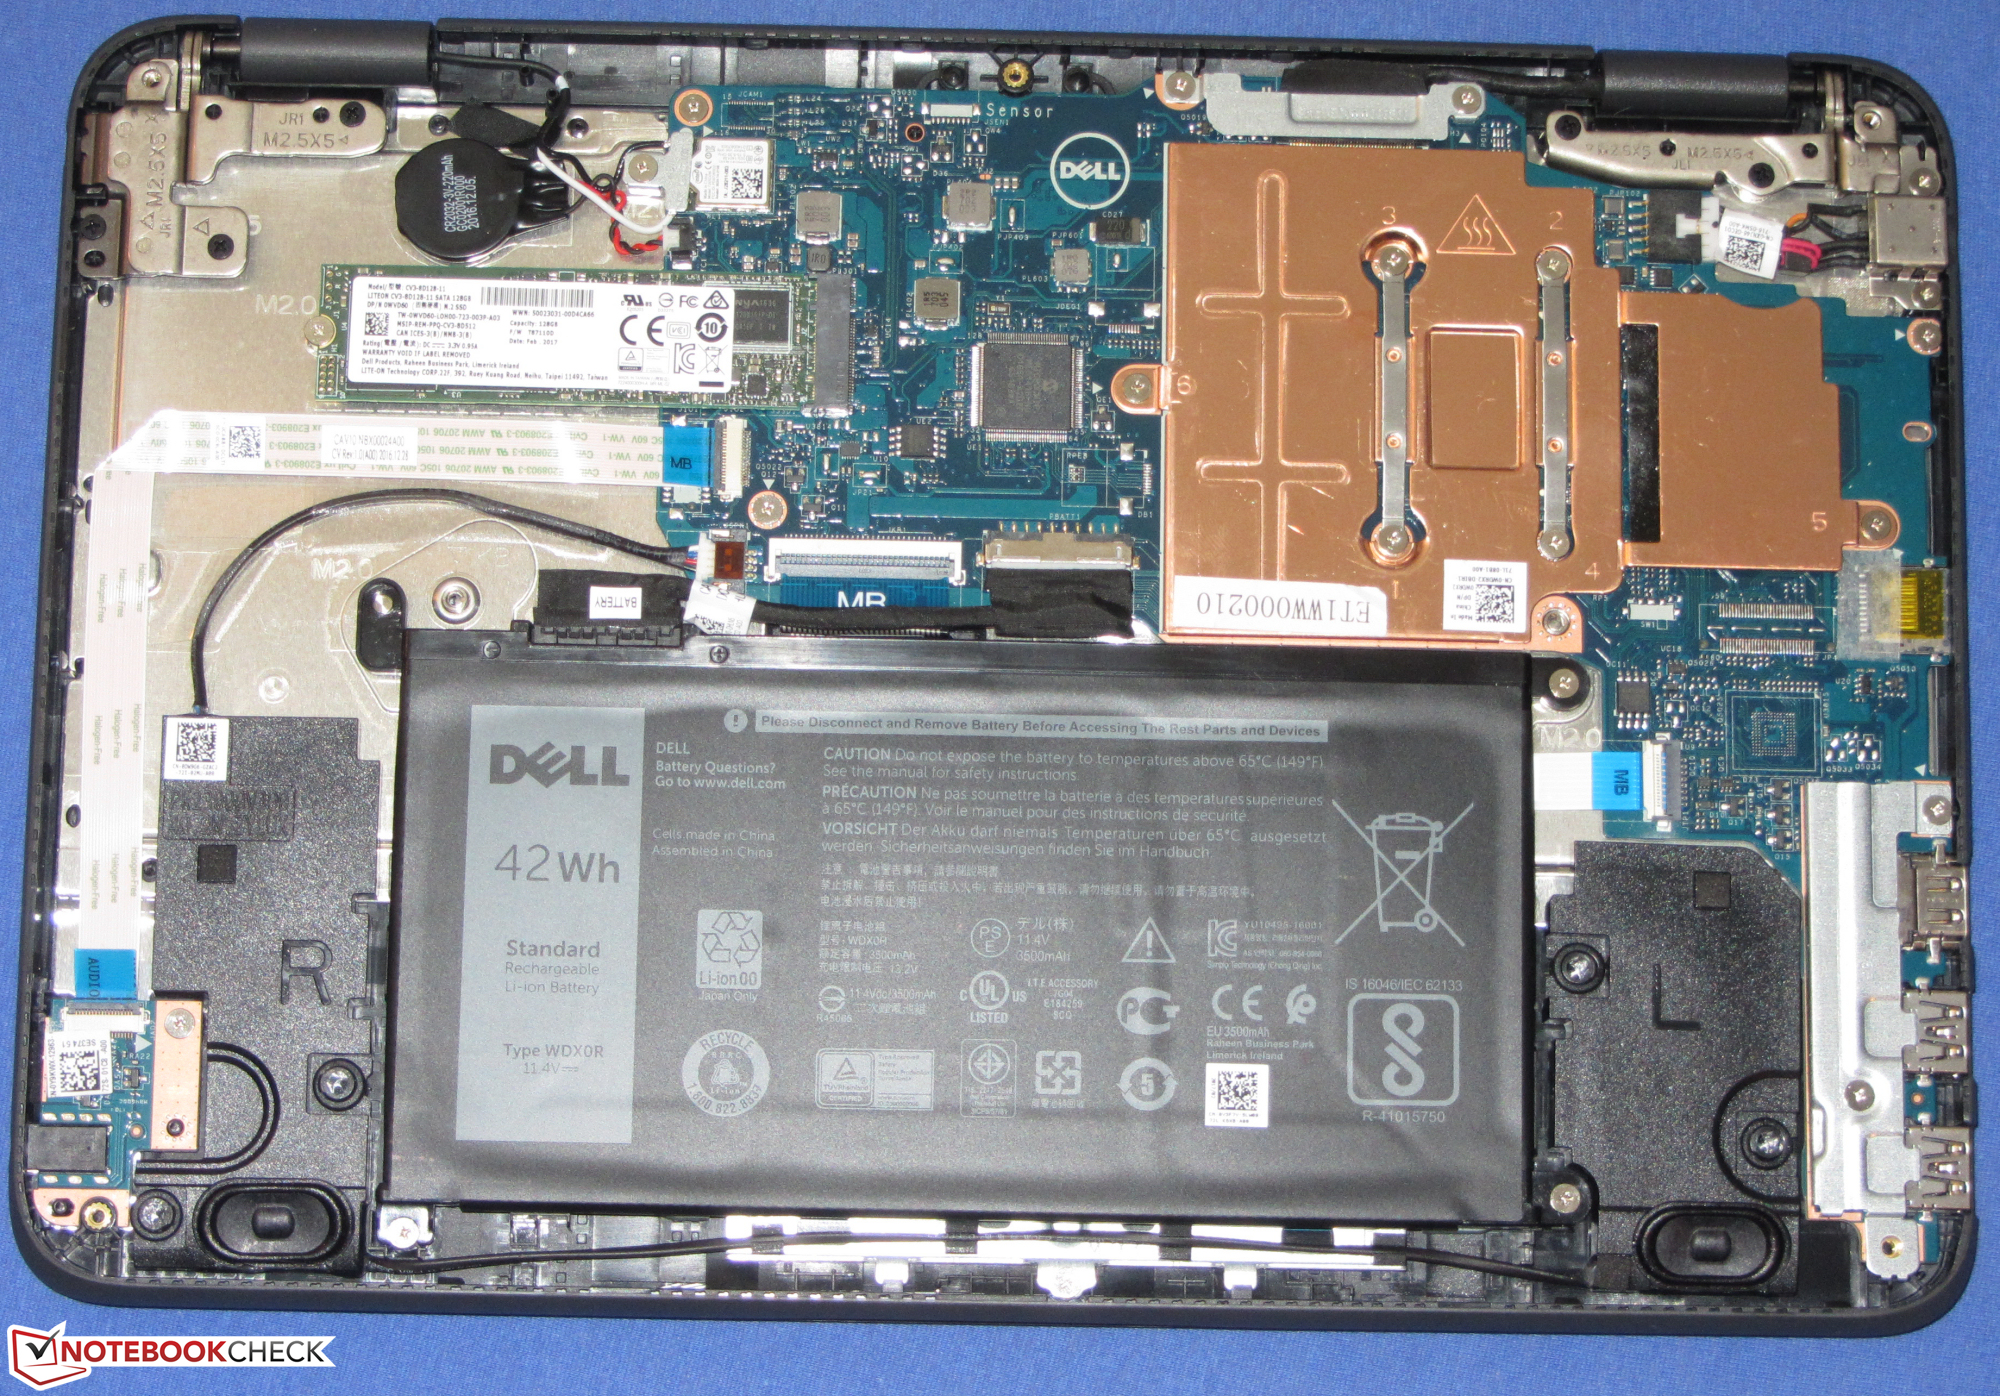
Un SSD garantisce un sistema veloce. Sarebbe possibile sostituire l'SSD. Tuttavia, bisogna aprire il case. Inoltre non tutte le versioni del portatile hanno un SSD. I modelli più economici montano un dispositivo di archiviazione fisso eMMC, e la sostituzione non è possibile. L'autonomia è sorprendente. La decente tastiera è adatta a chi scrive molto.
Lo schermo è deludente. Dell usa un modello scuro, con contrasto basso e angoli di visuale limitati che contrastano le finalità di utilizzo. Sul sito Dell si legge che il PC può essere messo su un tavolo piatto per vedere meglio i contenuti grazie alla cerniera a 180°. Questo sarebbe possibile solo con un pannello IPS. Tuttavia, il portatile usa un pannello TN con angoli di visuale limitati. Oltre questo, lo schermo che è pensato per l'utilizzo solo a scuola non dovrebbe avere PWM-flickering.
Il nostro modello costa 489 Euro sul negozio Dell al momento del test - molto per un semplice dispositivo da ufficio. Pertanto il portatile non è una buona opzione per i clienti privati.
Nota: si tratta di una recensione breve, con alcune sezioni non tradotte, per la versione integrale in inglese guardate qui.
Dell Latitude 3180
- 04/19/2017 v6 (old)
Sascha Mölck