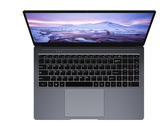
Recensione del Lapbook Chuwi un 4K per $440
Intel Atom x7-E3950 | Intel HD Graphics 505 | 15.60" | 1.5 kg

L'Intel HD Graphics 505 è un processore grafico integrato per la generazione Apollo Lake (i.e. Pentium N4200), annunciato a metà 2016. La GPU convince con consumi contenuti, ma le prestazioni sono nel segmento low-end e difficilmente sufficienti per i giochi attuali. Essendo una configurazione massima della GPU Apollo Lake, l'HD Graphics 505 monta 18 Execution Units (EUs) che girano fino a 750 MHz. Le specifiche tecniche della GPU si basano sull'architettura Intel Gen9, che è usata anche per la più costosa serie Skylake.
A causa dell'assenza di memoria grafica dedicata o eDRAM cache, l'HD 505 accede alla memoria principale tramite il processore (2x 64bit DDR3L-/LPDDR3-1866, LPDDR4-2400).
Performance
L'HD Graphics 505 dovrebbe essere leggermente più lenta rispetto alla vecchia GPU Core-M HD Graphics 5300, quindi i giochi attuali (del 2016) difficilmente saranno fluidi anche con settaggi minimi.
Features
Il motore video revisionato ora decodifica completamente H.265/HEVC con l'hardware e quindi è più efficiente rispetto a prima. Possono essere collegati fino a displays tramite DP/eDP o HDMI (4K forse solo a 30 Hz via HDMI 1.4).
Consumo Energetico
Il TDP di tutto il chip Pentium N4200 è di 6 Watts di default, quindi la GPU è usata principalmente per (spesso a raffreddamento passivo) netbooks o portatili sottili. Il TDP può essere anche ridotto a 4 Watts, ma questo ovviamente impatta sulle performance.
Gen. 9 Serie
| |||||||||||||||||||||||||||||||||||||||||||
| Nome in codice | Apollo Lake | ||||||||||||||||||||||||||||||||||||||||||
| Architettura | Gen. 9 Apollo Lake | ||||||||||||||||||||||||||||||||||||||||||
| Pipelines | 18 - unified | ||||||||||||||||||||||||||||||||||||||||||
| Velocità del core | 300 - 750 (Boost) MHz | ||||||||||||||||||||||||||||||||||||||||||
| Larghezza del bus di memoria | 64/128 Bit | ||||||||||||||||||||||||||||||||||||||||||
| Memoria condivisa | si | ||||||||||||||||||||||||||||||||||||||||||
| API | DirectX 12_1, OpenGL 4.4 | ||||||||||||||||||||||||||||||||||||||||||
| tecnologia | 14 nm | ||||||||||||||||||||||||||||||||||||||||||
| Caratteristiche | QuickSync | ||||||||||||||||||||||||||||||||||||||||||
| Data dell'annuncio | 01.09.2016 | ||||||||||||||||||||||||||||||||||||||||||
| ||||||||||||||||
I seguenti benchmarks deirivano dai benchmarks dei portatili recensiti. Le prestazioni dipendono dalla scheda grafica utilizzata, dal clock rate, dal processore, dai settaggi di sistema, dai drivers, e dai sistemi operativi. Quindi i risultati non sono rappresentativi per i portatili con questa GPU. Per informazioni dettagliate sui risultati del benchmark, cliccate sul numero di fps.


Per conoscere altri giochi che potrebbero essere utilizzabili e per una lista completa di tutti i giochi e delle schede grafiche visitate la nostra Gaming List

Asus VivoBook Flip 14 TP401NA: Intel Pentium N4200, 14.00", 1.5 kg
recensione » Recensione del Convertibile Asus VivoBook Flip 14 TP401NA (N4200, FHD)
Acer TravelMate Spin B1 118-RN-P6BE: Intel Pentium N4200, 11.60", 1.5 kg
recensione » Recensione breve del Convertibile Acer TravelMate Spin B1
HP ProBook x360 11 G1 EE Z3A47EA: Intel Pentium N4200, 11.60", 1.5 kg
recensione » Recensione breve del Convertibile HP ProBook x360 11 G1 (Pentium N4200, 256 GB)
Acer Switch 3 SW312-31-P5VG: Intel Pentium N4200, 12.20", 0.9 kg
recensione » Recensione breve del Convertibile Acer Switch 3 SW312 (Pentium N4200)
Asus VivoBook Flip 12 TP203NAH-BP049T: Intel Pentium N4200, 11.60", 1.3 kg
recensione » Recensione breve del Portatile Asus VivoBook Flip 12 TP203NAH (N4200, HD)
Dell Latitude 3189: Intel Pentium N4200, 11.60", 1.4 kg
recensione » Recensione breve del Convertibile Dell Latitude 3189 (N4200, HD)
Dell Latitude 3180: Intel Pentium N4200, 11.60", 1.6 kg
recensione » Recensione breve del Portatile Dell Latitude 3180 (N4200, HD)
Acer Aspire ES1-533-P7WA: Intel Pentium N4200, 15.60", 2.4 kg
recensione » Recensione breve del Acer Aspire ES1-533-P7WA
Acer Aspire ES1-332-P91H: Intel Pentium N4200, 13.30", 1.5 kg
recensione » Recensione breve del notebook Acer Aspire ES1-332-P91H
Asus Chromebook C423NA-EB0243: Intel Pentium N4200, 14.00", 1.2 kg
Recensioni esterne » Asus Chromebook C423NA-EB0243
Acer Chromebook 514 CB514-1HT-P1BM: Intel Pentium N4200, 14.00", 1.4 kg
Recensioni esterne » Acer Chromebook 514 CB514-1HT-P1BM
Asus Chromebook Z1500CN-EJ0165: Intel Pentium N4200, 15.60", 1.5 kg
Recensioni esterne » Asus Chromebook Z1500CN-EJ0165
Asus Chromebook Z1400CN-BV0305: Intel Pentium N4200, 14.00", 1.2 kg
Recensioni esterne » Asus Chromebook Z1400CN-BV0305
Chuwi LapBook Plus: Intel Atom x7-E3950, 15.60", 1.5 kg
Recensioni esterne » Chuwi LapBook Plus
Acer Chromebook 14 CB514-1HT-P2D1: Intel Pentium N4200, 14.00", 1.4 kg
Recensioni esterne » Acer Chromebook 14 CB514-1HT-P2D1
Acer Chromebook 14 CB514-1HT-P1BM: Intel Pentium N4200, 14.00", 1.4 kg
Recensioni esterne » Acer Chromebook 14 CB514-1HT-P1BM
Trekstor Surfbook A13-P: Intel Pentium N4200, 13.30", 1.2 kg
Recensioni esterne » Trekstor Surfbook A13-P
Acer Aspire ES1-732-P7YA: Intel Pentium N4200, 17.30", 2.8 kg
Recensioni esterne » Acer Aspire ES1-732-P7YA
Acer Chromebook Spin 15 CP315-1H: Intel Pentium N4200, 15.60", 1.7 kg
Recensioni esterne » Acer Chromebook Spin 15 CP315-1H
Acer Chromebook C523NA-IH24T: Intel Pentium N4200, 15.60", 1.4 kg
Recensioni esterne » Acer Chromebook C523NA-IH24T
Acer Spin 1 SP111-32N-P1PR: Intel Pentium N4200, 11.60", 1.3 kg
Recensioni esterne » Acer Spin 1 SP111-32N-P1PR
Lenovo IdeaPad 120S-14IAP-81A500EDGE: Intel Pentium N4200, 14.00", 1.4 kg
Recensioni esterne » Lenovo IdeaPad 120S-14IAP-81A500EDGE
Trekstor Primebook P14B: Intel Pentium N4200, 14.10", 1.4 kg
Recensioni esterne » Trekstor Primebook P14B
Asus VivoBook Flip 14 TP401NA: Intel Pentium N4200, 14.00", 1.5 kg
Recensioni esterne » Asus VivoBook Flip 14 TP401NA
Acer Chromebook Spin 15 CP315-1H-P75Z: Intel Pentium N4200, 15.60", 2.1 kg
Recensioni esterne » Acer Chromebook Spin 15 CP315-1H-P75Z
Acer Chromebook 15 CB515-1HT-P099: Intel Pentium N4200, 15.60", 2 kg
Recensioni esterne » Acer Chromebook 15 CB515-1HT-P099
Acer Chromebook Spin 15 CP315-1H-P1K8: Intel Pentium N4200, 15.60", 2.2 kg
Recensioni esterne » Acer Chromebook Spin 15 CP315-1H-P1K8
Asus X540NA-GQ151T: Intel Pentium N4200, 15.60", 2 kg
Recensioni esterne » Asus X540NA-GQ151T
Acer Aspire ES1-533-P5MS: Intel Pentium N4200, 15.60", 2.4 kg
Recensioni esterne » Acer Aspire ES1-533-P5MS
Acer Aspire 3 A315-31-P3ZM: Intel Pentium N4200, 15.60", 2.4 kg
Recensioni esterne » Acer Aspire 3 A315-31-P3ZM
Lenovo Ideapad 320-15IAP-80XR0094GE: Intel Pentium N4200, 15.60", 2.2 kg
Recensioni esterne » Lenovo Ideapad 320-15IAP-80XR0094GE
Acer Switch 3 SW312-31-P7SF: Intel Pentium N4200, 12.20", 0.9 kg
Recensioni esterne » Acer Switch 3 SW312-31-P7SF
Acer Chromebook 15 CB515-1HT-P80X: Intel Pentium N4200, 15.60", 1.8 kg
Recensioni esterne » Acer Chromebook 15 CB515-1HT-P80X
Acer Swift 1 SF113-31-P72F: Intel Pentium N4200, 13.30", 1.3 kg
Recensioni esterne » Acer Swift 1 SF113-31-P72F
Acer Chromebook 15 CB515-1HT-P39B: Intel Pentium N4200, 15.60", 1.8 kg
Recensioni esterne » Acer Chromebook 15 CB515-1HT-P39B
Medion Akoya E3216-MD61800: Intel Pentium N4200, 13.30", 1.5 kg
Recensioni esterne » Medion Akoya E3216-MD61800
Acer Aspire ES1-533-P8BX: Intel Pentium N4200, 15.60", 2.4 kg
Recensioni esterne » Acer Aspire ES1-533-P8BX
Acer Swift 1 SF113-31-P56D: Intel Pentium N4200, 13.30", 1.4 kg
Recensioni esterne » Acer Swift 1 SF113-31-P56D
Acer Swift 1 SF113-31-P3P0: Intel Pentium N4200, 13.30", 1.3 kg
Recensioni esterne » Acer Swift 1 SF113-31-P3P0
Acer Switch 3 SW312-31-P3FT: Intel Pentium N4200, 12.20", 0.9 kg
Recensioni esterne » Acer Switch 3 SW312-31-P3FT
Asus VivoBook E14 E403NA-GA016T: Intel Pentium N4200, 14.00", 1.5 kg
Recensioni esterne » Asus VivoBook E403NA-GA016T
Acer Spin 1 SP111-32N-P9VD: Intel Pentium N4200, 11.60", 1.3 kg
Recensioni esterne » Acer Spin 1 SP111-32N-P9VD
Lenovo IdeaPad V110-15IAP-80TG00W3GE: Intel Pentium N4200, 15.60", 1.9 kg
Recensioni esterne » Lenovo IdeaPad V110-15IAP-80TG00W3GE
Acer TravelMate Spin B1 B118-RN-P6BE: Intel Pentium N4200, 11.60", 1.5 kg
Recensioni esterne » Acer TravelMate Spin B1 B118-RN-P6BE
Medion Akoya E3215-MD60794: Intel Pentium N4200, 13.30", 1.5 kg
Recensioni esterne » Medion Akoya E3215-MD60794
HP Pavilion x360 11-ad051nr: Intel Pentium N4200, 11.60", 1.4 kg
Recensioni esterne » HP Pavilion x360 11-ad051nr
Acer Switch 3 SW312-31P: Intel Pentium N4200, 12.00", 1.2 kg
Recensioni esterne » Acer Switch 3 SW312-31P
Acer Swift 1 SF113-31-P5CK: Intel Pentium N4200, 13.30", 1.4 kg
Recensioni esterne » Acer Swift 1 SF113-31-P5CK
Asus Vivobook E14 L403NA-FA017TS: Intel Pentium N4200, 14.00", 1.4 kg
Recensioni esterne » Asus Vivobook E14 L403NA-FA017TS
Acer Swift 1 SF113-31-P63H: Intel Pentium N4200, 13.30", 1.4 kg
Recensioni esterne » Acer Swift 1 SF113-31-P63H
Medion Akoya E3216-MD60900: Intel Pentium N4200, 13.30", 1.5 kg
Recensioni esterne » Medion Akoya E3216-MD60900
Acer Chromebook 15 CB515-1HT-P58C: Intel Pentium N4200, 15.60", 1.8 kg
Recensioni esterne » Acer Chromebook 15 CB515-1HT-P58C
BTO Notebooks U-BOOK 14CL23: Intel Pentium N4200, 14.00", 1.8 kg
Recensioni esterne » BTO Notebooks U-BOOK 14CL23
Asus VivoBook Flip 12 TP203NAH-BP049T: Intel Pentium N4200, 11.60", 1.3 kg
Recensioni esterne » Asus VivoBook Flip 12 TP203NAH-BP049T
Dell Latitude 3189: Intel Pentium N4200, 11.60", 1.4 kg
Recensioni esterne » Dell Latitude 3189
Acer Swift 1 SF113-31-P2CP: Intel Pentium N4200, 13.30", 1.4 kg
Recensioni esterne » Acer Swift 1 SF113-31-P2CP
Acer Aspire ES1-533-P2V5: Intel Pentium N4200, 15.60", 2.4 kg
Recensioni esterne » Acer Aspire ES1-533-P2V5
Acer Switch 3 SW312-31-P5VG: Intel Pentium N4200, 12.20", 0.9 kg
Recensioni esterne » Acer Switch 3 SW312-31-P5VG
Acer Aspire A315-31-P72U: Intel Pentium N4200, 15.60", 2.4 kg
Recensioni esterne » Acer Aspire A315-31-P72U
Acer Aspire ES1-533-P6NL: Intel Pentium N4200, 15.60", 2.4 kg
Recensioni esterne » Acer Aspire ES1-533-P6NL
Acer Aspire ES1-132-P065: Intel Pentium N4200, 11.60", 1.3 kg
Recensioni esterne » Acer Aspire ES1-132-P065
Acer Swift 1 SF113-31-P2CP: Intel Pentium N4200, 13.30", 1.4 kg
Recensioni esterne » Acer Swift 1 SF113-31-P2CP
Acer Aspire ES1-332-P7SA: Intel Pentium N4200, 13.30", 1.7 kg
Recensioni esterne » Acer Aspire ES1-332-P7SA
Lenovo IdeaPad V110-15IAP-80TG00W8GE: Intel Pentium N4200, 15.60", 1.9 kg
Recensioni esterne » Lenovo IdeaPad V110-15IAP-80TG00W8GE
Acer Spin 1 SP113-31-P0ZN: Intel Pentium N4200, 13.30", 1.6 kg
Recensioni esterne » Acer Spin 1 SP113-31-P0ZN
Lenovo IdeaPad V110-15IAP 80TG00W4GE: Intel Pentium N4200, 15.60", 1.9 kg
Recensioni esterne » Lenovo IdeaPad V110-15IAP 80TG00W4GE
Acer Spin 1 SP111-31-P40B: Intel Pentium N4200, 11.60", 1.5 kg
Recensioni esterne » Acer Spin 1 SP111-31-P40B
Acer Aspire ES1-533-P591: Intel Pentium N4200, 15.60", 2.4 kg
Recensioni esterne » Acer Aspire ES1-533-P591
HP ProBook x360 11-G1: Intel Pentium N4200, 11.60", 1.4 kg
Recensioni esterne » HP ProBook x360 11-G1
Posizione approssimativa dell'adattatore grafico
I nostri Top 10
» Top 10 Portatili Multimedia
» Top 10 Portatili Gaming
» Top 10 Portatili Gaming Leggeri
» Top 10 Portatili da Ufficio e Business economici
» Top 10 Portatili Premium da Ufficio/Business
» Top 10 Portatili sotto i 300 Euro
» Top 10 Portatili sotto i 500 Euro
» Top 10 dei Portatili Workstation
» Top 10 Subnotebooks
» Top 10 Ultrabooks
» Top 10 Convertibili
» Top 10 Tablets
» Top 10 Tablets Windows
» Top 10 Smartphones