


Notebookcheck Logo

NVIDIA GeForce 9600M GS
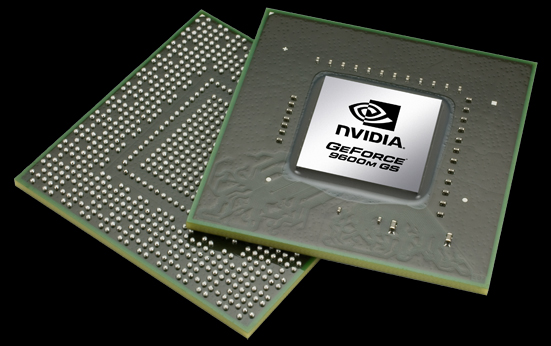
NVIDIA GeForce 9600M GS

La Nvidia GeForce 9600M GS è una scheda grafica DirectX 10 per portatili. Tecnicamente è una GeForce 9600M GT con clock inferiore. E' realizzata in 65nm e sfrutta il nuovo processore video PureVideo HD (VP3) ed ha il supporto HybridPower.
Rispetto alla 8600M GT, il core clock è leggermente superiore, conseguentemente le prestazioni sono simili alla vecchia 8600M GT, ma a causa della tecnologia in 55nm dovrebbe consumare meno energia. Come la 8600M GT, la 9600M GT sfrutta 32 processori stream che svolgono il lavoro grafico degli shaders vertex- e pixel-.
Congiuntamente alla Nvidia 9100M G, la 9600M GS supporta la Hybrid-SLI (solo HybridPower). La HybridPower è una tecnica che consente di scegliere tra i core grafici integrati e dedicati, in base alle esigenze di prestazioni o di risparmio della batteria. Questo funziona solo sotto Windows Vista. Sino ad ora gli utenti hanno dovuto utilizzare un tool per fare lo switch tra GPUs. In seguito Nvidia interverrà per fare lo switch automaticamente tramite i drivers. La GeForceBoost non è supportata da questa scheda, in quanto non ci sarebbe miglioramento prestazionale.
Rispetto alle schede grafiche desktop, la 9600M GS è simile alla GeForce 9500 GS (che deriva dal core G96). La CPU desktop della serie 9600 ha un bus di memoria da 256 bit ed è conseguentemente più veloce.

GeForce 9600M Serie

GeForce 9650M GT 32 @ 0.55 GHz128 Bit @ 800 MHz
GeForce 9600M GT 32 @ 0.5 GHz128 Bit @ 800 MHz
GeForce 9600M GS 32 @ 0.43 GHz128 Bit @ 800 MHz
Nome in codiceNB9P-GE
ArchitetturaG9x
Pipelines32 - unified
Velocità del core430 MHz
Velocità de Shader1075 MHz
Velocità della memoria800 MHz
Larghezza del bus di memoria128 Bit
Tipo di memoriaGDDR2, GDDR3
Max. quantità di memoria1024 MB
Memoria condivisano
APIDirectX 10, Shader 4.0
Transistor Count314 Milioni
tecnologia65 nm
CaratteristichePCI-E 2.0, 400 MHz Speichertakt bei GDDR2 und 800 MHz bei GDDR3
Dimensione del portatilemisura media
Data dell'annuncio03.06.2008
Link alla pagina del produttorewww.nvidia.com

Benchmark

3DMark Vantage
3DM Vant. Perf. total +
3DMark Vantage - 3DM Vant. Perf. total
1135 Points (0%)
3DM Vant. Perf. GPU no PhysX +
3DMark Vantage - 3DM Vant. Perf. GPU no PhysX
905 Points (0%)
Restrict / Search: Model: Max. age: years
3DMark 2001SE - 3DMark 2001 - Standard
min: 23226     media: 25075     media: 23837.5 (25%)     massimo: 29400 Points
3DMark 03 - 3DMark 03 - Standard
min: 11995     media: 13120     media: 12525 (7%)     massimo: 14841 Points
3DMark 05 - 3DMark 05 - Standard
min: 7700     media: 8844     media: 8887 (10%)     massimo: 9900 Points
Intel Graphics Media Accelerator (GMA) 500
133.4 -98%
...
AMD Radeon HD 6540G2
8495 -4%
8577 -3%
8649 -2%
8674 -2%
8696 -2%
8746 -1%
8769 -1%
AMD Radeon HD 6755G2
8810 0%
8816 0%
NVIDIA GeForce 9600M GS
8844
AMD Radeon R4 (Stoney Ridge)
8856 0%
Intel UHD Graphics Xe 750 32EUs (Rocket Lake)
8935 1%
9070 3%
9075 3%
9102 3%
9173 4%
9212 4%
9295 5%
9472 7%
...
68868 679%
max:
87172 886%
0%
100%
Restrict / Search: Model: Max. age: years
3DMark 06 3DMark 06 - Score Unknown Settings +
3DMark 06
min: 3200     media: 3600     media: 3600 (5%)     massimo: 4000 punti
3DMark 06 - Standard 1280x1024 +
3DMark 06
min: 3965     media: 4383     media: 4382.5 (6%)     massimo: 4800 Points
3DMark 06 - Standard 1280x800 +
3DMark 06
min: 3808     media: 4506     media: 4506 (6%)     massimo: 5204 Points
3DMark 06 - Standard 1280x768 +
3DMark 06
min: 2102     media: 3211     media: 3210.5 (4%)     massimo: 4319 Points
Cinebench R10 Cinebench R10 Shading (32bit) +
Cinebench R10 - Cinebench R10 Shading (32bit)
min: 2963     media: 3076     media: 3076 (2%)     massimo: 3189 punti
- Valori di benchmark per questa scheda grafica
red legend - Valori medi di benchmark per questa scheda grafica
* Numeri più piccoli rappresentano prestazioni supeiori

Benchmarks per i giochi

I seguenti benchmarks deirivano dai benchmarks dei portatili recensiti. Le prestazioni dipendono dalla scheda grafica utilizzata, dal clock rate, dal processore, dai settaggi di sistema, dai drivers, e dai sistemi operativi. Quindi i risultati non sono rappresentativi per i portatili con questa GPU. Per informazioni dettagliate sui risultati del benchmark, cliccate sul numero di fps.

F.E.A.R. 2

F.E.A.R. 2

2009
basso 800x600
98.8  fps    + Confronta
medio 1024x768
32.4  fps    + Confronta
» Giocabile con tutti i portatili testati con dettagli basso.
Racedriver: GRID

Racedriver: GRID

2008
basso 800x600
50.7  fps    + Confronta
medio 1024x768
31.3  fps    + Confronta
» Giocabile con tutti i portatili testati con dettagli basso.
Call of Duty 4 - Modern Warfare

Call of Duty 4 - Modern Warfare

2007
basso 800x600
118  fps    + Confronta
medio 1024x768
38.9  fps    + Confronta
» Giocabile con tutti i portatili testati con dettagli medio.
Crysis - GPU Benchmark

Crysis - GPU Benchmark

2007
basso 1024x768
54.4 70.2 ~ 62 fps    + Confronta
medio 1024x768
19.3 23 ~ 21 fps    + Confronta
alto 1024x768
13.4  fps    + Confronta
» Giocabile con tutti i portatili testati con dettagli basso.
Additional Benchmarks
High 800x600
17.3
Low 0xAF 0xAA 800x600
60.4
Med 0xAF 0xAA 800x600
28.2
Very High 1024x768
7.3
Crysis - CPU Benchmark

Crysis - CPU Benchmark

2007
basso 1024x768
49.9 52.7 ~ 51 fps    + Confronta
medio 1024x768
22.1 23.2 ~ 23 fps    + Confronta
alto 1024x768
12.7  fps    + Confronta
» Giocabile con tutti i portatili testati con dettagli basso.
Additional Benchmarks
Med 0xAF 0xAA 800x600
27.2
Low 0xAF 0xAA 800x600
59.4
High 0xAF 0xAA 800x600
16.1
Very High 1024x768
6.9
F.E.A.R.

F.E.A.R.

2005
basso 640x480
281  fps    + Confronta
medio 800x600
29  fps    + Confronta
alto 1024x768
28  fps    + Confronta
» Giocabile con tutti i portatili testati con dettagli basso.
Quake 3 Arena - Timedemo

Quake 3 Arena - Timedemo

1999
alto 1024x768
453.5  fps    + Confronta
» Giocabile con tutti i portatili testati con dettagli alto.
bassomedioaltoultraQHD4K
F.E.A.R. 298.832.37
Racedriver: GRID50.731.32
Call of Duty 4 - Modern Warfare11838.89
Crysis - GPU Benchmark622113.43
Crysis - CPU Benchmark512312.68
F.E.A.R.2812928
Quake 3 Arena - Timedemo453.5
bassomedioaltoultraQHD4K
< 30 fps
< 60 fps
< 120 fps
≥ 120 fps

2
3
1
3
3

3


1


Per conoscere altri giochi che potrebbero essere utilizzabili e per una lista completa di tutti i giochi e delle schede grafiche visitate la nostra Gaming List

Amazon Logo
  • $1,353.61
    ASUS ROG Strix G16 (2025) Gaming Laptop, 16” FHD+ 16:10 165Hz/3ms, NVIDIA® GeForce RTX™ 5060, Intel® Core™ i7 Processor 14650HX, 16GB DDR5, 1TB Gen 4 SSD, Wi-Fi 7, Windows 11 Home, G615JMR-AS74
  • $818.99
    HP Victus 15.6" Full HD 144Hz Gaming Laptop, Intel Core i5-12450H, NVIDIA GeForce RTX 3050,16GB RAM, 512GB PCIe SSD, Wi-Fi 6, Backlit Keyboard,Windows 11 Pro, Performance Blue
  • $899.00
    msi Thin Gaming Laptop, 15.6" FHD 144Hz, Intel i5-13420H, NVIDIA Geforce RTX 4050, 16GB RAM, 512GB NVMe SSD, Windows 11 Pro, Gray
  • $1,299.99
    ASUS ROG Strix G16 (2025) Gaming Laptop, 16” FHD+ 16:10 165Hz/3ms, NVIDIA® GeForce RTX™ 5050, Intel® Core™ i5-13450HX, 16GB DDR5-5600, 1TB PCIe Gen 4 SSD, Wi-Fi 7, Windows 11 Home, G615JH-DS54
  • $1,091.55
    GIGABYTE - Gaming A16 Gaming Laptop - 165Hz 1920x1200 WUXGA - NVIDIA GeForce RTX 5060 - Intel i7-13620H - 1TB SSD with 16GB DDR5 RAM - Windows 11 Home AD Gaming A16 CVHI3US894SH

v1.35
log 16. 12:53:18

#0 ran 0s before starting gpusingle class +0s ... 0s

#1 no ids found in url (should be separated by "_") +0s ... 0s

#2 not redirecting to Ajax server +0s ... 0s

#3 did not recreate cache, as it is less than 5 days old! Created at Thu, 16 Jul 2026 05:32:19 +0200 +0.006s ... 0.006s

#4 no comparison url found in template nbc.compare_page_1 needed +0.015s ... 0.021s

#5 no comparison url found in template nbc.compare_page_1 needed +0s ... 0.021s

#6 composed specs +0s ... 0.021s

#7 did output specs +0s ... 0.021s

#8 start showIntegratedCPUs +0s ... 0.021s

#9 getting avg benchmarks for device 751 +0.021s ... 0.043s

#10 got single benchmarks 751 +0.025s ... 0.067s

#11 got avg benchmarks for devices +0s ... 0.067s

#12 min, max, avg, median took s +0.402s ... 0.469s

#13 before gaming benchmark output +0s ... 0.469s

#14 Got 20 rows for game benchmarks. +0.002s ... 0.471s

#15 composed SQL query for gamebenchmarks +0s ... 0.471s

#16 got data and put it in $dataArray +0.003s ... 0.474s

#17 benchmarks composed for output. +0.071s ... 0.546s

#18 no comparison url found in template nbc.compare_page_1 needed +0.54s ... 1.086s

#19 return log +0s ... 1.086s

Nessuna recensione trovato per questa scheda grafica

Google LogoAdd as a preferred source on Google
Mail Logo

Classe 1

Classe 2

GeForce RTX 2080 Super Mobile
RTX PRO 2000 Blackwell Generation Laptop
M5 Max 32-Core GPU *
M1 Max 32-Core GPU *
M1 Max 24-Core GPU *
GeForce RTX 2070 Super Mobile
Radeon 8050S
Radeon RX 5700M *
M1 Pro 16-Core GPU *
Radeon PRO W6600M *
GeForce RTX 2070 Super Max-Q
RTX PRO 1000 Blackwell Generation Laptop *
M1 Pro 14-Core GPU *
Radeon 8040S *
Pro A60M *

Classe 3

GeForce RTX 3050 4GB Laptop GPU
Pro A30M
Radeon Pro 5300M
Radeon RX 5300M
GeForce GTX 1050 Ti Mobile
GeForce GTX 1050 Ti Max-Q
Radeon 680M
Arc 130T
GeForce GTX 1050 Max-Q
Radeon 660M
Radeon Pro 560X
Radeon Pro 560
Quadro P620
Radeon RX 550X (Laptop)
Radeon Pro 555X
Radeon Pro 555
Graphics 3-Core iGPU (Arrow Lake) *
Graphics 2-Core iGPU (Arrow Lake) *
Radeon 630
Quadro P520
Radeon 540X *
Vega 10
Vega 9
UHD Graphics 32EUs
UHD Graphics 750
Vega 7
UHD Graphics Xe 32EUs (Tiger Lake-H)
UHD Graphics Xe G4 48EUs
Vega 8
UHD Graphics 730
UHD Graphics 24EUs (Alder Lake-N) *
Radeon 610M *
UHD Graphics Xe 16EUs *
Adreno 690 *
Adreno 685 *
Adreno 680 *

Classe 4

Classe 5

Posizione approssimativa dell'adattatore grafico

Klaus Hinum, 2009-09-25 (Update: 2014-09-19)