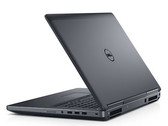
Recensione completa della workstation Dell Precision 7710
Intel Xeon E3-1535M v5 | AMD FirePro W7170M | 17.30" | 3.6 kg

L'AMD FirePro W7170M è una scheda grafica high-end per workstations mobile. Si basa sullo stesso chip Tonga dell'AMD Radeon R9 M390X e sembra avere un clock simile. Pertanto, la scheda si basa sulla terza generazione dell'architettura GCN (GCN 2.0 o chiamata 1.2) e supporta DirectX 12 (FL 12_0).
La serie FirePro offre drivers certificati che sono ottimizzati per la stabilità e le prestazioni con applicazioni professionali come CAD o DCC. Le prestazioni OpenGL, ad esempio, dovrebbero essere nettamente migliori rispetto alle schede grafiche GeForce con specifiche simili.
Le performance dovrebbero essere teoricamente allo stesso livello della Nvidia Quadro M4000M. Nei giochi 3D, la W7170M dovrebbe avere prestazioni simili alla scheda consumer R9 M390X.
Il consumo energetico della W7170M dovrebbe essere simile alle schede Quadro M5000M e M4000M e pertanto intorno ai 100 Watt. Questo significa che è adatat solo per portatili grandi con schermi da 17".
FirePro W Serie
| ||||||||||||||||
| Nome in codice | Tonga | |||||||||||||||
| Architettura | GCN 3 | |||||||||||||||
| Pipelines | 2048 - unified | |||||||||||||||
| Velocità del core | 723 MHz | |||||||||||||||
| Velocità della memoria | 5000 MHz | |||||||||||||||
| Larghezza del bus di memoria | 256 Bit | |||||||||||||||
| Tipo di memoria | GDDR5 | |||||||||||||||
| Max. quantità di memoria | 4 GB | |||||||||||||||
| Memoria condivisa | no | |||||||||||||||
| API | DirectX 12 (FL 12_0), Shader 5.0, OpenGL 4.3 / Vulkan | |||||||||||||||
| Consumo di corrente | 100? Watt | |||||||||||||||
| Transistor Count | 5 Billion | |||||||||||||||
| tecnologia | 28 nm | |||||||||||||||
| Caratteristiche | DirectX 12, OpenCL 1.2, OpenGL 4.3, Vulkan, Mantle, Eyefinity, Enduro, App Acceleration, HD3D | |||||||||||||||
| Dimensione del portatile | grande | |||||||||||||||
| Data dell'annuncio | 02.10.2015 | |||||||||||||||
| Link alla pagina del produttore | www.amd.com | |||||||||||||||
I seguenti benchmarks deirivano dai benchmarks dei portatili recensiti. Le prestazioni dipendono dalla scheda grafica utilizzata, dal clock rate, dal processore, dai settaggi di sistema, dai drivers, e dai sistemi operativi. Quindi i risultati non sono rappresentativi per i portatili con questa GPU. Per informazioni dettagliate sui risultati del benchmark, cliccate sul numero di fps.


| basso | medio | alto | ultra | QHD | 4K | |
|---|---|---|---|---|---|---|
| Anno 2205 | 146 | 93 | 43 | 20 | ||
| The Witcher 3 | 97 | 72 | 31 | 23 | ||
| Dirt Rally | 278 | 187 | 89 | 63 | ||
| F1 2014 | 132 | 111 | 95 | 74 | ||
| Ryse: Son of Rome | 101 | 93 | 43 | 15 | ||
| Middle-earth: Shadow of Mordor | 177 | 126 | 70 | 52 | ||
| GRID: Autosport | 232 | 116 | 99 | 67 | ||
| Thief | 62 | 57 | 57 | 40 | ||
| Total War: Rome II | 185 | 162 | 153 | 36 | ||
| Company of Heroes 2 | 57 | 56 | 55 | 28 | ||
| Metro: Last Light | 120 | 112 | 94 | 44 | ||
| BioShock Infinite | 220 | 178 | 158 | 66 | ||
| Tomb Raider | 375 | 224 | 167 | 51 | ||
| basso | medio | alto | ultra | QHD | 4K | < 30 fps < 60 fps < 120 fps ≥ 120 fps | 1 3 9 | 2 6 5 | 5 5 3 | 4 5 4 | | |
Per conoscere altri giochi che potrebbero essere utilizzabili e per una lista completa di tutti i giochi e delle schede grafiche visitate la nostra Gaming List

Dell Precision 7710: Intel Xeon E3-1535M v5, 17.30", 3.6 kg
Recensioni esterne » Dell Precision 7710
Posizione approssimativa dell'adattatore grafico
I nostri Top 10
» Top 10 Portatili Multimedia
» Top 10 Portatili Gaming
» Top 10 Portatili Gaming Leggeri
» Top 10 Portatili da Ufficio e Business economici
» Top 10 Portatili Premium da Ufficio/Business
» Top 10 Portatili sotto i 300 Euro
» Top 10 Portatili sotto i 500 Euro
» Top 10 dei Portatili Workstation
» Top 10 Subnotebooks
» Top 10 Ultrabooks
» Top 10 Convertibili
» Top 10 Tablets
» Top 10 Tablets Windows
» Top 10 Smartphones