Notebookcheck Logo

AMD Radeon RX 540

AMD Radeon RX 540

L'AMD Radeon RX 540 è una scheda grafica mobile di fascia media per portatili basata sul chip Polaris 12 (molto probabilmente). E' realizzata con un processo 14 nm FinFET migliorato da Globalfoundries. Le performance dovrebbero essere tra la Radeon Pro 450 e la 455 del MacBook Pro 2016 che pure si basa sull'architettura Polaris. AMD dichiara per la RX 450 1.2 TFLOPS (Pro 450 1 TFLOP, Pro 455 1.3 TFLOPs). Rispetto alle schede grafiche Nvidia, le prestazioni gaming dovrebbero attestarsi tra la GeForce GTX 950M e la GTX 960M.

Le features della Radeon RX 540 sono identiche alla più veloce RX 460 e a tutti gli altri chips Polaris. Trovate maggiori dettagli sull'architettura Polaris qui.

Lo sviluppo di potenza della più veloce Radeon Pro 460 è di 35 Watt secondo il blog AMD. A causa delle specifiche più basse, la Radeon RX 540 consuma leggermente meno.

Radeon RX 500 Serie

Radeon RX 590 2304 @ 1.47 - 1.55 GHz256 Bit @ 8000 MHz
Radeon RX 580 2304 @ 1.26 - 1.34 GHz256 Bit @ 8000 MHz
Radeon RX 570 2048 @ 1.17 - 1.24 GHz256 Bit @ 7000 MHz
Radeon RX 580 (Laptop) 2304 @ 1 - 1.08 GHz256 Bit @ 8000 MHz
Radeon RX 570 (Laptop) 2048 @ 0.93 - 1.21 GHz256 Bit @ 7000 MHz
Radeon RX 560X (Laptop) 1024 @ 1.17 - 1.28 GHz128 Bit @ 6000 MHz
Radeon RX 560 (Laptop) 1024 @ 1.09 - 1.29 GHz128 Bit @ 6000 MHz
Radeon RX 550 (Laptop) 640 @ 1.29 - 1.48 GHz128 Bit @ 6000 MHz
Radeon RX 540X 512 @ 1.22 GHz128 Bit @ 6000 MHz
Radeon RX 540 512 @ 1.22 GHz128 Bit @ 6000 MHz
Nome in codicePolaris 12
ArchitetturaPolaris
Pipelines512 - unified
Velocità del core1219 (Boost) MHz
Velocità della memoria6000 MHz
Larghezza del bus di memoria128 Bit
Tipo di memoriaGDDR5
Max. quantità di memoria4 GB
Memoria condivisano
APIDirectX 12, OpenGL Vulkan
Consumo di corrente75 Watt
tecnologia14 nm
CaratteristicheDisplayPort 1.3 HBR / 1.4 HDR Ready, HDMI 2.0, AMD FreeSync
Dimensione del portatilegrande
Data dell'annuncio21.03.2017
Link alla pagina del produttorewww.amd.com

Benchmark

Performance Rating - 3DMark 11 + Fire Strike + Time Spy
1.7 pt (5%)
3DMark - 3DMark Time Spy Score
min: 643     media: 869     media: 869 (3%)     massimo: 1095 Points
3DMark - 3DMark Time Spy Graphics
min: 566     media: 787     media: 787 (2%)     massimo: 1008 Points
113 -86%
...
Intel Iris Plus Graphics G4 (Ice Lake 48 EU)
639 -19%
650 -17%
Intel UHD Graphics Xe 32EUs (Tiger Lake-H)
670 -15%
AMD Radeon RX Vega 8 (Ryzen 2000/3000)
673 -14%
AMD Radeon RX Vega 10
724 -8%
733 -7%
Intel Iris Plus Graphics G7 (Ice Lake 64 EU)
744 -5%
758 -4%
Intel UHD Graphics Xe G4 48EUs
763 -3%
AMD Radeon RX 540
787
796 1%
AMD Radeon 540X
797 1%
Qualcomm Adreno 690
811 3%
AMD Radeon Pro WX 3100
820 4%
821 4%
862 10%
AMD Radeon RX Vega 9
872 11%
936 19%
AMD Radeon Pro 450
952 21%
...
19434 2369%
max:
36485 4536%
0%
100%
3DMark - 3DMark Ice Storm Unlimited Graphics
138197 Points (16%)
3DMark - 3DMark Ice Storm Extreme Graphics
67875 Points (9%)
3DMark - 3DMark Cloud Gate Score
min: 9431     media: 12236     media: 12853.5 (14%)     massimo: 13804 Points
3DMark - 3DMark Cloud Gate Graphics
min: 18704     media: 23165     media: 24170 (6%)     massimo: 25616 Points
3DMark - 3DMark Fire Strike Standard Score
min: 2495     media: 3053     media: 3059 (5%)     massimo: 3488 Points
3DMark - 3DMark Fire Strike Standard Graphics
min: 3242     media: 3623     media: 3686 (4%)     massimo: 3876 Points
3DMark - 3DMark Ice Storm Graphics
min: 83467     media: 89575     media: 89574.5 (11%)     massimo: 95682 Points
3DMark 11 - 3DM11 Performance Score
min: 3783     media: 4673     media: 4664 (6%)     massimo: 5273 Points
3DMark 11 - 3DM11 Performance GPU
min: 4443     media: 4699     media: 4646 (4%)     massimo: 4983 Points
171.8 -96%
...
4348 -7%
AMD Radeon RX Vega 9
4380 -7%
4404 -6%
AMD Radeon Pro 450
4502 -4%
4554 -3%
4634 -1%
NVIDIA Quadro P600
4655 -1%
4678 0%
4698 0%
AMD Radeon RX 540
4699
4787 2%
4894 4%
4913 5%
4957 5%
4974 6%
AMD Radeon RX Vega 7
5054 8%
5134 9%
5167 10%
AMD Radeon Pro 555
5185 10%
...
59943 1176%
max:
106023 2156%
0%
100%
3DMark Vantage
3DM Vant. Perf. total +
3DMark Vantage - 3DM Vant. Perf. total
min: 12248     media: 13720     media: 13719.5 (4%)     massimo: 15191 Points
3DM Vant. Perf. GPU no PhysX +
3DMark Vantage - 3DM Vant. Perf. GPU no PhysX
min: 11597     media: 12907     media: 12906.5 (7%)     massimo: 14216 Points
62 -100%
...
11600 -10%
11620 -10%
12199 -5%
12290 -5%
12456 -3%
12567 -3%
12606 -2%
AMD Radeon Pro 450
12634 -2%
Intel Iris Plus Graphics G7 (Ice Lake 64 EU)
12715 -1%
AMD Radeon RX 540
12907
13008 1%
13156 2%
AMD Radeon RX 550X (Laptop)
13209 2%
13296 3%
13341 3%
13403 4%
13518 5%
13716 6%
14047 9%
...
132443 926%
max:
170928 1224%
0%
100%
3DMark 05 - 3DMark 05 - Standard
20313 Points (22%)
Intel Graphics Media Accelerator (GMA) 500
133.4 -99%
...
18965 -7%
19079 -6%
19100 -6%
19187 -6%
19268 -5%
Intel Iris Plus Graphics G4 (Ice Lake 48 EU)
19383 -5%
Intel UHD Graphics Xe 16EUs (Tiger Lake-H)
19694 -3%
19971 -2%
20171 -1%
AMD Radeon RX 540
20313
20551 1%
20818 2%
20861 3%
20882 3%
20968 3%
21013 3%
21185 4%
AMD Radeon R7 M445
21189 4%
21266 5%
...
61850 204%
max:
87172 329%
0%
100%
3DMark 06 3DMark 06 - Standard 1280x1024 +
3DMark 06
min: 14964     media: 16481     media: 15818 (21%)     massimo: 18661 Points
Unigine Valley 1.0 - Unigine Valley 1.0 DX
19.3 fps (6%)
Unigine Heaven 3.0 - Unigine Heaven 3.0 DX 11
31.2 fps (10%)
Unigine Heaven 3.0 - Unigine Heaven 3.0 OpenGL
17.3 fps (8%)
Unigine Heaven 2.1 - Heaven 2.1 high
min: 31.9     media: 39.8     media: 39.8 (7%)     massimo: 47.6 fps
0.6 -98%
...
Intel Iris Plus Graphics G4 (Ice Lake 48 EU)
36.4 -8%
36.8 -7%
AMD Radeon Pro WX 3100
36.8 -7%
37 -7%
37.4 -6%
37.5 -6%
37.81 -5%
39.1 -2%
39.5 -1%
AMD Radeon RX 540
39.75
40.2 1%
40.9 3%
AMD Radeon 540X
41.3 4%
41.7 5%
41.87 5%
41.95 6%
42.5 7%
43.3 9%
43.95 11%
...
532 1238%
0%
100%
Cinebench R10 Cinebench R10 Shading (32bit) +
Cinebench R10 - Cinebench R10 Shading (32bit)
min: 8002     media: 9285     media: 9285 (7%)     massimo: 10568 punti
Cinebench R11.5 Cinebench R11.5 OpenGL 64 Bit +
Cinebench R11.5 - Cinebench R11.5 OpenGL 64 Bit
min: 70.1     media: 86.4     media: 94 (33%)     massimo: 95 fps
Cinebench R15
Cinebench R15 OpenGL 64 Bit +
Cinebench R15 - Cinebench R15 OpenGL 64 Bit
min: 72.7     media: 76.8     media: 76.4 (4%)     massimo: 81.1 fps
Cinebench R15 OpenGL Ref. Match 64 Bit +
Cinebench R15 - Cinebench R15 OpenGL Ref. Match 64 Bit
98 % (98%)
GFXBench - GFXBench Car Chase Offscreen
31.8 fps (4%)
GFXBench 3.1 - GFXBench Manhattan ES 3.1 Offscreen
46.1 fps (1%)
LuxMark v2.0 64Bit - LuxMark v2.0 Room GPU
min: 414     media: 430.5     media: 430.5 (2%)     massimo: 447 Samples/s
LuxMark v2.0 64Bit - LuxMark v2.0 Sala GPU
min: 811     media: 858     media: 858 (2%)     massimo: 905 Samples/s
ComputeMark v2.1 - ComputeMark v2.1 Result
min: 990     media: 1565     media: 998 (1%)     massimo: 2708 punti
Power Consumption - The Witcher 3 Power Consumption - external Monitor *
min: 57.5     media: 58.2     media: 58.2 (8%)     massimo: 58.8 Watt
Power Consumption - Witcher 3 Power Consumption *
min: 68.1     media: 68.6     media: 68.6 (15%)     massimo: 69.1 Watt
Power Consumption - Witcher 3 ultra Power Efficiency
0.1 fps per Watt (9%)
Power Consumption - Witcher 3 ultra Power Efficiency - external Monitor
0.1 fps per Watt (8%)
- Valori di benchmark per questa scheda grafica
- Valori medi di benchmark per questa scheda grafica
* Numeri più piccoli rappresentano prestazioni supeiori

Benchmarks per i giochi

I seguenti benchmarks deirivano dai benchmarks dei portatili recensiti. Le prestazioni dipendono dalla scheda grafica utilizzata, dal clock rate, dal processore, dai settaggi di sistema, dai drivers, e dai sistemi operativi. Quindi i risultati non sono rappresentativi per i portatili con questa GPU. Per informazioni dettagliate sui risultati del benchmark, cliccate sul numero di fps.

Anno 1800

Anno 1800

2019
basso 1280x720
54  fps    + Confronta
medio 1920x1080
18  fps    + Confronta
alto 1920x1080
11  fps    + Confronta
» Giocabile con tutti i portatili testati con dettagli basso.
basso 1280x720
56  fps    + Confronta
medio 1920x1080
39  fps    + Confronta
alto 1920x1080
37  fps    + Confronta
ultra 1920x1080
8  fps    + Confronta
» Giocabile con tutti i portatili testati con dettagli alto.
Anthem

Anthem

2019
basso 1280x720
24  fps    + Confronta
medio 1920x1080
20  fps    + Confronta
alto 1920x1080
17  fps    + Confronta
» Il Benchmark indica che il gioco non è utilizzabile con i settaggi testati.
basso 1280x720
40  fps    + Confronta
medio 1920x1080
18  fps    + Confronta
alto 1920x1080
17  fps    + Confronta
ultra 1920x1080
16  fps    + Confronta
» Giocabile con tutti i portatili testati con dettagli basso.
basso 1280x720
63  fps    + Confronta
medio 1920x1080
31  fps    + Confronta
alto 1920x1080
29  fps    + Confronta
ultra 1920x1080
21  fps    + Confronta
» Giocabile con tutti i portatili testati con dettagli basso.
Hitman 2

Hitman 2

2018
basso 1280x720
29  fps    + Confronta
medio 1920x1080
18  fps    + Confronta
alto 1920x1080
12  fps    + Confronta
ultra 1920x1080
8  fps    + Confronta
» Il Benchmark indica che il gioco non è utilizzabile con i settaggi testati.
basso 1280x720
55  fps    + Confronta
medio 1920x1080
26  fps    + Confronta
alto 1920x1080
21  fps    + Confronta
ultra 1920x1080
16  fps    + Confronta
» Giocabile con tutti i portatili testati con dettagli basso.
F1 2018

F1 2018

2018
basso 1280x720
62  fps    + Confronta
medio 1920x1080
40  fps    + Confronta
alto 1920x1080
28  fps    + Confronta
ultra 1920x1080
21  fps    + Confronta
» Giocabile con tutti i portatili testati con dettagli medio.
basso 1280x720
60  fps    + Confronta
medio 1920x1080
25  fps    + Confronta
alto 1920x1080
21  fps    + Confronta
ultra 1920x1080
17  fps    + Confronta
» Giocabile con tutti i portatili testati con dettagli basso.
Far Cry 5

Far Cry 5

2018
basso 1280x720
32 42 ~ 37 fps    + Confronta
medio 1920x1080
12 25 ~ 19 fps    + Confronta
alto 1920x1080
21  fps    + Confronta
ultra 1920x1080
17  fps    + Confronta
» Giocabile con la maggior parte dei portatili testati con dettagli basso.
basso 1280x720
29.8  fps    + Confronta
medio 1920x1080
23.3  fps    + Confronta
alto 1920x1080
19.7  fps    + Confronta
» Il Benchmark indica che il gioco non è utilizzabile con i settaggi testati.
basso 1280x720
32.8 41 ~ 37 fps    + Confronta
medio 1920x1080
11.1 15 ~ 13 fps    + Confronta
alto 1920x1080
8.4 12 ~ 10 fps    + Confronta
ultra 1920x1080
7  fps    + Confronta
» Giocabile con la maggior parte dei portatili testati con dettagli basso.
basso 1280x720
11 24.5 ~ 18 fps    + Confronta
medio 1920x1080
3 9.2 ~ 6 fps    + Confronta
alto 1920x1080
2 4.1 ~ 3 fps    + Confronta
» Il Benchmark indica che il gioco non è utilizzabile con i settaggi testati.
Fortnite

Fortnite

2018
basso 1280x720
89.2 180 ~ 135 fps    + Confronta
medio 1920x1080
22.1 70 ~ 46 fps    + Confronta
alto 1920x1080
13.3 55 ~ 34 fps    + Confronta
ultra 1920x1080
9.4 35 ~ 22 fps    + Confronta
» Giocabile con la maggior parte dei portatili testati con dettagli medio.
basso 1280x720
42.9  fps    + Confronta
medio 1920x1080
11.2  fps    + Confronta
alto 1920x1080
9.1  fps    + Confronta
» Giocabile con tutti i portatili testati con dettagli basso.
basso 1280x720
25  fps    + Confronta
medio 1920x1080
13.9  fps    + Confronta
alto 1920x1080
10.7  fps    + Confronta
» Il Benchmark indica che il gioco non è utilizzabile con i settaggi testati.
basso 1280x720
62.8  fps    + Confronta
medio 1920x1080
27.7  fps    + Confronta
alto 1920x1080
12.8  fps    + Confronta
» Giocabile con tutti i portatili testati con dettagli basso.
basso 1280x720
22 55 ~ 39 fps    + Confronta
medio 1920x1080
10 29 ~ 20 fps    + Confronta
alto 1920x1080
22  fps    + Confronta
ultra 1920x1080
15  fps    + Confronta
» Giocabile con la maggior parte dei portatili testati con dettagli basso.
Destiny 2

Destiny 2

2017
basso 1280x720
34.4  fps    + Confronta
medio 1920x1080
18.8  fps    + Confronta
alto 1920x1080
15.5  fps    + Confronta
» Il Benchmark indica che il gioco non è utilizzabile con i settaggi testati.
ELEX

ELEX

2017
basso 1280x720
30.3  fps    + Confronta
medio 1920x1080
15.3  fps    + Confronta
alto 1920x1080
10.9  fps    + Confronta
» Il Benchmark indica che il gioco non è utilizzabile con i settaggi testati.
basso 1280x720
25.7  fps    + Confronta
medio 1920x1080
11.1  fps    + Confronta
alto 1920x1080
9.8  fps    + Confronta
» Il Benchmark indica che il gioco non è utilizzabile con i settaggi testati.
basso 1280x720
39 98 ~ 69 fps    + Confronta
medio 1920x1080
14 39 ~ 27 fps    + Confronta
alto 1920x1080
10 27 ~ 19 fps    + Confronta
ultra 1920x1080
20  fps    + Confronta
» Giocabile con tutti i portatili testati con dettagli basso.
FIFA 18

FIFA 18

2017
basso 1280x720
115.8  fps    + Confronta
medio 1920x1080
54.8  fps    + Confronta
alto 1920x1080
40.2  fps    + Confronta
ultra 1920x1080
40  fps    + Confronta
» Giocabile con tutti i portatili testati con dettagli ultra.
basso 1280x720
40.6  fps    + Confronta
medio 1920x1080
10.5  fps    + Confronta
alto 1920x1080
10.4  fps    + Confronta
» Giocabile con tutti i portatili testati con dettagli basso.
F1 2017

F1 2017

2017
basso 1280x720
55 92 ~ 74 fps    + Confronta
medio 1920x1080
22 40 ~ 31 fps    + Confronta
alto 1920x1080
16 28 ~ 22 fps    + Confronta
ultra 1920x1080
21  fps    + Confronta
» Giocabile con tutti i portatili testati con dettagli basso.
Additional Benchmarks
Medium Preset 4xAF 1366x768
68
basso 1280x720
52 75 ~ 64 fps    + Confronta
medio 1920x1080
14.2 31 ~ 23 fps    + Confronta
alto 1920x1080
13.4 26 ~ 20 fps    + Confronta
ultra 1920x1080
19  fps    + Confronta
» Giocabile con tutti i portatili testati con dettagli basso.
Additional Benchmarks
Medium Preset 1366x768
46
basso 1280x720
65.5  fps    + Confronta
medio 1366x768
63  fps    + Confronta
alto 1920x1080
60  fps    + Confronta
ultra 1920x1080
54  fps    + Confronta
» Giocabile con tutti i portatili testati con dettagli ultra.
Dirt 4

Dirt 4

2017
basso 1280x720
103.9 150 ~ 127 fps    + Confronta
medio 1920x1080
32.7 63 ~ 48 fps    + Confronta
alto 1920x1080
18.2 42 ~ 30 fps    + Confronta
ultra 1920x1080
9.8 27 ~ 18 fps    + Confronta
» Giocabile con la maggior parte dei portatili testati con dettagli medio.
Additional Benchmarks
Medium Preset 4xAF 1366x768
79
basso 1280x720
152.9 182 ~ 167 fps    + Confronta
medio 1920x1080
53 86 ~ 70 fps    + Confronta
alto 1920x1080
31 58 ~ 45 fps    + Confronta
» Giocabile con la maggior parte dei portatili testati con dettagli alto.
Additional Benchmarks
Performance 1920x1080
102
Prey

Prey

2017
basso 1280x720
92.2 108 ~ 100 fps    + Confronta
medio 1920x1080
38.9 71 ~ 55 fps    + Confronta
alto 1920x1080
25.3 58 ~ 42 fps    + Confronta
ultra 1920x1080
18.7 40 ~ 29 fps    + Confronta
» Giocabile con la maggior parte dei portatili testati con dettagli alto.
Additional Benchmarks
Medium Preset 4xAF FXAA 1366x768
91
basso 1280x720
51.4  fps    + Confronta
medio 1920x1080
24.6  fps    + Confronta
alto 1920x1080
22.2  fps    + Confronta
ultra 1920x1080
20  fps    + Confronta
» Giocabile con tutti i portatili testati con dettagli basso.
basso 1280x720
70  fps    + Confronta
medio 1920x1080
34  fps    + Confronta
alto 1920x1080
20  fps    + Confronta
ultra 1920x1080
15  fps    + Confronta
» Giocabile con tutti i portatili testati con dettagli basso.
Additional Benchmarks
Medium Preset (Resolution Scale Mode off) FXAA 1366x768
58
For Honor

For Honor

2017
basso 1280x720
64  fps    + Confronta
medio 1920x1080
20.5  fps    + Confronta
alto 1920x1080
18.9  fps    + Confronta
ultra 1920x1080
14.8  fps    + Confronta
» Giocabile con tutti i portatili testati con dettagli basso.
basso 1280x720
84.9 135 ~ 110 fps    + Confronta
medio 1920x1080
34.6 61 ~ 48 fps    + Confronta
alto 1920x1080
18.8 36 ~ 27 fps    + Confronta
ultra 1920x1080
10.4 15 ~ 13 fps    + Confronta
» Giocabile con la maggior parte dei portatili testati con dettagli medio.
Additional Benchmarks
Medium / Off FXAA 1366x768
88
basso 1280x720
45  fps    + Confronta
medio 1366x768
29  fps    + Confronta
alto 1920x1080
31  fps    + Confronta
ultra 1920x1080
18  fps    + Confronta
» Giocabile con tutti i portatili testati con dettagli basso.
Additional Benchmarks
Medium Preset TXAA 1920x1080
22
basso 1280x720
99.7 174 ~ 137 fps    + Confronta
medio 1366x768
49.9 137 ~ 93 fps    + Confronta
alto 1920x1080
22.8 70 ~ 46 fps    + Confronta
ultra 1920x1080
59  fps    + Confronta
» Giocabile con tutti i portatili testati con dettagli ultra.
Additional Benchmarks
Medium Preset 1920x1080
89
basso 1280x720
54.2  fps    + Confronta
medio 1366x768
30.8  fps    + Confronta
alto 1920x1080
12.2  fps    + Confronta
ultra 1920x1080
10.7  fps    + Confronta
» Giocabile con tutti i portatili testati con dettagli basso.
basso 1024x768
74  fps    + Confronta
medio 1366x768
52  fps    + Confronta
alto 1920x1080
32  fps    + Confronta
ultra 1920x1080
23  fps    + Confronta
» Giocabile con tutti i portatili testati con dettagli medio.
Additional Benchmarks
Medium Preset 1920x1080
40
Mafia 3

Mafia 3

2016
basso 1280x720
42  fps    + Confronta
medio 1366x768
32  fps    + Confronta
alto 1920x1080
22  fps    + Confronta
» Giocabile con tutti i portatili testati con dettagli basso.
Additional Benchmarks
Medium Preset 1920x1080
25
basso 1280x720
40 48 ~ 44 fps    + Confronta
medio 1366x768
26.8 35 ~ 31 fps    + Confronta
alto 1920x1080
14 19 ~ 17 fps    + Confronta
ultra 1920x1080
9  fps    + Confronta
» Giocabile con tutti i portatili testati con dettagli basso.
Additional Benchmarks
Medium Preset 2xAF 1920x1080
22
Overwatch

Overwatch

2016
basso 1280x720
83.6 95 ~ 89 fps    + Confronta
medio 1366x768
50.9 78 ~ 64 fps    + Confronta
alto 1920x1080
32 52 ~ 42 fps    + Confronta
ultra 1920x1080
18.3 36 ~ 27 fps    + Confronta
» Giocabile con la maggior parte dei portatili testati con dettagli alto.
Additional Benchmarks
Medium (Render Scale 100 %) 2xAF FXAA 1920x1080
63
Doom

Doom

2016
basso 1280x720
29.7 70 ~ 50 fps    + Confronta
medio 1366x768
23.5 54 ~ 39 fps    + Confronta
alto 1920x1080
12.5 28 ~ 20 fps    + Confronta
ultra 1920x1080
25  fps    + Confronta
» Giocabile con la maggior parte dei portatili testati con dettagli medio.
Additional Benchmarks
Medium Preset 1920x1080
40
basso 1280x768
36  fps    + Confronta
medio 1920x1080
12.5 20 ~ 16 fps    + Confronta
alto 1920x1080
11.4 18 ~ 15 fps    + Confronta
» Giocabile con tutti i portatili testati con dettagli basso.
basso 1280x720
53  fps    + Confronta
medio 1366x768
47  fps    + Confronta
alto 1920x1080
20  fps    + Confronta
ultra 1920x1080
19  fps    + Confronta
» Giocabile con tutti i portatili testati con dettagli medio.
Additional Benchmarks
Medium / Off 4xAF 1920x1080
37
basso 1280x720
43.7  fps    + Confronta
medio 1366x768
21.2  fps    + Confronta
alto 1920x1080
9.9  fps    + Confronta
» Giocabile con tutti i portatili testati con dettagli basso.
basso 1024x768
50.8 59 ~ 55 fps    + Confronta
medio 1366x768
21.6 38 ~ 30 fps    + Confronta
alto 1920x1080
11.3 20 ~ 16 fps    + Confronta
ultra 1920x1080
9 16 ~ 13 fps    + Confronta
» Giocabile con tutti i portatili testati con dettagli basso.
basso 1024x768
105.5  fps    + Confronta
medio 1366x768
56.3  fps    + Confronta
alto 1920x1080
28  fps    + Confronta
ultra 1920x1080
21.1  fps    + Confronta
» Giocabile con tutti i portatili testati con dettagli medio.
basso 1366x768
93.7  fps    + Confronta
medio 1366x768
62.1  fps    + Confronta
alto 1920x1080
32.7  fps    + Confronta
ultra 1920x1080
25.2  fps    + Confronta
» Giocabile con tutti i portatili testati con dettagli medio.
basso 1280x720
74.4  fps    + Confronta
medio 1366x768
62.5  fps    + Confronta
alto 1920x1080
47.1  fps    + Confronta
ultra 1920x1080
38.3  fps    + Confronta
» Giocabile con tutti i portatili testati con dettagli ultra.
basso 1024x768
48 50.8 ~ 49 fps    + Confronta
medio 1366x768
29.3 37 39 ~ 35 fps    + Confronta + 📈 Graph
alto 1920x1080
8 13.2 ~ 11 fps    + Confronta
ultra 1920x1080
6 7.8 ~ 7 fps    + Confronta + 📈 Graph
» Giocabile con tutti i portatili testati con dettagli basso.
GTA V

GTA V

2015
basso 1024x768
74.9  fps    + Confronta
medio 1366x768
63.7  fps    + Confronta
alto 1920x1080
16.7  fps    + Confronta
ultra 1920x1080
6.2  fps    + Confronta
» Giocabile con tutti i portatili testati con dettagli medio.
Thief

Thief

2014
basso 1024x768
63  fps    + Confronta
medio 1366x768
50.3  fps    + Confronta
alto 1366x768
44.4  fps    + Confronta
ultra 1920x1080
38  fps    + Confronta
» Giocabile con tutti i portatili testati con dettagli ultra.
basso 1280x720
147 150.7 ~ 149 fps    + Confronta
medio 1366x768
74.9 78 ~ 76 fps    + Confronta
alto 1366x768
61 62.3 ~ 62 fps    + Confronta
ultra 1920x1080
18.2 36 ~ 27 fps    + Confronta
» Giocabile con tutti i portatili testati con dettagli alto.
basso 1024x768
139 145 ~ 142 fps    + Confronta
medio 1366x768
62 75.9 ~ 69 fps    + Confronta
alto 1366x768
59.5 61 ~ 60 fps    + Confronta
ultra 1920x1080
29.7 34 ~ 32 fps    + Confronta
» Giocabile con tutti i portatili testati con dettagli alto.
bassomedioaltoultraQHD4K
Anno 1800541811
The Division 25639378
Anthem242017
Far Cry New Dawn40181716
Battlefield V63312921
Hitman 22918128
Shadow of the Tomb Raider55262116
F1 201862402821
Monster Hunter World60252117
Far Cry 537192117
X-Plane 11.1129.823.319.7
Kingdom Come: Deliverance3713107
Final Fantasy XV Benchmark1863
Fortnite135463422
Star Wars Battlefront 242.911.29.1
Need for Speed Payback2513.910.7
Call of Duty WWII62.827.712.8
Assassin´s Creed Origins39202215
Destiny 234.418.815.5
ELEX30.315.310.9
The Evil Within 225.711.19.8
Middle-earth: Shadow of War69271920
FIFA 18115.854.840.240
Ark Survival Evolved40.610.510.4
F1 201774312221
Playerunknown's Battlegrounds (PUBG)64232019
Team Fortress 265.5636054
Dirt 4127483018
Rocket League1677045
Prey100554229
Warhammer 40.000: Dawn of War III51.424.622.220
Mass Effect Andromeda70342015
For Honor6420.518.914.8
Resident Evil 7110482713
Dishonored 245293118
Farming Simulator 17137934659
Battlefield 154.230.812.210.7
Civilization VI74523223
Mafia 3423222
Deus Ex Mankind Divided4431179
Overwatch89644227
Doom50392025
Ashes of the Singularity361615
Hitman 201653472019
The Division43.721.29.9
Rise of the Tomb Raider55301613
Rainbow Six Siege105.556.32821.1
World of Warships93.762.132.725.2
Dota 2 Reborn74.462.547.138.3
The Witcher 34935117
GTA V74.963.716.76.2
Thief6350.344.438
BioShock Infinite149766227
Tomb Raider142696032
< 30 fps
< 60 fps
< 120 fps
≥ 120 fps
6
22
20
6
25
20
9
38
13
3
33
6


Per conoscere altri giochi che potrebbero essere utilizzabili e per una lista completa di tutti i giochi e delle schede grafiche visitate la nostra Gaming List

v1.26
log 17. 23:29:48

#0 no ids found in url (should be separated by "_") +0s ... 0s

#1 not redirecting to Ajax server +0s ... 0s

#2 did not recreate cache, as it is less than 5 days old! Created at Sat, 16 Mar 2024 05:38:32 +0100 +0.001s ... 0.001s

#3 no comparison url found in template nbc.compare_page_1 needed +0.059s ... 0.06s

#4 no comparison url found in template nbc.compare_page_1 needed +0s ... 0.06s

#5 no comparison url found in template nbc.compare_page_1 needed +0s ... 0.06s

#6 no comparison url found in template nbc.compare_page_1 needed +0s ... 0.06s

#7 no comparison url found in template nbc.compare_page_1 needed +0s ... 0.06s

#8 no comparison url found in template nbc.compare_page_1 needed +0s ... 0.06s

#9 no comparison url found in template nbc.compare_page_1 needed +0s ... 0.06s

#10 no comparison url found in template nbc.compare_page_1 needed +0s ... 0.06s

#11 no comparison url found in template nbc.compare_page_1 needed +0s ... 0.06s

#12 composed specs +0s ... 0.06s

#13 did output specs +0s ... 0.06s

#14 start showIntegratedCPUs +0s ... 0.06s

#15 getting avg benchmarks for device 7952 +0.029s ... 0.089s

#16 got single benchmarks 7952 +0.023s ... 0.113s

#17 got avg benchmarks for devices +0s ... 0.113s

#18 min, max, avg, median took s +0.667s ... 0.78s

#19 before gaming benchmark output +0s ... 0.78s

#20 Got 271 rows for game benchmarks. +0.022s ... 0.802s

#21 composed SQL query for gamebenchmarks +0s ... 0.802s

#22 got data and put it in $dataArray +0.04s ... 0.842s

#23 benchmarks composed for output. +1.67s ... 2.511s

#24 no comparison url found in template nbc.compare_page_1 needed +0.005s ... 2.516s

#25 return log +0s ... 2.516s

Recensioni Notebook con AMD Radeon RX 540 la scheda grafica

Recensione dell'Intel NUC8i3CYSM

Recensione dell'Intel NUC8i3CYSM

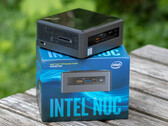
C'è una CPU da 10 nm sul mercato dalla fine del 2018. Intel ha messo un chip basato su Cannon Lake-nel NUC8i3CYSM di Intel, ma ha colto nel segno? L'unità grafi...
Intel Core i3-8121U | AMD Radeon RX 540 | | 660 gr
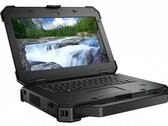
Recensione del Computer Portatile Dell Latitude 7424 Rugged Extreme (i7-8650U, RX540)

Recensione del Computer Portatile Dell Latitude 7424 Rugged Extreme (i7-8650U, RX540)

Il Latitude 7424 Rugged Extreme è un carro armato assoluto. Il Latitude 7424 nasconde un computer professionale in un case a tenuta di polvere e resistente all'...
Intel Core i7-8650U | AMD Radeon RX 540 | 14.00" | 3.5 kg
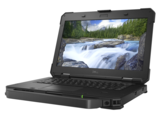
Recensione del Computer Portatile Dell Latitude 5420 Rugged (i7-8650U, AMD RX 540)

Recensione del Computer Portatile Dell Latitude 5420 Rugged (i7-8650U, AMD RX 540)

I notebook rugged non sono noti per i loro profili snelli, ma il Dell Latitude 5420 Rugged cerca di ridurre le cose mantenendo la robustezza della linea Latitud...
Intel Core i7-8650U | AMD Radeon RX 540 | 14.00" | 2.8 kg
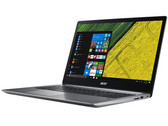
Recensione del Portatile Acer Swift 3 SF315-41G (Ryzen 5 2500U, Radeon RX 540, SSD, FHD)

Recensione del Portatile Acer Swift 3 SF315-41G (Ryzen 5 2500U, Radeon RX 540, SSD, FHD)

Con i freni tirati. Lo Swift 3 SF315-41G è un tuttofare multimediale di Acer che si basa sulla combinazione di un'APU Raven Ridge e di un'unità grafica dedicata...
AMD Ryzen 5 2500U | AMD Radeon RX 540 | 15.60" | 2.2 kg

Dell Latitude 5424 Rugged: Intel Core i5-8350U, 14.00", 2.5 kg
  Recensioni esterne » Dell Latitude 5424 Rugged

Dell Latitude 5420 Rugged, 8650U, RX540: Intel Core i7-8650U, 14.00", 2.2 kg
  Recensioni esterne » Dell Latitude 5420 Rugged, 8650U, RX540

Dell Latitude 7424 Rugged Extreme: Intel Core i7-8650U, 14.00", 3.5 kg
  Recensioni esterne » Dell Latitude 7424 Rugged Extreme, 8650U, RX540

Lenovo IdeaPad 330-15ICN: Intel Core i3-8121U, 15.60", 2 kg
  Recensioni esterne » Lenovo IdeaPad 330-15ICN

Acer Swift 3 SF315-41G-R6BR: AMD Ryzen 5 2500U, 15.60", 2.2 kg
  Recensioni esterne » Acer Swift 3 SF315-41G-R6BR

Lenovo Ideapad 330S-15IKB-81F5009JMX: Intel Core i7-8550U, 15.60", 1.9 kg
  Recensioni esterne » Lenovo Ideapad 330S-15IKB-81F5009JMX

HP EliteBook 840 G5-3JY07ES: Intel Core i7-8550U, 14.00", 1.5 kg
  Recensioni esterne » HP EliteBook 840 G5-3JY07ES

HP EliteBook 850 G5-3RS15UT: Intel Core i7-8550U, 15.60", 1.8 kg
  Recensioni esterne » HP EliteBook 850 G5-3RS15UT

Acer Aspire 5 A515-41G-17E9: AMD FX-9800P, 15.60", 2.2 kg
  Recensioni esterne » Acer Aspire 5 A515-41G-17E9

Samsung Notebook 9 Pro NP940X5M: Intel Core i7-7500U, 15.00", 1.7 kg
  Recensioni esterne » Samsung Notebook 9 Pro NP940X5M-X01US

Please share our article, every link counts!

Classe 0

Arc A380

Classe 1

GeForce RTX 2080 Super Mobile

Classe 2

M1 Max 32-Core GPU *
GeForce RTX 2070 Super Mobile
M1 Max 24-Core GPU *
Radeon RX 5700M *
M1 Pro 16-Core GPU *
Radeon PRO W6600M *
GeForce RTX 2070 Super Max-Q
M1 Pro 14-Core GPU *
Quadro P4200
Quadro P5000 Max-Q *
GeForce RTX 3050 4GB Laptop GPU
Quadro P4000 Max-Q
Radeon RX 580X (Laptop) *
Radeon RX 580 (Laptop)
Radeon Pro 5300M
Radeon RX 5300M
Quadro P3000 Max-Q *
Radeon Pro WX 7100 *
Radeon RX 570X (Laptop) *
Radeon RX 570 (Laptop) *
Radeon RX 470 (Laptop) *

Classe 3

GeForce GTX 1050 Ti Mobile
Radeon 680M
Quadro P2000 Max-Q
Radeon R9 M395X
GeForce GTX 1050 Ti Max-Q *
WX Vega M GL
Radeon R9 M485X
GeForce GTX 1050 Max-Q *
Radeon 660M
Radeon RX 560X (Laptop)
Radeon RX 560 (Laptop)
Radeon Pro 560X
Radeon Pro 560
Radeon Pro 460
Radeon Pro WX 4130 *
Quadro P620 *
Radeon RX 550X (Laptop)
Radeon Pro 555X
Radeon Pro 555
Radeon Pro 455
Quadro P600
Radeon RX 540X *
Radeon Pro WX 2100 *
Radeon Pro WX 3100 *
Radeon Pro 450
Radeon 630
Radeon 540X *
Quadro P520
Quadro P500 *
Iris Plus Graphics G7 (Ice Lake 64 EU) *
Vega 10 *
Iris Pro Graphics 580
Vega 9
FirePro W5130M
UHD Graphics Xe G4 48EUs *
UHD Graphics 32EUs
UHD Graphics Xe 32EUs (Tiger Lake-H) *
UHD Graphics 750
Vega 7
Radeon R7 M465
Vega 8
Iris Plus Graphics G4 (Ice Lake 48 EU)
Quadro M600M
FirePro W4190M
Radeon R7 M445
UHD Graphics 24EUs (Alder Lake-N) *
Radeon R7 M340
Radeon 610M *
UHD Graphics G1 (Ice Lake 32 EU)
UHD Graphics Xe 16EUs (Tiger Lake-H) *
Radeon R5 (Bristol Ridge)
Adreno 690 *
Adreno 685 *
Adreno 680 *

Classe 4

UHD Graphics 730
Radeon R5 M315 *
Radeon R5 M420 *
UHD Graphics 617
UHD Graphics 615
Radeon R4 (Stoney Ridge)
Radeon R2 (Stoney Ridge)
HD Graphics (Broadwell)

Classe 5

Posizione approssimativa dell'adattatore grafico