Recensione del Computer Portatile Dell Latitude 7424 Rugged Extreme (i7-8650U, RX540)

| SD Card Reader | |
| average JPG Copy Test (av. of 3 runs) | |
| Dell Latitude 5420 Rugged-P85G (Toshiba Exceria Pro SDXC 64 GB UHS-II) | |
| Dell Latitude 7424 Rugged Extreme (Toshiba Exceria Pro SDXC 64 GB UHS-II) | |
| Lenovo ThinkPad P52 20MAS03N00 (Toshiba Exceria Pro SDXC 64 GB UHS-II) | |
| Panasonic Toughbook CF-54G2999VM (Toshiba Exceria Pro SDXC 64 GB UHS-II) | |
| Media della classe Workstation (49.6 - 681, n=14, ultimi 2 anni) | |
| Panasonic Toughbook CF-XZ6 (Toshiba Exceria Pro SDXC 64 GB UHS-II) | |
| Getac S410 (Toshiba Exceria Pro SDXC 64 GB UHS-II) | |
| Lenovo ThinkPad T480-20L50010US (Toshiba Exceria Pro SDXC 64 GB UHS-II) | |
| maximum AS SSD Seq Read Test (1GB) | |
| Panasonic Toughbook CF-XZ6 (Toshiba Exceria Pro SDXC 64 GB UHS-II) | |
| Dell Latitude 5420 Rugged-P85G (Toshiba Exceria Pro SDXC 64 GB UHS-II) | |
| Dell Latitude 7424 Rugged Extreme (Toshiba Exceria Pro SDXC 64 GB UHS-II) | |
| Media della classe Workstation (87.6 - 1455, n=14, ultimi 2 anni) | |
| Lenovo ThinkPad P52 20MAS03N00 (Toshiba Exceria Pro SDXC 64 GB UHS-II) | |
| Panasonic Toughbook CF-54G2999VM (Toshiba Exceria Pro SDXC 64 GB UHS-II) | |
| Lenovo ThinkPad T480-20L50010US (Toshiba Exceria Pro SDXC 64 GB UHS-II) | |
| Getac S410 (Toshiba Exceria Pro SDXC 64 GB UHS-II) | |
| |||||||||||||||||||||||||
Distribuzione della luminosità: 88 %
Al centro con la batteria: 844 cd/m²
Contrasto: 1563:1 (Nero: 0.54 cd/m²)
ΔE ColorChecker Calman: 4.8 | ∀{0.5-29.43 Ø4.73}
calibrated: 1.15
ΔE Greyscale Calman: 7.6 | ∀{0.09-98 Ø4.97}
97% sRGB (Argyll 1.6.3 3D)
62% AdobeRGB 1998 (Argyll 1.6.3 3D)
67.3% AdobeRGB 1998 (Argyll 3D)
96.9% sRGB (Argyll 3D)
65.3% Display P3 (Argyll 3D)
Gamma: 2.334
CCT: 6546 K
| Dell Latitude 7424 Rugged Extreme AU Optronics AUO523D, IPS, 14", 1920x1080 | Getac S410 CMN N140BGE-E33, TN PED, 14", 1366x768 | Panasonic Toughbook CF-54G2999VM B140XTN, AUO2E3C, TN LED, 14", 1366x768 | Panasonic Toughbook CF-XZ6 Semi-Matte Beschichtung, IPS LED, 12", 2160x1440 | Dell Latitude 5420 Rugged-P85G AU Optronics AUO523D, IPS, 14", 1920x1080 | Lenovo ThinkPad T480-20L50010US B140HAK01.0, TFT-LCD, 14", 1920x1080 | Lenovo ThinkPad P52 20MAS03N00 N156HCE-EN1, IPS LED, 15.6", 1920x1080 | |
|---|---|---|---|---|---|---|---|
| Display | -38% | -43% | -29% | -5% | -44% | -3% | |
| Display P3 Coverage (%) | 65.3 | 40.46 -38% | 37.36 -43% | 46.47 -29% | 62.5 -4% | 36.31 -44% | 65.6 0% |
| sRGB Coverage (%) | 96.9 | 60.9 -37% | 56.1 -42% | 70 -28% | 92.4 -5% | 54.5 -44% | 90.3 -7% |
| AdobeRGB 1998 Coverage (%) | 67.3 | 41.8 -38% | 38.62 -43% | 48.01 -29% | 64.2 -5% | 37.51 -44% | 65.9 -2% |
| Response Times | 50% | 44% | 32% | 4% | 31% | 37% | |
| Response Time Grey 50% / Grey 80% * (ms) | 62.8 ? | 41.2 ? 34% | 43.2 ? 31% | 39 ? 38% | 68 ? -8% | 39.2 ? 38% | 39.2 ? 38% |
| Response Time Black / White * (ms) | 40 ? | 14 ? 65% | 17.2 ? 57% | 30 ? 25% | 33.6 ? 16% | 30.8 ? 23% | 26 ? 35% |
| PWM Frequency (Hz) | 763 | 877 ? | 694 ? | 735 ? | 25250 ? | ||
| Screen | -86% | -92% | -7% | -9% | -61% | -14% | |
| Brightness middle (cd/m²) | 844 | 265.1 -69% | 174.5 -79% | 565 -33% | 1111.7 32% | 276.7 -67% | 304 -64% |
| Brightness (cd/m²) | 793 | 246 -69% | 164 -79% | 538 -32% | 1026 29% | 272 -66% | 293 -63% |
| Brightness Distribution (%) | 88 | 81 -8% | 71 -19% | 82 -7% | 80 -9% | 90 2% | 88 0% |
| Black Level * (cd/m²) | 0.54 | 0.58 -7% | 0.6 -11% | 0.4 26% | 0.81 -50% | 0.21 61% | 0.26 52% |
| Contrast (:1) | 1563 | 457 -71% | 291 -81% | 1413 -10% | 1372 -12% | 1318 -16% | 1169 -25% |
| Colorchecker dE 2000 * | 4.8 | 14.24 -197% | 12.05 -151% | 5.06 -5% | 3.83 20% | 7.22 -50% | 4.5 6% |
| Colorchecker dE 2000 max. * | 11.88 | 26.66 -124% | 27.5 -131% | 8.1 32% | 7.85 34% | 25.87 -118% | 7.7 35% |
| Colorchecker dE 2000 calibrated * | 1.15 | 3.94 -243% | 4.34 -277% | 2.98 -159% | 5.01 -336% | 2.4 -109% | |
| Greyscale dE 2000 * | 7.6 | 14.2 -87% | 14.8 -95% | 6.4 16% | 5.6 26% | 6.7 12% | 5.2 32% |
| Gamma | 2.334 94% | 2.03 108% | 1.4 157% | 2.25 98% | 2.306 95% | 2.321 95% | 2.26 97% |
| CCT | 6546 99% | 17152 38% | 14529 45% | 5794 112% | 7676 85% | 6656 98% | 6789 96% |
| Color Space (Percent of AdobeRGB 1998) (%) | 62 | 38.7 -38% | 35.7 -42% | 44 -29% | 59 -5% | 34 -45% | 53.8 -13% |
| Color Space (Percent of sRGB) (%) | 97 | 61 -37% | 56.2 -42% | 70 -28% | 93 -4% | 54 -44% | 90.1 -7% |
| Media totale (Programma / Settaggio) | -25% /
-60% | -30% /
-65% | -1% /
-6% | -3% /
-7% | -25% /
-46% | 7% /
-6% |
* ... Meglio usare valori piccoli
Tempi di risposta del Display
| ↔ Tempi di risposta dal Nero al Bianco | ||
|---|---|---|
| 40 ms ... aumenta ↗ e diminuisce ↘ combinato | ↗ 24.4 ms Incremento | 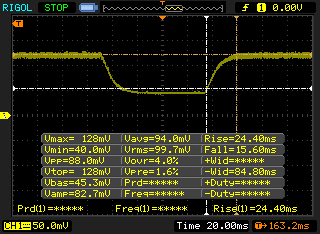 |
| ↘ 15.6 ms Calo | ||
| Lo schermo mostra tempi di risposta lenti nei nostri tests e sarà insoddisfacente per i gamers. In confronto, tutti i dispositivi di test variano da 0.1 (minimo) a 240 (massimo) ms. » 97 % di tutti i dispositivi è migliore. Questo significa che i tempi di risposta rilevati sono peggiori rispetto alla media di tutti i dispositivi testati (19.9 ms). | ||
| ↔ Tempo di risposta dal 50% Grigio all'80% Grigio | ||
| 62.8 ms ... aumenta ↗ e diminuisce ↘ combinato | ↗ 35.6 ms Incremento | 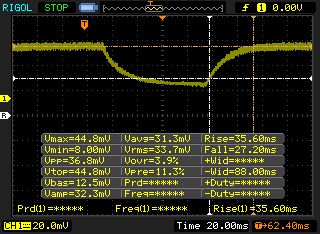 |
| ↘ 27.2 ms Calo | ||
| Lo schermo mostra tempi di risposta lenti nei nostri tests e sarà insoddisfacente per i gamers. In confronto, tutti i dispositivi di test variano da 0.165 (minimo) a 636 (massimo) ms. » 97 % di tutti i dispositivi è migliore. Questo significa che i tempi di risposta rilevati sono peggiori rispetto alla media di tutti i dispositivi testati (31.1 ms). | ||
Sfarfallio dello schermo / PWM (Pulse-Width Modulation)
| flickering dello schermo / PWM rilevato | 763 Hz | 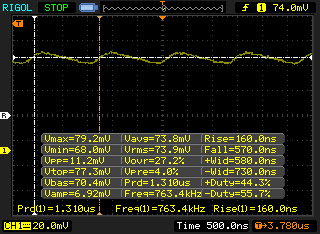 | |
Il display sfarfalla a 763 Hz (Probabilmente a causa dell'uso di PWM) . La frequenza di 763 Hz è abbastanza alta, quindi la maggioranza degli utenti sensibili al PWM non dovrebbero notare alcun flickering. In confronto: 52 % di tutti i dispositivi testati non utilizza PWM per ridurre la luminosita' del display. Se è rilevato PWM, una media di 7797 (minimo: 5 - massimo: 343500) Hz è stata rilevata. | |||
| wPrime 2.10 - 1024m | |
| Acer Swift 3 SF313-51-59SZ | |
| Media Intel Core i7-8650U (268 - 335, n=3) | |
| Media della classe Workstation (n=1ultimi 2 anni) | |
* ... Meglio usare valori piccoli
| PCMark 8 Home Score Accelerated v2 | 4052 punti | |
| PCMark 8 Work Score Accelerated v2 | 5231 punti | |
| PCMark 10 Score | 4497 punti | |
Aiuto | ||
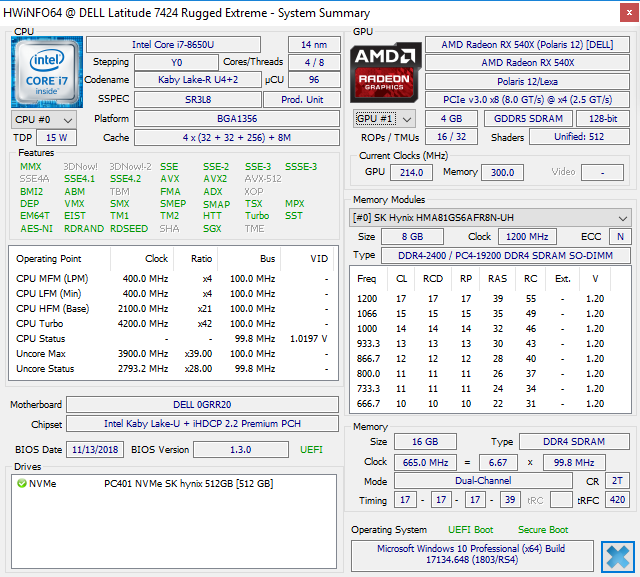
| Dell Latitude 7424 Rugged Extreme SK Hynix PC401 512GB M.2 (HFS512GD9TNG) | Getac S410 CUKUSA 1 TB SATA SSD Q0526A | Panasonic Toughbook CF-54G2999VM Seagate BarraCuda Compute 1TB ST1000LM048 | Panasonic Toughbook CF-XZ6 Samsung SSD PM871a MZNLN256HMHQ | Dell Latitude 5420 Rugged-P85G SK hynix PC401 NVMe 500 GB | Lenovo ThinkPad T480-20L50010US Samsung SSD PM981 MZVLB512HAJQ | Lenovo ThinkPad P52 20MAS03N00 Samsung SSD PM981 MZVLB512HAJQ | Media SK Hynix PC401 512GB M.2 (HFS512GD9TNG) | |
|---|---|---|---|---|---|---|---|---|
| CrystalDiskMark 5.2 / 6 | -51% | -97% | -41% | -18% | -9% | 10% | 19% | |
| Write 4K (MB/s) | 114.4 | 74 -35% | 1.145 -99% | 97.7 -15% | 98.8 -14% | 123.2 8% | 108.5 -5% | 143.3 ? 25% |
| Read 4K (MB/s) | 43.86 | 31.85 -27% | 0.453 -99% | 34.76 -21% | 38.51 -12% | 44.43 1% | 42.78 -2% | 45.3 ? 3% |
| Write Seq (MB/s) | 1281 | 460.6 -64% | 52.2 -96% | 479.4 -63% | 843 -34% | 845 -34% | 1645 28% | 1514 ? 18% |
| Read Seq (MB/s) | 1918 | 514 -73% | 122.7 -94% | 507 -74% | 1282 -33% | 865 -55% | 1485 -23% | 1758 ? -8% |
| Write 4K Q32T1 (MB/s) | 422.5 | 211.4 -50% | 2.428 -99% | 273.5 -35% | 355.5 -16% | 287.3 -32% | 269.2 -36% | 425 ? 1% |
| Read 4K Q32T1 (MB/s) | 260.6 | 203.5 -22% | 1.063 -100% | 296.3 14% | 241.4 -7% | 360.9 38% | 348.7 34% | 459 ? 76% |
| Write Seq Q32T1 (MB/s) | 1282 | 523 -59% | 73.7 -94% | 524 -59% | 893 -30% | 1718 34% | 1877 46% | 1531 ? 19% |
| Read Seq Q32T1 (MB/s) | 2515 | 554 -78% | 120.4 -95% | 554 -78% | 2478 -1% | 1779 -29% | 3419 36% | 2895 ? 15% |
| Write 4K Q8T8 (MB/s) | 1523 | 918 ? | ||||||
| Read 4K Q8T8 (MB/s) | 1614 | 819 ? |

| 3DMark 11 Performance | 5273 punti | |
| 3DMark Cloud Gate Standard Score | 13804 punti | |
| 3DMark Fire Strike Score | 3488 punti | |
Aiuto | ||
| The Witcher 3 - 1366x768 Medium Graphics & Postprocessing | |
| Media della classe Workstation (81.6 - 175, n=2, ultimi 2 anni) | |
| Asus TUF FX505DY | |
| Dell Latitude 7424 Rugged Extreme | |
| Media AMD Radeon RX 540 (29.3 - 39, n=3) | |
| basso | medio | alto | ultra | |
|---|---|---|---|---|
| The Witcher 3 (2015) | 37 |
Rumorosità
| Idle |
| 28.6 / 28.6 / 28.6 dB(A) |
| Sotto carico |
| 32.9 / 39 dB(A) |
 | ||
30 dB silenzioso 40 dB(A) udibile 50 dB(A) rumoroso |
||
min: | ||
(±) La temperatura massima sul lato superiore è di 41.6 °C / 107 F, rispetto alla media di 38.2 °C / 101 F, che varia da 22.2 a 69.8 °C per questa classe Workstation.
(-) Il lato inferiore si riscalda fino ad un massimo di 47.6 °C / 118 F, rispetto alla media di 41.1 °C / 106 F
(+) In idle, la temperatura media del lato superiore è di 25.4 °C / 78 F, rispetto alla media deld ispositivo di 32 °C / 90 F.
(+) I poggiapolsi e il touchpad sono piu' freddi della temperatura della pelle con un massimo di 27 °C / 80.6 F e sono quindi freddi al tatto.
(±) La temperatura media della zona del palmo della mano di dispositivi simili e'stata di 27.8 °C / 82 F (+0.8 °C / 1.4 F).
Dell Latitude 7424 Rugged Extreme analisi audio
(±) | potenza degli altiparlanti media ma buona (81.7 dB)
Bassi 100 - 315 Hz
(-) | quasi nessun basso - in media 16.6% inferiori alla media
(±) | la linearità dei bassi è media (11.4% delta rispetto alla precedente frequenza)
Medi 400 - 2000 Hz
(+) | medi bilanciati - solo only 4.7% rispetto alla media
(±) | linearità dei medi adeguata (7.6% delta rispetto alla precedente frequenza)
Alti 2 - 16 kHz
(+) | Alti bilanciati - appena 4.6% dalla media
(±) | la linearità degli alti è media (7.6% delta rispetto alla precedente frequenza)
Nel complesso 100 - 16.000 Hz
(±) | la linearità complessiva del suono è media (17.7% di differenza rispetto alla media
Rispetto alla stessa classe
» 55% di tutti i dispositivi testati in questa classe è stato migliore, 9% simile, 35% peggiore
» Il migliore ha avuto un delta di 7%, medio di 17%, peggiore di 35%
Rispetto a tutti i dispositivi testati
» 35% di tutti i dispositivi testati in questa classe è stato migliore, 8% similare, 57% peggiore
» Il migliore ha avuto un delta di 4%, medio di 24%, peggiore di 134%
Getac S410 analisi audio
(±) | potenza degli altiparlanti media ma buona (76.2 dB)
Bassi 100 - 315 Hz
(±) | bassi ridotti - in media 13.6% inferiori alla media
(+) | bassi in lineaa (6.1% delta rispetto alla precedente frequenza)
Medi 400 - 2000 Hz
(±) | medi elevati - circa 6.5% superiore alla media
(±) | linearità dei medi adeguata (8.4% delta rispetto alla precedente frequenza)
Alti 2 - 16 kHz
(+) | Alti bilanciati - appena 3.1% dalla media
(+) | alti lineari (6.2% delta rispetto alla precedente frequenza)
Nel complesso 100 - 16.000 Hz
(±) | la linearità complessiva del suono è media (19.9% di differenza rispetto alla media
Rispetto alla stessa classe
» 42% di tutti i dispositivi testati in questa classe è stato migliore, 9% simile, 50% peggiore
» Il migliore ha avuto un delta di 7%, medio di 21%, peggiore di 53%
Rispetto a tutti i dispositivi testati
» 51% di tutti i dispositivi testati in questa classe è stato migliore, 7% similare, 42% peggiore
» Il migliore ha avuto un delta di 4%, medio di 24%, peggiore di 134%
Panasonic Toughbook CF-54G2999VM analisi audio
(-) | altoparlanti non molto potenti (65.9 dB)
Bassi 100 - 315 Hz
(-) | quasi nessun basso - in media 25.6% inferiori alla media
(+) | bassi in lineaa (5% delta rispetto alla precedente frequenza)
Medi 400 - 2000 Hz
(±) | medi elevati - circa 7.8% superiore alla media
(-) | medi non in linea (17.3% delta rispetto alla precedente frequenza)
Alti 2 - 16 kHz
(+) | Alti bilanciati - appena 4.3% dalla media
(±) | la linearità degli alti è media (7.9% delta rispetto alla precedente frequenza)
Nel complesso 100 - 16.000 Hz
(-) | suono nel complesso non lineare (39.6% di differenza rispetto alla media
Rispetto alla stessa classe
» 99% di tutti i dispositivi testati in questa classe è stato migliore, 1% simile, 1% peggiore
» Il migliore ha avuto un delta di 7%, medio di 21%, peggiore di 53%
Rispetto a tutti i dispositivi testati
» 95% di tutti i dispositivi testati in questa classe è stato migliore, 0% similare, 5% peggiore
» Il migliore ha avuto un delta di 4%, medio di 24%, peggiore di 134%
| Off / Standby | |
| Idle | |
| Sotto carico |
|
Leggenda:
min: | |
| Dell Latitude 7424 Rugged Extreme i7-8650U, Radeon RX 540, SK Hynix PC401 512GB M.2 (HFS512GD9TNG), IPS, 1920x1080, 14" | Getac S410 i5-8550U, UHD Graphics 620, CUKUSA 1 TB SATA SSD Q0526A, TN PED, 1366x768, 14" | Panasonic Toughbook CF-54G2999VM i5-7300U, HD Graphics 620, Seagate BarraCuda Compute 1TB ST1000LM048, TN LED, 1366x768, 14" | Panasonic Toughbook CF-XZ6 i5-7300U, HD Graphics 620, Samsung SSD PM871a MZNLN256HMHQ, IPS LED, 2160x1440, 12" | Dell Latitude 5420 Rugged-P85G i7-8650U, Radeon RX 540, SK hynix PC401 NVMe 500 GB, IPS, 1920x1080, 14" | Lenovo ThinkPad T480-20L50010US i7-8650U, UHD Graphics 620, Samsung SSD PM981 MZVLB512HAJQ, TFT-LCD, 1920x1080, 14" | Lenovo ThinkPad P52 20MAS03N00 i7-8750H, Quadro P1000, Samsung SSD PM981 MZVLB512HAJQ, IPS LED, 1920x1080, 15.6" | |
|---|---|---|---|---|---|---|---|
| Power Consumption | 45% | 52% | 64% | 9% | 44% | 7% | |
| Idle Minimum * (Watt) | 6.5 | 5.6 14% | 4.4 32% | 3.15 52% | 4.8 26% | 3.8 42% | 4.02 38% |
| Idle Average * (Watt) | 15.1 | 7.9 48% | 6.3 58% | 6 60% | 13.6 10% | 7.7 49% | 7.2 52% |
| Idle Maximum * (Watt) | 16.1 | 8.4 48% | 6.5 60% | 6.3 61% | 13.8 14% | 9.3 42% | 11.46 29% |
| Load Average * (Watt) | 70.5 | 32.8 53% | 36.3 49% | 21 70% | 67.8 4% | 45.7 35% | 76.3 -8% |
| Witcher 3 ultra * (Watt) | 68.1 | 69.1 -1% | 74 -9% | ||||
| Load Maximum * (Watt) | 95.2 | 34.3 64% | 38.3 60% | 23 76% | 93.5 2% | 46.1 52% | 154 -62% |
* ... Meglio usare valori piccoli
| Dell Latitude 7424 Rugged Extreme i7-8650U, Radeon RX 540, 102 Wh | Getac S410 i5-8550U, UHD Graphics 620, 46.6 Wh | Panasonic Toughbook CF-54G2999VM i5-7300U, HD Graphics 620, 33 Wh | Panasonic Toughbook CF-XZ6 i5-7300U, HD Graphics 620, 76 Wh | Dell Latitude 5420 Rugged-P85G i7-8650U, Radeon RX 540, 102 Wh | Lenovo ThinkPad T480-20L50010US i7-8650U, UHD Graphics 620, 24 Wh | Lenovo ThinkPad P52 20MAS03N00 i7-8750H, Quadro P1000, 96 Wh | |
|---|---|---|---|---|---|---|---|
| Autonomia della batteria | -56% | -50% | 18% | 29% | -38% | -31% | |
| WiFi v1.3 (h) | 11.7 | 5.2 -56% | 5.9 -50% | 14 20% | 16.2 38% | 7.3 -38% | 10.6 -9% |
| Load (h) | 2.7 | 3.1 15% | 3.2 19% | 1.3 -52% | |||
| Reader / Idle (h) | 22.1 | 31.4 | 25.3 |
Pro
Contro
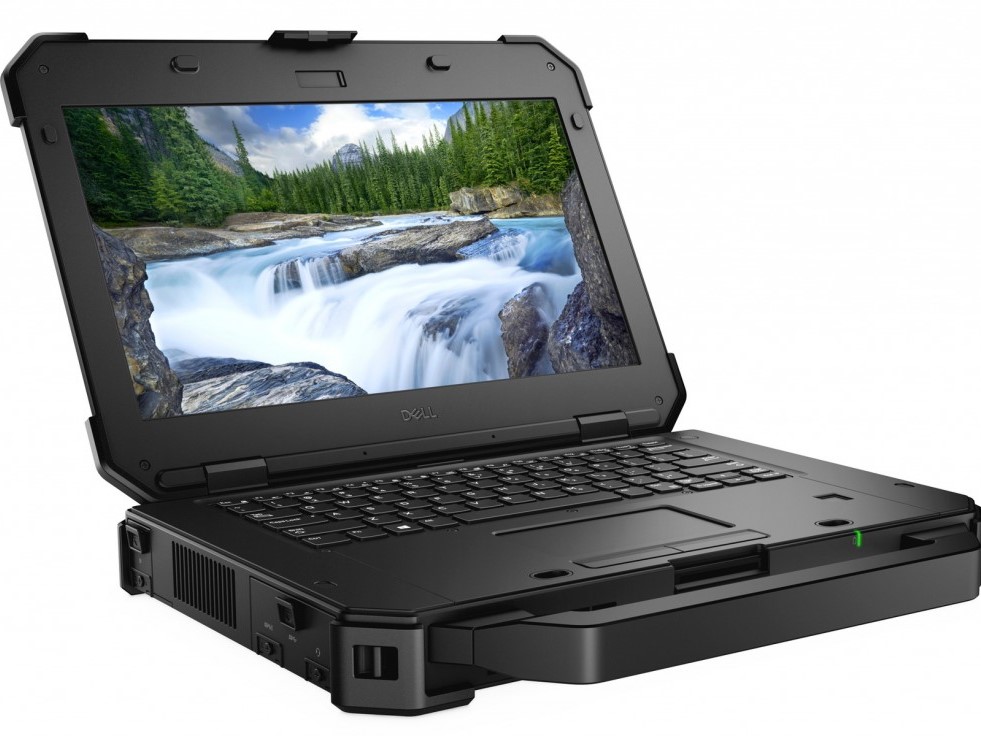
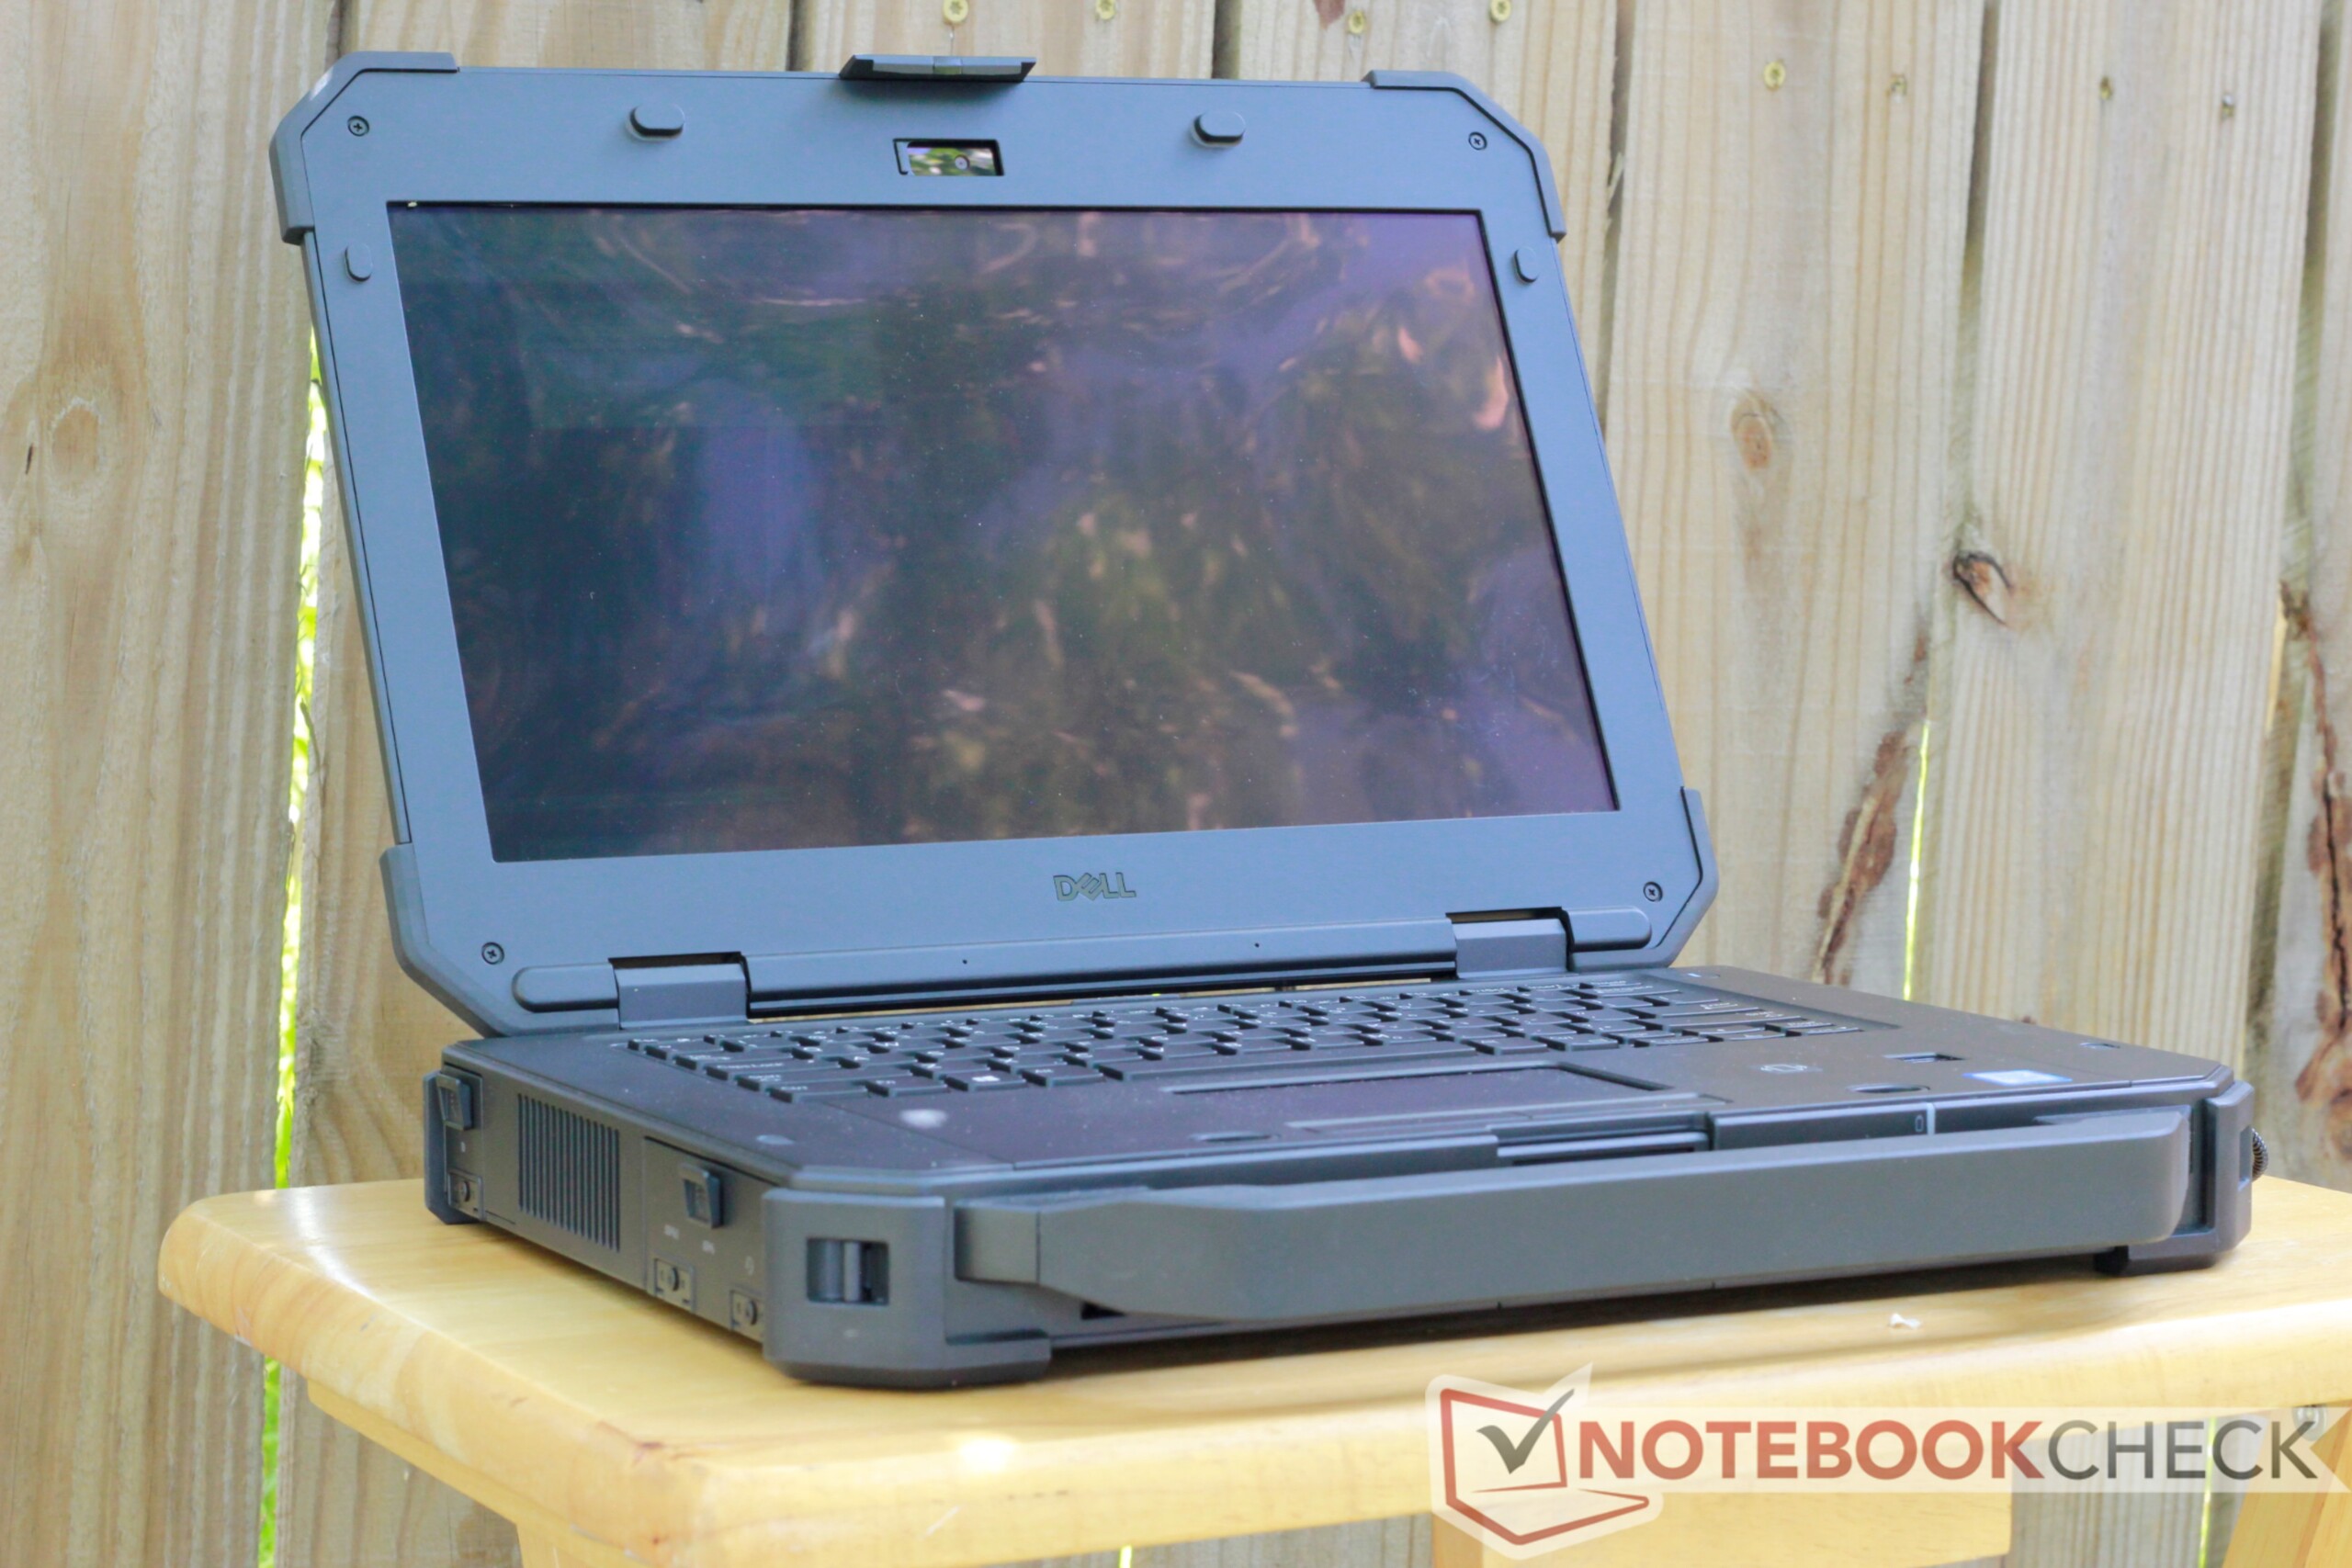
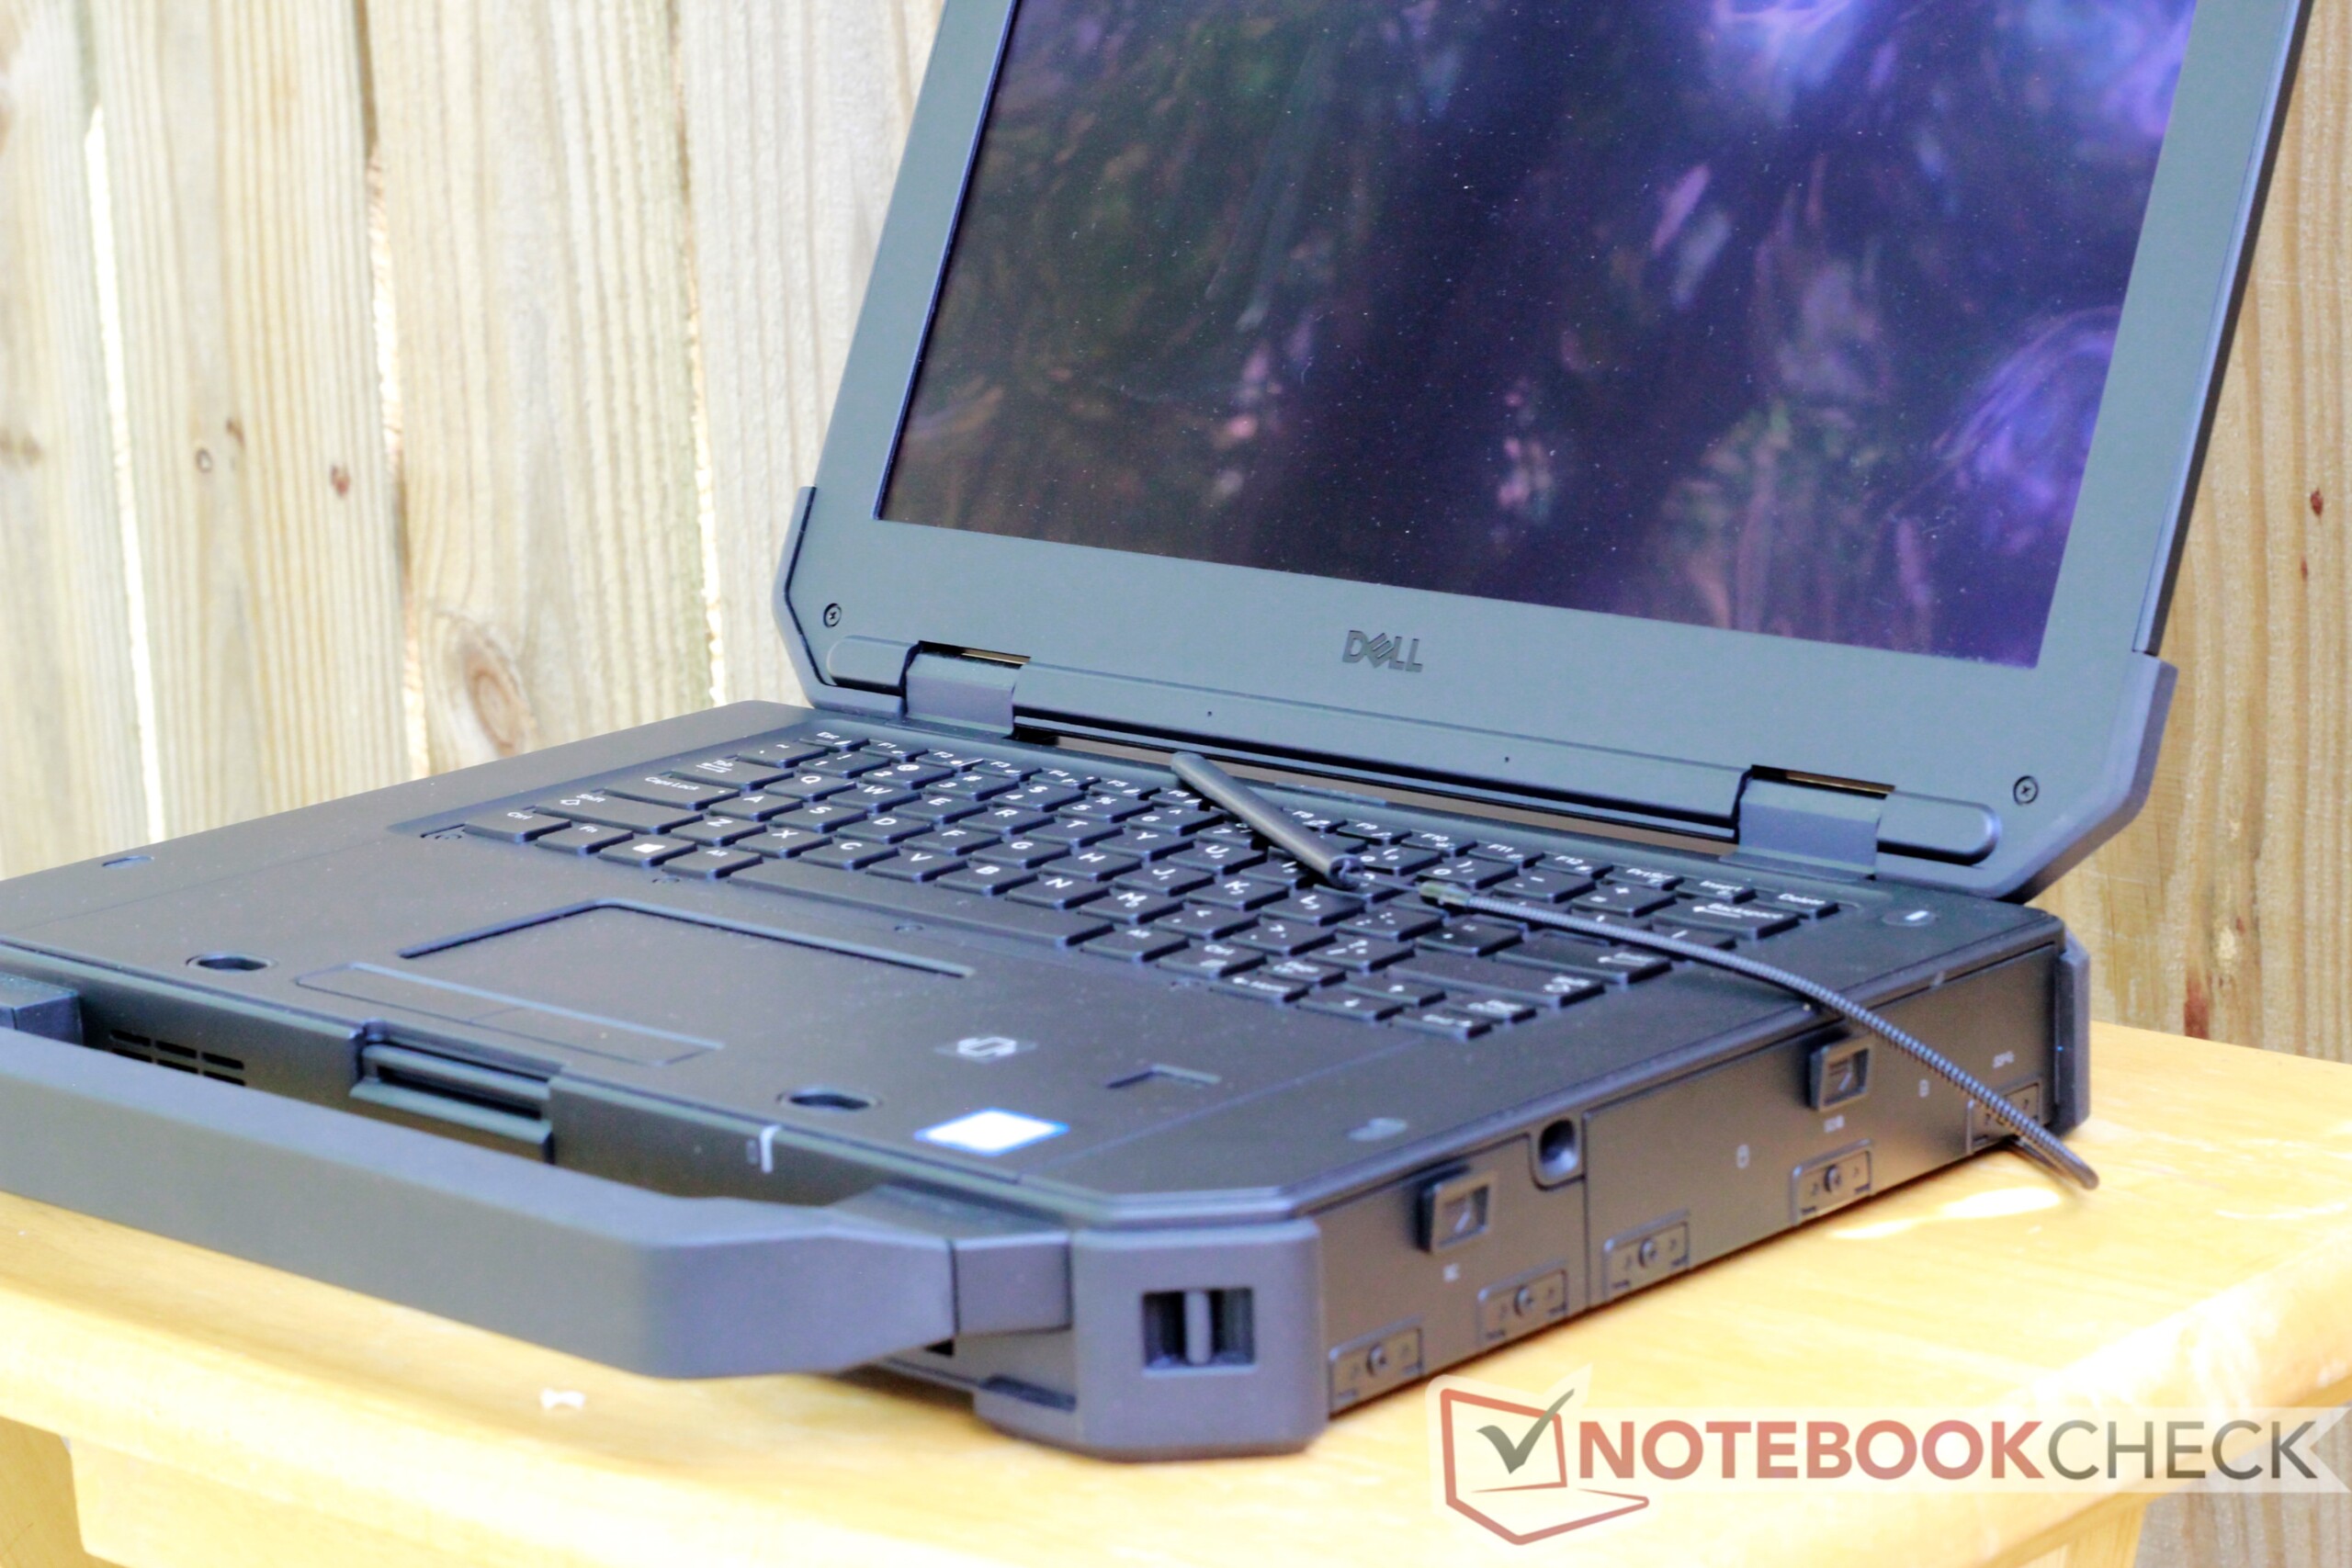
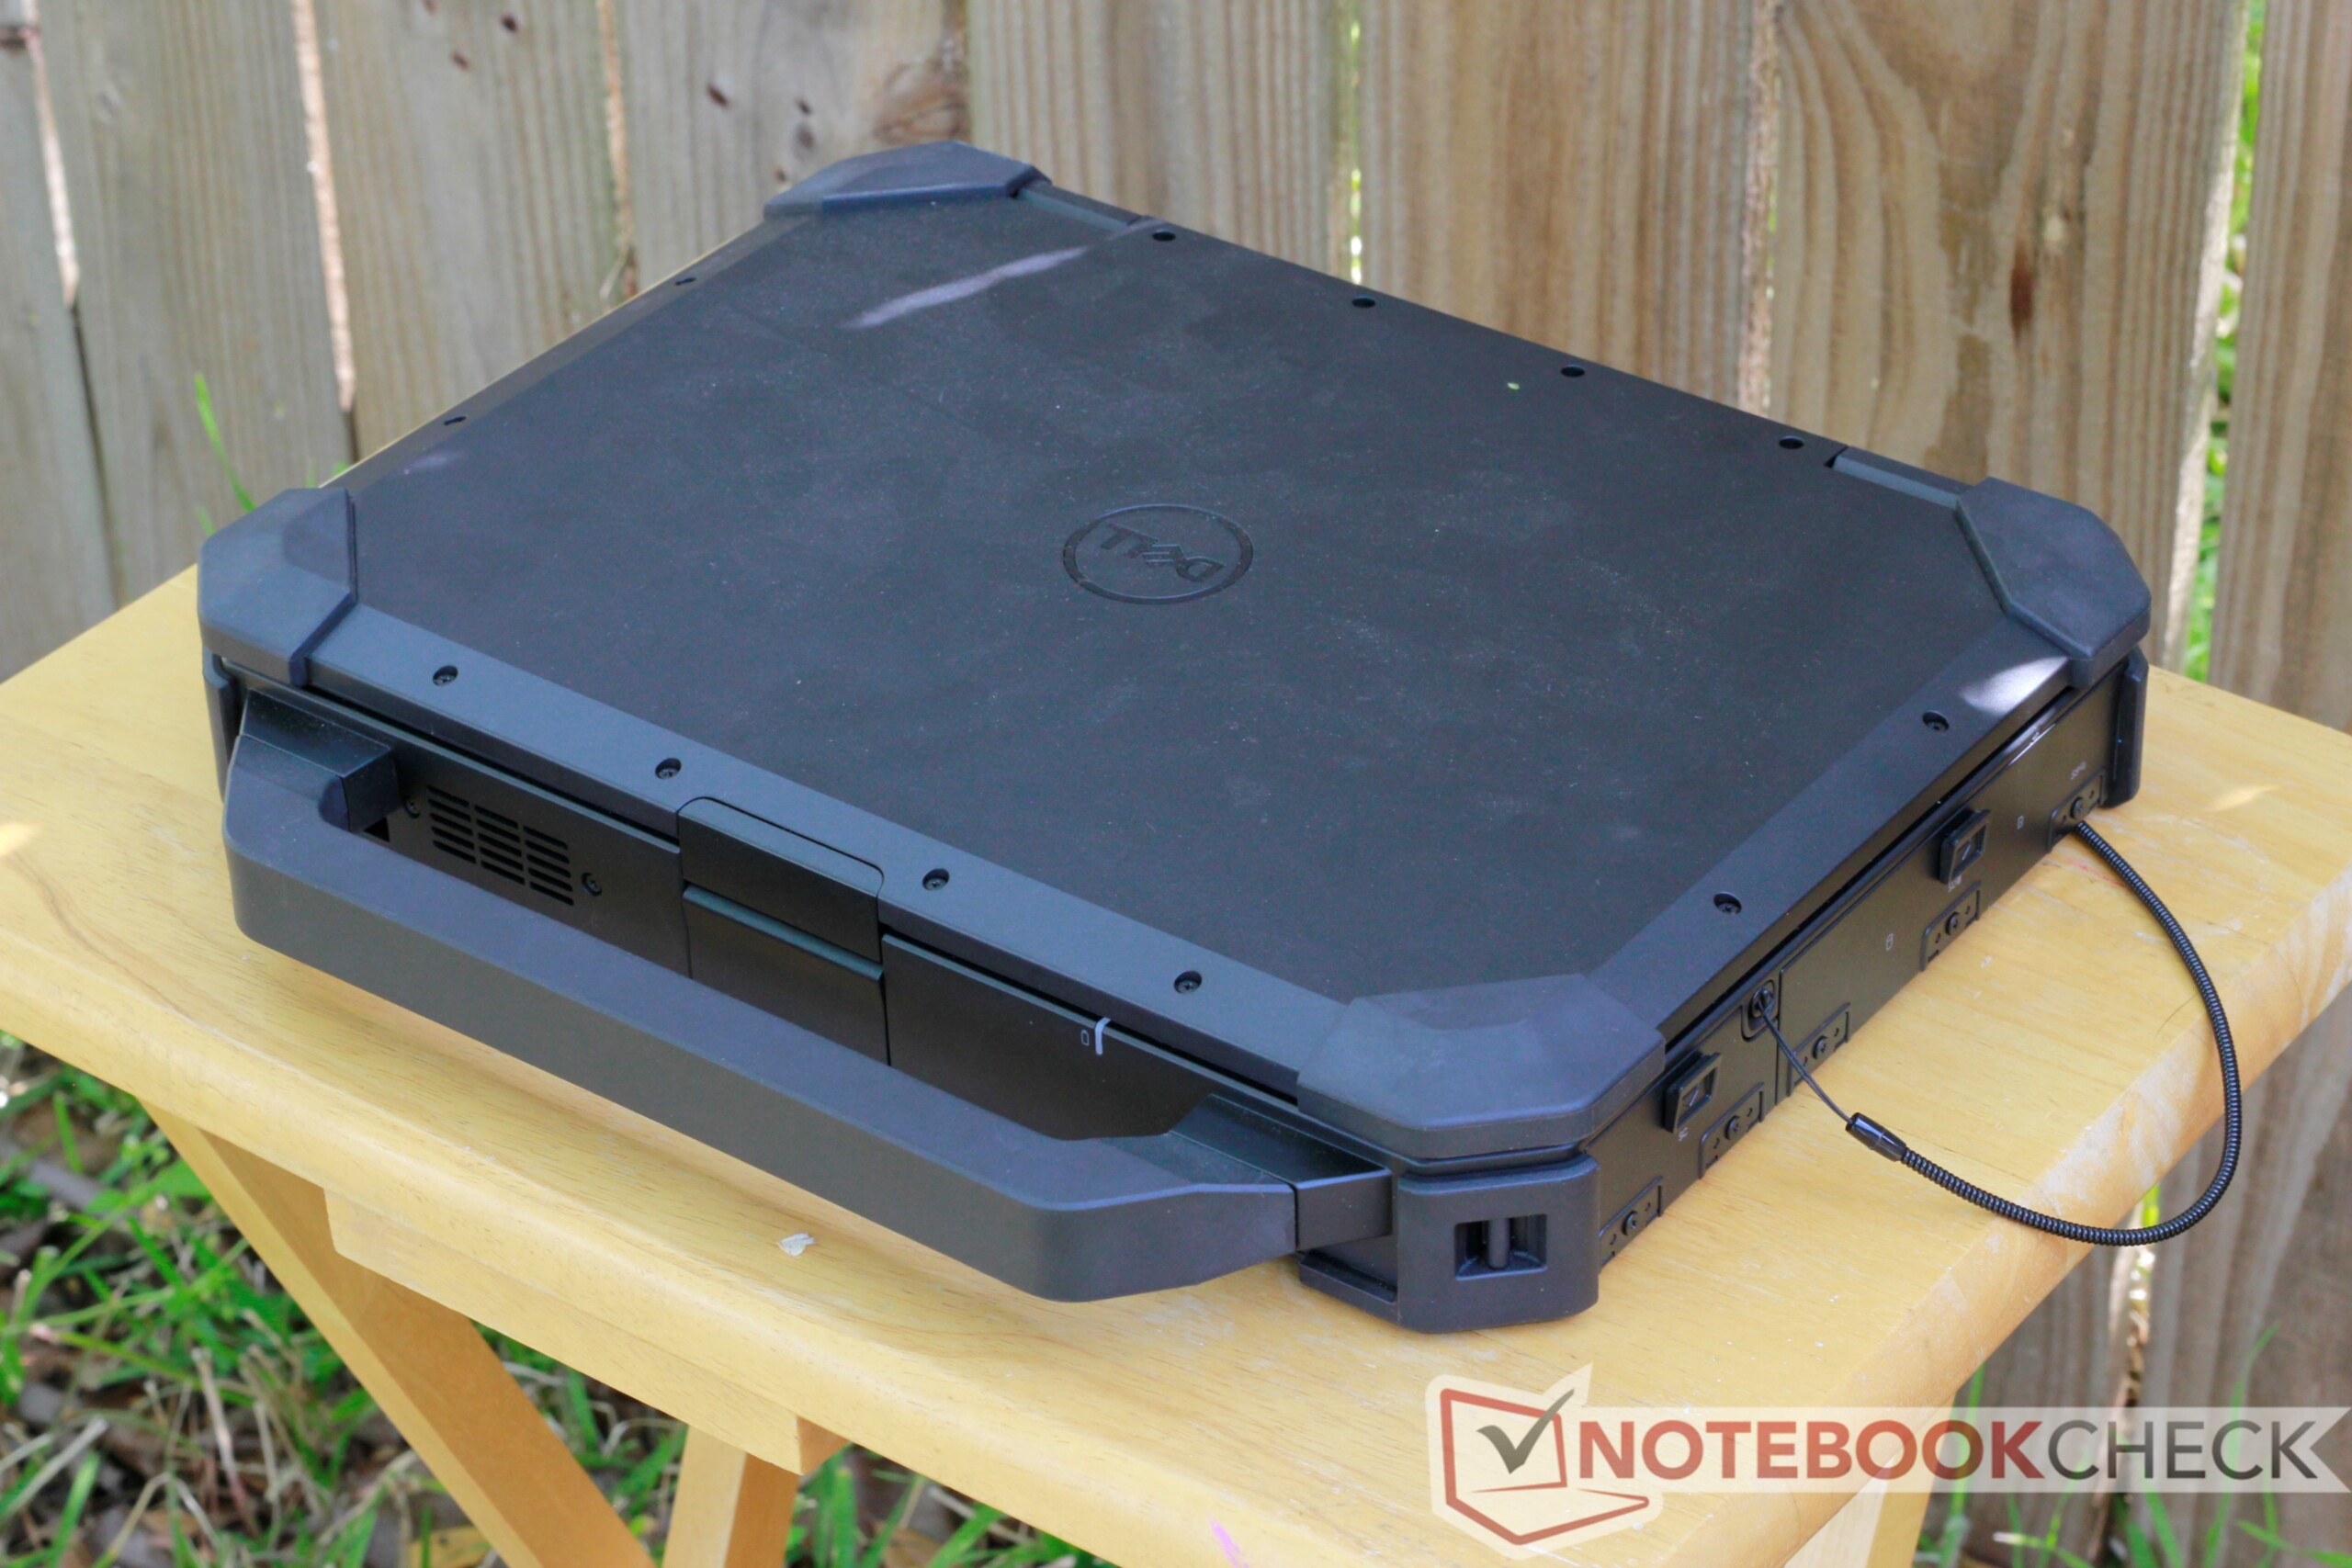
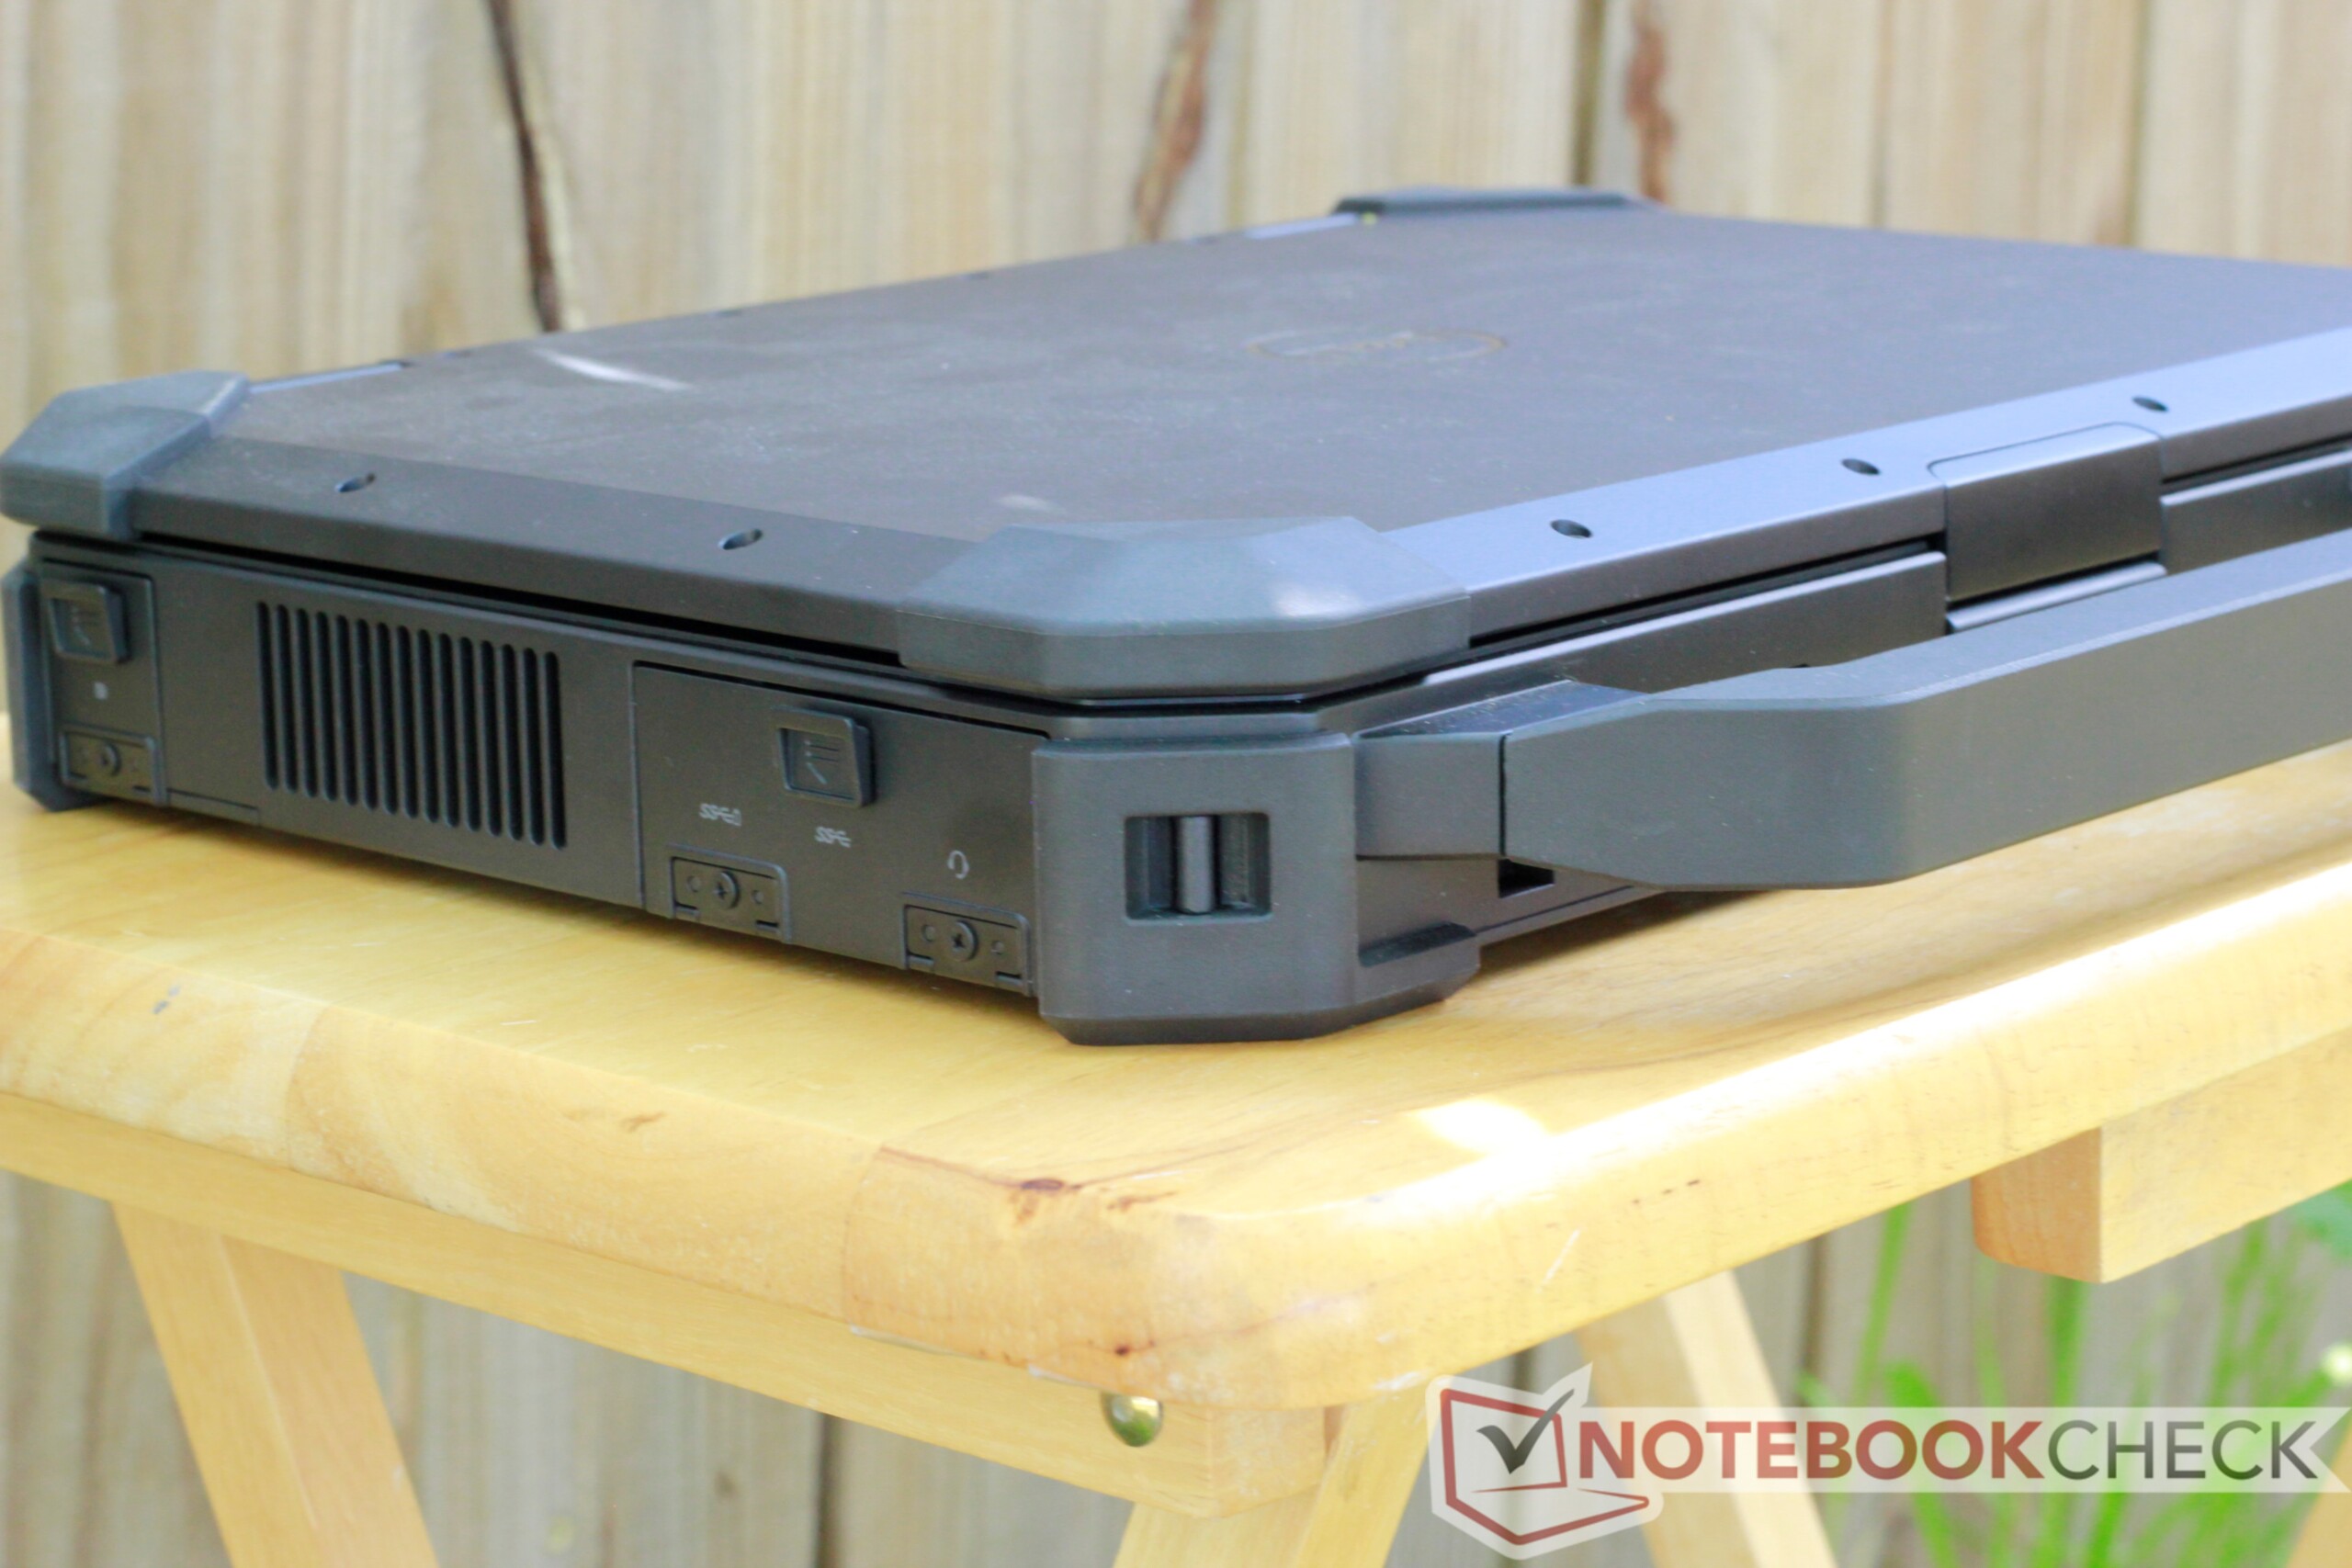
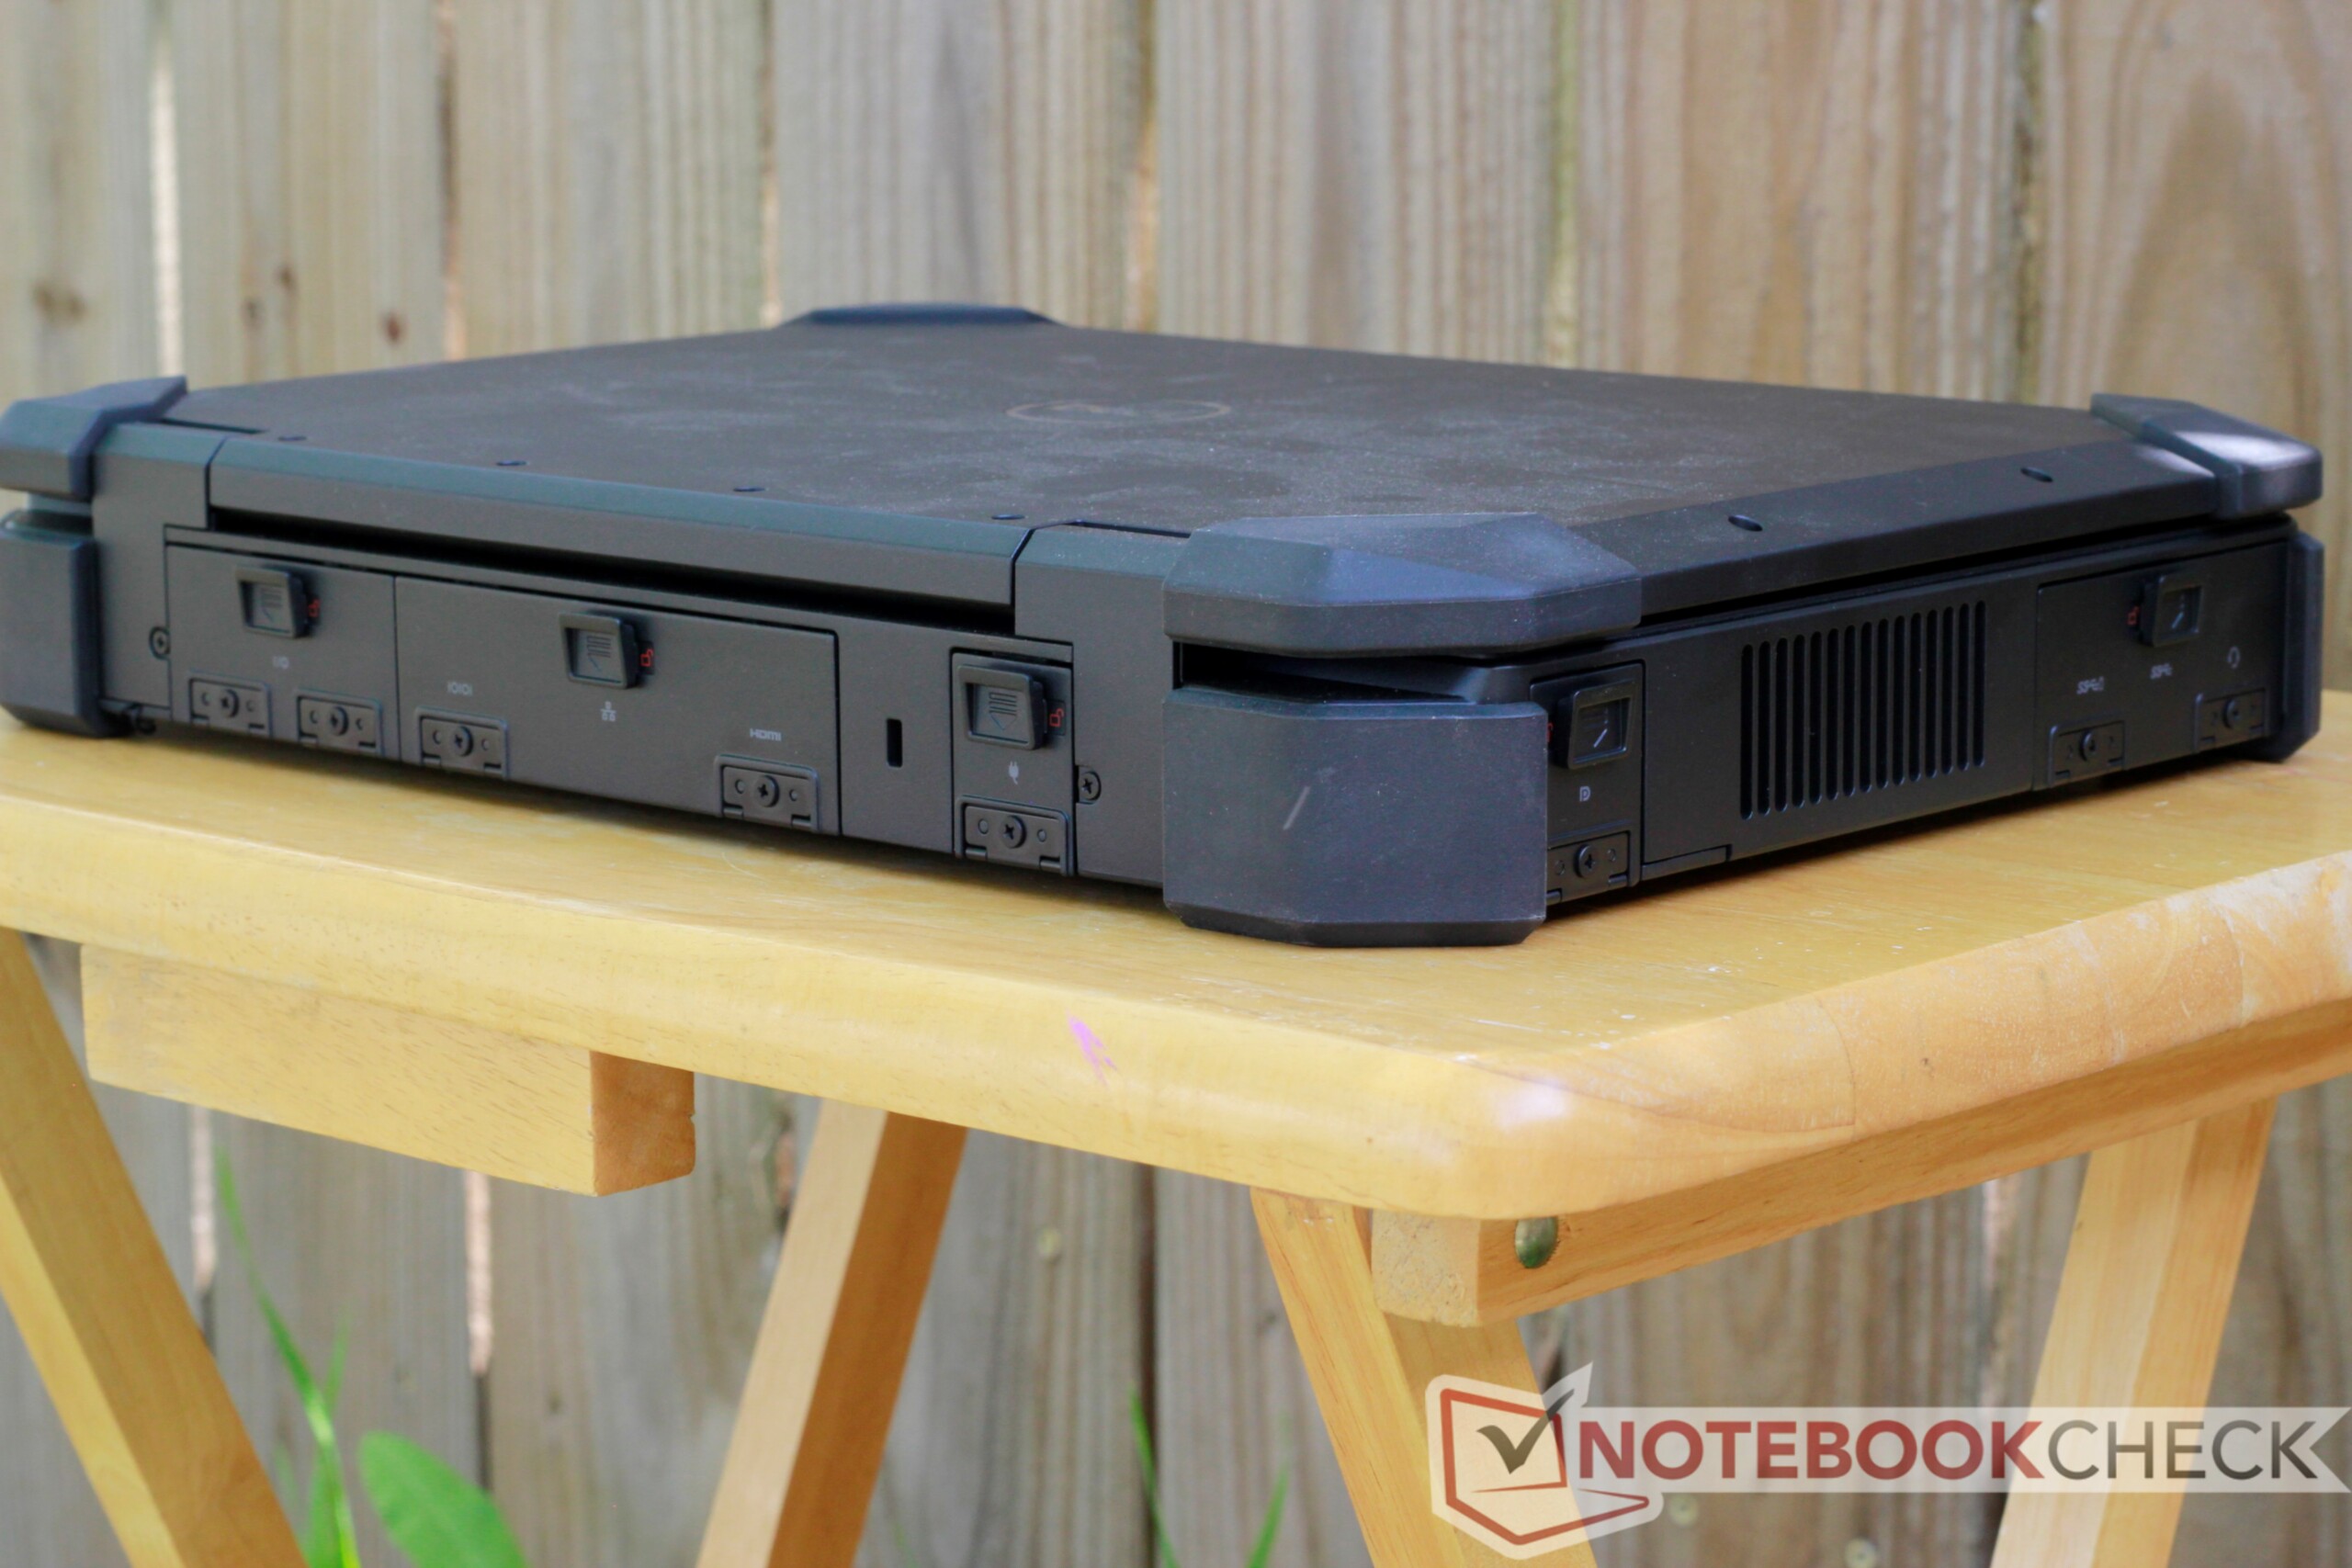
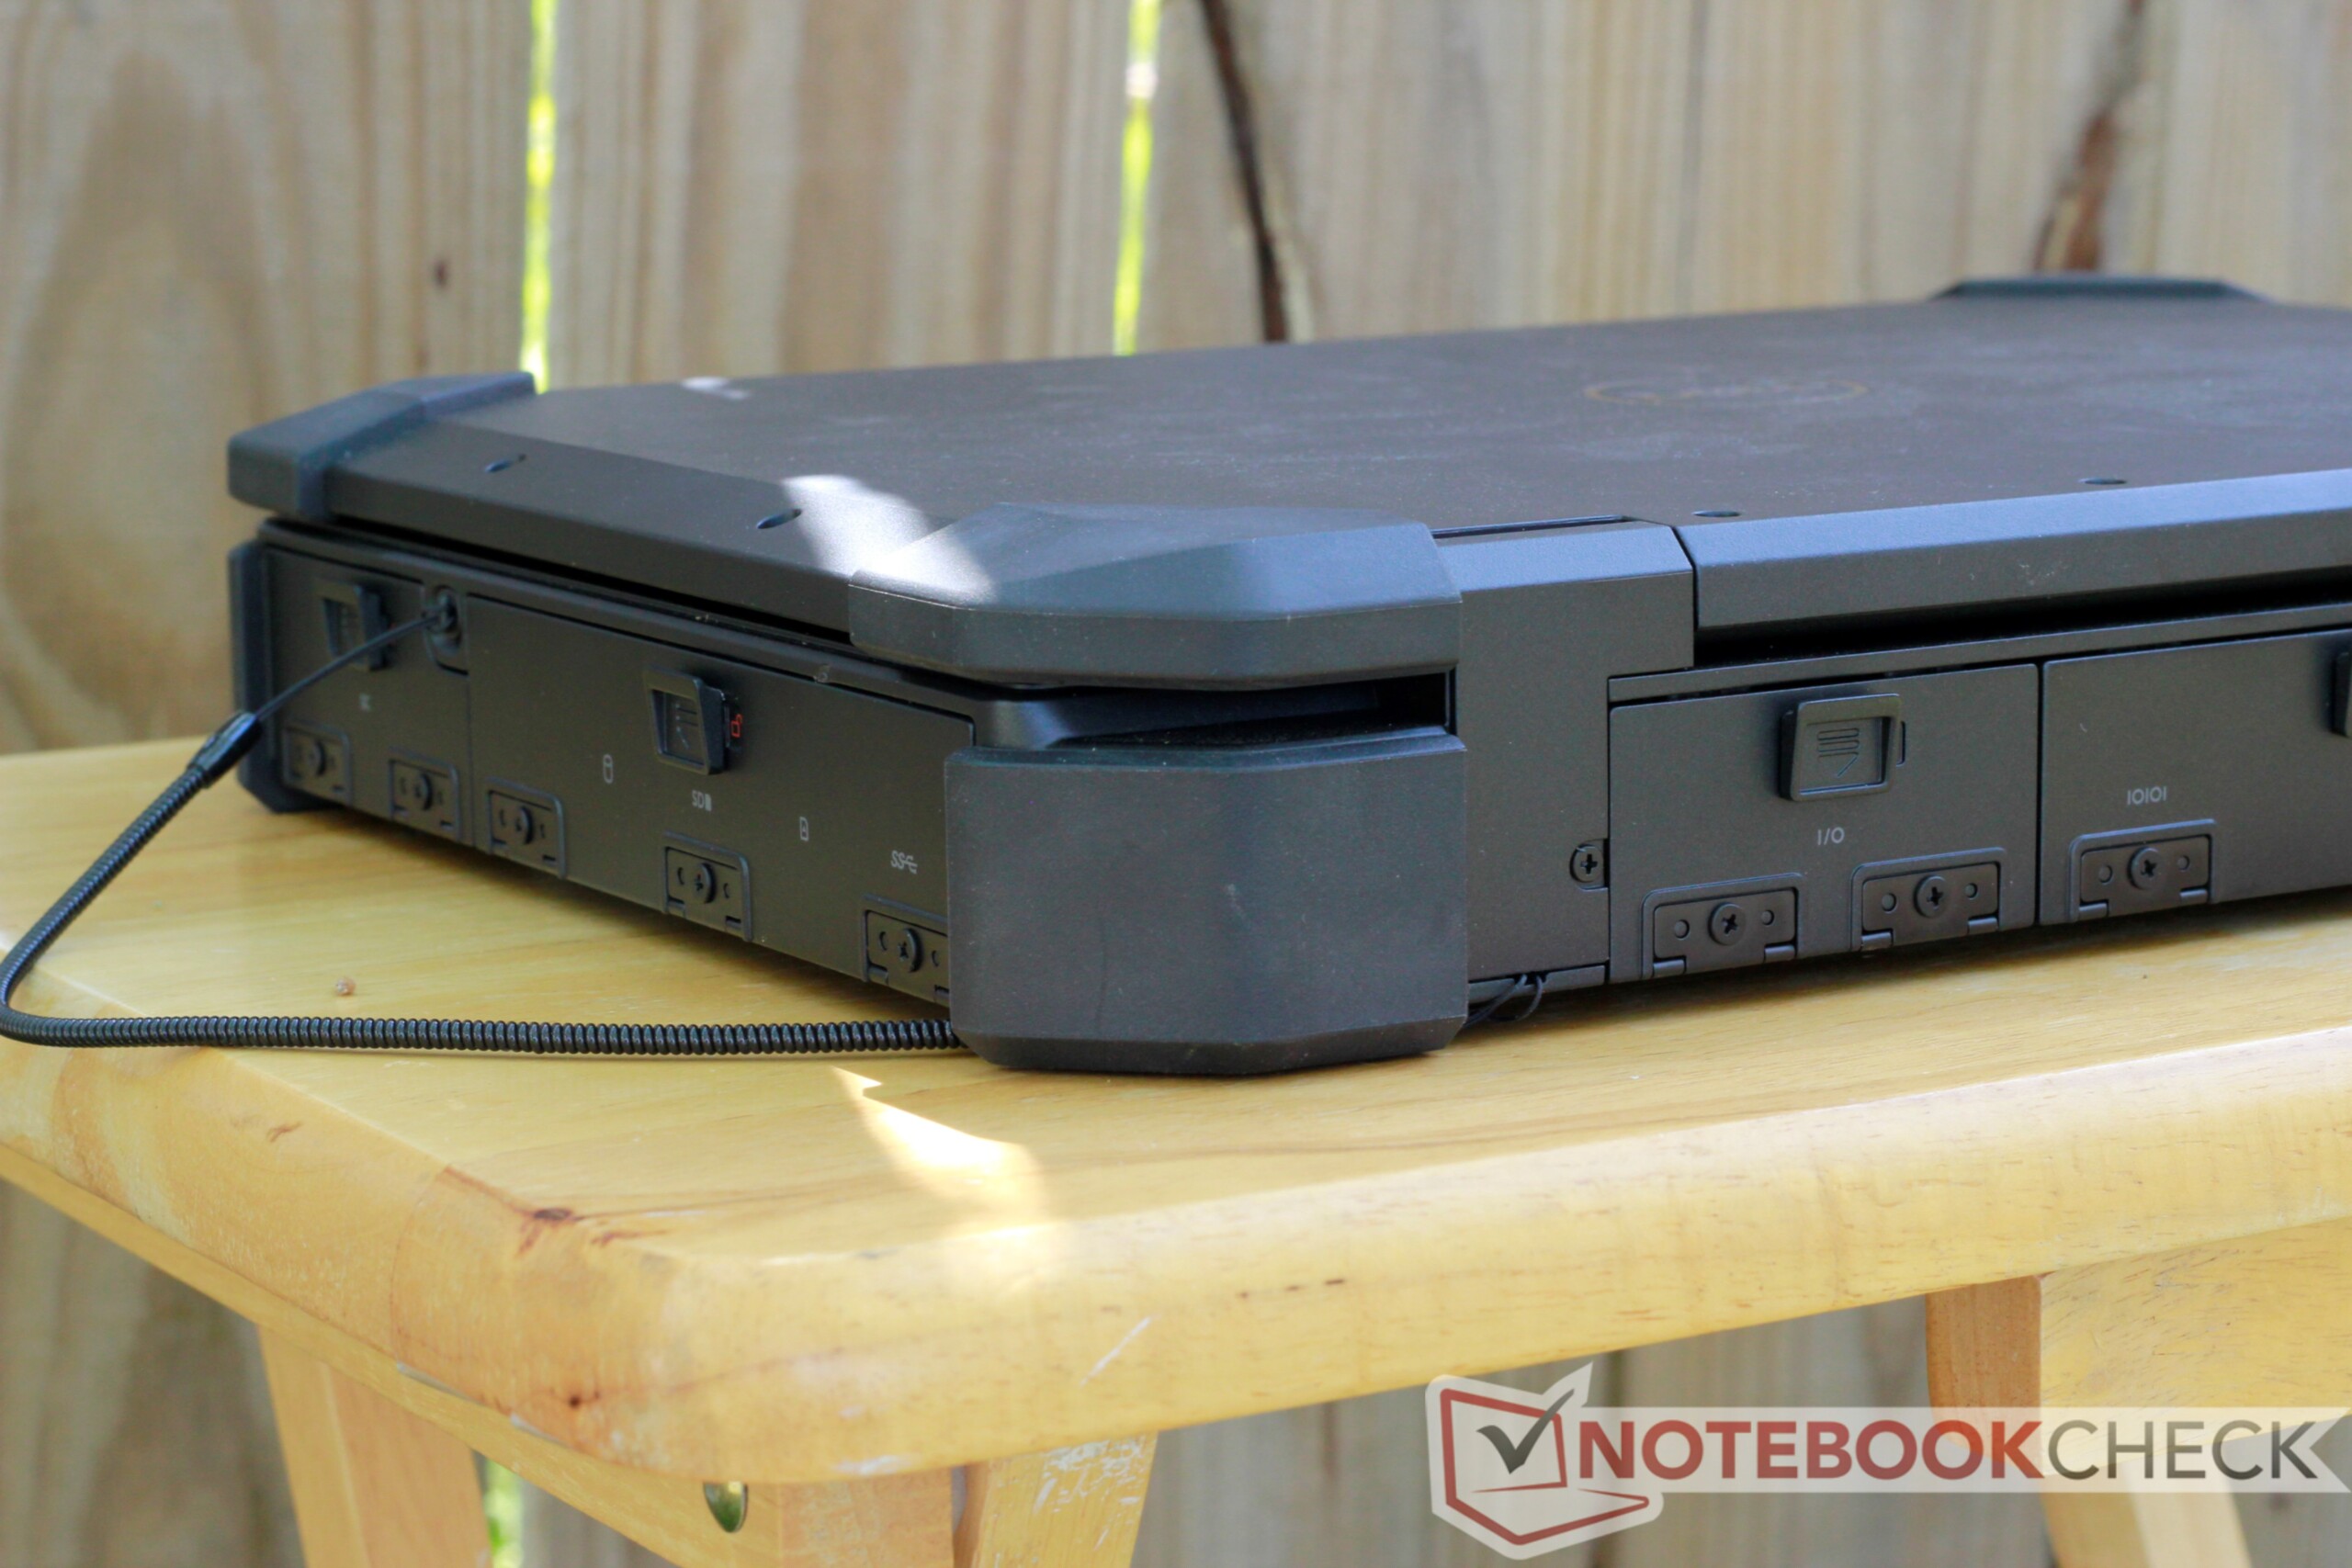
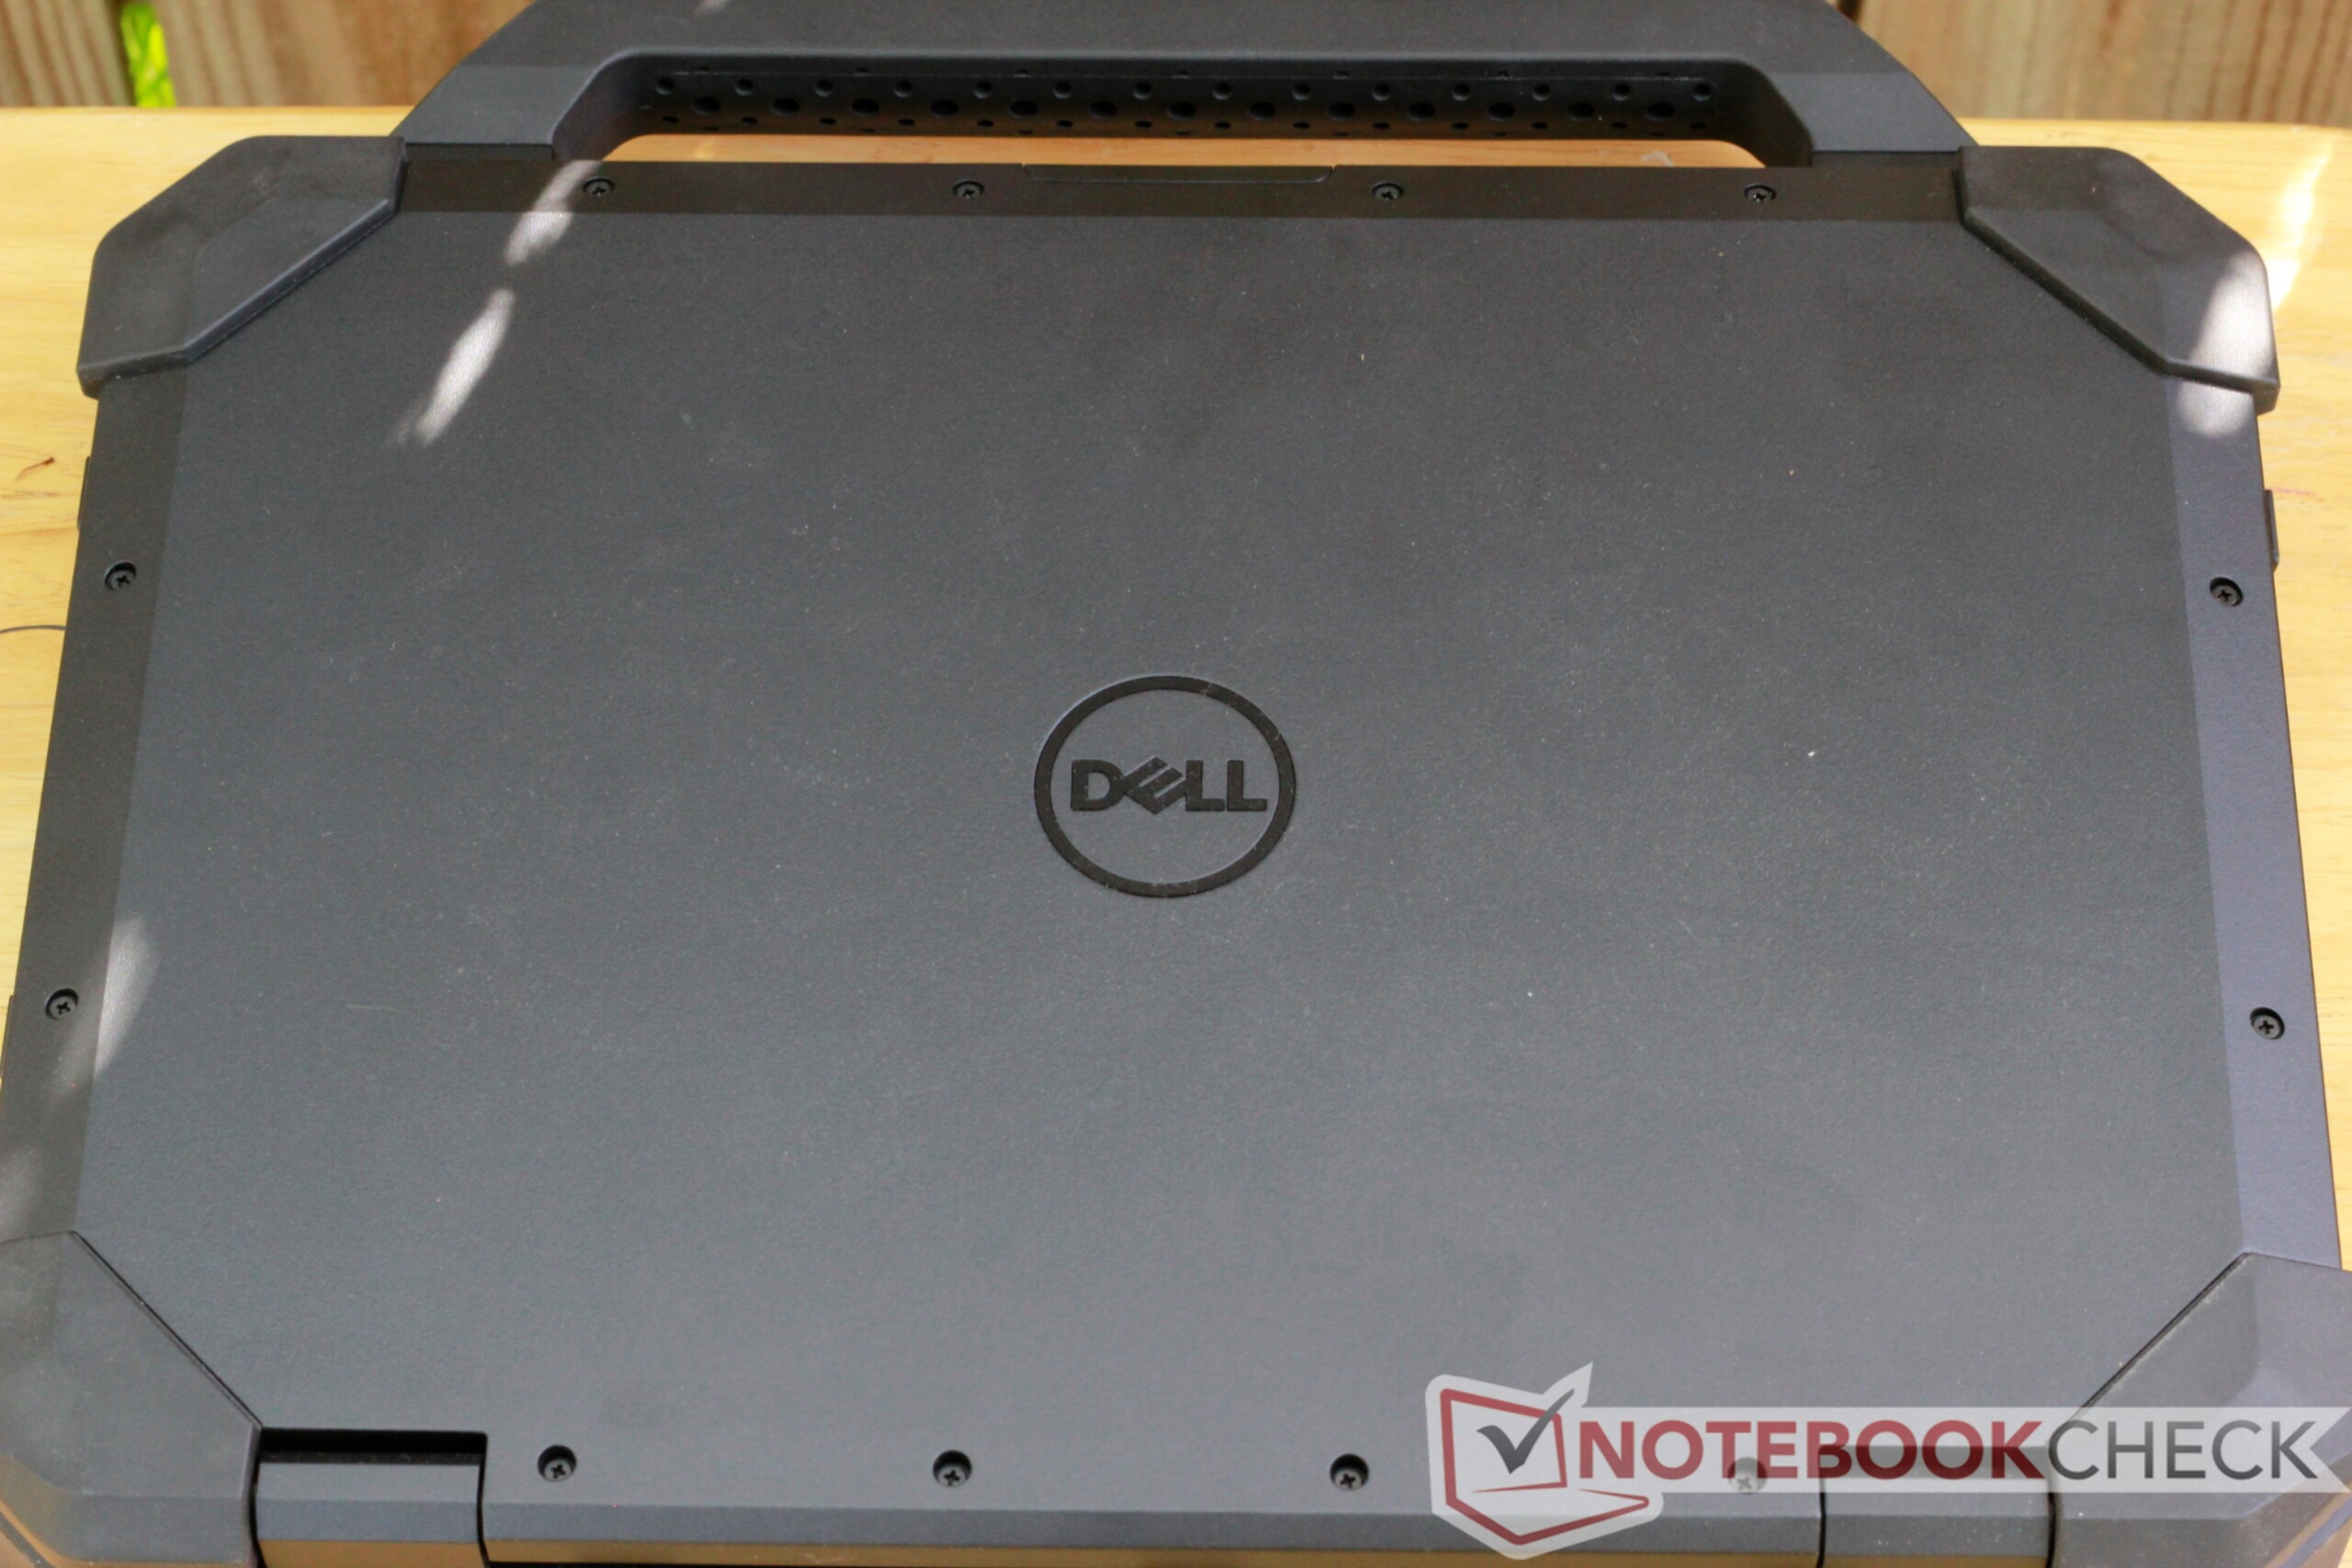
Il Dell Latitude 7424 Rugged Extreme è l'icona dei laptop ruggedized. E' spesso. E' pesante. Ma è resistente. Un dispositivo a tenuta di polvere e resistente all'acqua, quindi dovrebbe essere adatto ad ambienti di lavoro difficili come i cantieri edili e il lavoro sul campo. La macchina è un cavallo da lavoro professionale in grado di gestire una varietà di flussi di lavoro con aplomb ed è piuttosto versatile.
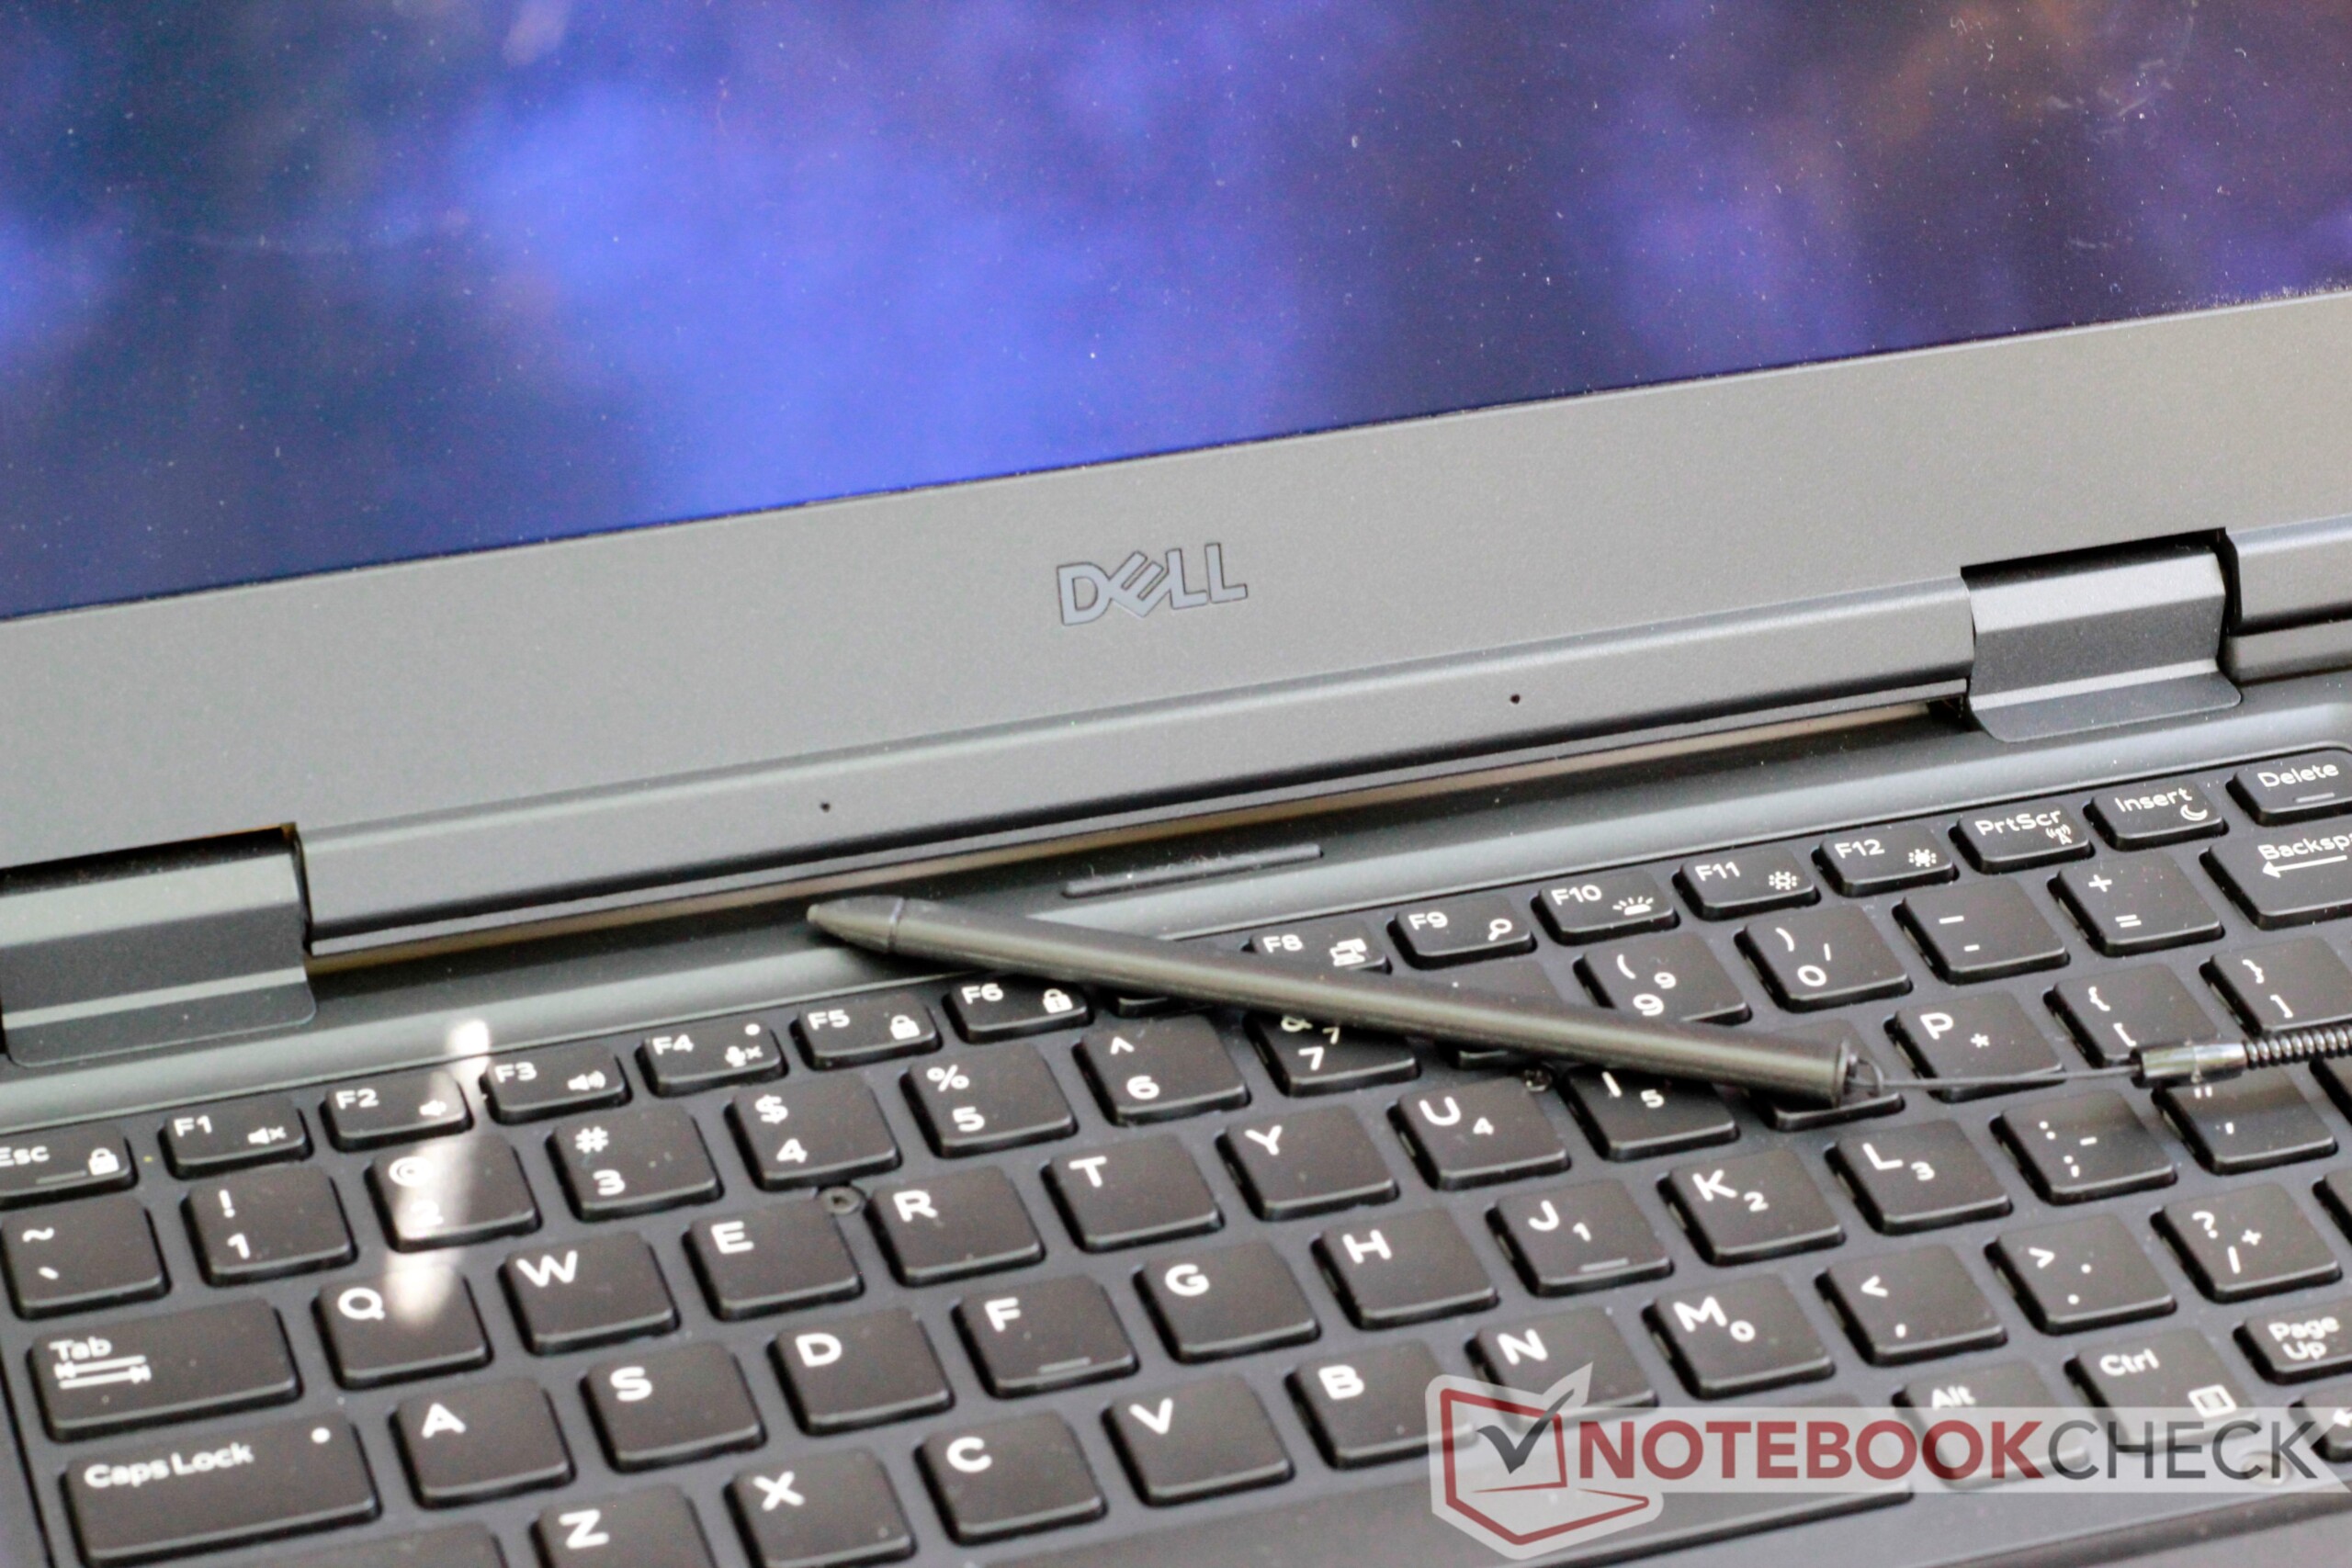
Detto questo, impallidisce rispetto al Dell Latitude 5420 Rugged. Il 5420 è molto più portatile grazie al suo profilo più sottile. Il 5420 offre inoltre prestazioni comparabili, un display migliore e una maggiore durata della batteria. Il più grande vantaggio del 7424 Rugged Extreme è la sua superiore resistenza alle intemperie e i suoi input a prova di guanti. Il 7424 è leggermente più veloce e più freddo del 5420, ma nella migliore delle ipotesi la differenza è marginale.
Tutto sommato, il Dell Latitude 7424 Rugged Extreme è un computer portatile robusto che offre grandi prestazioni a tutto tondo, ma ci sono opzioni migliori. A meno che non sia necessario aggiungere la protezione dall'acqua e dalla polvere o lavorare spesso con i guanti, il Latitude 5420 Rugged è un acquisto migliore per diversi motivi. Tutto sommato, il Dell Latitude 7424 Rugged Extreme è un computer portatile robusto che offre grandi prestazioni a tutto tondo, ma ci sono opzioni migliori. A meno che non sia necessario aggiungere la protezione dall'acqua e dalla polvere o lavorare spesso con i guanti, il Latitude 5420 Rugged è un acquisto migliore per diversi motivi.
Dell Latitude 7424 Rugged Extreme
- 03/30/2019 v6 (old)
Sam Medley
Price comparison
