Recensione della Gaming Box Aorus RTX 2070 con Dell XPS 13 9380
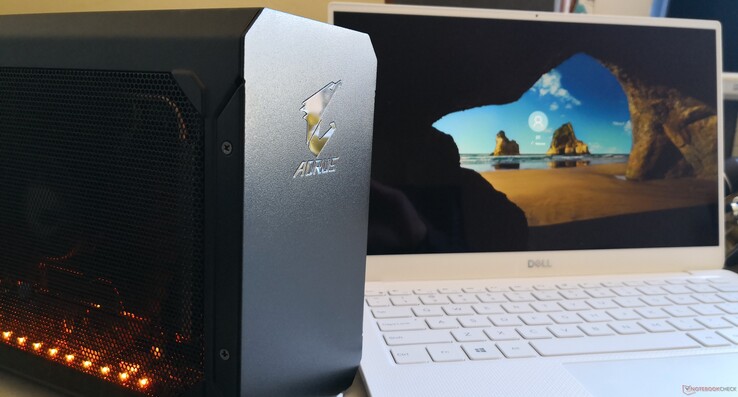
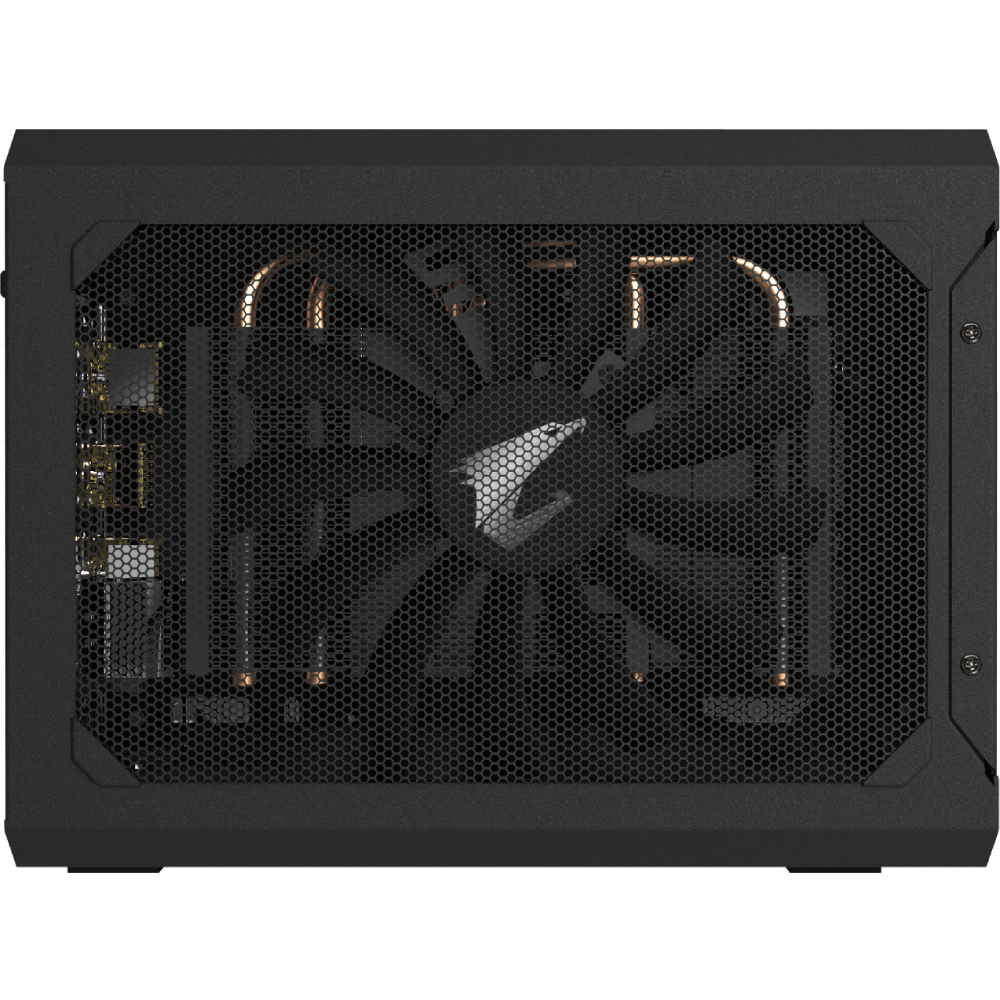
Il dock grafico Aorus Gaming Box dello scorso anno ha offerto le SKU GeForce GTX 1070 e GTX 1080 per trasformare qualsiasi portatile Thunderbolt 3-powered Windows 10 in una macchina gaming. Quest'ultimo modello sostituisce la GPU GTX con una RTX 2070, ma lo chassis compatto rimane identico. Di conseguenza, si consiglia di controllare la nostra recensione esistente sul Gaming Box GTX 1080 per ulteriori informazioni sullo chassis e le sue caratteristiche, dato che i nostri commenti sono ancora validi in questo caso.
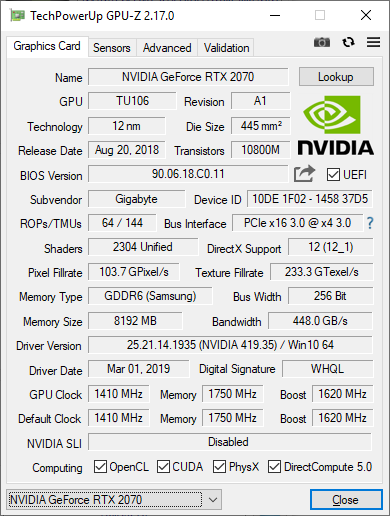
Per quanto concerne la Gaming Box RTX 2070, siamo qui per rispondere alla domanda scottante: Come si confrontano le prestazioni di una normale RTX 2070 desktop? Salteremo direttamente nei benchmark per mostrare di cosa è capace questa eGPU.
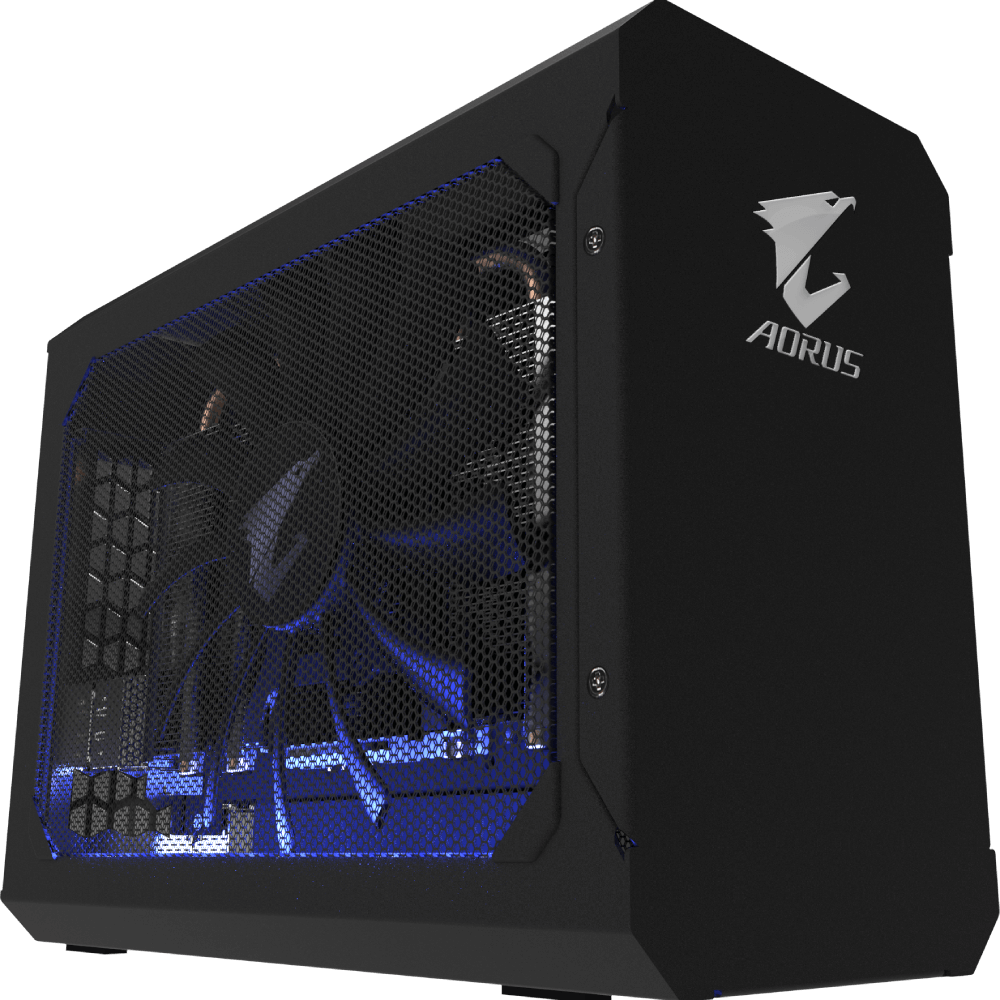
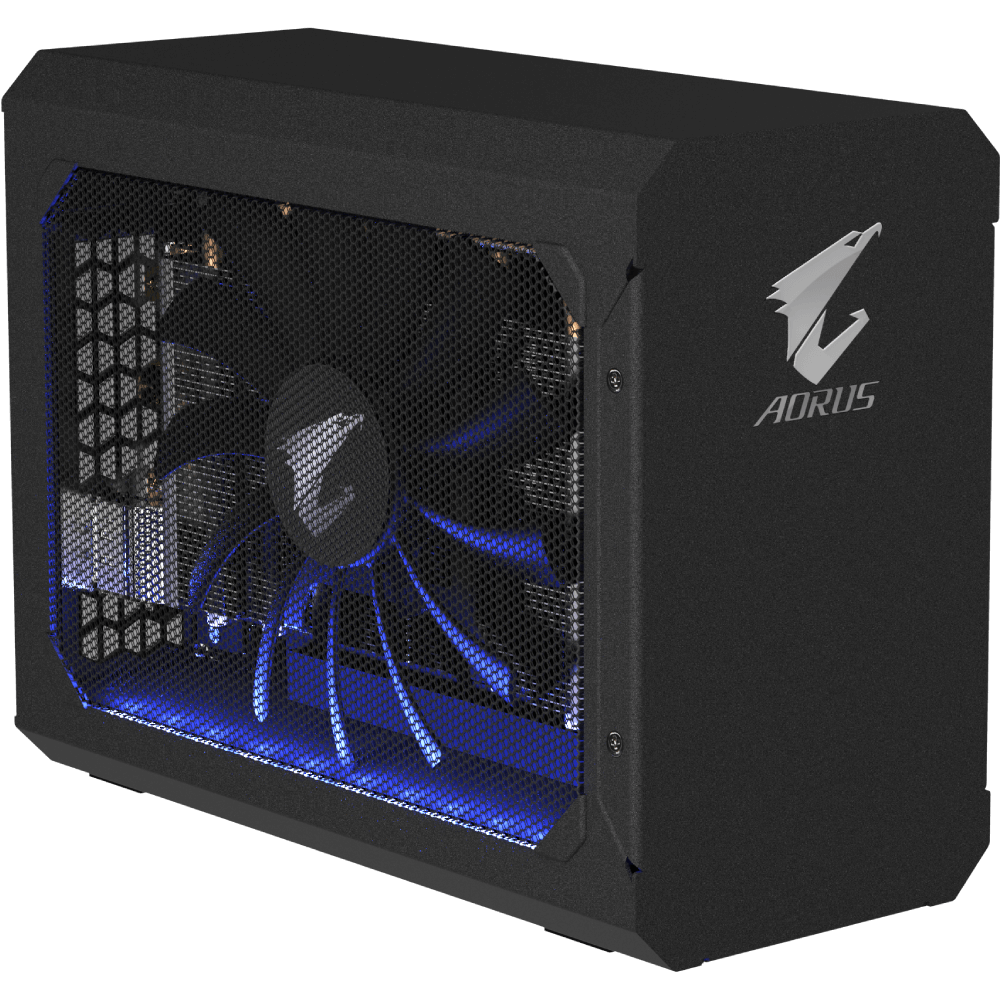
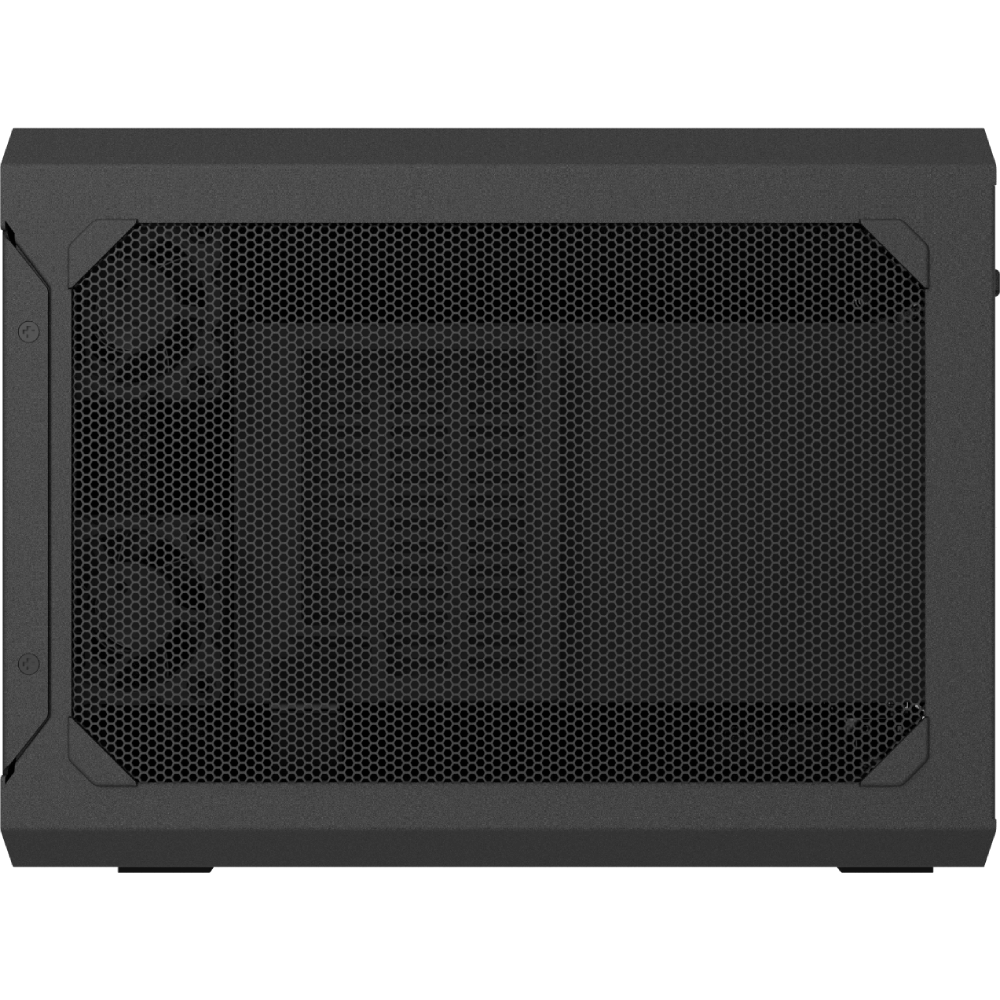
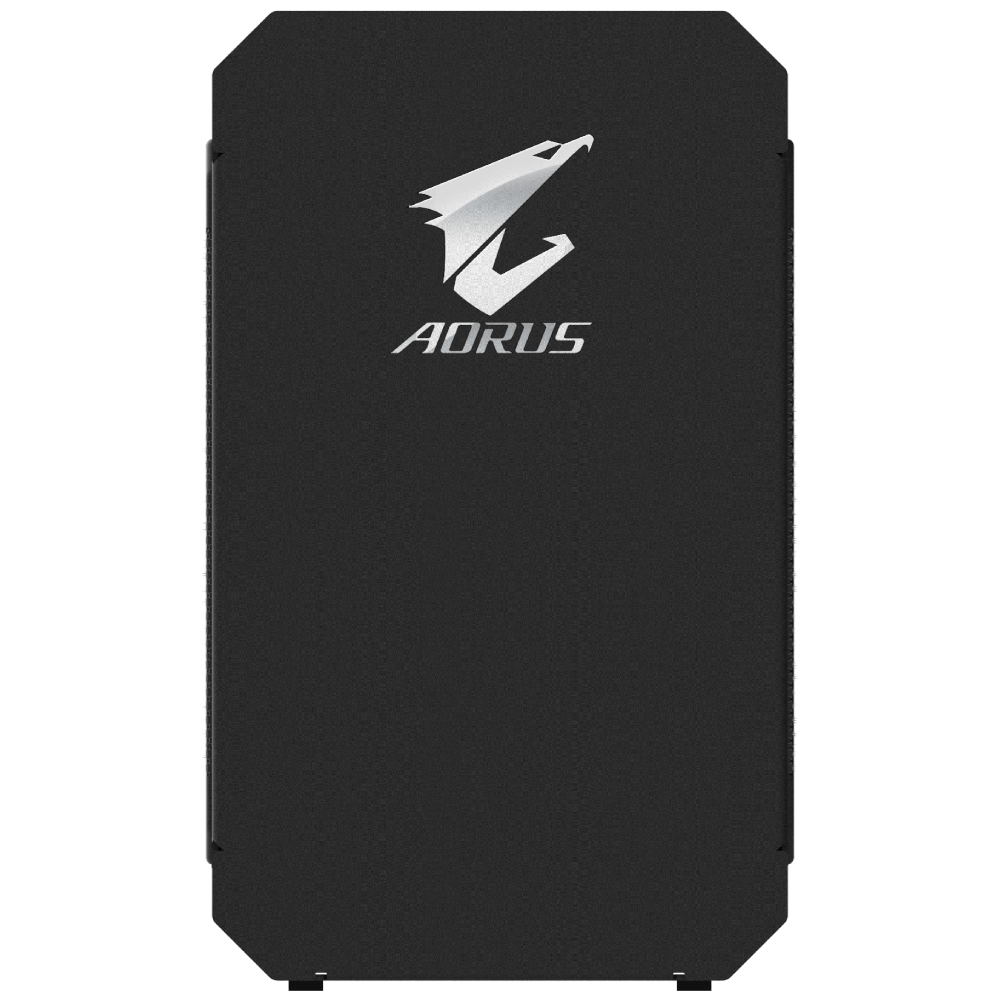
Case
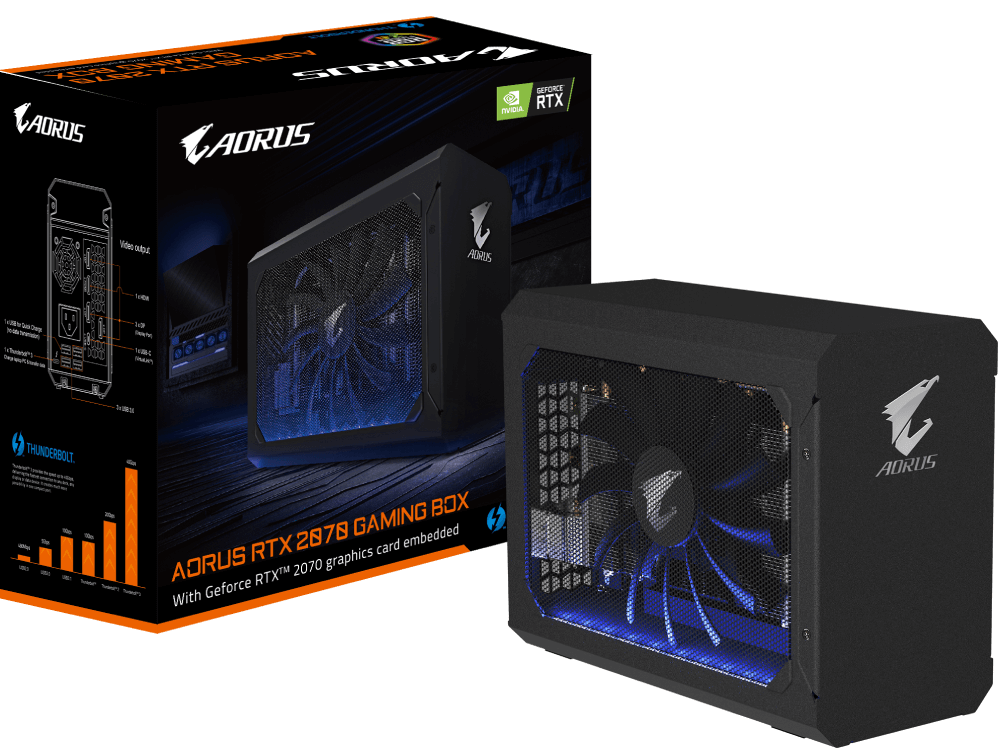
Connettività
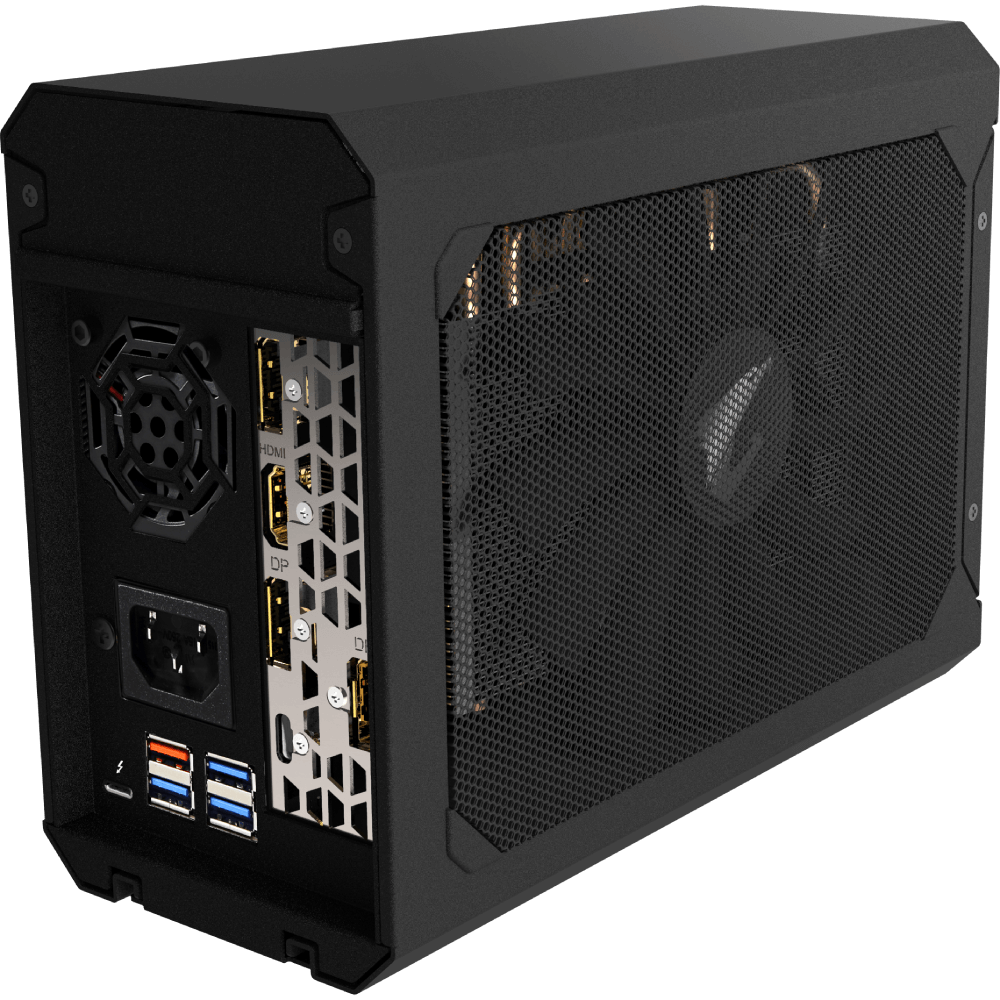
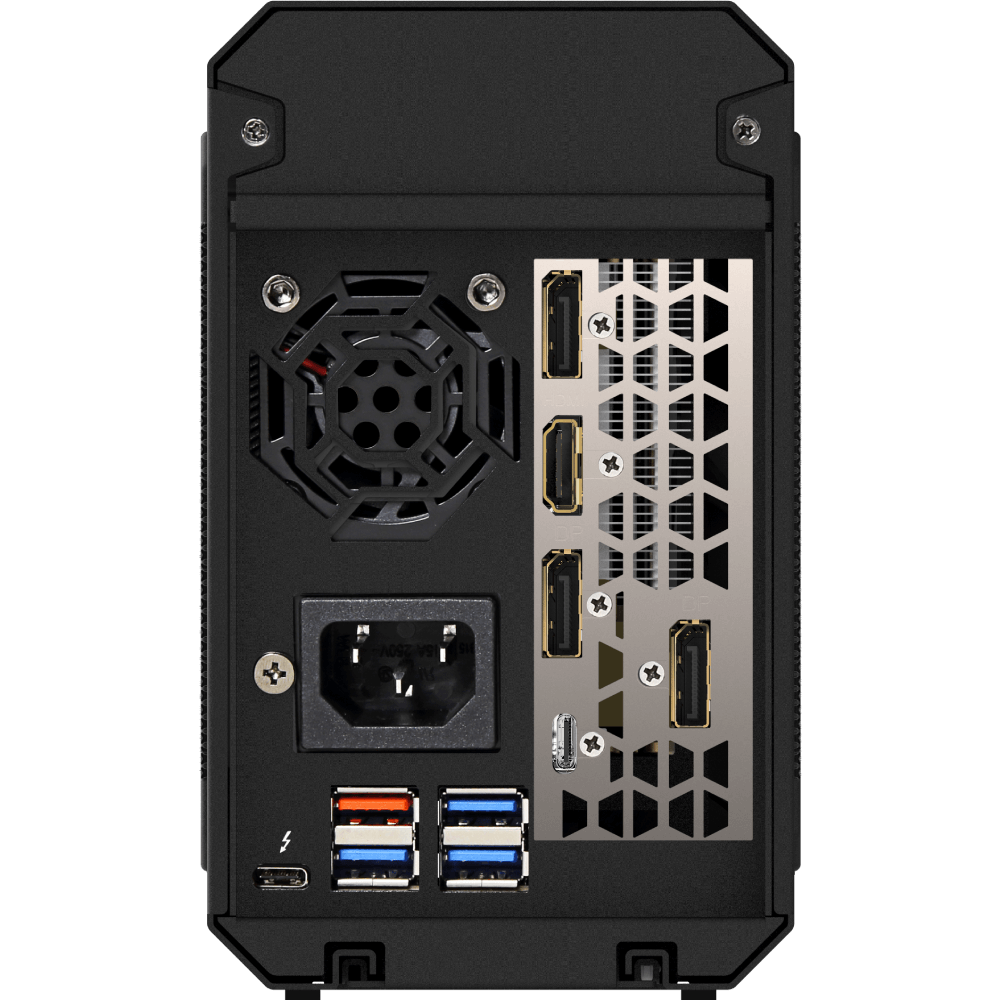
3x DisplayPort 1.4, 1x HDMI 2.0b, 4x USB 3.0, 1x USB-C (per VirtualLInk™), 1x Thunderbolt 3 (per la connessione al PC). La porta DVI del modello dell'anno scorso è stata eliminata
Sistema di Test
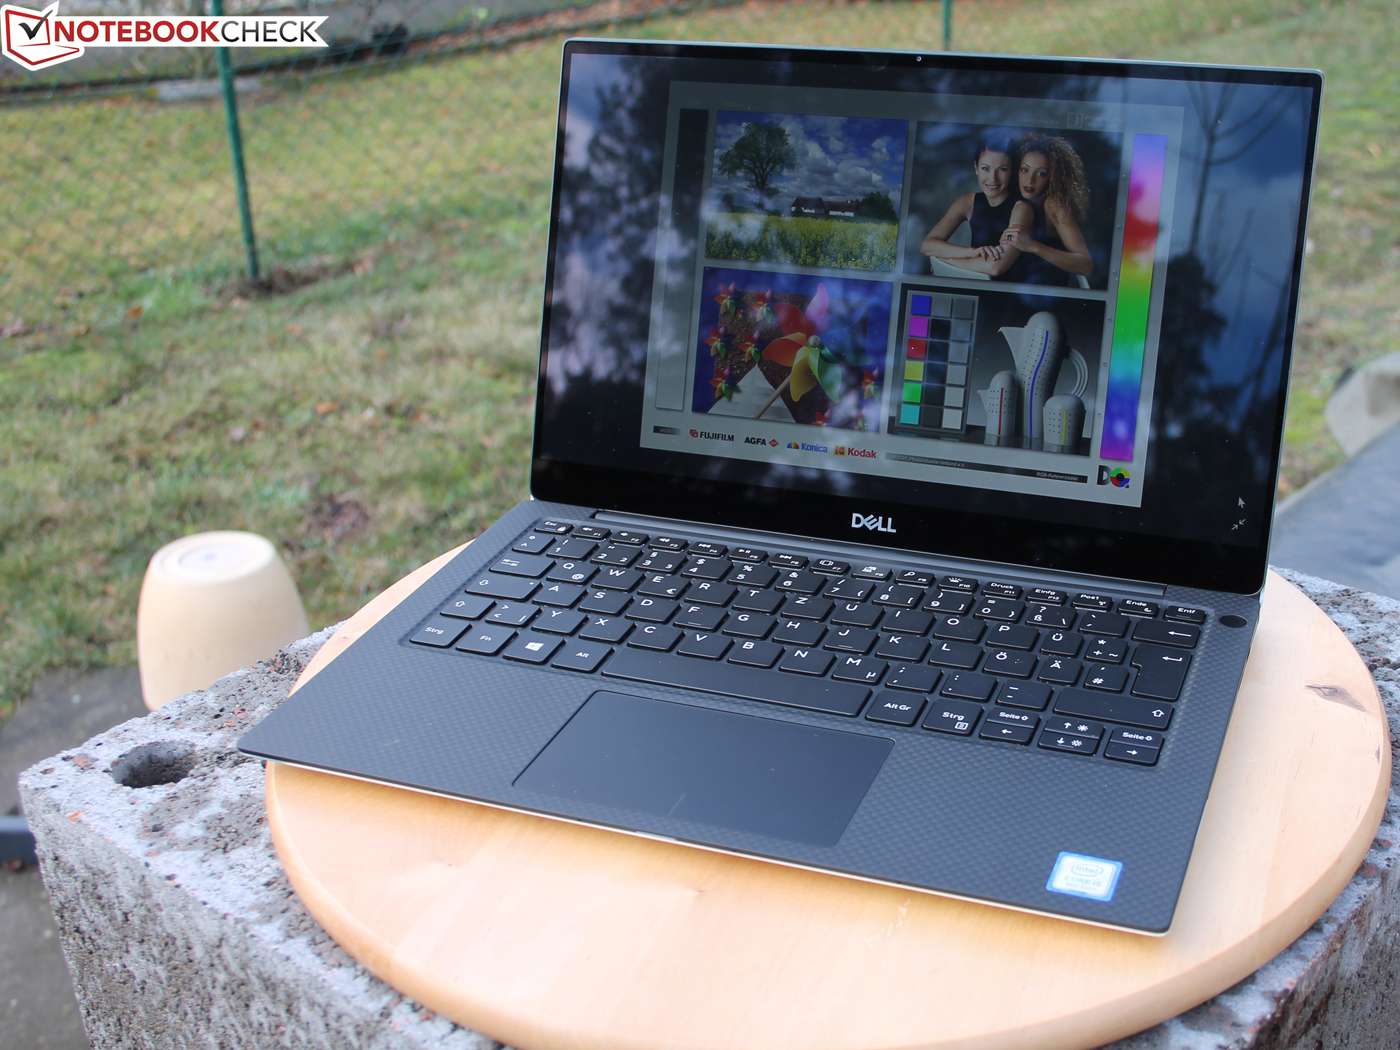
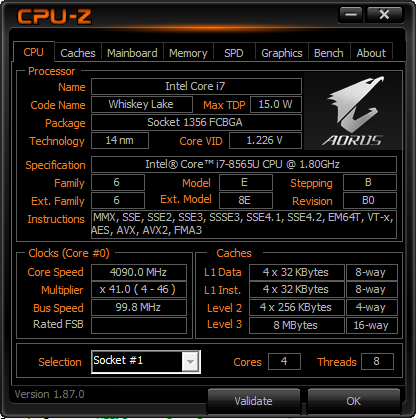
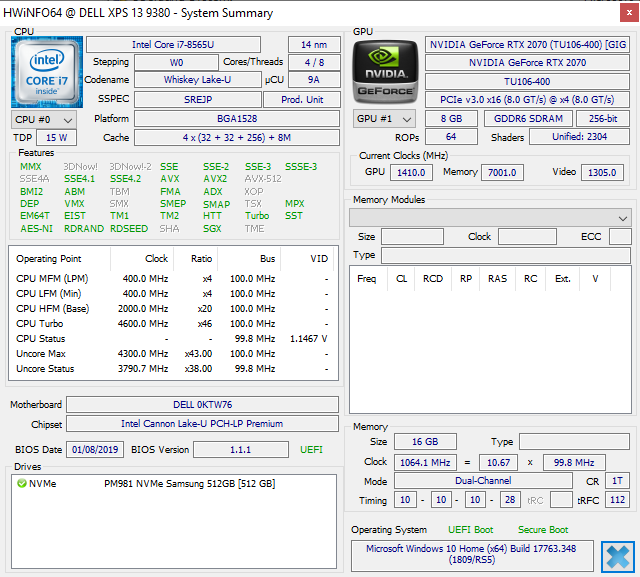
Abbiamo abbinato la Gaming Box GTX 1080 dello scorso anno con il convertibile Dell XPS 15 9575 Kaby Lake-G. Invece di utilizzare un altro Ultrabook non comune, abbiamo deciso di utilizzare il più popolare XPS 13 9380 questa volta dotato di 16 GB di RAM e di una CPU quad-core Core i7-8565U.
La configurazione della Gaming Box è relativamente semplice. Il sistema Dell riconosce automaticamente la GPU esterna una volta collegata e i driver necessari saranno scaricati. Una volta installato, il sistema si riavvia e la Gaming Box sarà pronta all'uso. Si noti che l'unità viene fornita con un vecchio driver Nvidia 416.34 che abbiamo dovuto aggiornare manualmente alla versione 419.35. Inoltre, tutti i nostri benchmark di seguito riportati sono stati eseguiti su un monitor esterno 1080p in quanto le prestazioni sarebbero state significativamente ridotte se si fosse utilizzato il display del laptop non diversamente da quanto avviene sul Razer Core. La configurazione iniziale non richiede più di pochi minuti, ma tenete presente che scollegare la Gaming Box prima di spegnere Windows provocherà inevitabilmente un crash.
L'affidabilità è ancora un po' particolare. Se un gioco non si avvia, si blocca o ha bisogno di un riavvio del sistema soft, allora il portatile potrebbe non riconoscere la dock eGPU. Scollegare e poi ricollegare la dock dopo un altro riavvio completo risolve il problema. Il concetto di eGPU ha ancora molta strada da fare prima che diventi veramente "plug and play".
Prestazioni
Prestazioni di Sistema
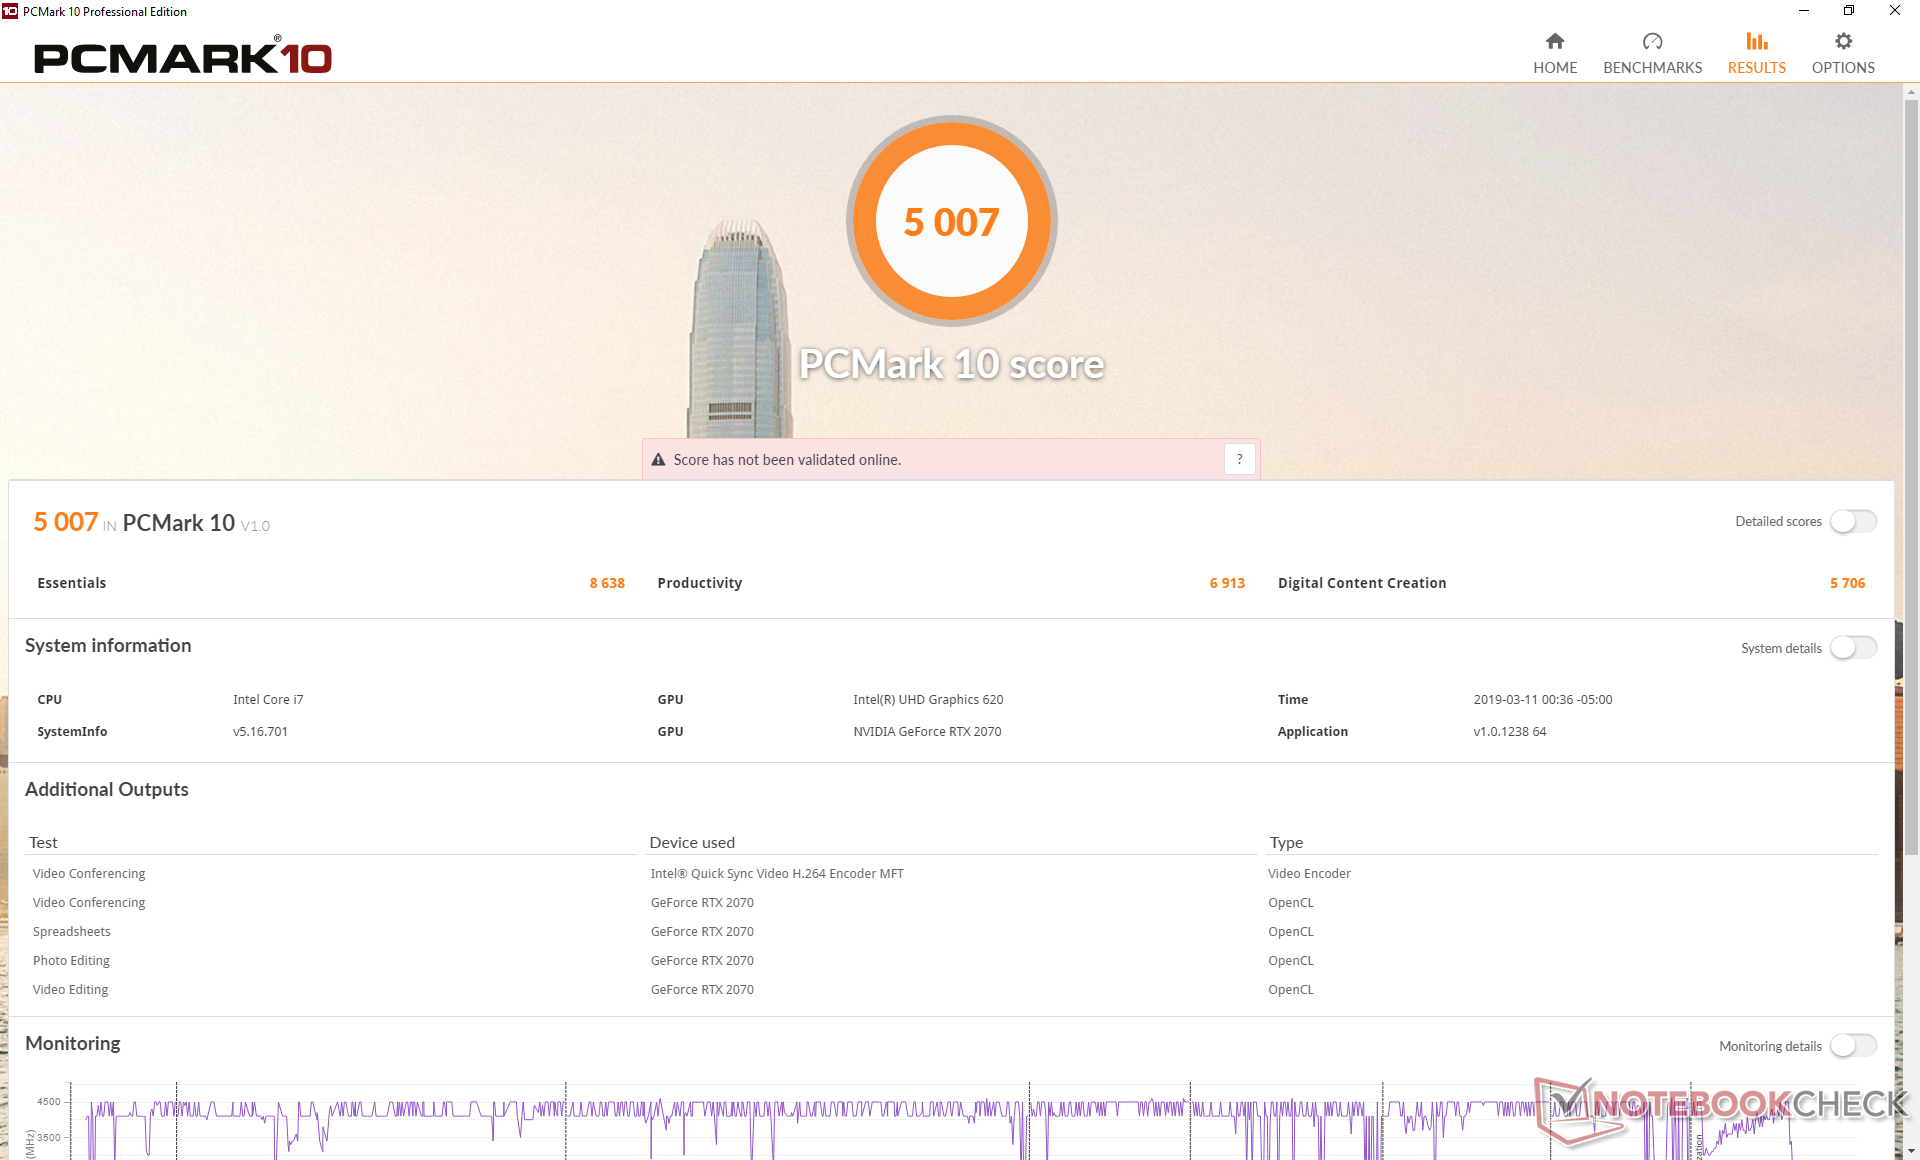
I benchmark PCMark 10 Productivity e Essentials sono quasi identici a quelli di un XPS 13 da solo senza la docking station Gaming Box. Pertanto, il computer portatile non risulterà più veloce quando si naviga sul web o si eseguono applicazioni comuni per l'ufficio. La differenza è nella creazione di contenuti digitali, dove l'eGPU può flettere i muscoli per l'editing video e il rendering grafico. Il nostro XPS 13 potenziato è in ritardo rispetto all'MSI GE75 con la stessa GPU RTX 2070 solo del 7% in questo caso particolare.
Prestazioni GPU
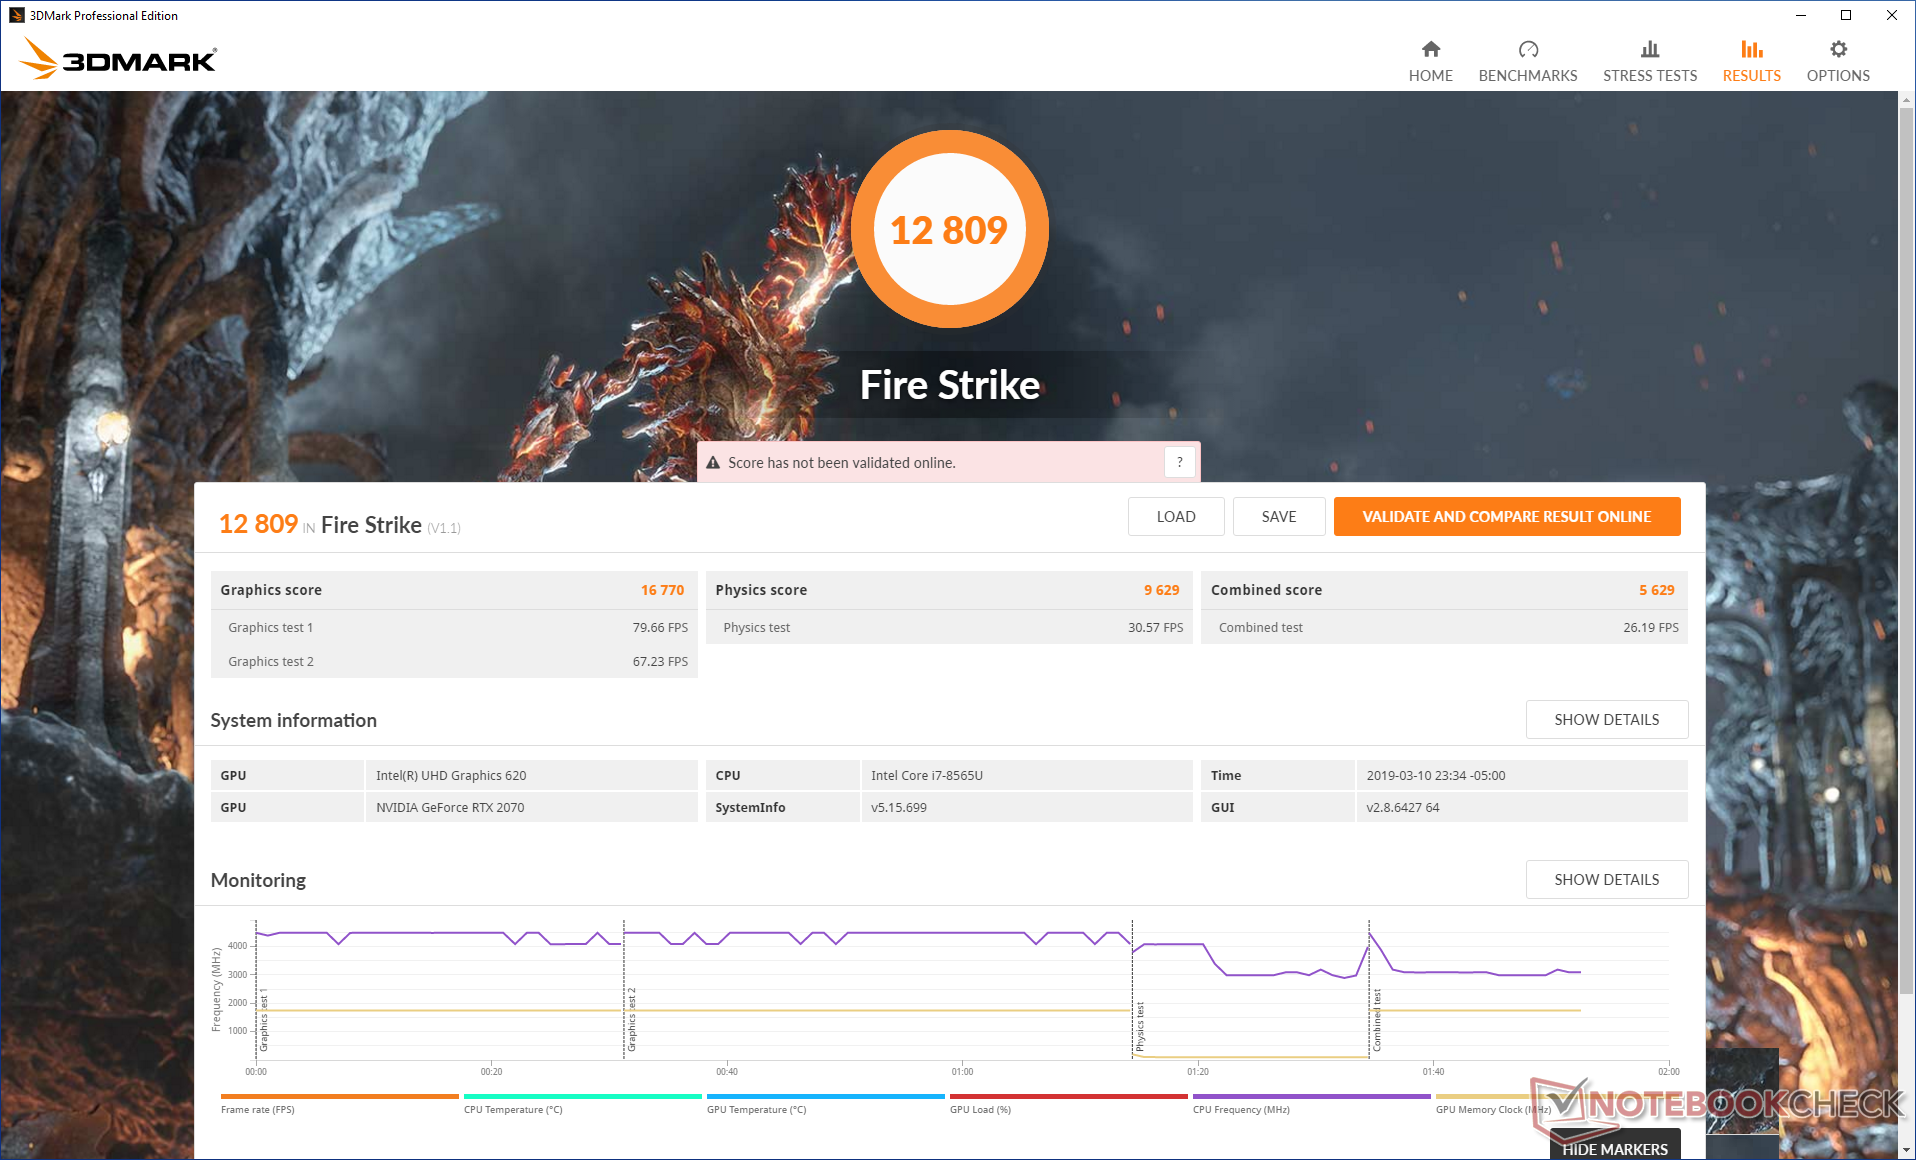
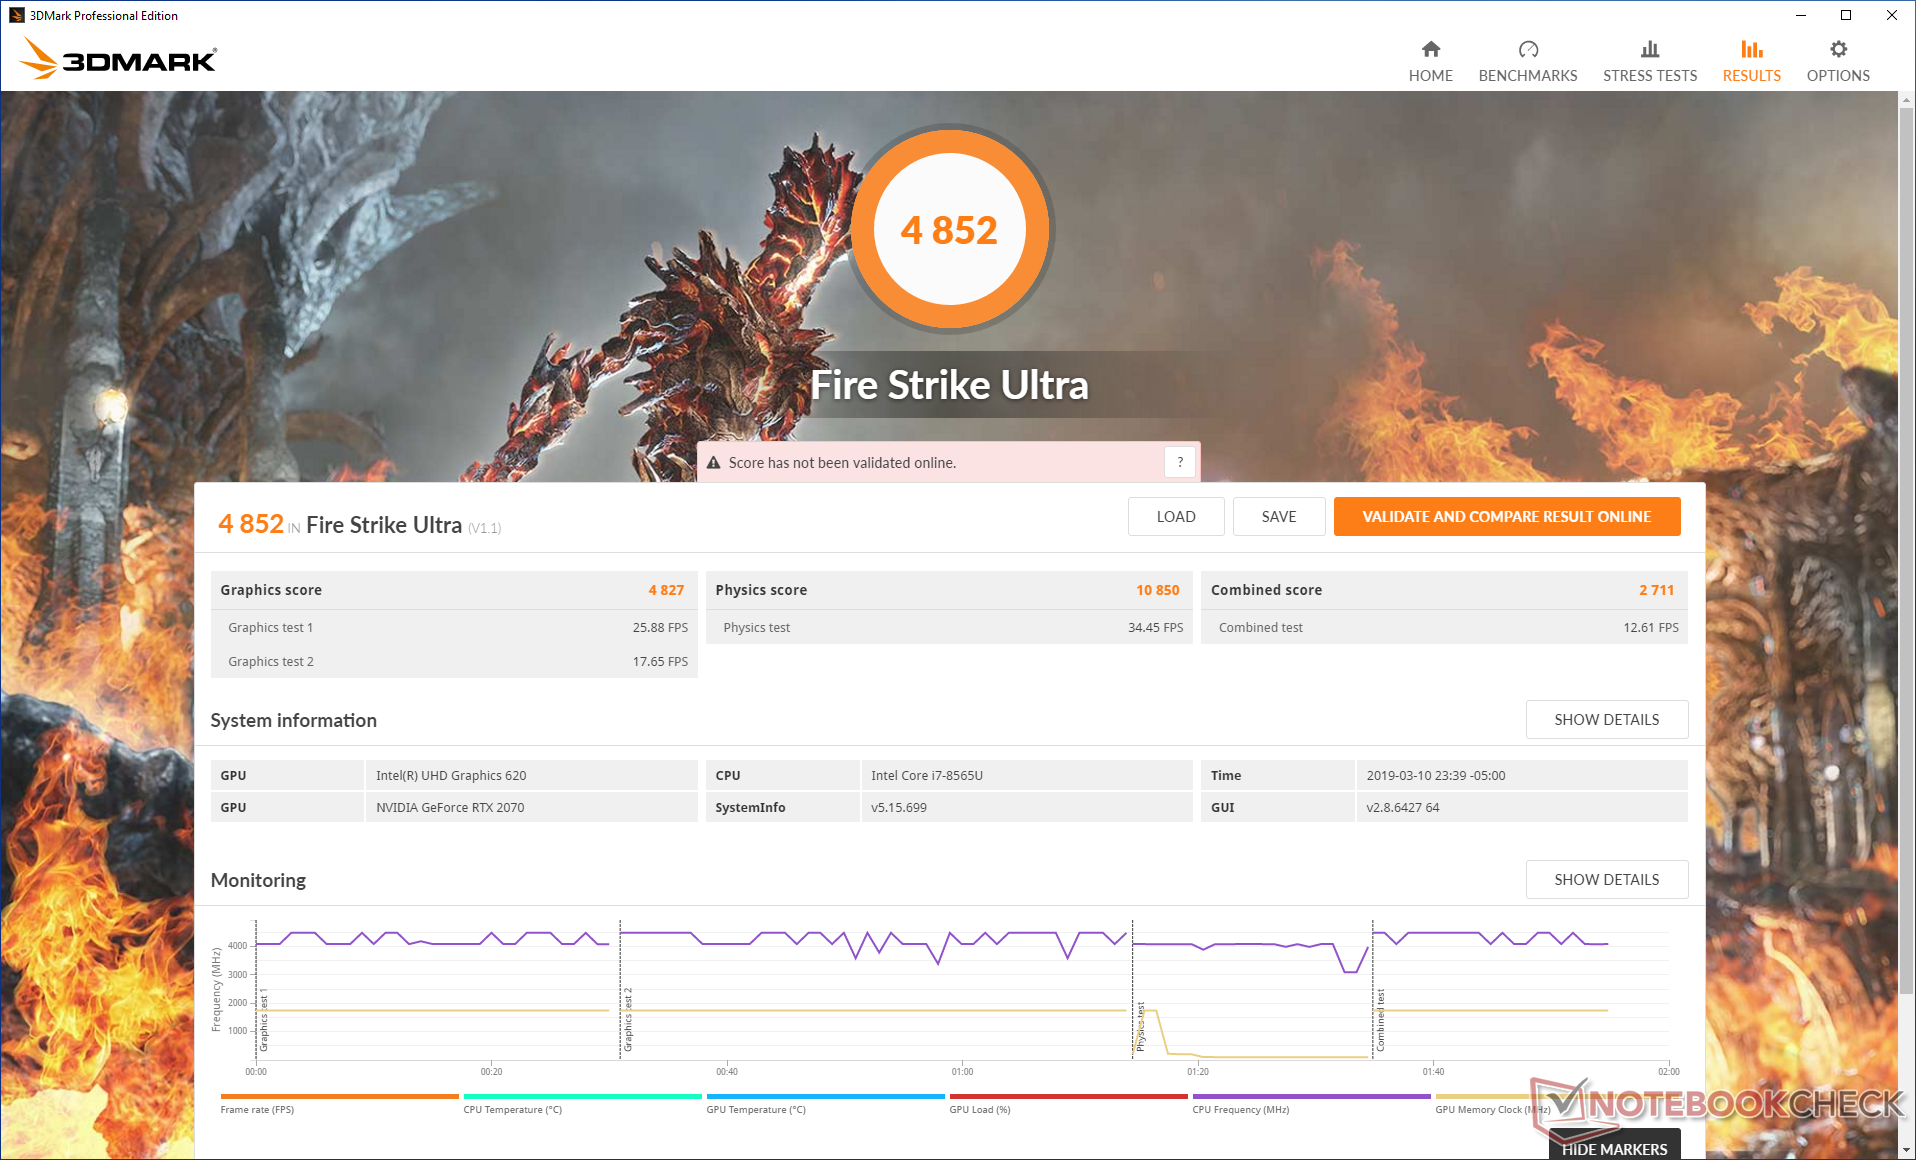
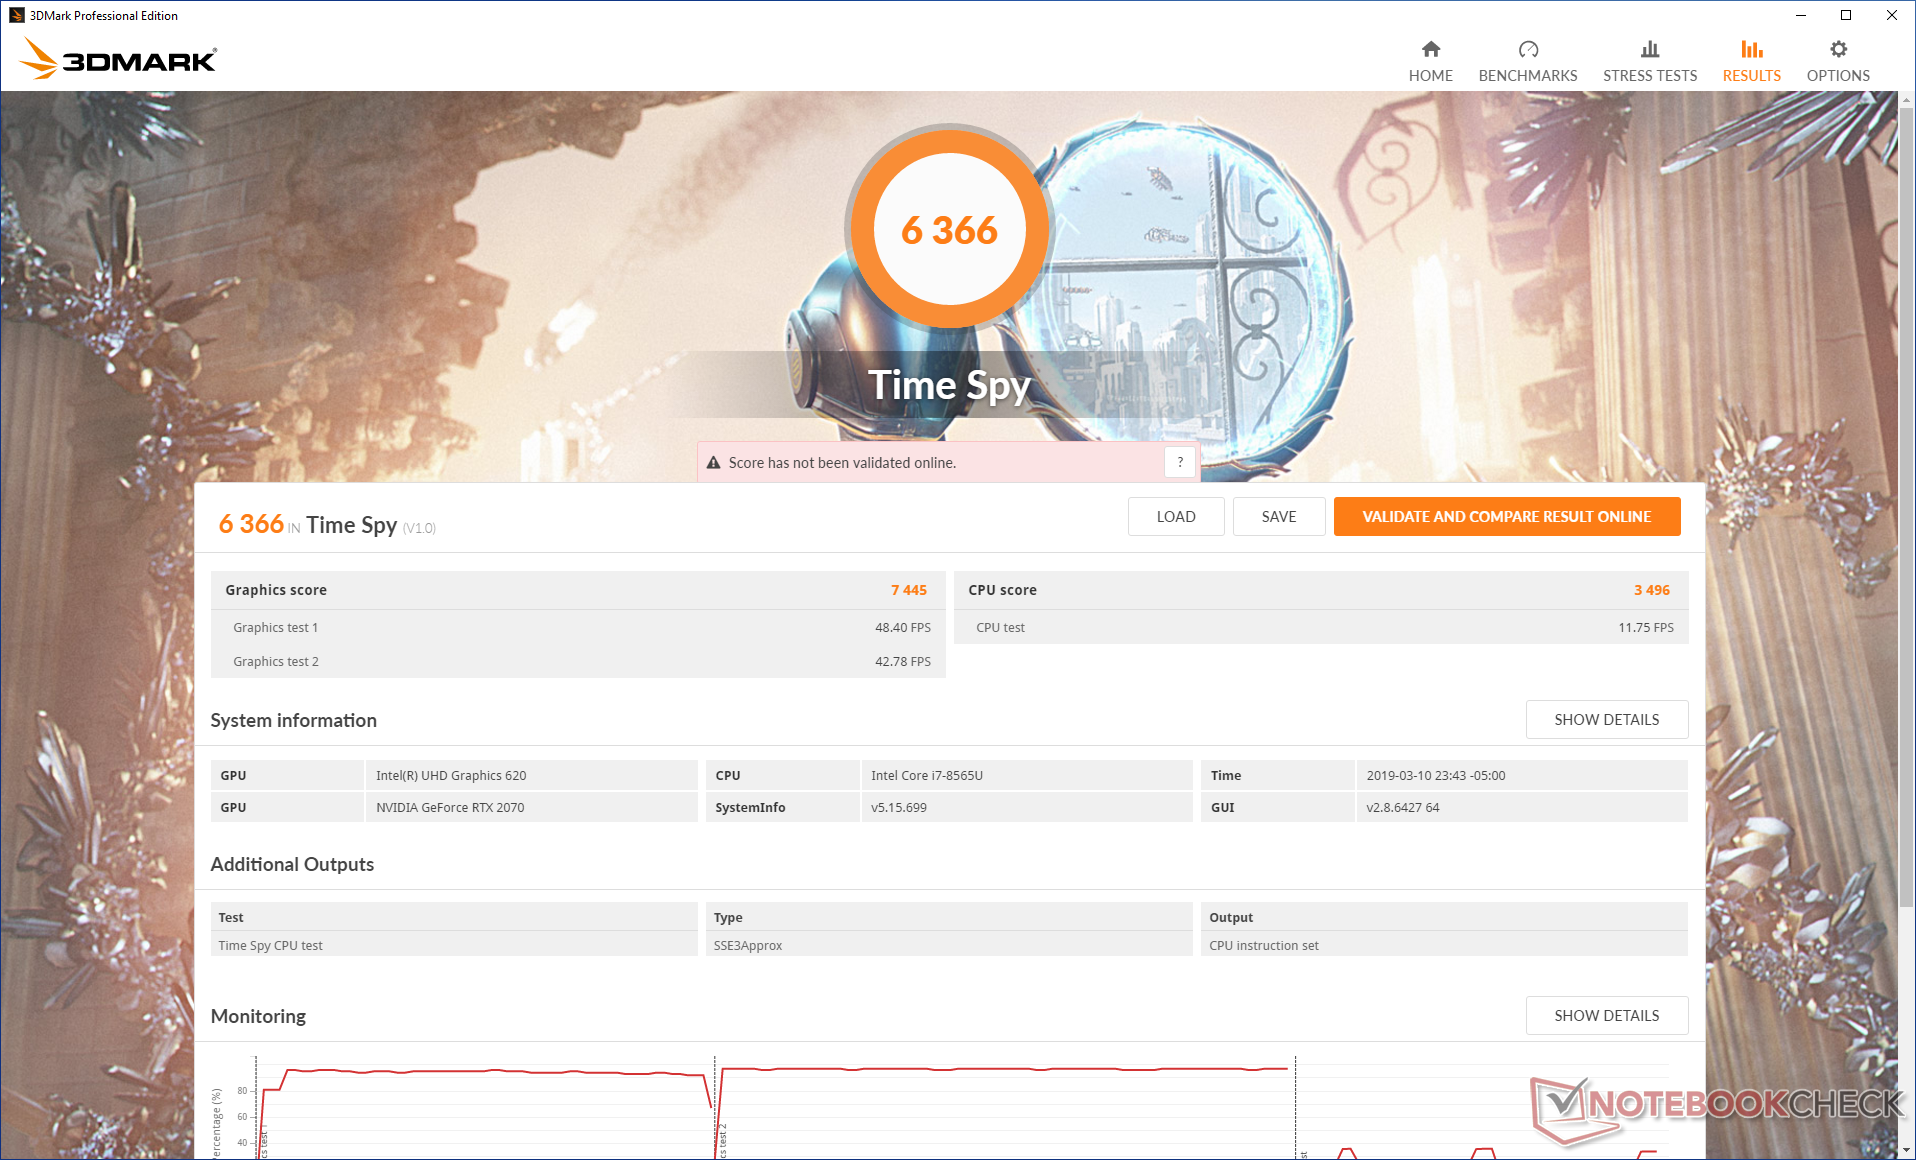
I risultati di 3DMark rispecchiano quanto osservato sulla Gaming Box GTX 1080 in quanto le prestazioni 1080p sono inferiori alle aspettative, mentre le prestazioni di 4K UHD sono molto più simili a quelle di un laptop con una RTX 2070 "normale". Fire Strike 1080p, ad esempio, è del 17 percento più lento del MSI GE75 RTX 2070 mentre i punteggi in Fire Strike Ultra 4K sono entro il 3 percento l'uno dall'altro. La creazione di uno scenario legato alla GPU aumentando la risoluzione e/o le impostazioni grafiche sarà una configurazione più ottimale per un laptop alimentato da eGPU.
Si noti che i punteggi di 3DMark non sono molto diversi da quelli del Gaming Box GTX 1080 dello scorso anno. I risultati di Fire Strike sono compresi in percentuali a una sola cifra l'uno dall'altro e quindi i motivi principali per possedere una Gaming Box RTX 2070 invece della più vecchia Gaming Box GTX 1080 riguardano le speciali funzionalità DLSS e ray-tracing.
Se confrontata con un PC desktop con GeForce RTX 2070, la docking station Aorus eGPU è dal 10 al 15% più lenta secondo i benchmark 3DMark.
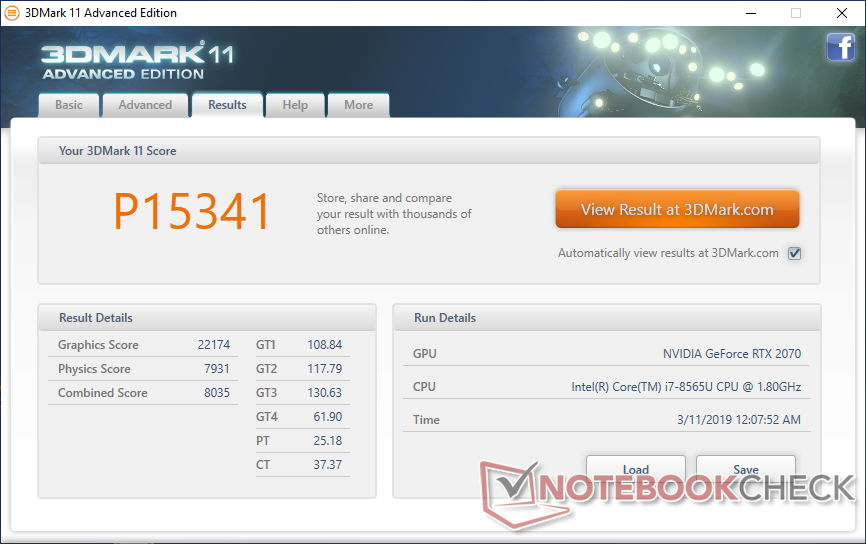
| 3DMark 11 Performance | 15341 punti | |
| 3DMark Cloud Gate Standard Score | 22847 punti | |
| 3DMark Fire Strike Score | 12809 punti | |
| 3DMark Time Spy Score | 6366 punti | |
Aiuto | ||
Prestazioni Gaming
Le prestazioni di gioco nel mondo reale sono più variabili, ma generalmente più lente di quanto suggeriscono i risultati del nostro 3DMark. I titoli pesanti tripla A come Rise of the Tomb Raider, Witcher 3 e Final Fantasy 15 sono circa il 40% più lenti di un PC desktop standard con grafica GeForce RTX 2070. In effetti, le prestazioni complessive sono più simili a quelle di una Gaming Box GTX 1080 o di un laptop standard GTX 1060 in alcuni casi. Il sistema si avvicina al massimo a un laptop RTX 2060 se abbinato al Core i7-8565U a basso consumo.
Metro Exodus funzionerà a 1080p con impostazioni Ultra e ray-tracing abilitato, il che è sorprendente di per sé. Tuttavia, le prestazioni di un PC desktop standard con grafica GeForce RTX 2070 sono ancora una volta molto elevate: dal 40 al 45 percento circa di un PC desktop standard con grafica GeForce RTX 2070. Le prestazioni sono addirittura inferiori di quasi il 30% rispetto a un vero e proprio notebook GTX 1070.
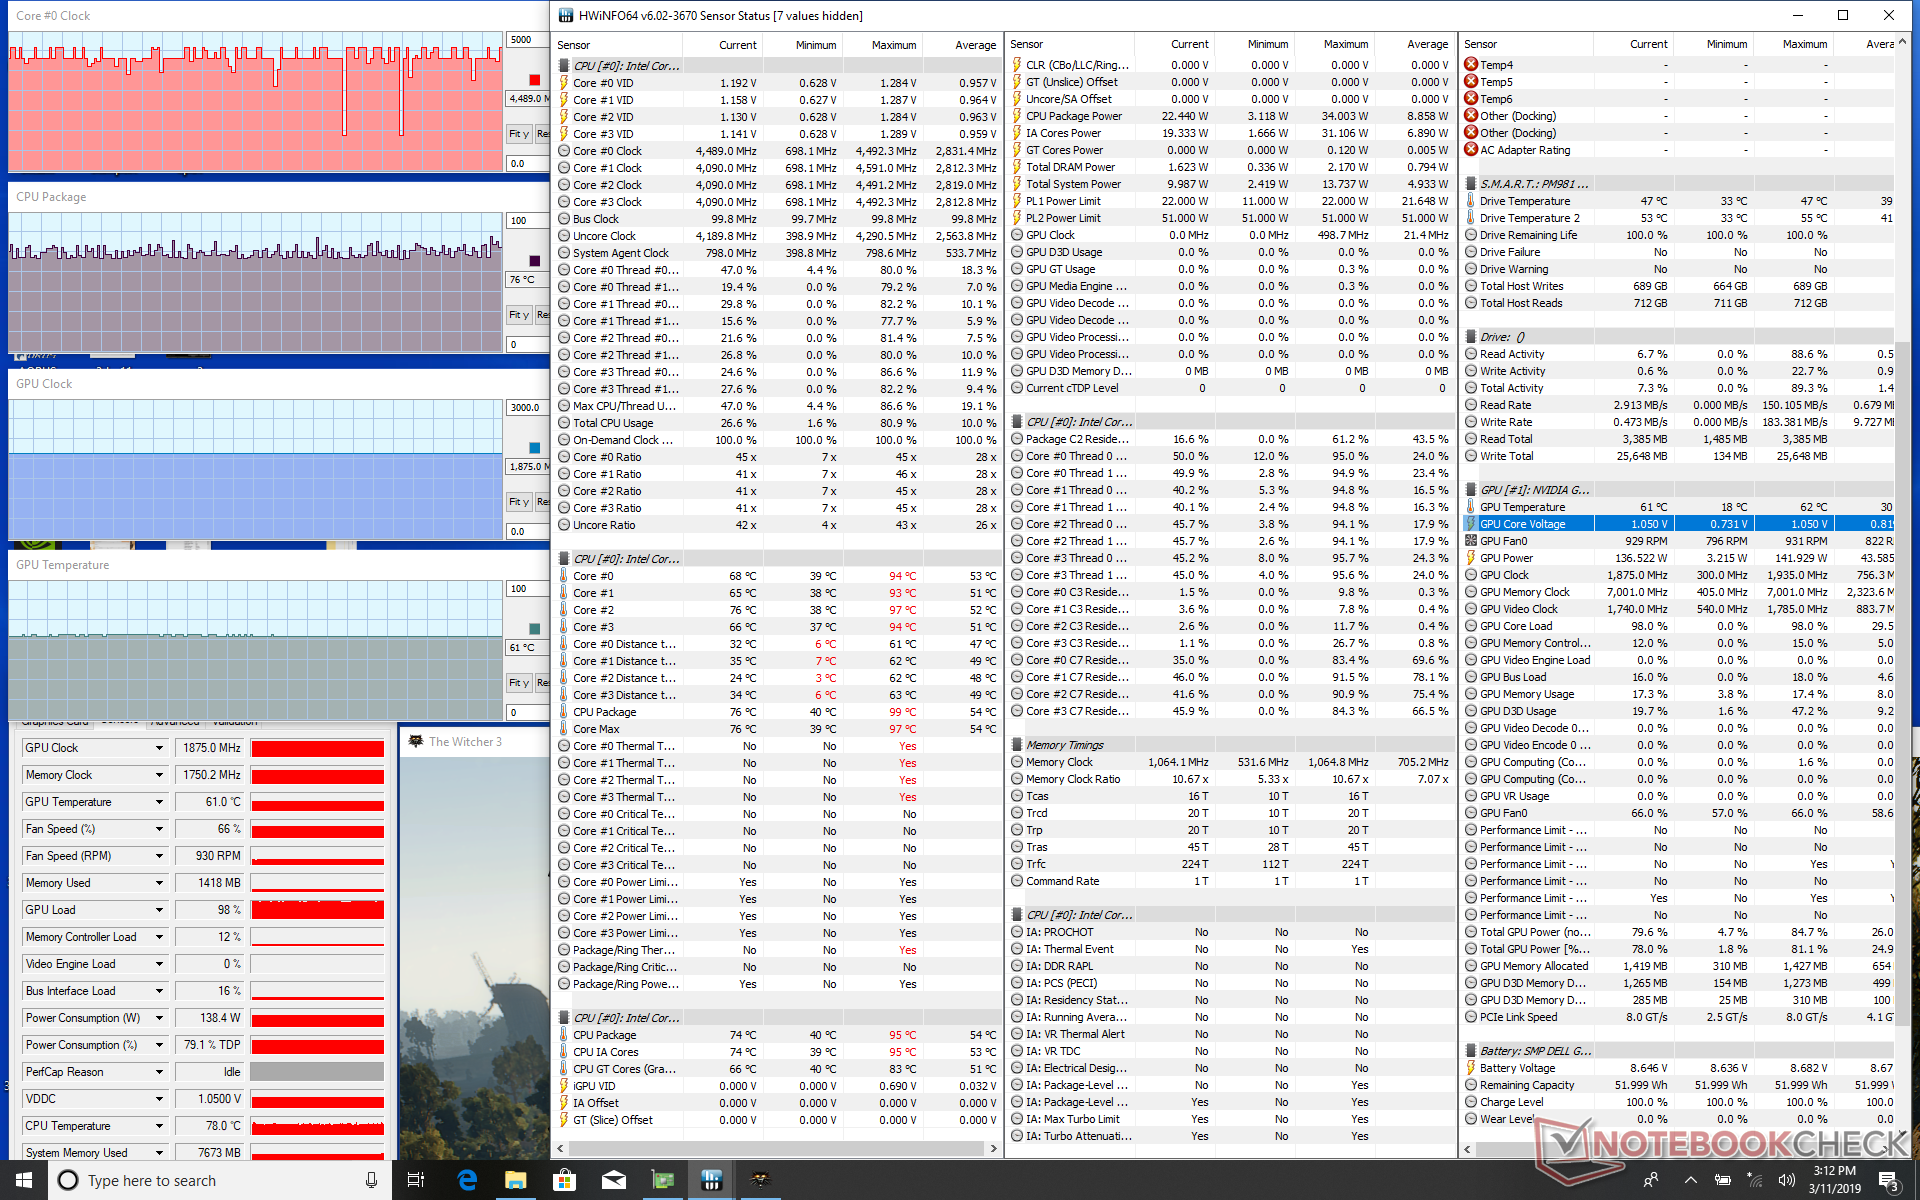
In idle su Witcher 3 non ci sono scatti ricorrenti dei frames il che suggerisce l'assenza di interruzione delle attività di background.
| Middle-earth: Shadow of War | |
| 1280x720 Lowest Preset | |
| Asus G752VS | |
| Aorus Gaming Box RTX 2070 | |
| Media NVIDIA GeForce RTX 2070 (Desktop) (n=1) | |
| 1920x1080 Medium Preset AA:T | |
| Asus Zephyrus S GX701GX | |
| Asus G752VS | |
| Aorus Gaming Box RTX 2070 | |
| Media NVIDIA GeForce RTX 2070 (Desktop) (n=1) | |
| 1920x1080 High Preset AA:T | |
| Asus Zephyrus S GX701GX | |
| Asus G752VS | |
| Aorus Gaming Box RTX 2070 | |
| Media NVIDIA GeForce RTX 2070 (Desktop) (n=1) | |
| Aorus GTX 1080 Gaming Box (XPS 15 9575) | |
| 1920x1080 Ultra Preset AA:T | |
| Asus Zephyrus S GX701GX | |
| Asus G752VS | |
| Aorus Gaming Box RTX 2070 | |
| Media NVIDIA GeForce RTX 2070 (Desktop) (n=1) | |
| Aorus GTX 1080 Gaming Box (XPS 15 9575) | |
| 3840x2160 Ultra Preset AA:T | |
| Asus Zephyrus S GX701GX | |
| Aorus Gaming Box RTX 2070 | |
| Media NVIDIA GeForce RTX 2070 (Desktop) (n=1) | |
| Asus G752VS | |
| Overwatch | |
| 1280x720 Low (Render Scale 100 %) AA:FX AF:1x | |
| MSI RTX 2070 Gaming Z 8G | |
| Media NVIDIA GeForce RTX 2070 (Desktop) (297 - 300, n=4) | |
| Aorus Gaming Box RTX 2070 | |
| MSI RTX 2060 Gaming Z 6G | |
| 1366x768 Medium (Render Scale 100 %) AA:FX AF:2x | |
| MSI RTX 2070 Gaming Z 8G | |
| Media NVIDIA GeForce RTX 2070 (Desktop) (290 - 300, n=4) | |
| Aorus Gaming Box RTX 2070 | |
| MSI RTX 2060 Gaming Z 6G | |
| 1920x1080 High (Render Scale 100 %) AA:SM AF:4x | |
| Asus Zephyrus S GX701GX | |
| MSI RTX 2060 Gaming Z 6G | |
| MSI RTX 2070 Gaming Z 8G | |
| Media NVIDIA GeForce RTX 2070 (Desktop) (201 - 228, n=4) | |
| Aorus Gaming Box RTX 2070 | |
| 1920x1080 Epic (Render Scale 100 %) AA:SM AF:16x | |
| MSI RTX 2070 Gaming Z 8G | |
| Asus Zephyrus S GX701GX | |
| Media NVIDIA GeForce RTX 2070 (Desktop) (141 - 206, n=4) | |
| Aorus GTX 1080 Gaming Box (XPS 15 9575) | |
| Aorus Gaming Box RTX 2070 | |
| MSI RTX 2060 Gaming Z 6G | |
| basso | medio | alto | ultra | 4K | |
|---|---|---|---|---|---|
| BioShock Infinite (2013) | 267.5 | 226.3 | 213.6 | 123 | |
| Metro: Last Light (2013) | 117.2 | 114.1 | 110.5 | 89.6 | |
| The Witcher 3 (2015) | 151.4 | 112.3 | 80 | 40.9 | |
| Batman: Arkham Knight (2015) | 122 | 119 | 101 | 45 | |
| Metal Gear Solid V (2015) | 60 | 60 | 60 | 60 | |
| Fallout 4 (2015) | 141.5 | 109.9 | 101.1 | ||
| Rise of the Tomb Raider (2016) | 147.9 | 117.8 | 90.4 | 79.1 | |
| Ashes of the Singularity (2016) | 64.9 | 53 | 52.4 | ||
| Overwatch (2016) | 296.9 | 290.1 | 200.6 | 147.8 | |
| Middle-earth: Shadow of War (2017) | 137 | 111 | 96 | 77 | 40 |
| Final Fantasy XV Benchmark (2018) | 106.5 | 83.9 | 60.8 | ||
| Monster Hunter World (2018) | 90.7 | 81.4 | 77.3 | 64.6 | |
| Shadow of the Tomb Raider (2018) | 88 | 63 | 61 | 58 | |
| Metro Exodus (2019) | 82.7 | 53.4 | 41 | 33.4 |
Emissioni
Rumorosità di sistema
Per misurare il rumore della ventola, collochiamo la parte anteriore della dock (il lato con il logo Aorus) di fronte a 15 cm di distanza dal nostro microfono. Il rumore è sempre presente poiché la ventola della GPU non si ferma mai quando la docking station è attiva. Stranamente, la ventola sembra pulsare e gira più frequentemente rispetto alla Gaming Box GTX 1080 durante i carichi medio-bassi. Il software Aorus Engine consente fortunatamente il controllo manuale della ventola per risolvere questo problema.
Quando si utilizza Witcher 3 come carico di gioco di base, il rumore della ventola diventa più o meno lo stesso di quello che abbiamo misurato sulla Gaming Box GTX 1080 a 41-42 dB(A). I risultati sono generalmente più bassi rispetto alla maggior parte dei computer portatili di gioco, soprattutto perché le ventole dei computer portatili sono in genere più piccole e con un'inclinazione maggiore.
| Aorus Gaming Box RTX 2070 GeForce RTX 2070 (Desktop), i7-8565U, Samsung SSD PM981 MZVLB512HAJQ | Asus ROG G703GX GeForce RTX 2080 Mobile, i7-8750H, Samsung SSD PM981 MZVLB512HAJQ | MSI GT75 8RG-090 Titan GeForce GTX 1080 Mobile, i9-8950HK, 2x Samsung PM961 MZVLW256HEHP (RAID 0) | Lenovo Legion Y740-17ICH GeForce RTX 2080 Max-Q, i7-8750H, Samsung SSD PM981 MZVLB256HAHQ | MSI GE75 8SF GeForce RTX 2070 Mobile, i7-8750H, Kingston RBUSNS8154P3256GJ1 | Aorus GTX 1080 Gaming Box (XPS 15 9575) GeForce GTX 1080 (Desktop), | |
|---|---|---|---|---|---|---|
| Noise | -7% | -11% | 8% | -4% | 4% | |
| off /ambiente * (dB) | 30 | 30 -0% | 30 -0% | 28.3 6% | 28.3 6% | 28 7% |
| Idle Minimum * (dB) | 32.7 | 30 8% | 32 2% | 31.5 4% | 33.5 -2% | 32.6 -0% |
| Idle Average * (dB) | 37 | 35 5% | 34 8% | 31.6 15% | 33.6 9% | 32.6 12% |
| Idle Maximum * (dB) | 38.9 | 41 -5% | 37 5% | 31.6 19% | 35 10% | 32.7 16% |
| Load Average * (dB) | 39.6 | 44 -11% | 43 -9% | 32.3 18% | 38 4% | 32.7 17% |
| Witcher 3 ultra * (dB) | 41.6 | 51 -23% | 57 -37% | 43 -3% | 50 -20% | 42.2 -1% |
| Load Maximum * (dB) | 43 | 52 -21% | 62 -44% | 45.5 -6% | 56.9 -32% | 54.2 -26% |
* ... Meglio usare valori piccoli
Rumorosità
| Idle |
| 32.7 / 37 / 38.9 dB(A) |
| Sotto carico |
| 39.6 / 43 dB(A) |
 | ||
30 dB silenzioso 40 dB(A) udibile 50 dB(A) rumoroso |
||
min: | ||
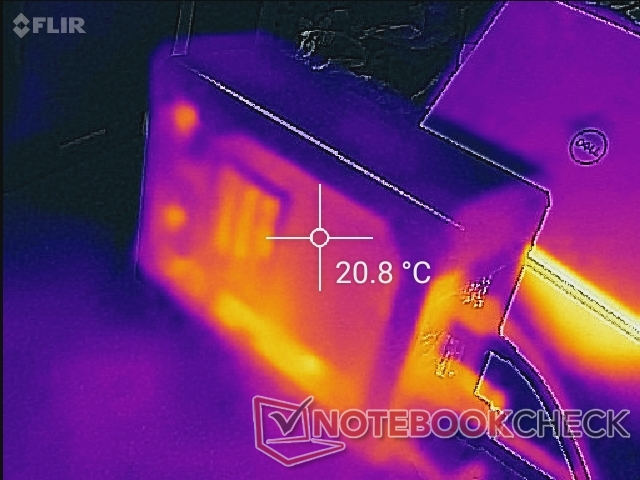
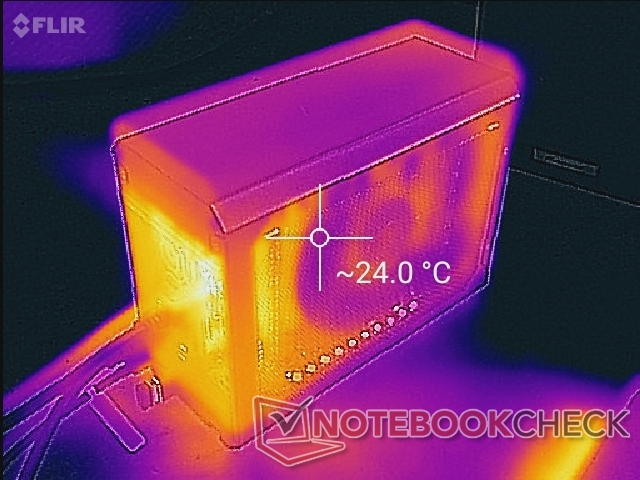
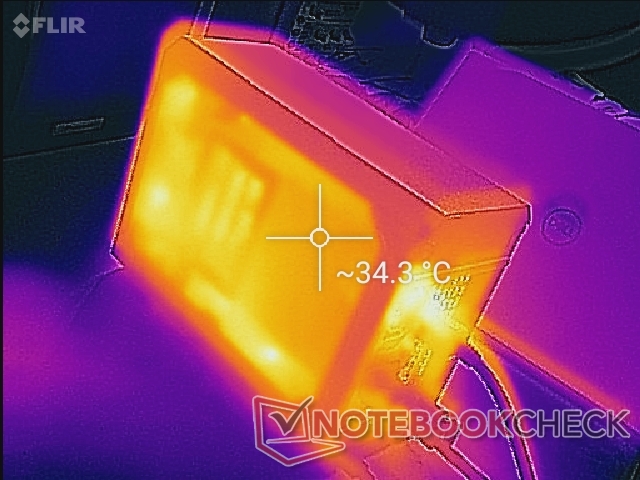
Temperature
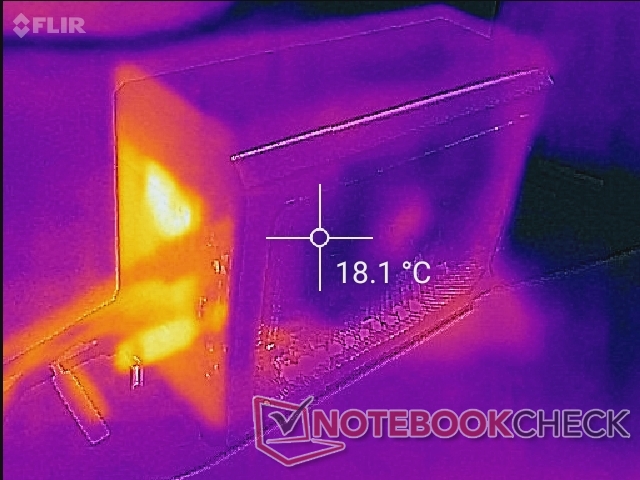
Le temperature di superficie non sono un problema per la Gaming Box. Si noti che l'unità non deve mai essere posizionata lateralmente o contro una parete, altrimenti la ventilazione sarà bloccata.
Stress Test
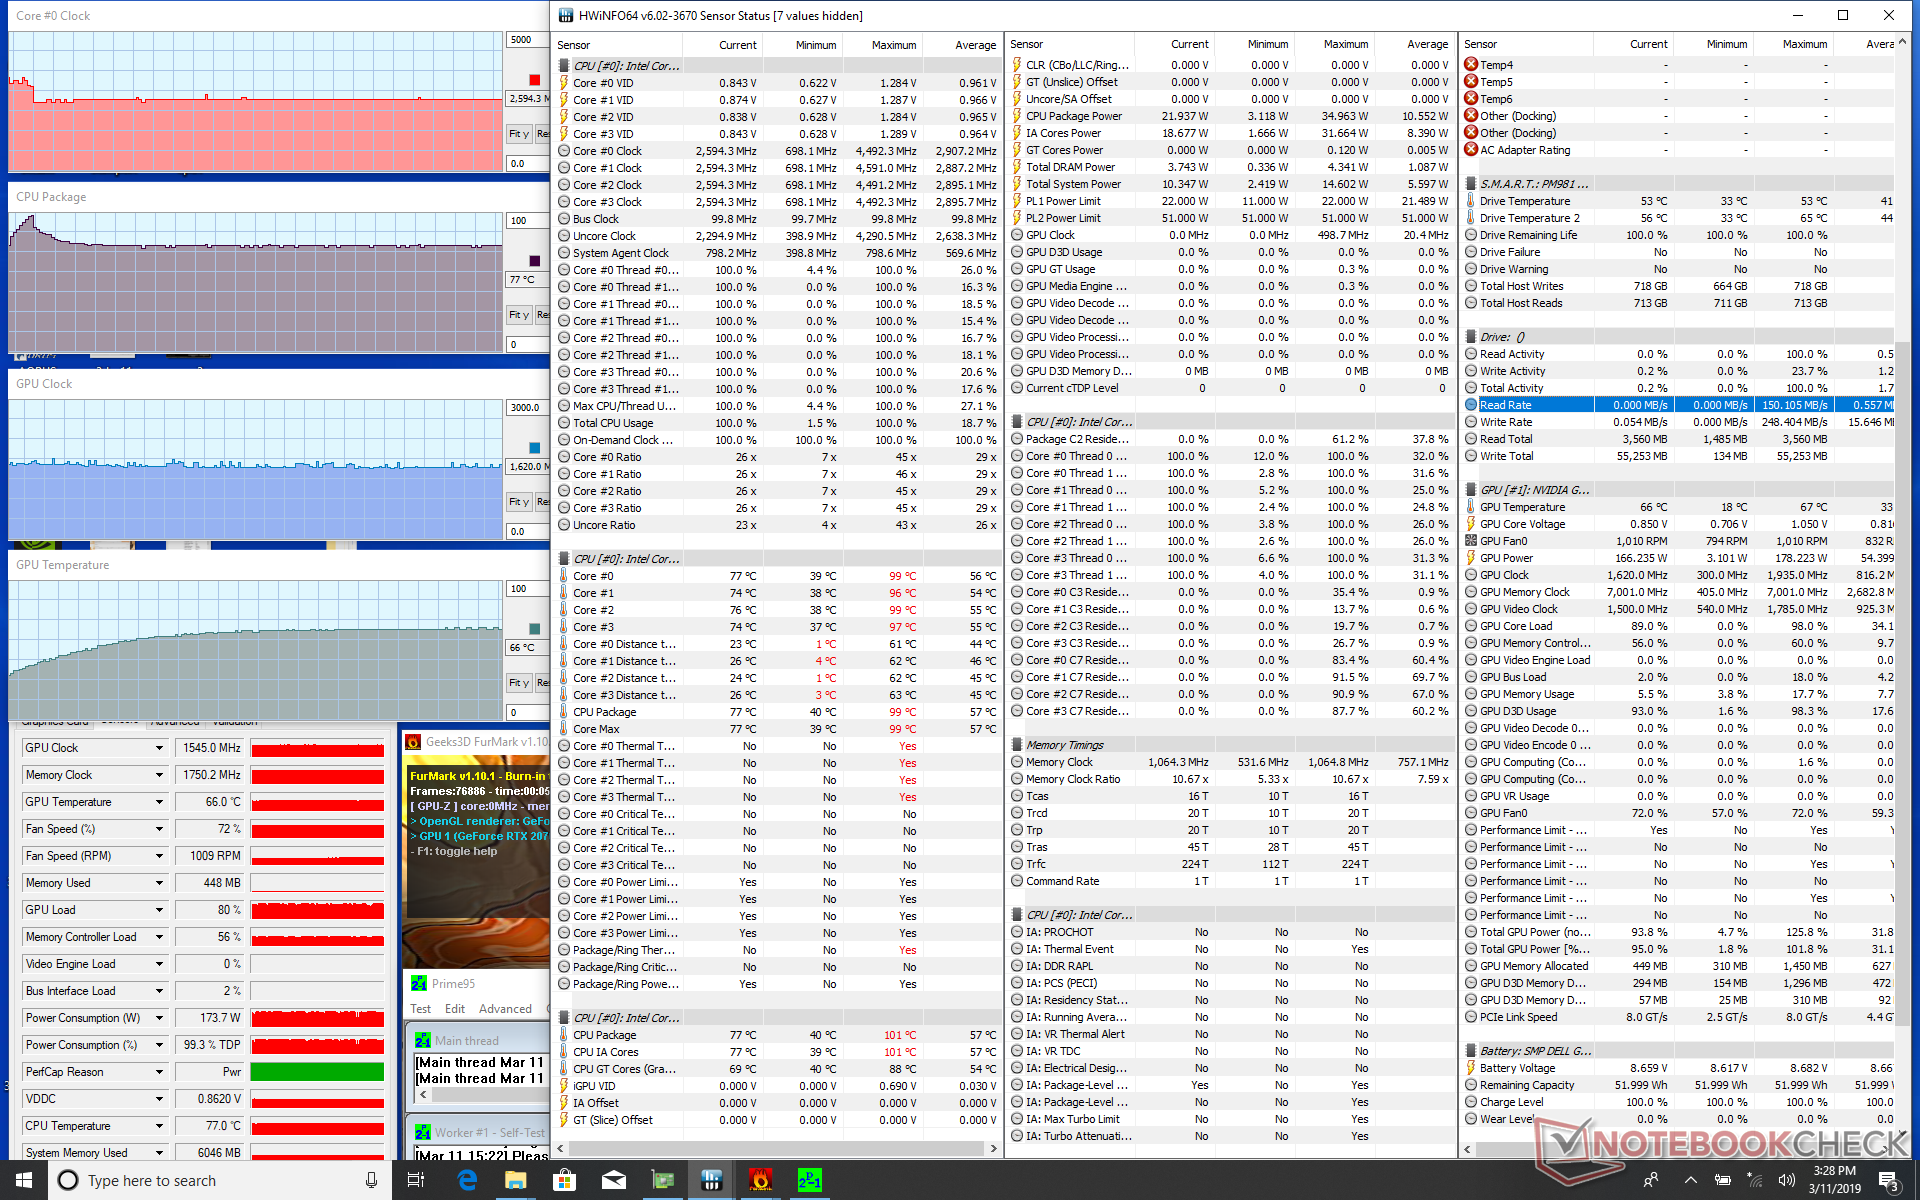
La temperatura delle GPU durante l'esecuzione di FurMark si stabilizza a 66 °C risultando più elevata rispetto alla Gaming Box GTX 1080 dello scorso anno, ma comunque relativamente fredda rispetto alle GPU per laptop. La temperatura interna e la frequenza di clock sono costanti a 61 °C e 1875 MHz, rispettivamente, quando Witcher 3 è in esecuzione. Al contrario, l'RTX 2070 mobile dell'MSI GE75 arriva a 71 °C e 1560 MHz nelle stesse condizioni di Witcher 3. L'Aorus Gaming Box dovrebbe essere più veloce sulla carta, ma il vantaggio delle prestazioni va ancora al laptop MSI con la sua RTX 2070 integrata che suggerisce un collo di bottiglia della CPU o Thunderbolt 3 nella configurazione dell'eGPU.
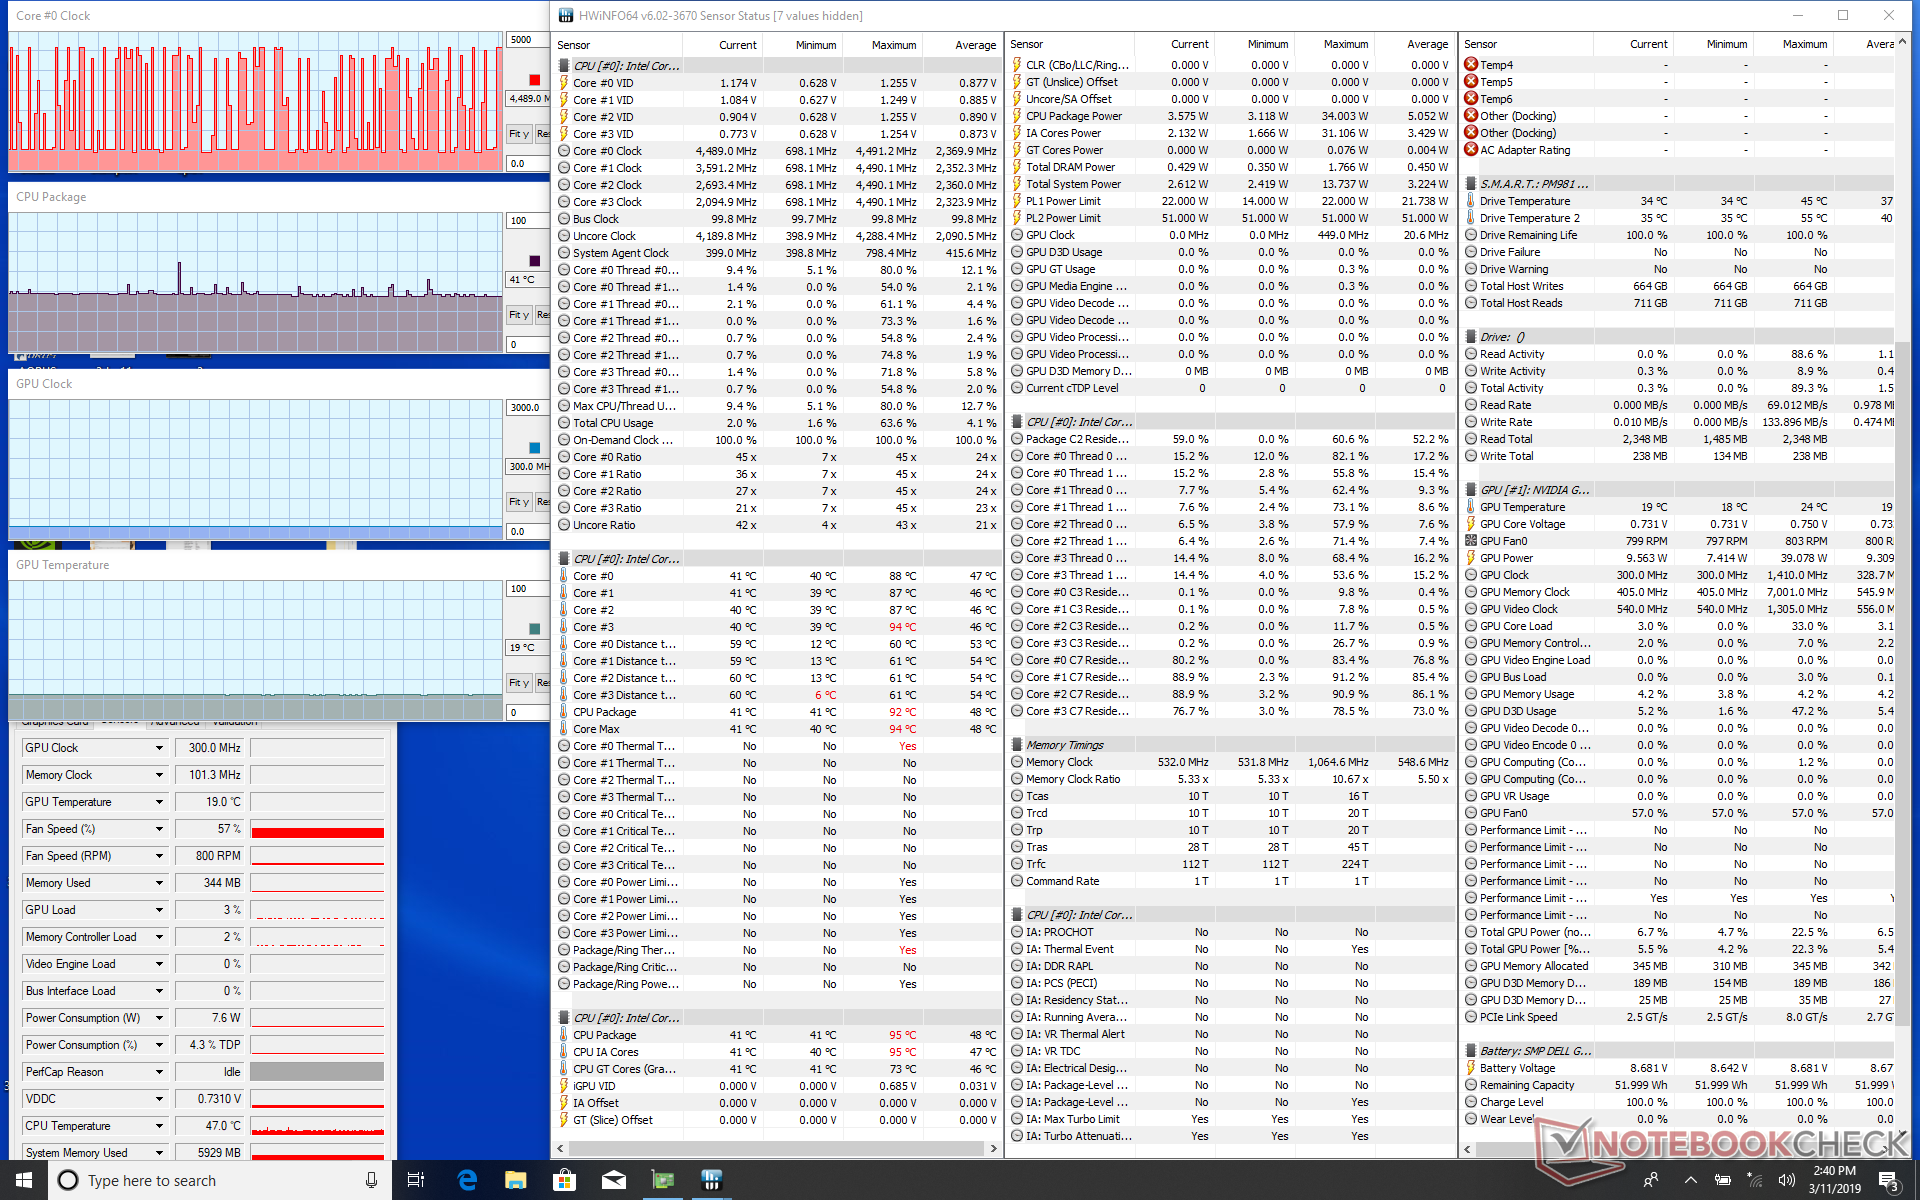
| CPU Clock (GHz) | GPU Clock (MHz) | Average CPU Temperature (°C) | Average GPU Temperature (°C) | |
| System Idle | -- | 300 | 41 | 19 |
| Prime95 + FurMark Stress | 2.6 | 1545 | 77 | 66 |
| Witcher 3 Stress | 4.4 | 1875 | 76 | 61 |
Gestione Energetica
Consumo Energetico
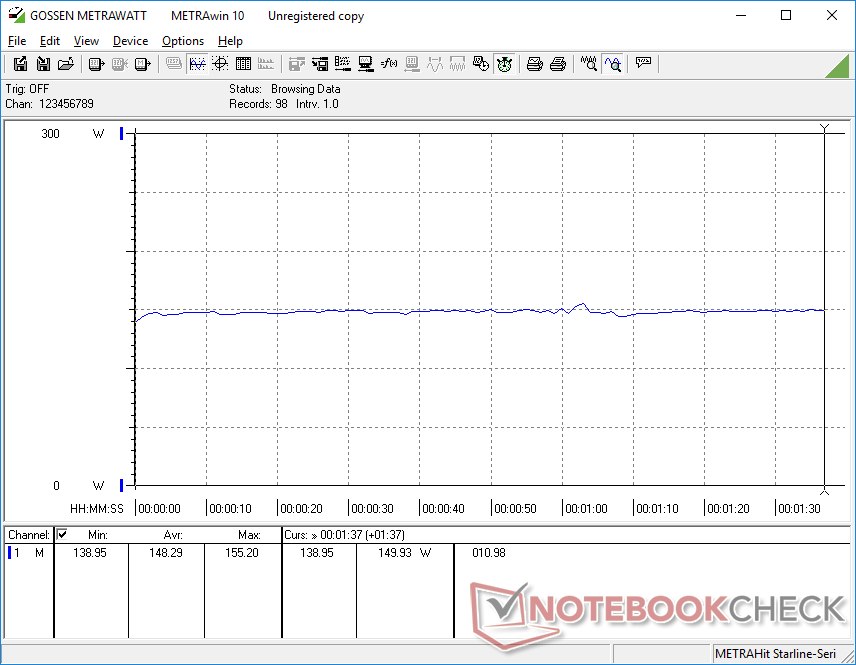
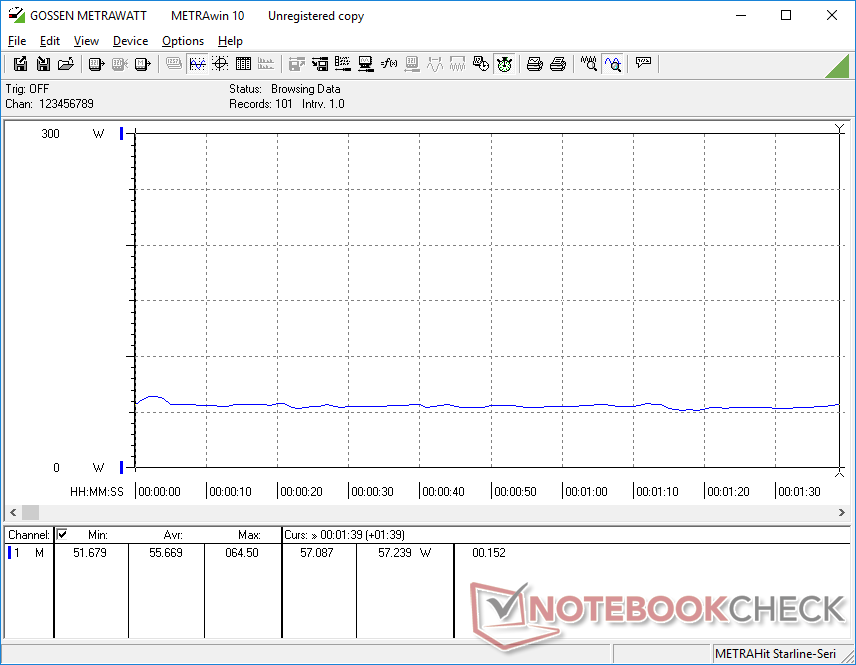
La Gaming Box RTX 2070 è più efficiente dal punto di vista energetico rispetto alla Gaming Box GTX 1080 quando è sottoposta a carichi medi, ma il consumo è molto simile quando si gioca e durante carichi molto pesanti. Ci aspettavamo questo scenario dal momento che le prestazioni di gioco sono quasi identiche a quelle della Gaming Box GTX 1080 nella maggior parte dei casi.
| Off / Standby | |
| Idle | |
| Sotto carico |
|
Leggenda:
min: | |
| Aorus Gaming Box RTX 2070 i7-8565U, GeForce RTX 2070 (Desktop), Samsung SSD PM981 MZVLB512HAJQ, , 3840x2160, 13.3" | Asus Zephyrus S GX701GX i7-8750H, GeForce RTX 2080 Max-Q, Samsung SSD PM981 MZVLB1T0HALR, IPS, 1920x1080, 17.3" | MSI GE75 8SF i7-8750H, GeForce RTX 2070 Mobile, Kingston RBUSNS8154P3256GJ1, IPS, 1920x1080, 17.3" | Razer Blade 15 RTX 2070 Max-Q i7-8750H, GeForce RTX 2070 Max-Q, Samsung SSD PM981 MZVLB512HAJQ, IPS, 1920x1080, 15.6" | Dell XPS 13 9380 i7 4K i7-8565U, UHD Graphics 620, Samsung SSD PM981 MZVLB512HAJQ, IPS, 3840x2160, 13.3" | Aorus GTX 1080 Gaming Box (XPS 15 9575) GeForce GTX 1080 (Desktop), , , x, | |
|---|---|---|---|---|---|---|
| Power Consumption | -28% | -23% | 5% | 54% | -16% | |
| Idle Minimum * (Watt) | 19.3 | 19 2% | 16.4 15% | 10.4 46% | 5.2 73% | 21.1 -9% |
| Idle Average * (Watt) | 19.3 | 22 -14% | 21.9 -13% | 14.6 24% | 8.6 55% | 21.1 -9% |
| Idle Maximum * (Watt) | 19.3 | 30 -55% | 25.4 -32% | 16.3 16% | 10.5 46% | 21.1 -9% |
| Load Average * (Watt) | 55.7 | 104 -87% | 90.7 -63% | 88.5 -59% | 44.2 21% | 92.1 -65% |
| Witcher 3 ultra * (Watt) | 148.3 | 167 -13% | 203.3 -37% | 155.4 -5% | 150.3 -1% | |
| Load Maximum * (Watt) | 203 | 203 -0% | 222.9 -10% | 182.4 10% | 47.5 77% | 206 -1% |
* ... Meglio usare valori piccoli
Pro
Contro
Giudizio Complessivo

L'Aorus Gaming Box RTX 2070 può trasformare un Ultrabook compatibile in una macchina da gioco, a condizione che gli utenti ricordino che le reali prestazioni di gioco saranno probabilmente strozzate dalla CPU e dalla porta Thunderbolt 3. Avere la possibilità di giocare i titoli PC più esigenti in circolazione su un Ultrabook attirerà molta attenzione, ma le prestazioni reali possono variare da una GTX 1060 ad una RTX 2060 nonostante il fatto che al suo interno sia presente una scheda grafica RTX 2070 completa. La praticità del ray-tracing diventa quindi discutibile, perché abilitarlo significherebbe semplicemente aumentare ulteriormente i frame rates.
Forse le prestazioni sarebbero più simili a quelle di un RTX 2070 desktop se collegato a un computer portatile Core i7-8750H o i9-8950HK più grande al posto del nostro XPS 13. I benchmarks di 3DMark lo suggeriscono certamente, con punteggi finali vicini a quelli di un vero e proprio portatile da gioco RTX 2070. Molti laptops con questi potenti processori Intel di classe H, tuttavia, sono in genere già dotati di schede grafiche dedicate capaci.
Infine, abbiamo sperimentato qualche crash di sistema, blocchi e problemi di rilevamento di eGPU durante il tempo trascorso con l'unità. E' ottima quando funziona, ma siate pronti a riavviare, collegare e scollegare più volte ogni volta che qualcosa va storto. L'esperienza non è ancora del tutto fluida.
Stai comprando una Gaming Box RTX 2070, ma in realtà stai comprando le prestazioni di gioco di una RTX 2060. Il valore sta nella capacità di riprodurre sul tuo Ultrabook titoli PC impegnativi che altrimenti sarebbero limitati alla sola grafica Intel integrata. Forse Aorus può offrire in futuro un'opzione Gaming Box RTX 2060 con un migliore equilibrio se abbinata a CPU ULV.
Price comparison
