Recensione del Computer Portatile Dell Latitude 5420 Rugged (i7-8650U, AMD RX 540)

| SD Card Reader | |
| average JPG Copy Test (av. of 3 runs) | |
| Dell Latitude 5420 Rugged-P85G (Toshiba Exceria Pro SDXC 64 GB UHS-II) | |
| Dell Latitude 5490 (Toshiba Exceria Pro SDXC 64 GB UHS-II) | |
| Panasonic Toughbook CF-54G2999VM (Toshiba Exceria Pro SDXC 64 GB UHS-II) | |
| Media della classe Workstation (49.6 - 681, n=14, ultimi 2 anni) | |
| Getac S410 (Toshiba Exceria Pro SDXC 64 GB UHS-II) | |
| Lenovo ThinkPad T480-20L50010US (Toshiba Exceria Pro SDXC 64 GB UHS-II) | |
| HP EliteBook 840 G4-Z2V49ET ABD (Toshiba Exceria Pro SDXC 64 GB UHS-II) | |
| maximum AS SSD Seq Read Test (1GB) | |
| Dell Latitude 5420 Rugged-P85G (Toshiba Exceria Pro SDXC 64 GB UHS-II) | |
| Media della classe Workstation (87.6 - 1455, n=14, ultimi 2 anni) | |
| Dell Latitude 5490 (Toshiba Exceria Pro SDXC 64 GB UHS-II) | |
| Panasonic Toughbook CF-54G2999VM (Toshiba Exceria Pro SDXC 64 GB UHS-II) | |
| Lenovo ThinkPad T480-20L50010US (Toshiba Exceria Pro SDXC 64 GB UHS-II) | |
| Getac S410 (Toshiba Exceria Pro SDXC 64 GB UHS-II) | |
| HP EliteBook 840 G4-Z2V49ET ABD (Toshiba Exceria Pro SDXC 64 GB UHS-II) | |
| |||||||||||||||||||||||||
Distribuzione della luminosità: 80 %
Al centro con la batteria: 1111.7 cd/m²
Contrasto: 1372:1 (Nero: 0.81 cd/m²)
ΔE ColorChecker Calman: 3.83 | ∀{0.5-29.43 Ø4.72}
calibrated: 2.98
ΔE Greyscale Calman: 5.6 | ∀{0.09-98 Ø4.97}
93% sRGB (Argyll 1.6.3 3D)
59% AdobeRGB 1998 (Argyll 1.6.3 3D)
64.2% AdobeRGB 1998 (Argyll 3D)
92.4% sRGB (Argyll 3D)
62.5% Display P3 (Argyll 3D)
Gamma: 2.306
CCT: 7676 K
| Dell Latitude 5420 Rugged-P85G AU Optronics AUO523D, IPS, 14", 1920x1080 | Panasonic Toughbook CF-54G2999VM B140XTN, AUO2E3C, TN LED, 14", 1366x768 | Getac S410 CMN N140BGE-E33, TN PED, 14", 1366x768 | Lenovo ThinkPad T480-20L50010US B140HAK01.0, TFT-LCD, 14", 1920x1080 | Dell Latitude 5490 AUO133D, IPS, 14", 1920x1080 | HP EliteBook 840 G4-Z2V49ET ABD AUO123D, TN, 14", 1920x1080 | |
|---|---|---|---|---|---|---|
| Display | -40% | -35% | -42% | -41% | -11% | |
| Display P3 Coverage (%) | 62.5 | 37.36 -40% | 40.46 -35% | 36.31 -42% | 36.42 -42% | 55.8 -11% |
| sRGB Coverage (%) | 92.4 | 56.1 -39% | 60.9 -34% | 54.5 -41% | 54.6 -41% | 80.7 -13% |
| AdobeRGB 1998 Coverage (%) | 64.2 | 38.62 -40% | 41.8 -35% | 37.51 -42% | 37.62 -41% | 57.7 -10% |
| Response Times | 43% | 49% | 25% | 37% | 38% | |
| Response Time Grey 50% / Grey 80% * (ms) | 68 ? | 43.2 ? 36% | 41.2 ? 39% | 39.2 ? 42% | 30.4 ? 55% | 39 ? 43% |
| Response Time Black / White * (ms) | 33.6 ? | 17.2 ? 49% | 14 ? 58% | 30.8 ? 8% | 27.2 ? 19% | 23 ? 32% |
| PWM Frequency (Hz) | 735 ? | 877 ? | ||||
| Screen | -90% | -87% | -51% | -55% | -53% | |
| Brightness middle (cd/m²) | 1111.7 | 174.5 -84% | 265.1 -76% | 276.7 -75% | 200.6 -82% | 346 -69% |
| Brightness (cd/m²) | 1026 | 164 -84% | 246 -76% | 272 -73% | 204 -80% | 317 -69% |
| Brightness Distribution (%) | 80 | 71 -11% | 81 1% | 90 13% | 87 9% | 86 8% |
| Black Level * (cd/m²) | 0.81 | 0.6 26% | 0.58 28% | 0.21 74% | 0.16 80% | 0.86 -6% |
| Contrast (:1) | 1372 | 291 -79% | 457 -67% | 1318 -4% | 1254 -9% | 402 -71% |
| Colorchecker dE 2000 * | 3.83 | 12.05 -215% | 14.24 -272% | 7.22 -89% | 8.36 -118% | 8.64 -126% |
| Colorchecker dE 2000 max. * | 7.85 | 27.5 -250% | 26.66 -240% | 25.87 -230% | 25.63 -226% | 13.58 -73% |
| Colorchecker dE 2000 calibrated * | 2.98 | 4.34 -46% | 3.94 -32% | 5.01 -68% | 4.6 -54% | |
| Greyscale dE 2000 * | 5.6 | 14.8 -164% | 14.2 -154% | 6.7 -20% | 7.7 -38% | 11.24 -101% |
| Gamma | 2.306 95% | 1.4 157% | 2.03 108% | 2.321 95% | 2.773 79% | 2.62 84% |
| CCT | 7676 85% | 14529 45% | 17152 38% | 6656 98% | 6397 102% | 12530 52% |
| Color Space (Percent of AdobeRGB 1998) (%) | 59 | 35.7 -39% | 38.7 -34% | 34 -42% | 34.5 -42% | 52 -12% |
| Color Space (Percent of sRGB) (%) | 93 | 56.2 -40% | 61 -34% | 54 -42% | 54.2 -42% | 80 -14% |
| Media totale (Programma / Settaggio) | -29% /
-64% | -24% /
-60% | -23% /
-39% | -20% /
-41% | -9% /
-33% |
* ... Meglio usare valori piccoli
Tempi di risposta del Display
| ↔ Tempi di risposta dal Nero al Bianco | ||
|---|---|---|
| 33.6 ms ... aumenta ↗ e diminuisce ↘ combinato | ↗ 18.8 ms Incremento |  |
| ↘ 14.8 ms Calo | ||
| Lo schermo mostra tempi di risposta lenti nei nostri tests e sarà insoddisfacente per i gamers. In confronto, tutti i dispositivi di test variano da 0.1 (minimo) a 240 (massimo) ms. » 90 % di tutti i dispositivi è migliore. Questo significa che i tempi di risposta rilevati sono peggiori rispetto alla media di tutti i dispositivi testati (19.8 ms). | ||
| ↔ Tempo di risposta dal 50% Grigio all'80% Grigio | ||
| 68 ms ... aumenta ↗ e diminuisce ↘ combinato | ↗ 34 ms Incremento | 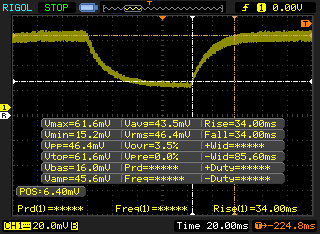 |
| ↘ 34 ms Calo | ||
| Lo schermo mostra tempi di risposta lenti nei nostri tests e sarà insoddisfacente per i gamers. In confronto, tutti i dispositivi di test variano da 0.165 (minimo) a 636 (massimo) ms. » 98 % di tutti i dispositivi è migliore. Questo significa che i tempi di risposta rilevati sono peggiori rispetto alla media di tutti i dispositivi testati (31 ms). | ||
Sfarfallio dello schermo / PWM (Pulse-Width Modulation)
| flickering dello schermo / PWM rilevato | 735 Hz | ≤ 100 % settaggio luminosita' | 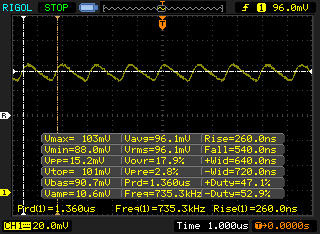 |
Il display sfarfalla a 735 Hz (Probabilmente a causa dell'uso di PWM) Flickering rilevato ad una luminosita' di 100 % o inferiore. Non dovrebbe verificarsi flickering o PWM sopra questo valore di luminosita'. La frequenza di 735 Hz è abbastanza alta, quindi la maggioranza degli utenti sensibili al PWM non dovrebbero notare alcun flickering. In confronto: 52 % di tutti i dispositivi testati non utilizza PWM per ridurre la luminosita' del display. Se è rilevato PWM, una media di 7763 (minimo: 5 - massimo: 343500) Hz è stata rilevata. | |||
| Cinebench R10 | |
| Rendering Multiple CPUs 32Bit | |
| Media della classe Workstation (n=1ultimi 2 anni) | |
| Fujitsu Celsius H980 | |
| Media Intel Core i7-8650U (16227 - 21455, n=4) | |
| Dell Latitude 13 7380 | |
| Rendering Single 32Bit | |
| Media della classe Workstation (n=1ultimi 2 anni) | |
| Fujitsu Celsius H980 | |
| Media Intel Core i7-8650U (5307 - 6782, n=4) | |
| Dell Latitude 13 7380 | |
| wPrime 2.10 - 1024m | |
| Dell Latitude 13 7380 | |
| Dell Latitude 5490 | |
| Media Intel Core i7-8650U (268 - 335, n=3) | |
| Media della classe Workstation (n=1ultimi 2 anni) | |
* ... Meglio usare valori piccoli
| PCMark 8 Home Score Accelerated v2 | 4038 punti | |
| PCMark 8 Work Score Accelerated v2 | 5170 punti | |
| PCMark 10 Score | 4451 punti | |
Aiuto | ||
| Dell Latitude 5420 Rugged-P85G SK hynix PC401 NVMe 500 GB | Panasonic Toughbook CF-54G2999VM Seagate BarraCuda Compute 1TB ST1000LM048 | Getac S410 CUKUSA 1 TB SATA SSD Q0526A | Lenovo ThinkPad T480-20L50010US Samsung SSD PM981 MZVLB512HAJQ | Dell Latitude 5490 Samsung PM961 MZVLW256HEHP | Media SK hynix PC401 NVMe 500 GB | |
|---|---|---|---|---|---|---|
| CrystalDiskMark 5.2 / 6 | -96% | -40% | 13% | -14% | 18% | |
| Write 4K (MB/s) | 98.8 | 1.145 -99% | 74 -25% | 123.2 25% | 98.7 0% | 114.3 ? 16% |
| Read 4K (MB/s) | 38.51 | 0.453 -99% | 31.85 -17% | 44.43 15% | 39.46 2% | 37.1 ? -4% |
| Write Seq (MB/s) | 843 | 52.2 -94% | 460.6 -45% | 845 0% | 564 -33% | 1119 ? 33% |
| Read Seq (MB/s) | 1282 | 122.7 -90% | 514 -60% | 865 -33% | 764 -40% | 1577 ? 23% |
| Write 4K Q32T1 (MB/s) | 355.5 | 2.428 -99% | 211.4 -41% | 287.3 -19% | 443.3 25% | 367 ? 3% |
| Read 4K Q32T1 (MB/s) | 241.4 | 1.063 -100% | 203.5 -16% | 360.9 50% | 268.8 11% | 310 ? 28% |
| Write Seq Q32T1 (MB/s) | 893 | 73.7 -92% | 523 -41% | 1718 92% | 796 -11% | 1263 ? 41% |
| Read Seq Q32T1 (MB/s) | 2478 | 120.4 -95% | 554 -78% | 1779 -28% | 875 -65% | 2598 ? 5% |

| 3DMark 06 Standard Score | 14964 punti | |
| 3DMark Vantage P Result | 15191 punti | |
| 3DMark 11 Performance | 5179 punti | |
| 3DMark Ice Storm Standard Score | 72353 punti | |
| 3DMark Cloud Gate Standard Score | 13718 punti | |
| 3DMark Fire Strike Score | 3469 punti | |
| 3DMark Time Spy Score | 643 punti | |
Aiuto | ||
| BioShock Infinite - 1920x1080 Ultra Preset, DX11 (DDOF) | |
| Asus ZenBook 15 UX533FD | |
| Dell Latitude 5420 Rugged-P85G | |
| Media AMD Radeon RX 540 (18.2 - 36, n=2) | |
| Dell Latitude 5490 | |
| basso | medio | alto | ultra | |
|---|---|---|---|---|
| Tomb Raider (2013) | 139 | 62 | 61 | 34 |
| BioShock Infinite (2013) | 147 | 78 | 61 | 36 |
| Thief (2014) | 63 | 50.3 | 44.4 | 38 |
| The Witcher 3 (2015) | 48 | 39 | 8 | 6 |
| Rise of the Tomb Raider (2016) | 59 | 38 | 20 | 16 |
| Hitman 2016 (2016) | 53 | 47 | 20 | 19 |
| Ashes of the Singularity (2016) | 36 | 20 | 18 | |
| Doom (2016) | 70 | 54 | 28 | 25 |
| Overwatch (2016) | 95 | 78 | 52 | 36 |
| Deus Ex Mankind Divided (2016) | 48 | 35 | 19 | 9 |
| Mafia 3 (2016) | 42 | 32 | 22 | |
| Civilization 6 (2016) | 74 | 52 | 32 | 23 |
| Farming Simulator 17 (2016) | 174 | 137 | 70 | 59 |
| Dishonored 2 (2016) | 45 | 29 | 31 | 18 |
| Resident Evil 7 (2017) | 135 | 61 | 36 | 15 |
| Mass Effect Andromeda (2017) | 70 | 34 | 20 | 15 |
| Prey (2017) | 108 | 71 | 58 | 40 |
| Rocket League (2017) | 182 | 86 | 58 | |
| Dirt 4 (2017) | 150 | 63 | 42 | 27 |
| Playerunknown's Battlegrounds (PUBG) (2017) | 75 | 31 | 26 | 19 |
| F1 2017 (2017) | 92 | 40 | 28 | 21 |
| Middle-earth: Shadow of War (2017) | 98 | 39 | 27 | 20 |
| Assassin´s Creed Origins (2017) | 55 | 29 | 22 | 15 |
| Fortnite (2018) | 180 | 70 | 55 | 35 |
| Final Fantasy XV Benchmark (2018) | 11 | 3 | 2 | |
| Kingdom Come: Deliverance (2018) | 41 | 15 | 12 | 7 |
| Far Cry 5 (2018) | 42 | 25 | 21 | 17 |
| Monster Hunter World (2018) | 60 | 25 | 21 | 17 |
| F1 2018 (2018) | 62 | 40 | 28 | 21 |
| Shadow of the Tomb Raider (2018) | 55 | 26 | 21 | 16 |
| Hitman 2 (2018) | 29 | 18 | 12 | 8 |
| Battlefield V (2018) | 63 | 31 | 29 | 21 |
Rumorosità
| Idle |
| 28.3 / 28.3 / 28.3 dB(A) |
| Sotto carico |
| 29.9 / 38 dB(A) |
 | ||
30 dB silenzioso 40 dB(A) udibile 50 dB(A) rumoroso |
||
min: | ||
(±) La temperatura massima sul lato superiore è di 42.2 °C / 108 F, rispetto alla media di 38.2 °C / 101 F, che varia da 22.2 a 69.8 °C per questa classe Workstation.
(±) Il lato inferiore si riscalda fino ad un massimo di 42 °C / 108 F, rispetto alla media di 41.1 °C / 106 F
(+) In idle, la temperatura media del lato superiore è di 26.5 °C / 80 F, rispetto alla media deld ispositivo di 32 °C / 90 F.
(+) I poggiapolsi e il touchpad sono piu' freddi della temperatura della pelle con un massimo di 27.8 °C / 82 F e sono quindi freddi al tatto.
(±) La temperatura media della zona del palmo della mano di dispositivi simili e'stata di 27.8 °C / 82 F (0 °C / 0 F).
Dell Latitude 5420 Rugged-P85G analisi audio
(±) | potenza degli altiparlanti media ma buona (74.6 dB)
Bassi 100 - 315 Hz
(-) | quasi nessun basso - in media 16.3% inferiori alla media
(+) | bassi in lineaa (6.1% delta rispetto alla precedente frequenza)
Medi 400 - 2000 Hz
(+) | medi bilanciati - solo only 3.2% rispetto alla media
(+) | medi lineari (5.8% delta rispetto alla precedente frequenza)
Alti 2 - 16 kHz
(+) | Alti bilanciati - appena 2.4% dalla media
(+) | alti lineari (4.5% delta rispetto alla precedente frequenza)
Nel complesso 100 - 16.000 Hz
(±) | la linearità complessiva del suono è media (15.8% di differenza rispetto alla media
Rispetto alla stessa classe
» 39% di tutti i dispositivi testati in questa classe è stato migliore, 9% simile, 52% peggiore
» Il migliore ha avuto un delta di 7%, medio di 17%, peggiore di 35%
Rispetto a tutti i dispositivi testati
» 24% di tutti i dispositivi testati in questa classe è stato migliore, 5% similare, 71% peggiore
» Il migliore ha avuto un delta di 4%, medio di 24%, peggiore di 134%
Panasonic Toughbook CF-54G2999VM analisi audio
(-) | altoparlanti non molto potenti (65.9 dB)
Bassi 100 - 315 Hz
(-) | quasi nessun basso - in media 25.6% inferiori alla media
(+) | bassi in lineaa (5% delta rispetto alla precedente frequenza)
Medi 400 - 2000 Hz
(±) | medi elevati - circa 7.8% superiore alla media
(-) | medi non in linea (17.3% delta rispetto alla precedente frequenza)
Alti 2 - 16 kHz
(+) | Alti bilanciati - appena 4.3% dalla media
(±) | la linearità degli alti è media (7.9% delta rispetto alla precedente frequenza)
Nel complesso 100 - 16.000 Hz
(-) | suono nel complesso non lineare (39.6% di differenza rispetto alla media
Rispetto alla stessa classe
» 99% di tutti i dispositivi testati in questa classe è stato migliore, 1% simile, 1% peggiore
» Il migliore ha avuto un delta di 7%, medio di 21%, peggiore di 53%
Rispetto a tutti i dispositivi testati
» 95% di tutti i dispositivi testati in questa classe è stato migliore, 0% similare, 5% peggiore
» Il migliore ha avuto un delta di 4%, medio di 24%, peggiore di 134%
Getac S410 analisi audio
(±) | potenza degli altiparlanti media ma buona (76.2 dB)
Bassi 100 - 315 Hz
(±) | bassi ridotti - in media 13.6% inferiori alla media
(+) | bassi in lineaa (6.1% delta rispetto alla precedente frequenza)
Medi 400 - 2000 Hz
(±) | medi elevati - circa 6.5% superiore alla media
(±) | linearità dei medi adeguata (8.4% delta rispetto alla precedente frequenza)
Alti 2 - 16 kHz
(+) | Alti bilanciati - appena 3.1% dalla media
(+) | alti lineari (6.2% delta rispetto alla precedente frequenza)
Nel complesso 100 - 16.000 Hz
(±) | la linearità complessiva del suono è media (19.9% di differenza rispetto alla media
Rispetto alla stessa classe
» 42% di tutti i dispositivi testati in questa classe è stato migliore, 9% simile, 49% peggiore
» Il migliore ha avuto un delta di 7%, medio di 21%, peggiore di 53%
Rispetto a tutti i dispositivi testati
» 51% di tutti i dispositivi testati in questa classe è stato migliore, 7% similare, 42% peggiore
» Il migliore ha avuto un delta di 4%, medio di 24%, peggiore di 134%
| Off / Standby | |
| Idle | |
| Sotto carico |
|
Leggenda:
min: | |
| Dell Latitude 5420 Rugged-P85G i7-8650U, Radeon RX 540, SK hynix PC401 NVMe 500 GB, IPS, 1920x1080, 14" | Panasonic Toughbook CF-54G2999VM i5-7300U, HD Graphics 620, Seagate BarraCuda Compute 1TB ST1000LM048, TN LED, 1366x768, 14" | Getac S410 i5-8550U, UHD Graphics 620, CUKUSA 1 TB SATA SSD Q0526A, TN PED, 1366x768, 14" | Lenovo ThinkPad T480-20L50010US i7-8650U, UHD Graphics 620, Samsung SSD PM981 MZVLB512HAJQ, TFT-LCD, 1920x1080, 14" | Dell Latitude 5490 i7-8650U, UHD Graphics 620, Samsung PM961 MZVLW256HEHP, IPS, 1920x1080, 14" | HP EliteBook 840 G4-Z2V49ET ABD i5-7200U, HD Graphics 620, Samsung PM961 MZVLW256HEHP, TN, 1920x1080, 14" | |
|---|---|---|---|---|---|---|
| Power Consumption | 44% | 36% | 36% | 40% | 52% | |
| Idle Minimum * (Watt) | 4.8 | 4.4 8% | 5.6 -17% | 3.8 21% | 3.9 19% | 2.9 40% |
| Idle Average * (Watt) | 13.6 | 6.3 54% | 7.9 42% | 7.7 43% | 6.2 54% | 5.6 59% |
| Idle Maximum * (Watt) | 13.8 | 6.5 53% | 8.4 39% | 9.3 33% | 7.7 44% | 8.15 41% |
| Load Average * (Watt) | 67.8 | 36.3 46% | 32.8 52% | 45.7 33% | 43.9 35% | 30.6 55% |
| Witcher 3 ultra * (Watt) | 69.1 | |||||
| Load Maximum * (Watt) | 93.5 | 38.3 59% | 34.3 63% | 46.1 51% | 47.7 49% | 31 67% |
* ... Meglio usare valori piccoli
| Dell Latitude 5420 Rugged-P85G i7-8650U, Radeon RX 540, 102 Wh | Panasonic Toughbook CF-54G2999VM i5-7300U, HD Graphics 620, 33 Wh | Getac S410 i5-8550U, UHD Graphics 620, 46.6 Wh | Lenovo ThinkPad T480-20L50010US i7-8650U, UHD Graphics 620, 24 Wh | Dell Latitude 5490 i7-8650U, UHD Graphics 620, 68 Wh | HP EliteBook 840 G4-Z2V49ET ABD i5-7200U, HD Graphics 620, 51 Wh | |
|---|---|---|---|---|---|---|
| Autonomia della batteria | -64% | -68% | -55% | -28% | -28% | |
| Reader / Idle (h) | 31.4 | 19.3 -39% | ||||
| WiFi v1.3 (h) | 16.2 | 5.9 -64% | 5.2 -68% | 7.3 -55% | 11.6 -28% | 9.5 -41% |
| Load (h) | 3.2 | 3.1 -3% |
Pro
Contro
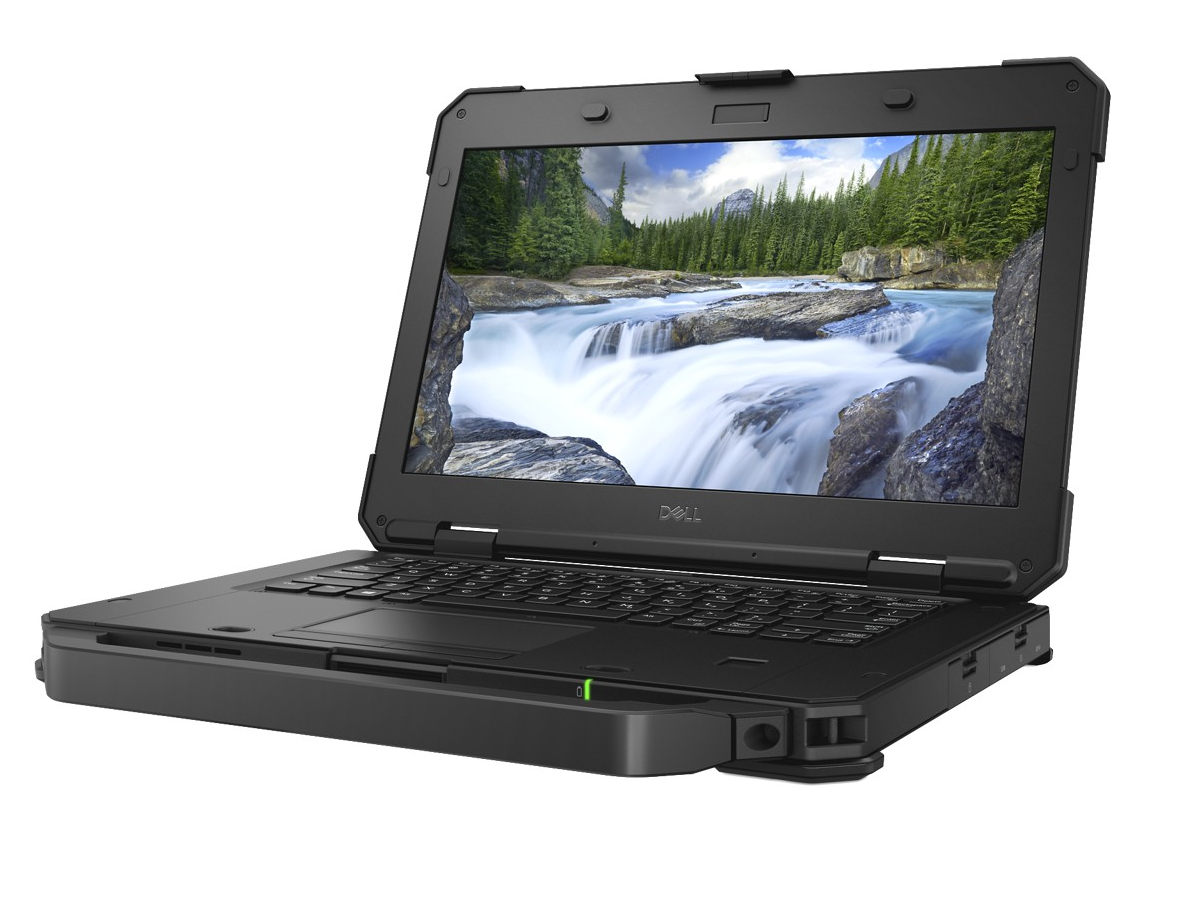
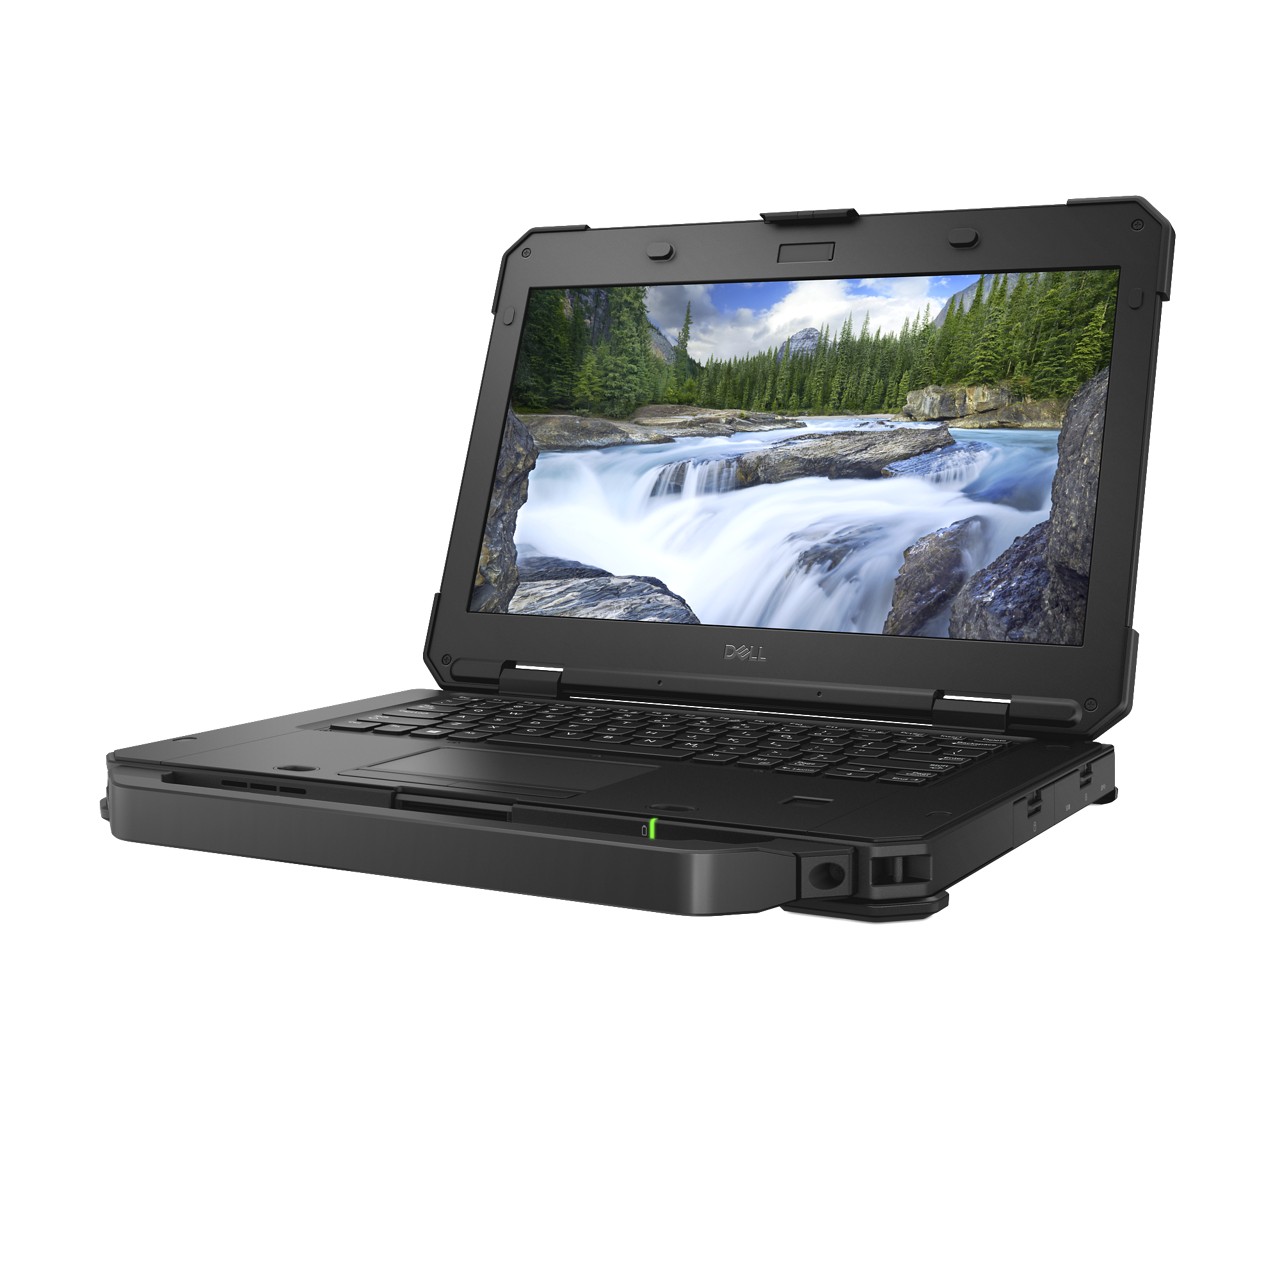
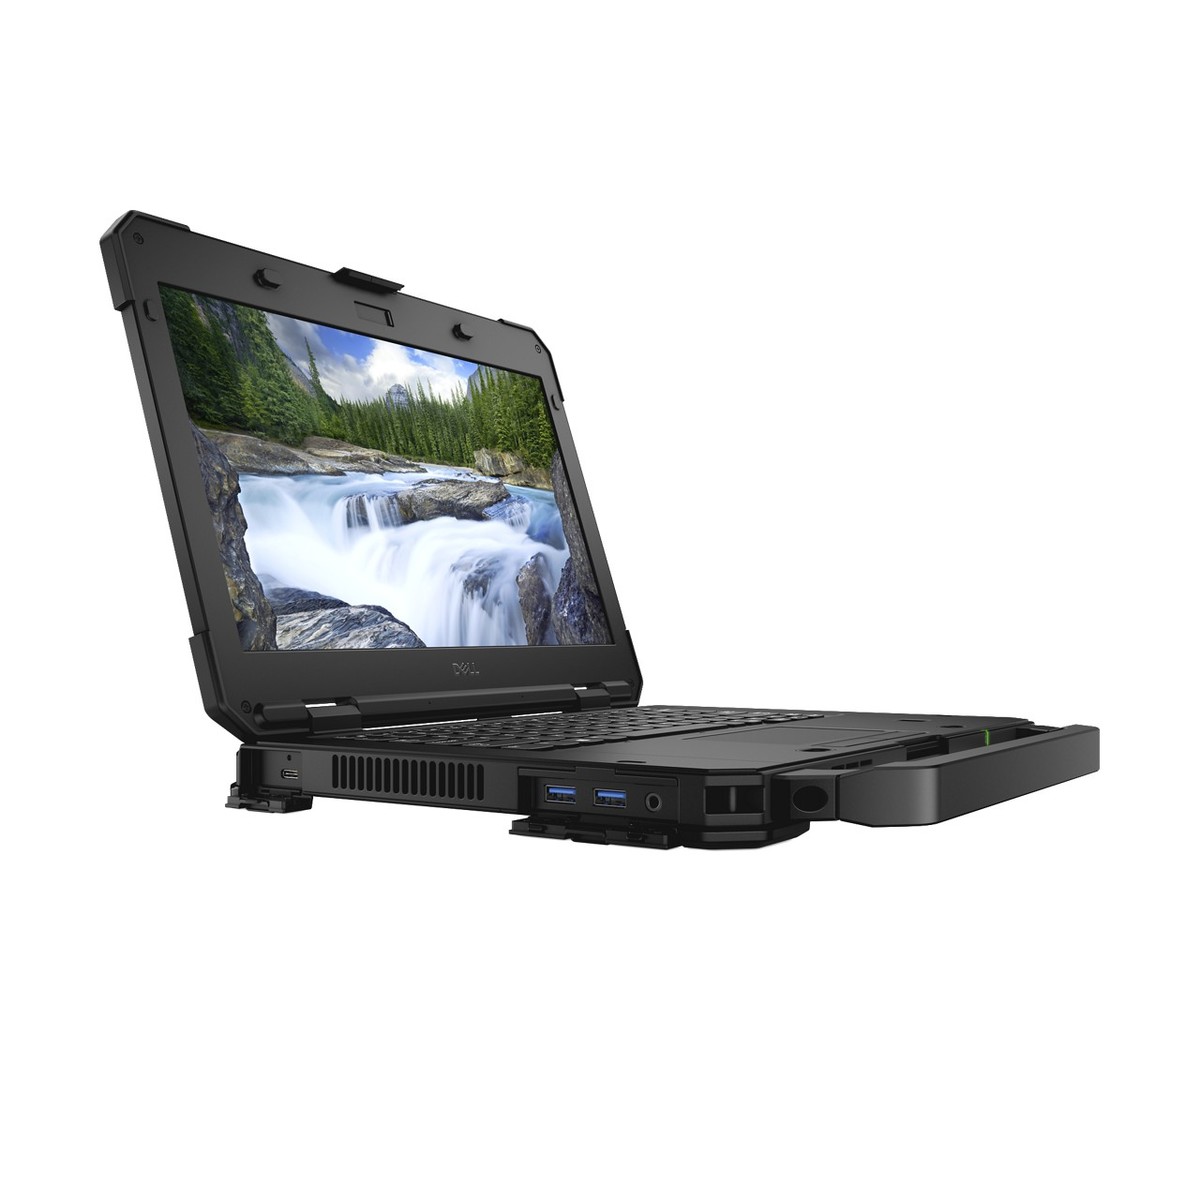
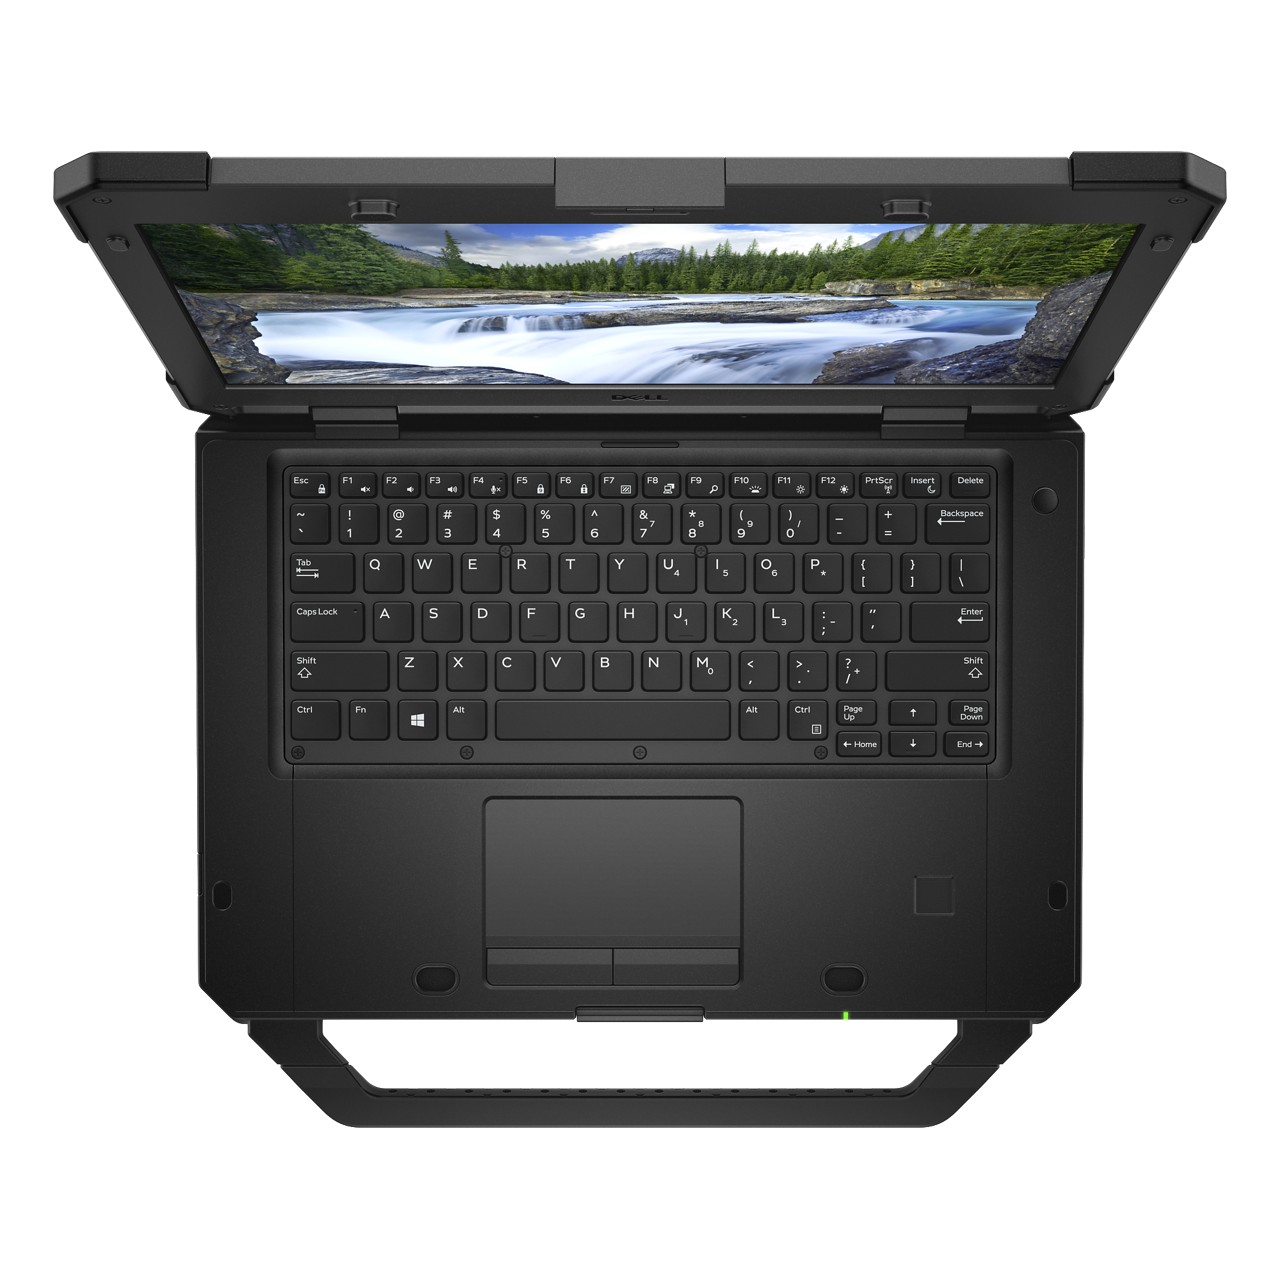
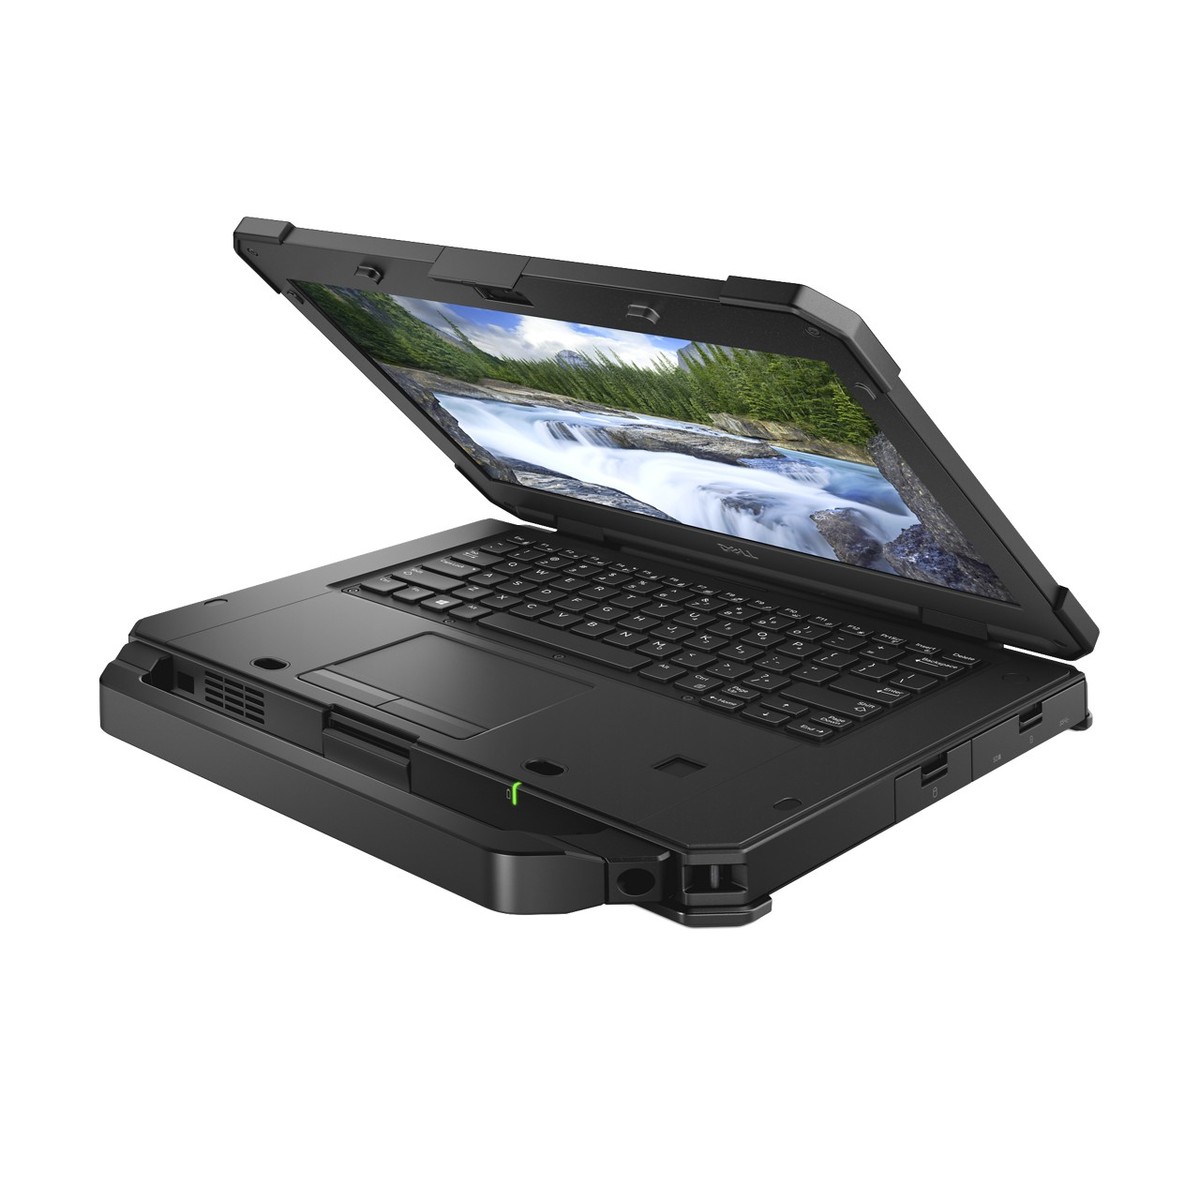
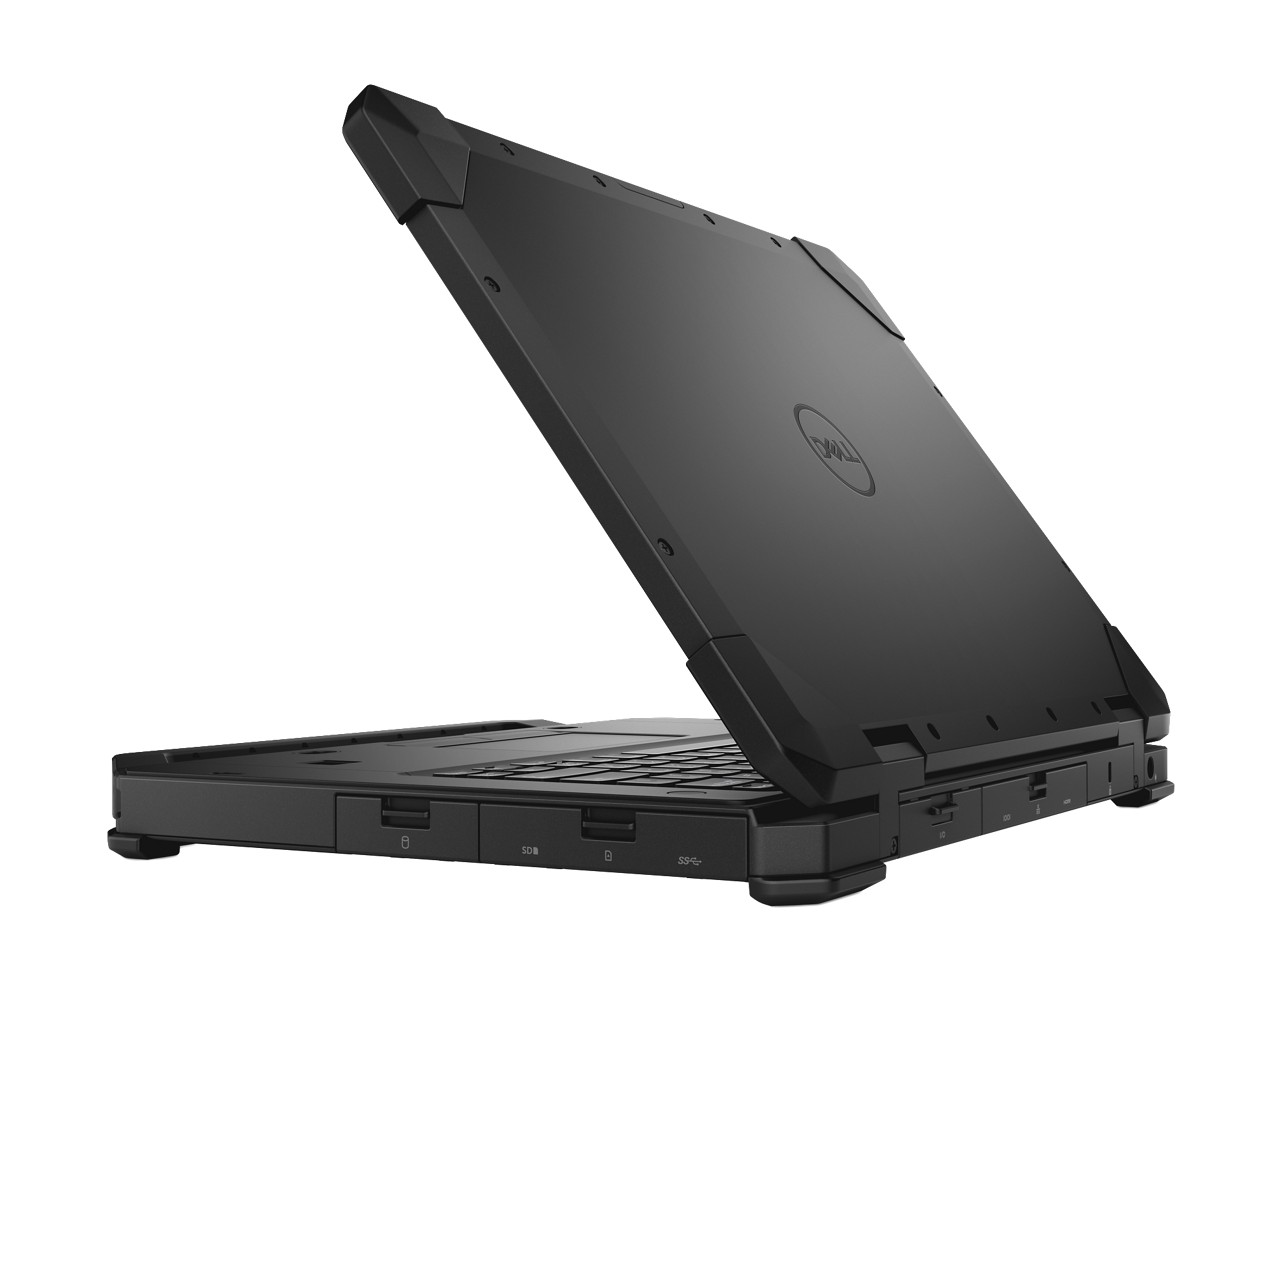
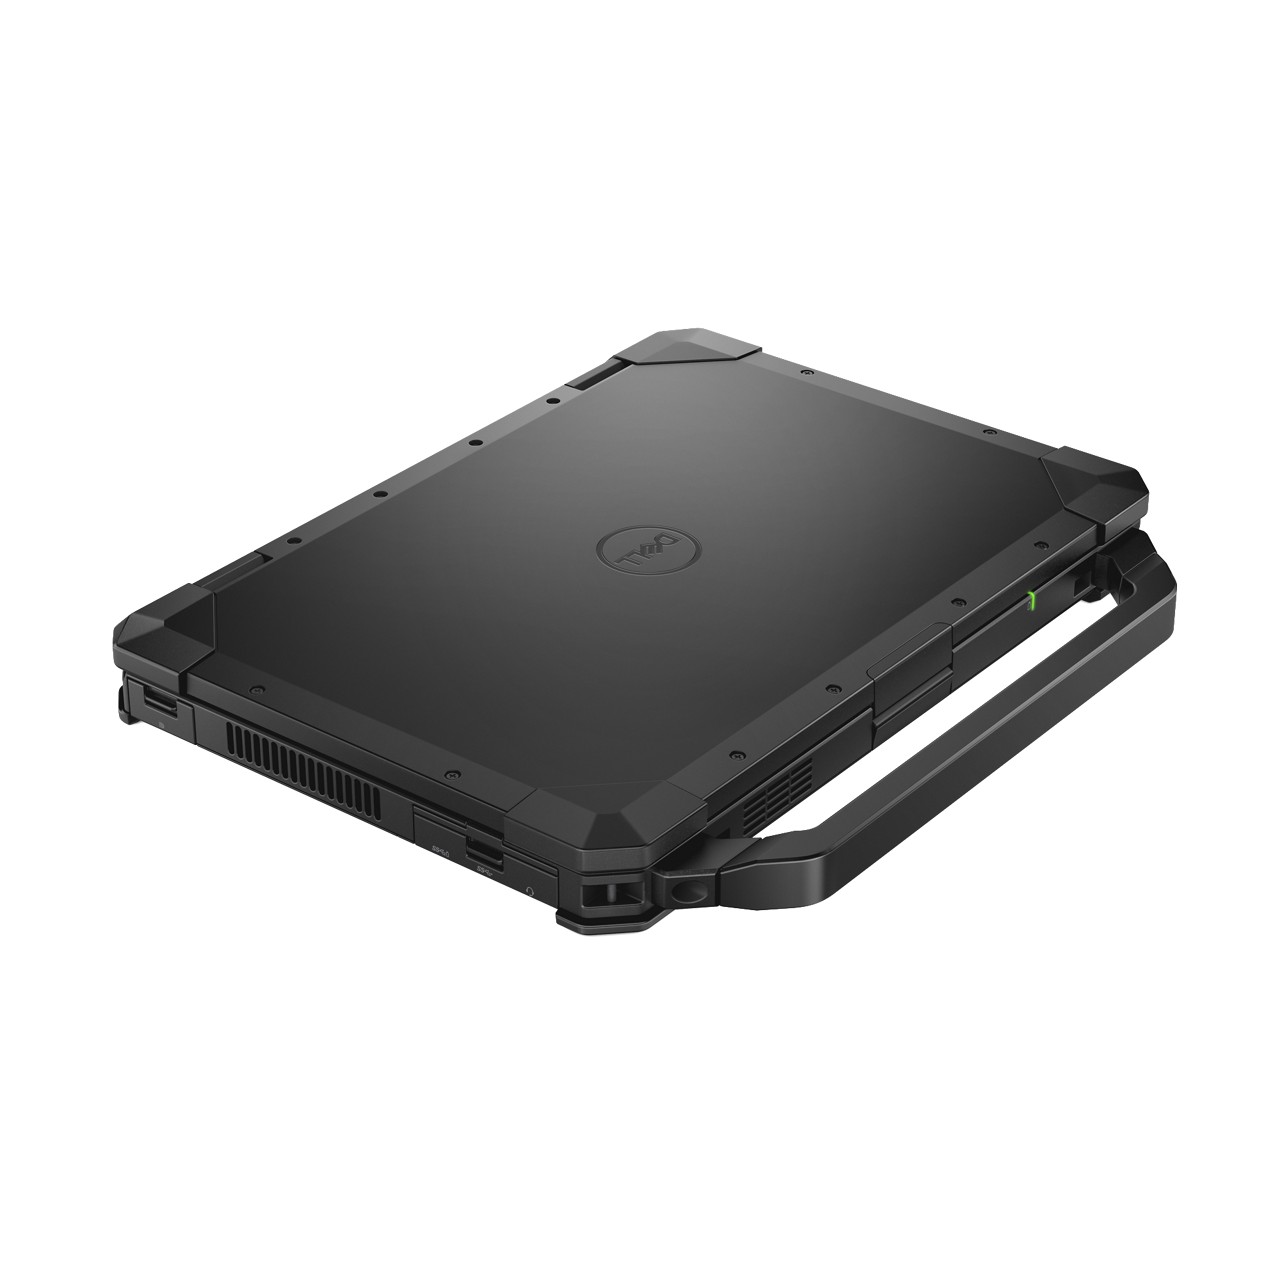
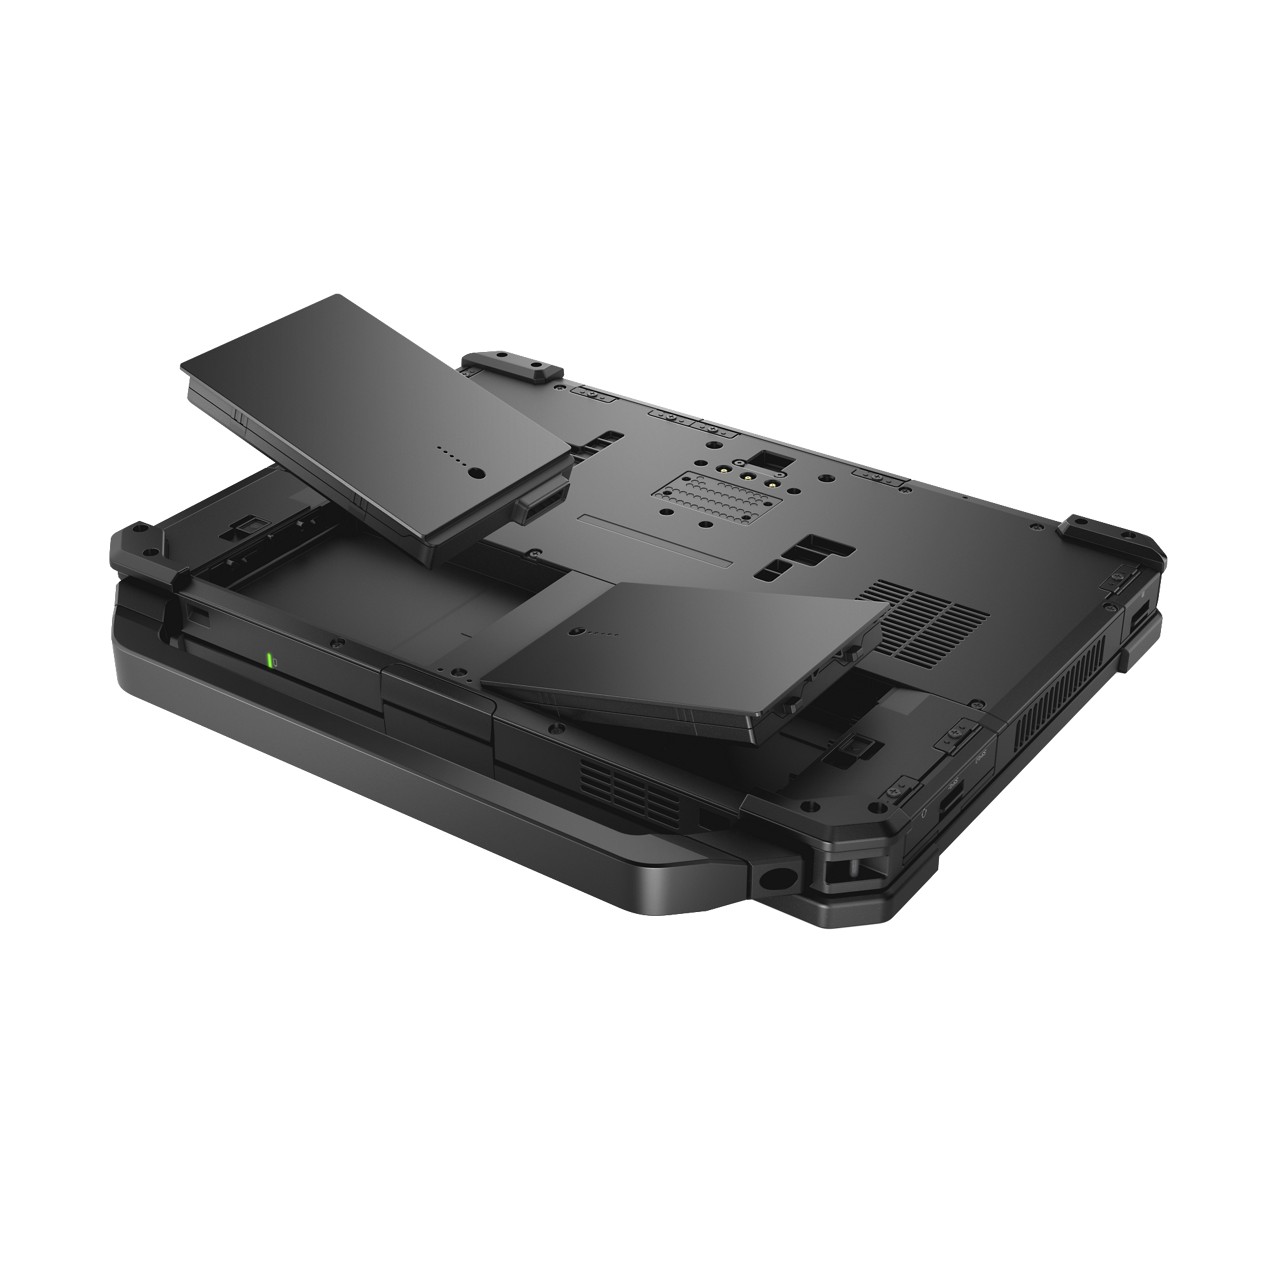
Il Dell Latitude 5420 Rugged rappresenta un cambiamento nella progettazione dei computer portatili rugged. Il dispositivo riesce a mantenere molte delle caratteristiche che definiscono i computer portatili robusti mentre dimezza lo spessore del dispositivo. L'aggiunta di una CPU quad-core e di una GPU dedicata addolcisce le cose e rende il Latitude 5420 Rugged molto competitivo, soprattutto per i fotografi e i videomaker che trascorrono molto tempo all'aperto.
Ci sono alcuni inconvenienti. Il laptop è ancora molto pesante e ingombrante, anche se confrontato con laptop rugged simili. Inoltre le prestazioni della CPU sono al di sotto della media e possono deludere. Inoltre, il Latitude 5420 Rugged non ha alcune delle caratteristiche robuste delle macchine più spesse come l'impermeabilità.
Detto questo, il display luminoso di alta qualità, le elevate prestazioni grafiche, la buona gestione del calore e del rumore della ventola, e la notevole durata della batteria rendono il Latitude 5420 Rugged una buona soluzione per i professionisti dell'outdoor che hanno bisogno di una macchina con una buona autonomia e robusta.
Dell Latitude 5420 Rugged-P85G
- 03/18/2019 v6 (old)
Sam Medley
Price comparison
