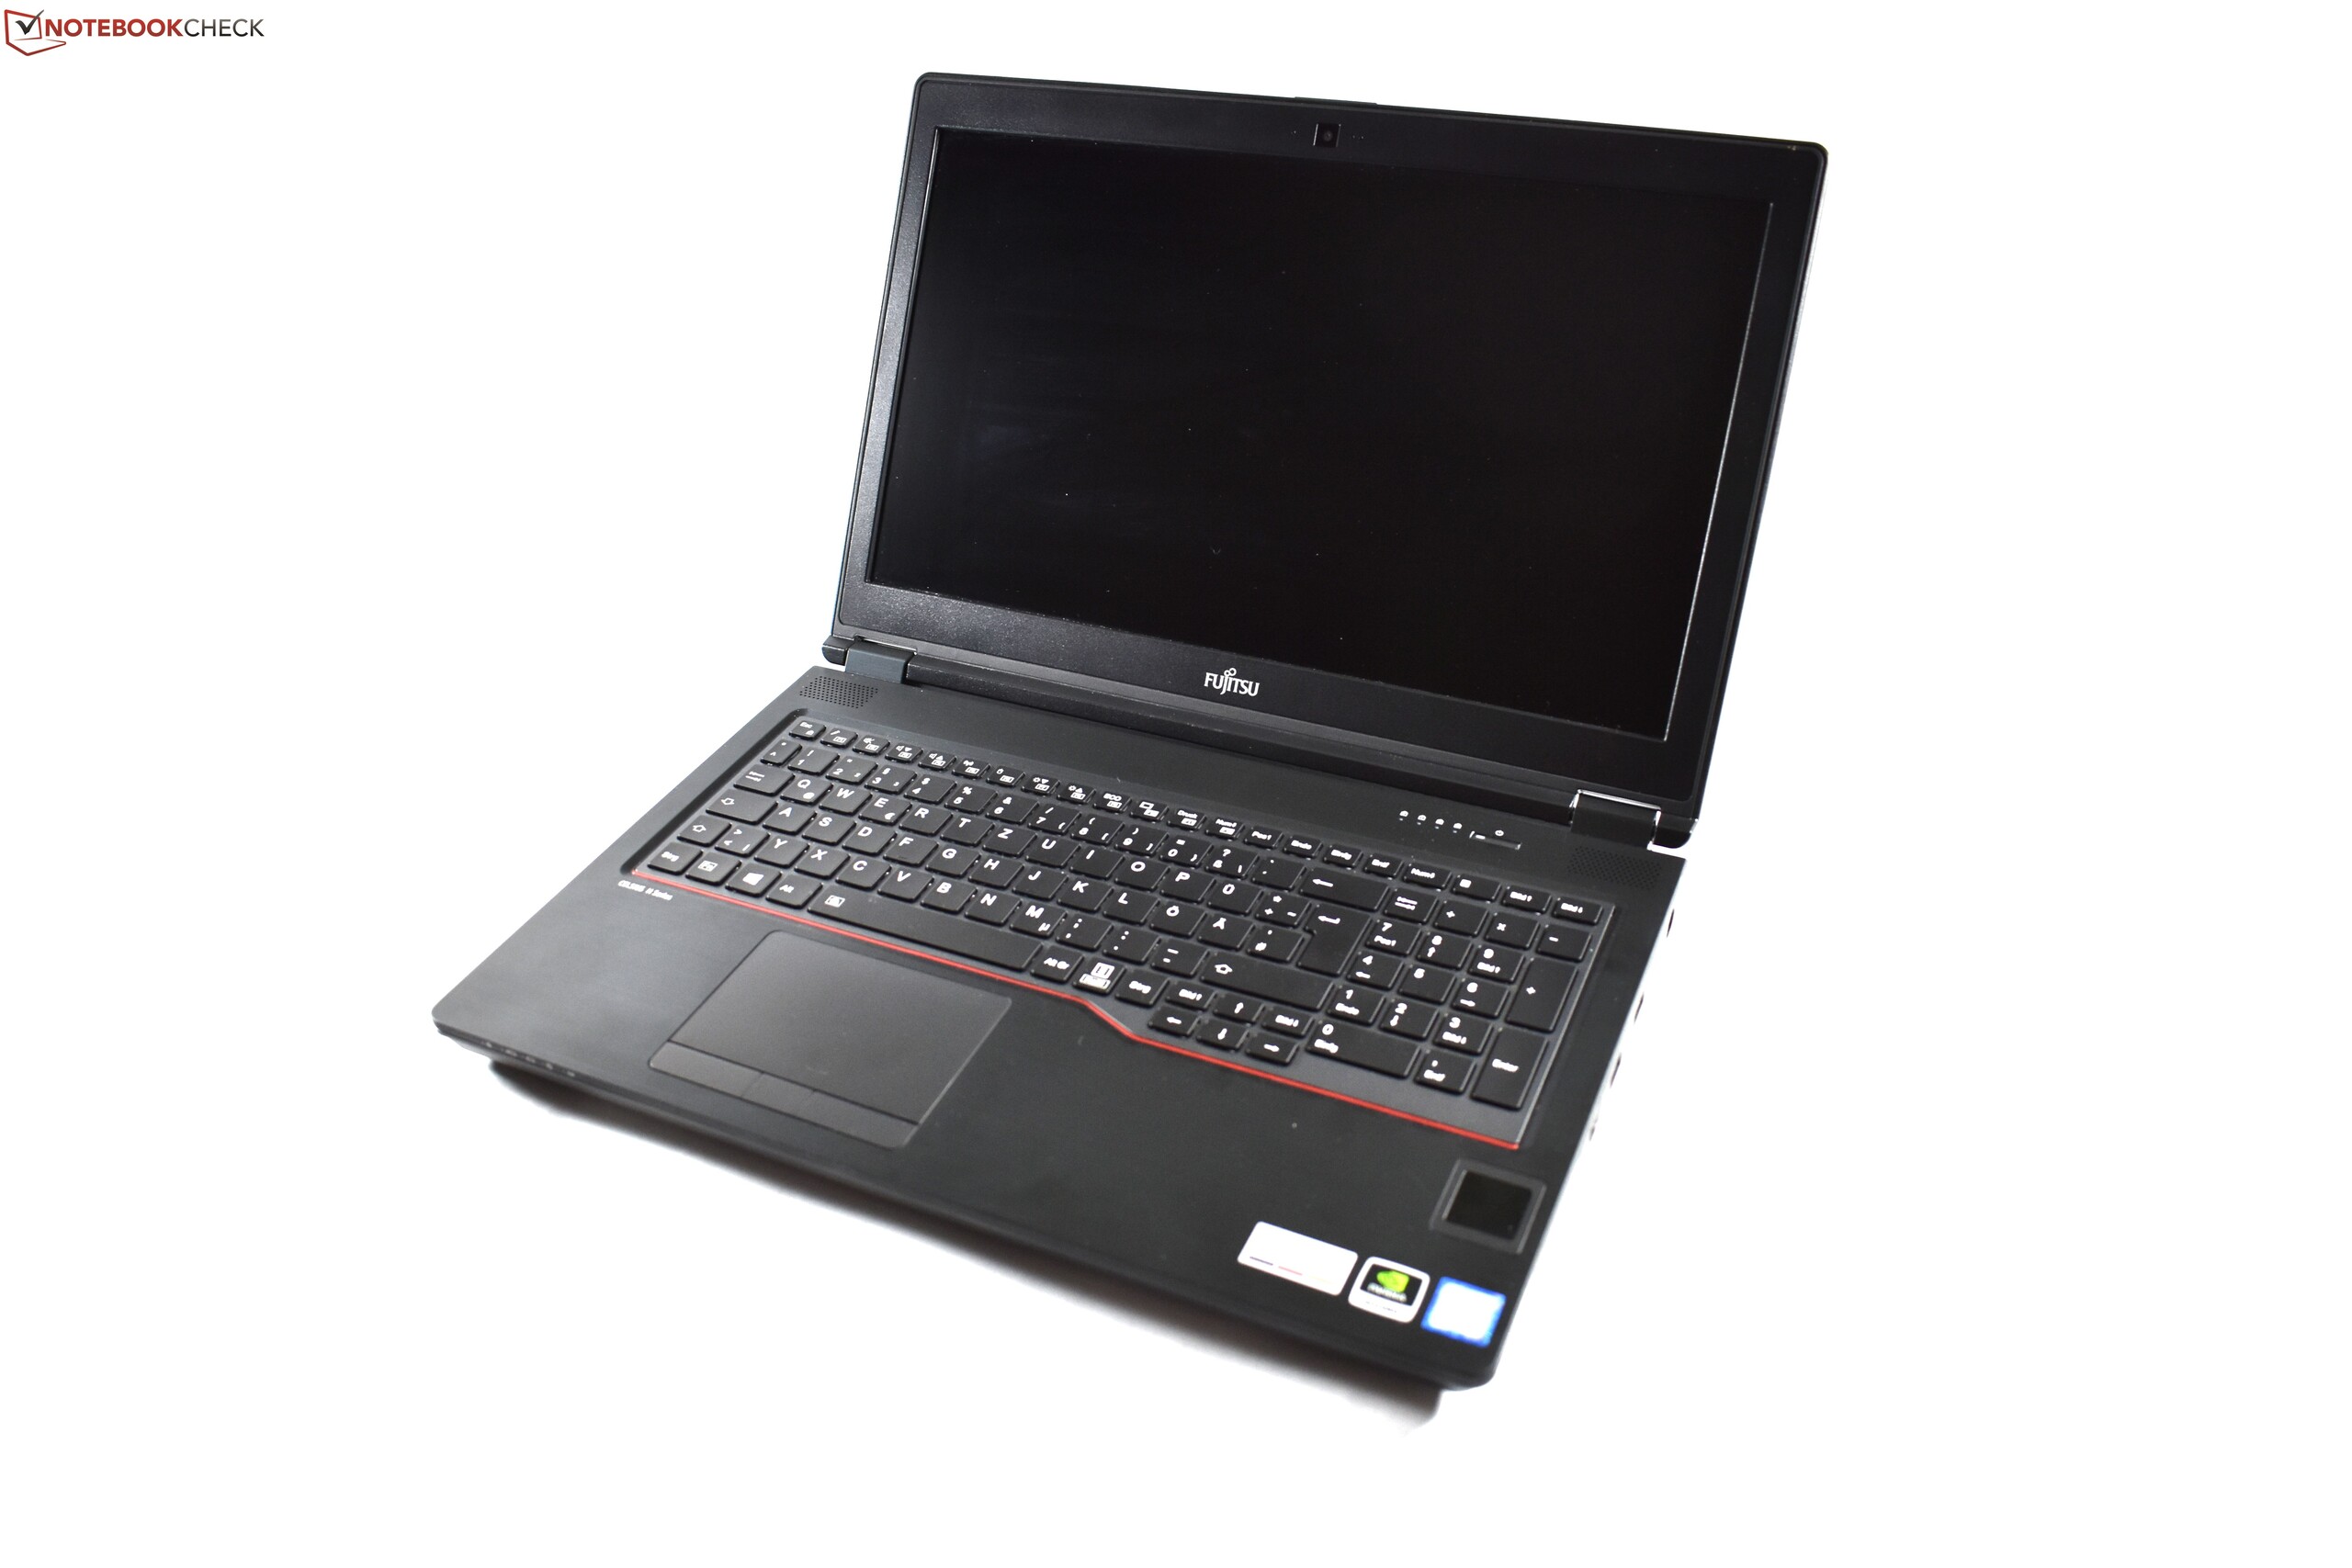
Recensione della Workstation Fujitsu Celsius H780 (i7-8850H, P2000, FHD)
| SD Card Reader | |
| average JPG Copy Test (av. of 3 runs) | |
| Dell Precision 7530 (Toshiba Exceria Pro SDXC 64 GB UHS-II) | |
| Lenovo ThinkPad P52 20MAS03N00 (Toshiba Exceria Pro SDXC 64 GB UHS-II) | |
| Fujitsu Celsius H780 (Toshiba Exceria Pro SDXC 64 GB UHS-II) | |
| Media della classe Workstation (49.6 - 681, n=14, ultimi 2 anni) | |
| Fujitsu Celsius H760 (Toshiba Exceria Pro SDXC 64 GB UHS-II) | |
| HP ZBook 15v G5 (Toshiba Exceria Pro SDXC 64 GB UHS-II) | |
| maximum AS SSD Seq Read Test (1GB) | |
| Media della classe Workstation (87.6 - 1455, n=14, ultimi 2 anni) | |
| Dell Precision 7530 (Toshiba Exceria Pro SDXC 64 GB UHS-II) | |
| Lenovo ThinkPad P52 20MAS03N00 (Toshiba Exceria Pro SDXC 64 GB UHS-II) | |
| Fujitsu Celsius H780 (Toshiba Exceria Pro SDXC 64 GB UHS-II) | |
| Fujitsu Celsius H760 (Toshiba Exceria Pro SDXC 64 GB UHS-II) | |
| HP ZBook 15v G5 (Toshiba Exceria Pro SDXC 64 GB UHS-II) | |
| Networking | |
| iperf3 transmit AX12 | |
| Dell Precision 7530 | |
| Lenovo ThinkPad P52 20MAS03N00 | |
| Fujitsu Celsius H780 | |
| HP ZBook 15v G5 | |
| iperf3 receive AX12 | |
| HP ZBook 15v G5 | |
| Dell Precision 7530 | |
| Fujitsu Celsius H780 | |
| Lenovo ThinkPad P52 20MAS03N00 | |
| |||||||||||||||||||||||||
Distribuzione della luminosità: 86 %
Al centro con la batteria: 276 cd/m²
Contrasto: 934:1 (Nero: 0.29 cd/m²)
ΔE ColorChecker Calman: 3.9 | ∀{0.5-29.43 Ø4.72}
calibrated: 2.9
ΔE Greyscale Calman: 2.6 | ∀{0.09-98 Ø4.97}
85.8% sRGB (Argyll 1.6.3 3D)
56.1% AdobeRGB 1998 (Argyll 1.6.3 3D)
62.8% AdobeRGB 1998 (Argyll 3D)
85.9% sRGB (Argyll 3D)
66.3% Display P3 (Argyll 3D)
Gamma: 2.29
CCT: 6517 K
| Fujitsu Celsius H780 LP156WF6-SPP1, , 1920x1080, 15.6" | Fujitsu Celsius H760 LGD046F LP156WF6-SPP1, , 1920x1080, 15.6" | Lenovo ThinkPad P52 20MAS03N00 N156HCE-EN1, , 1920x1080, 15.6" | Dell Precision 7530 Sharp LQ156D1, , 3840x2160, 15.6" | HP ZBook 15v G5 CMN15E7, , 1920x1080, 15.6" | |
|---|---|---|---|---|---|
| Display | -4% | 3% | 31% | -29% | |
| Display P3 Coverage (%) | 66.3 | 63.9 -4% | 65.6 -1% | 82.5 24% | 43.59 -34% |
| sRGB Coverage (%) | 85.9 | 82.4 -4% | 90.3 5% | 99.4 16% | 65.3 -24% |
| AdobeRGB 1998 Coverage (%) | 62.8 | 60.3 -4% | 65.9 5% | 96.2 53% | 45.06 -28% |
| Response Times | 2% | 0% | 4% | 1% | |
| Response Time Grey 50% / Grey 80% * (ms) | 38 ? | 38 ? -0% | 39.2 ? -3% | 35.2 ? 7% | 37.6 ? 1% |
| Response Time Black / White * (ms) | 26.8 ? | 26 ? 3% | 26 ? 3% | 26.4 ? 1% | 26.8 ? -0% |
| PWM Frequency (Hz) | 20830 ? | 25250 ? | 198.4 ? | 25640 ? | |
| Screen | 4% | -1% | 2% | -13% | |
| Brightness middle (cd/m²) | 271 | 341 26% | 304 12% | 292.8 8% | 244 -10% |
| Brightness (cd/m²) | 260 | 310 19% | 293 13% | 295 13% | 227 -13% |
| Brightness Distribution (%) | 86 | 82 -5% | 88 2% | 85 -1% | 87 1% |
| Black Level * (cd/m²) | 0.29 | 0.34 -17% | 0.26 10% | 0.36 -24% | 0.17 41% |
| Contrast (:1) | 934 | 1003 7% | 1169 25% | 813 -13% | 1435 54% |
| Colorchecker dE 2000 * | 3.9 | 3.8 3% | 4.5 -15% | 3.48 11% | 4.6 -18% |
| Colorchecker dE 2000 max. * | 10.2 | 10.8 -6% | 7.7 25% | 6.81 33% | 19.1 -87% |
| Colorchecker dE 2000 calibrated * | 2.9 | 2.4 17% | 3.13 -8% | 4.6 -59% | |
| Greyscale dE 2000 * | 2.6 | 2 23% | 5.2 -100% | 4.1 -58% | 2.7 -4% |
| Gamma | 2.29 96% | 2.17 101% | 2.26 97% | 2.2 100% | 2.27 97% |
| CCT | 6517 100% | 6581 99% | 6789 96% | 6740 96% | 6407 101% |
| Color Space (Percent of AdobeRGB 1998) (%) | 56.1 | 54 -4% | 53.8 -4% | 84.4 50% | 41.5 -26% |
| Color Space (Percent of sRGB) (%) | 85.8 | 82.2 -4% | 90.1 5% | 99.6 16% | 65.1 -24% |
| Media totale (Programma / Settaggio) | 1% /
2% | 1% /
-0% | 12% /
8% | -14% /
-14% |
* ... Meglio usare valori piccoli
Tempi di risposta del Display
| ↔ Tempi di risposta dal Nero al Bianco | ||
|---|---|---|
| 26.8 ms ... aumenta ↗ e diminuisce ↘ combinato | ↗ 16.4 ms Incremento | 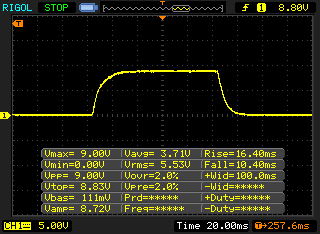 |
| ↘ 10.4 ms Calo | ||
| Lo schermo mostra tempi di risposta relativamente lenti nei nostri tests e potrebbe essere troppo lento per i gamers. In confronto, tutti i dispositivi di test variano da 0.1 (minimo) a 240 (massimo) ms. » 67 % di tutti i dispositivi è migliore. Questo significa che i tempi di risposta rilevati sono peggiori rispetto alla media di tutti i dispositivi testati (19.8 ms). | ||
| ↔ Tempo di risposta dal 50% Grigio all'80% Grigio | ||
| 38 ms ... aumenta ↗ e diminuisce ↘ combinato | ↗ 18.8 ms Incremento | 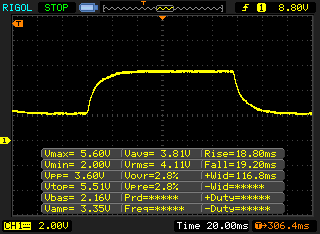 |
| ↘ 19.2 ms Calo | ||
| Lo schermo mostra tempi di risposta lenti nei nostri tests e sarà insoddisfacente per i gamers. In confronto, tutti i dispositivi di test variano da 0.165 (minimo) a 636 (massimo) ms. » 55 % di tutti i dispositivi è migliore. Questo significa che i tempi di risposta rilevati sono peggiori rispetto alla media di tutti i dispositivi testati (31 ms). | ||
Sfarfallio dello schermo / PWM (Pulse-Width Modulation)
| flickering dello schermo / PWM rilevato | 20830 Hz | ≤ 60 % settaggio luminosita' | 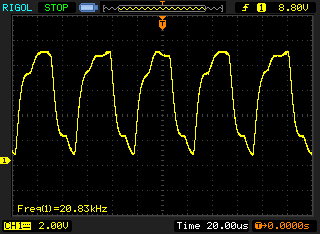 |
Il display sfarfalla a 20830 Hz (Probabilmente a causa dell'uso di PWM) Flickering rilevato ad una luminosita' di 60 % o inferiore. Non dovrebbe verificarsi flickering o PWM sopra questo valore di luminosita'. La frequenza di 20830 Hz è abbastanza alta, quindi la maggioranza degli utenti sensibili al PWM non dovrebbero notare alcun flickering. In confronto: 52 % di tutti i dispositivi testati non utilizza PWM per ridurre la luminosita' del display. Se è rilevato PWM, una media di 7769 (minimo: 5 - massimo: 343500) Hz è stata rilevata. | |||
| PCMark 8 - Home Score Accelerated v2 | |
| HP ZBook 15v G5 | |
| Fujitsu Celsius H780 | |
| Media Intel Core i7-8850H, NVIDIA Quadro P2000 (n=1) | |
| Dell Precision 7530 | |
| Fujitsu Celsius H760 | |
| Lenovo ThinkPad P52 20MAS03N00 | |
| PCMark 8 Home Score Accelerated v2 | 4230 punti | |
| PCMark 8 Work Score Accelerated v2 | 5256 punti | |
| PCMark 10 Score | 5167 punti | |
Aiuto | ||
| Fujitsu Celsius H780 Samsung SSD PM981 MZVLB512HAJQ | Lenovo ThinkPad P52 20MAS03N00 Samsung SSD PM981 MZVLB512HAJQ | Dell Precision 7530 Samsung PM961 NVMe MZVLW512HMJP | HP ZBook 15v G5 Toshiba XG5 KXG50ZNV512G | Media Samsung SSD PM981 MZVLB512HAJQ | Media della classe Workstation | |
|---|---|---|---|---|---|---|
| CrystalDiskMark 5.2 / 6 | 7% | 2% | 1% | 19% | 146% | |
| Write 4K (MB/s) | 98.3 | 108.5 10% | 105.9 8% | 119 21% | 126.7 ? 29% | 171.1 ? 74% |
| Read 4K (MB/s) | 40.18 | 42.78 6% | 23.87 -41% | 37.25 -7% | 44 ? 10% | 70.6 ? 76% |
| Write Seq (MB/s) | 1777 | 1645 -7% | 1542 -13% | 523 -71% | 1617 ? -9% | 3945 ? 122% |
| Read Seq (MB/s) | 1247 | 1485 19% | 1916 54% | 1227 -2% | 1716 ? 38% | 4364 ? 250% |
| Write 4K Q32T1 (MB/s) | 344.7 | 269.2 -22% | 305.4 -11% | 518 50% | 413 ? 20% | 502 ? 46% |
| Read 4K Q32T1 (MB/s) | 383.1 | 348.7 -9% | 358.4 -6% | 646 69% | 420 ? 10% | 615 ? 61% |
| Write Seq Q32T1 (MB/s) | 2019 | 1877 -7% | 1572 -22% | 524 -74% | 2076 ? 3% | 6623 ? 228% |
| Read Seq Q32T1 (MB/s) | 2076 | 3419 65% | 3061 47% | 2508 21% | 3130 ? 51% | 8509 ? 310% |

| 3DMark 11 - 1280x720 Performance GPU | |
| Media della classe Workstation (12535 - 69594, n=24, ultimi 2 anni) | |
| Dell Precision 7530 | |
| Fujitsu Celsius H780 | |
| Media NVIDIA Quadro P2000 (8201 - 8573, n=2) | |
| Lenovo ThinkPad P52 20MAS03N00 | |
| HP ZBook 15v G5 | |
| 3DMark | |
| 1920x1080 Fire Strike Graphics | |
| Media della classe Workstation (8293 - 52560, n=24, ultimi 2 anni) | |
| Dell Precision 7530 | |
| Fujitsu Celsius H780 | |
| Media NVIDIA Quadro P2000 (6741 - 6953, n=2) | |
| Lenovo ThinkPad P52 20MAS03N00 | |
| Fujitsu Celsius H760 | |
| HP ZBook 15v G5 | |
| 1280x720 Cloud Gate Standard Graphics | |
| Media della classe Workstation (58392 - 152418, n=14, ultimi 2 anni) | |
| Dell Precision 7530 | |
| Fujitsu Celsius H780 | |
| Media NVIDIA Quadro P2000 (42598 - 44533, n=2) | |
| Lenovo ThinkPad P52 20MAS03N00 | |
| Fujitsu Celsius H760 | |
| HP ZBook 15v G5 | |
| SiSoft Sandra 2016 | |
| Image Processing | |
| Media NVIDIA Quadro P2000 (n=1) | |
| Fujitsu Celsius H780 | |
| Lenovo ThinkPad P52 20MAS03N00 | |
| HP ZBook 15v G5 | |
| GP Cryptography (Higher Security AES256+SHA2-512) | |
| Fujitsu Celsius H780 | |
| Media NVIDIA Quadro P2000 (n=1) | |
| Lenovo ThinkPad P52 20MAS03N00 | |
| HP ZBook 15v G5 | |
| GP Financial Analysis (FP High/Double Precision) | |
| Fujitsu Celsius H780 | |
| Media NVIDIA Quadro P2000 (n=1) | |
| Lenovo ThinkPad P52 20MAS03N00 | |
| HP ZBook 15v G5 | |
| 3DMark 11 Performance | 8738 punti | |
| 3DMark Cloud Gate Standard Score | 23632 punti | |
| 3DMark Fire Strike Score | 6204 punti | |
Aiuto | ||
| basso | medio | alto | ultra | |
|---|---|---|---|---|
| The Witcher 3 (2015) | 130.3 | 76.1 | 43.2 | 24.3 |
| Dota 2 Reborn (2015) | 130.2 | 115.4 | 102.4 | 97.5 |
| X-Plane 11.11 (2018) | 93 | 86 | 72 |
Rumorosità
| Idle |
| 29.6 / 32.2 / 37 dB(A) |
| Sotto carico |
| 40.3 / 49.4 dB(A) |
 | ||
30 dB silenzioso 40 dB(A) udibile 50 dB(A) rumoroso |
||
min: | ||
(±) La temperatura massima sul lato superiore è di 43.7 °C / 111 F, rispetto alla media di 38.2 °C / 101 F, che varia da 22.2 a 69.8 °C per questa classe Workstation.
(-) Il lato inferiore si riscalda fino ad un massimo di 45.3 °C / 114 F, rispetto alla media di 41.1 °C / 106 F
(+) In idle, la temperatura media del lato superiore è di 24.6 °C / 76 F, rispetto alla media deld ispositivo di 32 °C / 90 F.
(+) I poggiapolsi e il touchpad sono piu' freddi della temperatura della pelle con un massimo di 26.8 °C / 80.2 F e sono quindi freddi al tatto.
(±) La temperatura media della zona del palmo della mano di dispositivi simili e'stata di 27.8 °C / 82 F (+1 °C / 1.8 F).
Fujitsu Celsius H780 analisi audio
(±) | potenza degli altiparlanti media ma buona (72.5 dB)
Bassi 100 - 315 Hz
(-) | quasi nessun basso - in media 28.6% inferiori alla media
(±) | la linearità dei bassi è media (8% delta rispetto alla precedente frequenza)
Medi 400 - 2000 Hz
(+) | medi bilanciati - solo only 3.9% rispetto alla media
(±) | linearità dei medi adeguata (8.6% delta rispetto alla precedente frequenza)
Alti 2 - 16 kHz
(+) | Alti bilanciati - appena 3.4% dalla media
(±) | la linearità degli alti è media (8.9% delta rispetto alla precedente frequenza)
Nel complesso 100 - 16.000 Hz
(±) | la linearità complessiva del suono è media (27.6% di differenza rispetto alla media
Rispetto alla stessa classe
» 94% di tutti i dispositivi testati in questa classe è stato migliore, 2% simile, 4% peggiore
» Il migliore ha avuto un delta di 7%, medio di 17%, peggiore di 35%
Rispetto a tutti i dispositivi testati
» 84% di tutti i dispositivi testati in questa classe è stato migliore, 3% similare, 13% peggiore
» Il migliore ha avuto un delta di 4%, medio di 24%, peggiore di 134%
Dell Precision 7530 analisi audio
(±) | potenza degli altiparlanti media ma buona (74.4 dB)
Bassi 100 - 315 Hz
(±) | bassi ridotti - in media 8% inferiori alla media
(±) | la linearità dei bassi è media (12.3% delta rispetto alla precedente frequenza)
Medi 400 - 2000 Hz
(+) | medi bilanciati - solo only 3.3% rispetto alla media
(±) | linearità dei medi adeguata (7.8% delta rispetto alla precedente frequenza)
Alti 2 - 16 kHz
(+) | Alti bilanciati - appena 2.3% dalla media
(+) | alti lineari (5% delta rispetto alla precedente frequenza)
Nel complesso 100 - 16.000 Hz
(+) | suono nel complesso lineare (11.4% differenza dalla media)
Rispetto alla stessa classe
» 13% di tutti i dispositivi testati in questa classe è stato migliore, 4% simile, 83% peggiore
» Il migliore ha avuto un delta di 7%, medio di 17%, peggiore di 35%
Rispetto a tutti i dispositivi testati
» 7% di tutti i dispositivi testati in questa classe è stato migliore, 2% similare, 91% peggiore
» Il migliore ha avuto un delta di 4%, medio di 24%, peggiore di 134%
| Off / Standby | |
| Idle | |
| Sotto carico |
|
Leggenda:
min: | |
| Battery Runtime - WiFi Websurfing | |
| Lenovo ThinkPad P52 20MAS03N00 | |
| Media della classe Workstation (2.47 - 14.2, n=24, ultimi 2 anni) | |
| HP ZBook 15v G5 | |
| Fujitsu Celsius H780 | |
| Fujitsu Celsius H760 | |
| Dell Precision 7530 | |
Pro
Contro
Il mercato delle workstation è un terreno difficile per Fujitsu, in quanto il piccolo produttore giapponese deve competere con Dell, HP e Lenovo. Senza dubbio: Il Fujitsu Celsius ha le sue qualità. Ma quando prendiamo tutto in considerazione, i concorrenti sono semplicemente migliori.
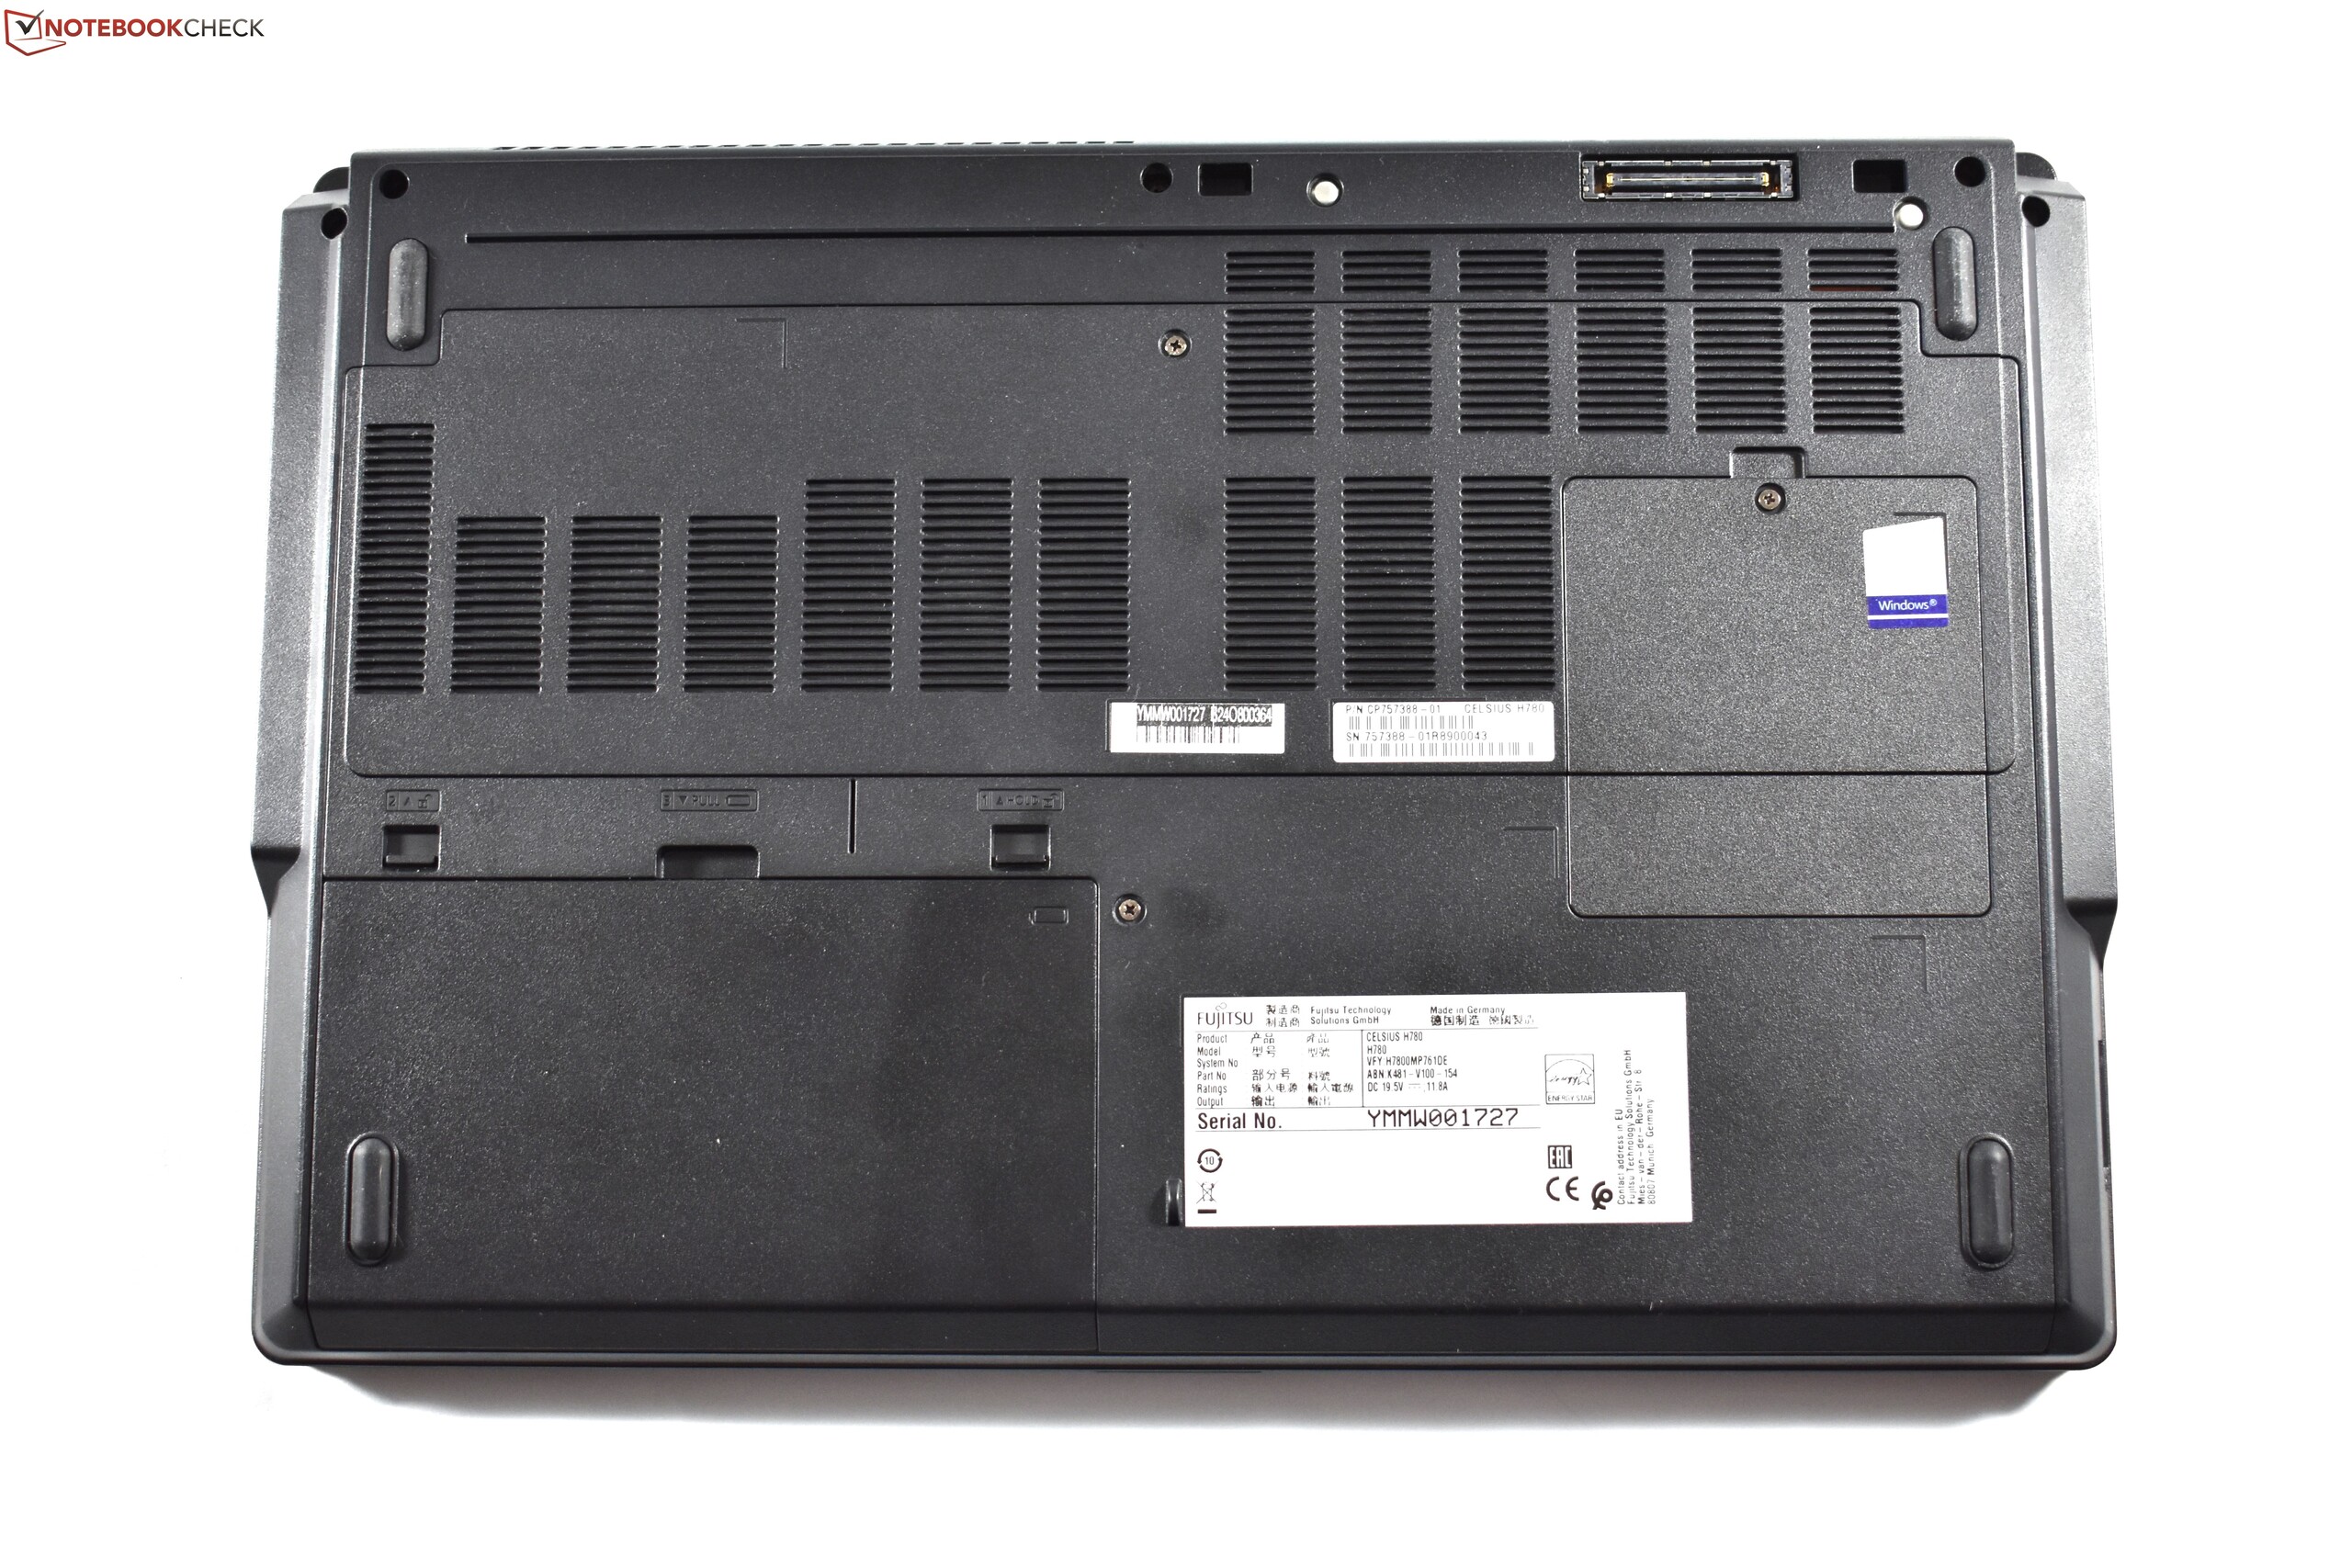
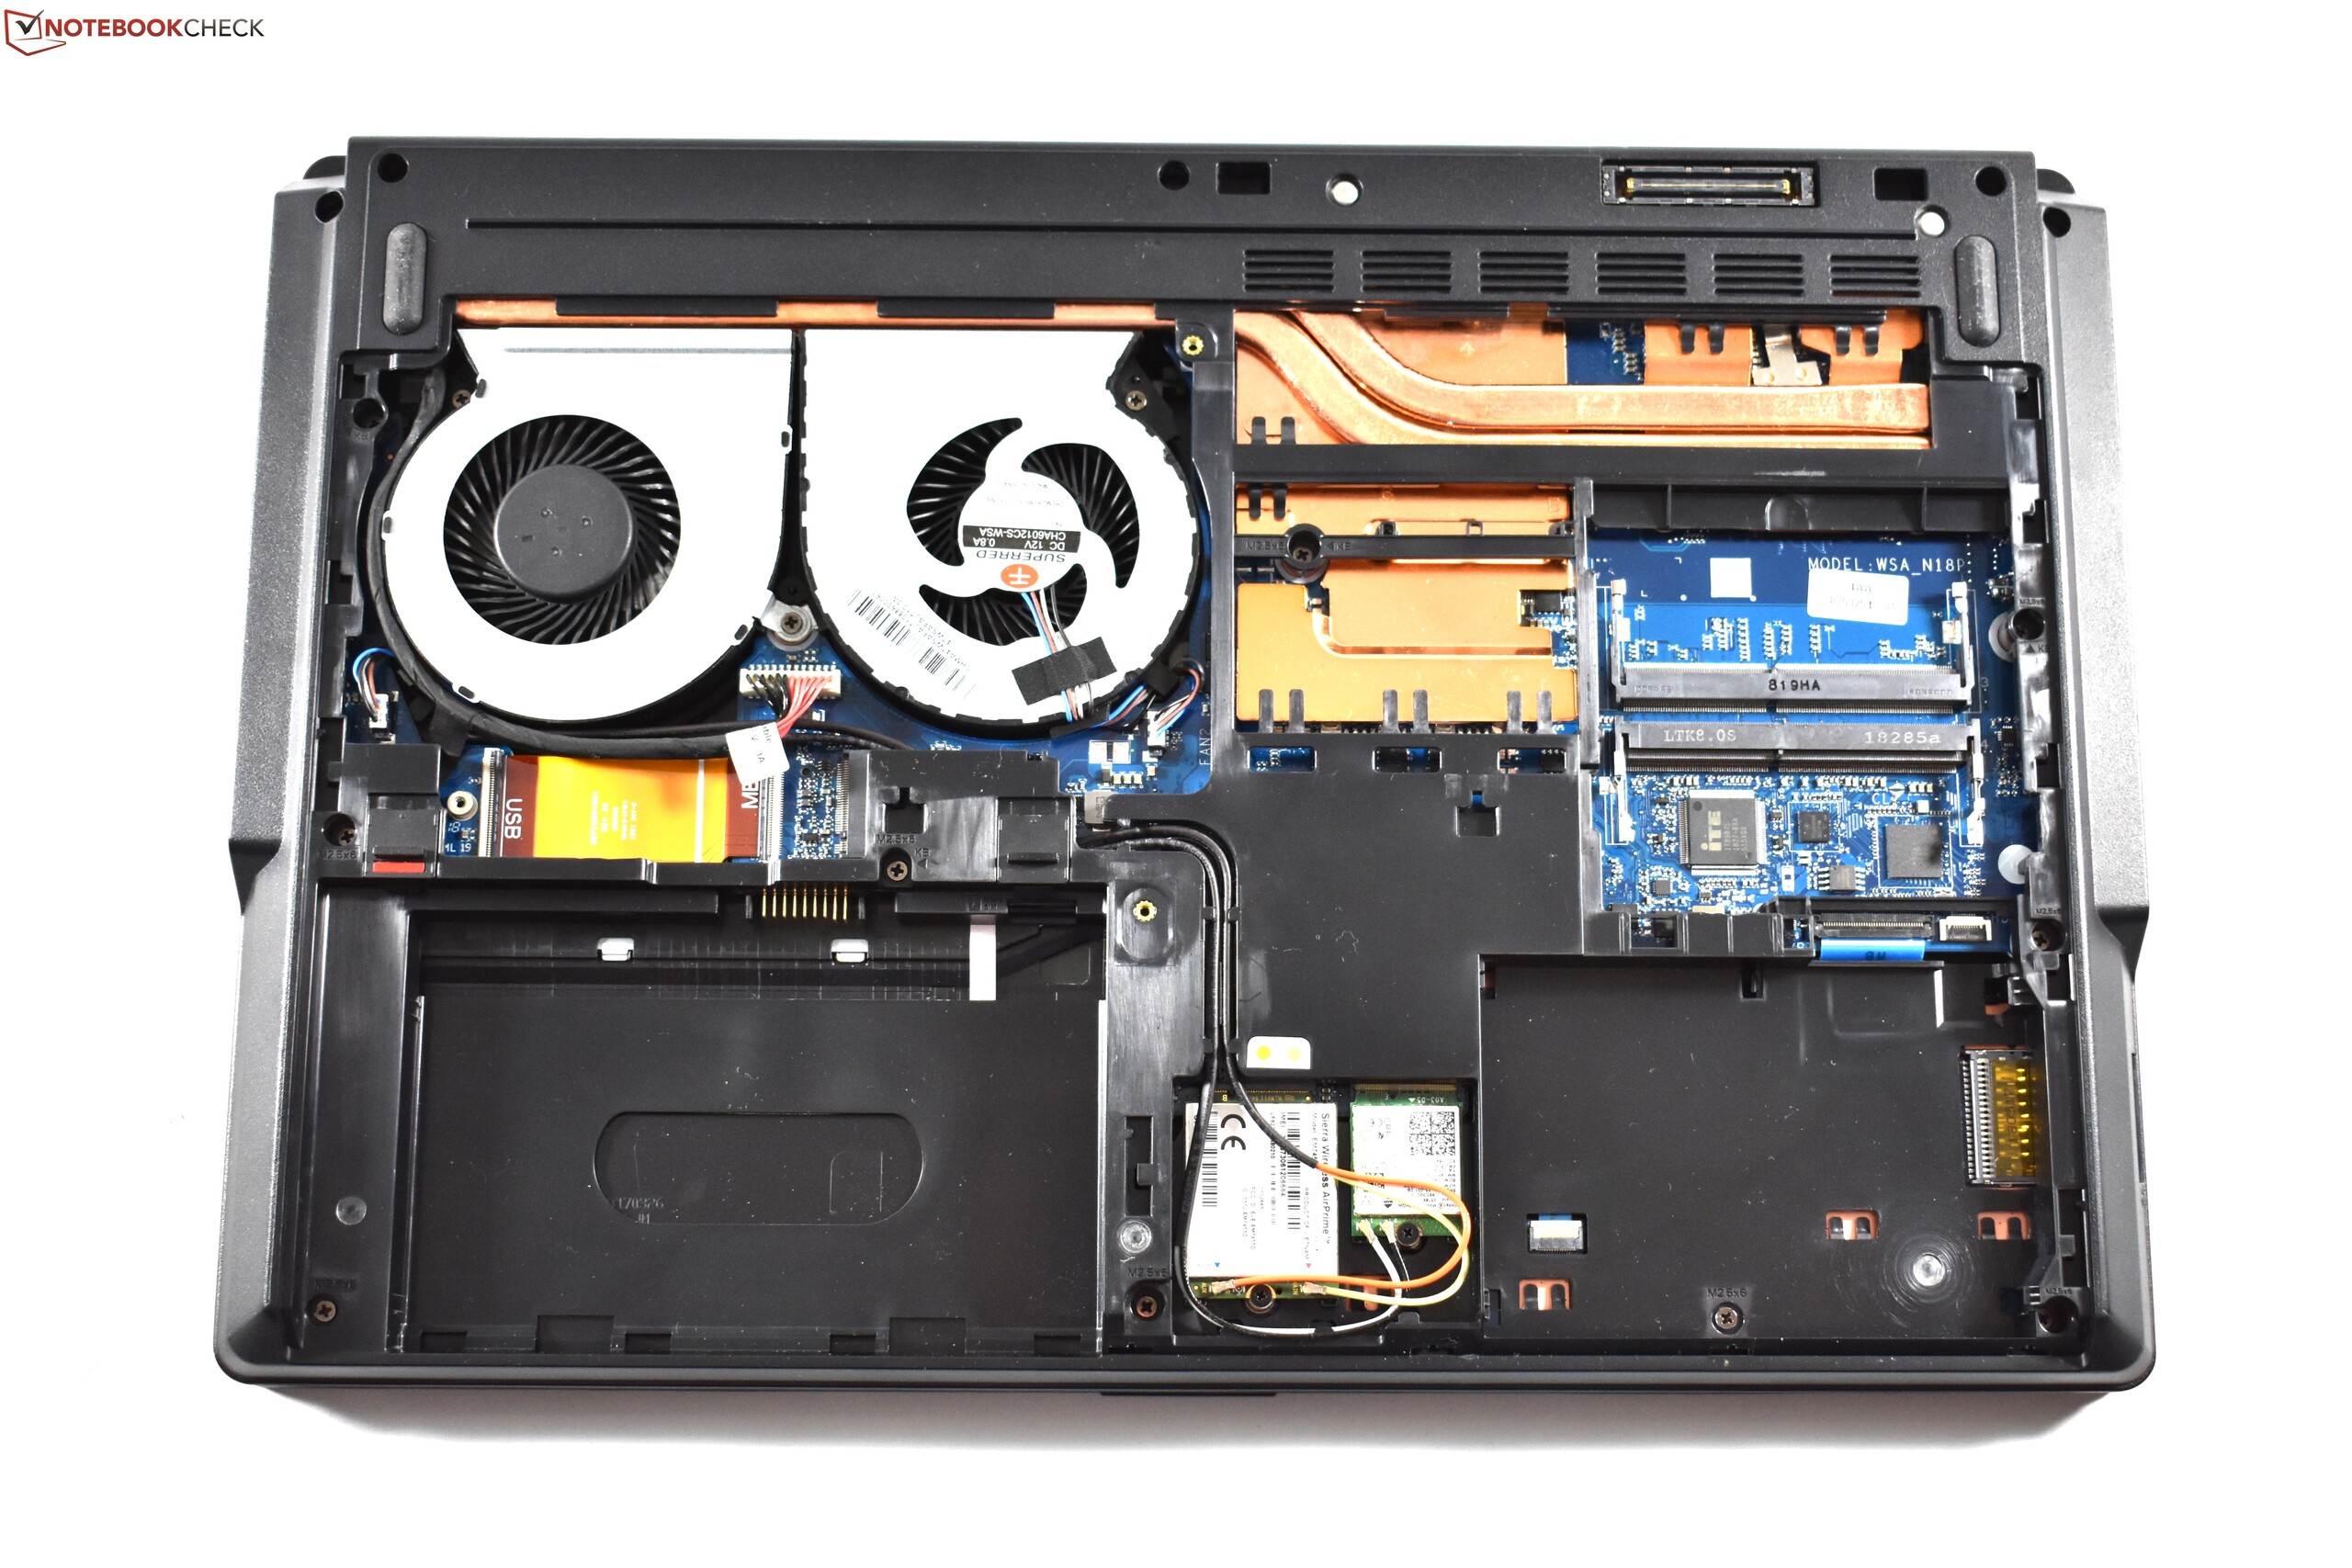
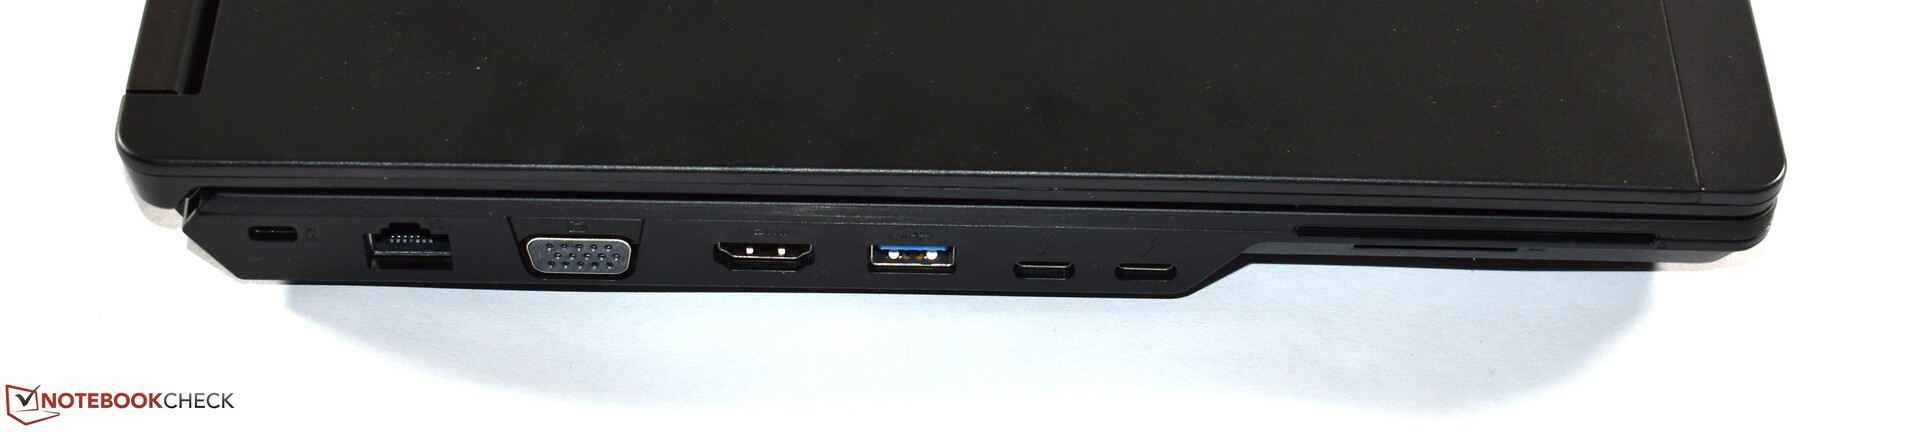
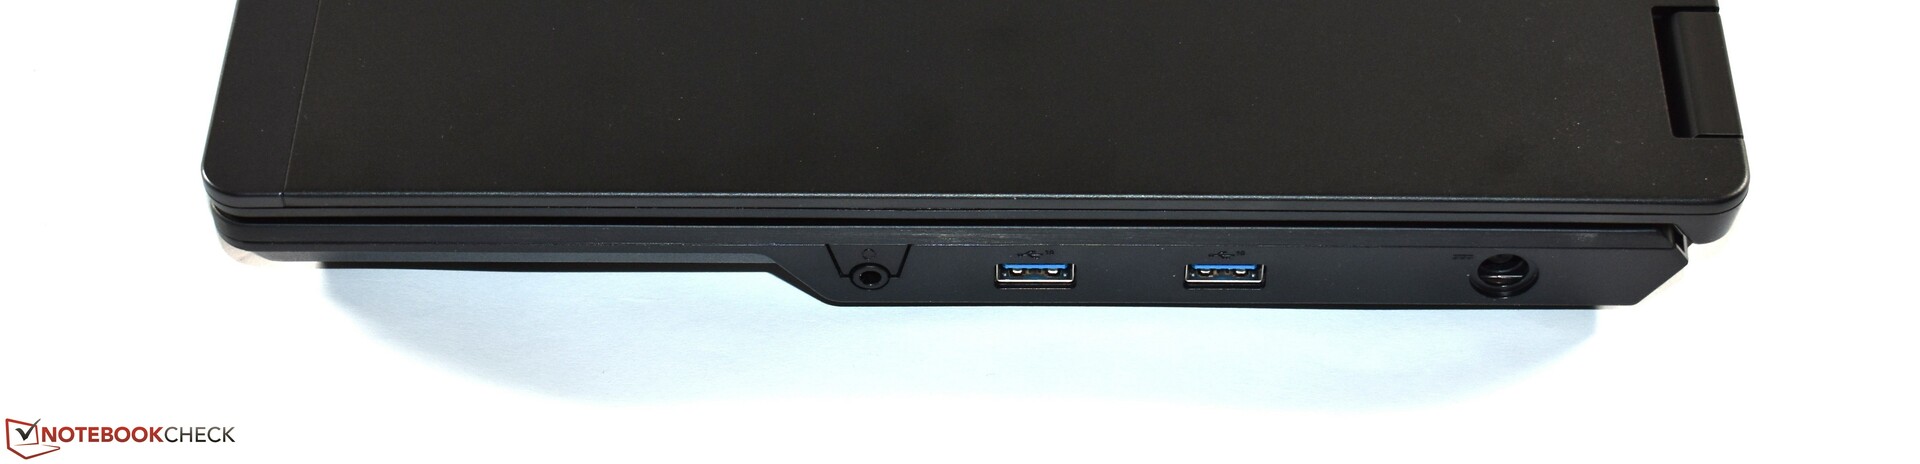
Un vantaggio del laptop Fujitsu è la selezione delle porte con VGA, due porte Thunderbolt e una porta docking meccanica. La tastiera ci soddisfa maggiormente e il telaio rimane sempre fresco, anche sotto carico. Inoltre, il PC Fujitsu è facilmente manutenibile e aggiornabile, e la batteria è anche esterna e quindi sostituibile senza bisogno di utilizzare alcuno strumento. Inoltre, consideriamo la garanzia di tre anni un pro per il Fujitsu Celsius H780.
Purtroppo, ci sono molti punti deboli. Il telaio è abbastanza robusto ma non completamente perfetto in termini di lavorazione, ed è anche più spesso, più grande e più pesante della concorrenza. Un pointing stick è disponibile solo come opzione - la concorrenza ha questa caratteristica di serie. Lo schermo del Celsius non è male, ma la luminosità e la copertura della gamma cromatica deludono. Inoltre, lo schermo mostra un'attenuazione della retroilluminazione. Il problema maggiore del Fujitsu Celsius H780 è il sistema di raffreddamento attivo estremamente fastidioso, dato che le due ventole funzionano troppo spesso e troppo rumorosamente. Nonostante le ventole rumorose, la CPU rallenta molto durante lo stress test, il che può influire sull'uso quotidiano.
Troppi problemi con il Fujitsu Celsius H780 per i nostri gusti - i concorrenti sono migliori.
Il Fujitsu Celsius H780 è ben lungi dall'essere un disastro totale, ma ci aspettiamo semplicemente di più da una macchina che costa 2.500 euro (~$2.806). I concorrenti, Lenovo ThinkPad P52 e Dell Precision 7530, hanno argomenti migliori a loro favore.
Fujitsu Celsius H780
- 03/11/2019 v6 (old)
Benjamin Herzig
Price comparison
