Notebookcheck Logo

NVIDIA Quadro P2000

NVIDIA Quadro P2000

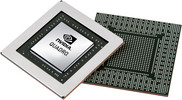
La Nvidia Quadro P2000 è una scheda grafica mobile per workstation di fascia media per notebook. Simile alla consumer GeForce GTX 1050 Ti (Laptop), si basa sul chip GP107 con 768 shader. La scheda grafica è stata progettata per la generazione Kaby Lake / Coffee Lake.

Le GPU Quadro offrono drivers certificati, ottimizzati per la stabilità e le prestazioni nelle applicazioni professionali (CAD, DCC, medicali, di prospezione e di visualizzazione). Le prestazioni in queste aree sono quindi molto migliori rispetto alle corrispondenti GPU consumer.

Performance

Le prestazioni teoriche dovrebbero essere simili a quelle della GeForce GTX 1050 Ti (se il clock non ha subito un duro colpo).

Quadro P Serie

Quadro P5200 2560 @ 1.32 - 1.57 GHz256 Bit @ 7216 MHz
Quadro P4200 2304 @ 1.22 - 1.48 GHz256 Bit @ 7132 MHz
Quadro P5000 2048 @ 1.16 - 1.51 GHz256 Bit @ 6006 MHz
Quadro P5000 Max-Q 2048 @ 1.1 - 1.37 GHz256 Bit @ 6006 MHz
Quadro P4000 1792 @ 1.2 - 1.23 GHz256 Bit @ 6006 MHz
Quadro P4000 Max-Q 1792 @ 1.11 - 1.24 GHz256 Bit @ 6006 MHz
Quadro P3200 1792 @ 0.71 - 1.23 GHz192 Bit @ 7008 MHz
Quadro P3000 1280 @ 1.09 - 1.22 GHz192 Bit @ 7008 MHz
Quadro P3000 Max-Q 1280 @ 1.08 - 1.24 GHz192 Bit @ 7008 MHz
Quadro P2000 768 @ 1.22 - 1.47 GHz128 Bit @ 6008 MHz
Quadro P2000 Max-Q 768 @ 1.22 - 1.47 GHz128 Bit @ 6008 MHz
Quadro P1000 512 @ 1.49 - 1.52 GHz128 Bit @ 6008 MHz
Quadro P620 512 @ 1.18 - 1.44 GHz128 Bit @ 6000 MHz
Nome in codiceGP107GL
ArchitetturaPascal
Pipelines768 - unified
Velocità del core1215 - 1468 (Boost) MHz
Velocità della memoria6008 MHz
Larghezza del bus di memoria128 Bit
Tipo di memoriaGDDR5
Max. quantità di memoria4 GB
Memoria condivisano
APIDirectX 12_1, Shader 5.0, OpenGL 4.5
tecnologia14 nm
CaratteristicheOptimus, PhysX, 3D Vision Pro, nView, Optimus
Dimensione del portatilemisura media
Data dell'annuncio05.07.2017

Benchmark

Performance Rating - 3DMark 11 + Fire Strike + Time Spy
3.1 pt (9%)
AMD Radeon HD 8180
0.06605 -98%
...
2.76 -12%
2.78 -11%
2.8 -10%
AMD Radeon RX 560X (Laptop)
2.88 -8%
2.88 -8%
2.98 -4%
3 -4%
NVIDIA Quadro P2000 Max-Q
3.07 -2%
3.11 0%
NVIDIA Quadro P2000
3.12
AMD Radeon 680M
3.13 0%
3.16 1%
AMD Radeon Pro WX Vega M GL
3.34 7%
3.34 7%
NVIDIA GeForce GTX 1050 Ti Max-Q
3.34 7%
3.4 9%
3.52 13%
NVIDIA GeForce GTX 1050 Ti Mobile
3.53 13%
3.54 13%
...
21.1 576%
max:
33.3 967%
0%
100%
3DMark - 3DMark Time Spy Score
2259 Points (7%)
3DMark - 3DMark Time Spy Graphics
2046 Points (5%)
113 -94%
...
NVIDIA GeForce GTX 1050 Max-Q
1615 -21%
1672 -18%
1724 -16%
1735 -15%
AMD Radeon RX 560X (Laptop)
1788 -13%
1796 -12%
1810 -12%
1814 -11%
2021 -1%
NVIDIA Quadro P2000
2046
NVIDIA Quadro P2000 Max-Q
2049 0%
AMD Radeon Pro WX Vega M GL
2062 1%
2070 1%
2116 3%
2198 7%
AMD Radeon 680M
2221 9%
NVIDIA GeForce GTX 1050 Ti Max-Q
2245 10%
NVIDIA GeForce GTX 1050 Ti Mobile
2309 13%
2472 21%
...
19434 850%
max:
36485 1683%
0%
100%
3DMark - 3DMark Ice Storm Unlimited Graphics
350317 Points (40%)
3DMark - 3DMark Cloud Gate Score
min: 23632     media: 24335     media: 24335 (26%)     massimo: 25038 Points
3DMark - 3DMark Cloud Gate Graphics
min: 42598     media: 43566     media: 43565.5 (11%)     massimo: 44533 Points
3DMark - 3DMark Fire Strike Standard Score
min: 6116     media: 6160     media: 6160 (11%)     massimo: 6204 Points
3DMark - 3DMark Fire Strike Standard Graphics
min: 6741     media: 6847     media: 6847 (8%)     massimo: 6953 Points
3DMark - 3DMark Ice Storm Graphics
51884 Points (6%)
3DMark 11 - 3DM11 Performance Score
min: 8660     media: 8699     media: 8699 (12%)     massimo: 8738 Points
3DMark 11 - 3DM11 Performance GPU
min: 8201     media: 8387     media: 8387 (7%)     massimo: 8573 Points
171.8 -98%
...
7808 -7%
7944 -5%
AMD Radeon RX 560X (Laptop)
7970 -5%
8067 -4%
8129 -3%
8133 -3%
NVIDIA Quadro P2000 Max-Q
8148 -3%
8289 -1%
AMD Radeon RX 560 (Laptop)
8323 -1%
NVIDIA Quadro P2000
8387
8553 2%
8656 3%
NVIDIA GeForce GTX 1050 Ti Max-Q
8781 5%
8851 6%
9448 13%
9569 14%
NVIDIA GeForce GTX 1050 Ti Mobile
9591 14%
9603 14%
9708 16%
...
59943 615%
max:
106023 1164%
0%
100%
3DMark Vantage
3DM Vant. Perf. total +
3DM Vant. Perf. GPU no PhysX +
3DMark Vantage - 3DM Vant. Perf. GPU no PhysX
31451 Points (18%)
62 -100%
...
27921 -11%
28186 -10%
28693 -9%
29214 -7%
NVIDIA GeForce GTX 1050 Ti Max-Q
29448 -6%
29844 -5%
29938 -5%
30252 -4%
NVIDIA Quadro P2000 Max-Q
30786 -2%
NVIDIA Quadro P2000
31451
31800 1%
NVIDIA GeForce GTX 1050 Ti Mobile
32349 3%
32473 3%
32473 3%
33179 5%
33321 6%
33676 7%
33740 7%
33810 8%
...
132443 321%
max:
170928 443%
0%
100%
3DMark 06 3DMark 06 - Standard 1280x1024 +
Unigine Valley 1.0 - Unigine Valley 1.0 DX
34.6 fps (11%)
Unigine Heaven 2.1 - Heaven 2.1 high
86.1 fps (16%)
0.6 -99%
...
NVIDIA GeForce GTX 680M
73.9 -14%
75.8 -12%
76.8 -11%
78.5 -9%
82.2 -5%
82.5 -4%
83.8 -3%
NVIDIA GeForce GTX 1050 Ti Max-Q
86 0%
86.1 0%
NVIDIA Quadro P2000
86.1
87.2 1%
88.8 3%
95.8 11%
96.8 12%
97 13%
NVIDIA GeForce GTX 1050 Max-Q
101.2 18%
104 21%
107.1 24%
112.5 31%
...
532 518%
0%
100%
SPECviewperf 12
specvp12 sw-03 +
SPECviewperf 12 - specvp12 sw-03
min: 103.8     media: 103.9     media: 103.9 (26%)     massimo: 104 fps
specvp12 snx-02 +
SPECviewperf 12 - specvp12 snx-02
min: 65.8     media: 66.7     media: 66.7 (10%)     massimo: 67.6 fps
specvp12 showcase-01 +
SPECviewperf 12 - specvp12 showcase-01
min: 30.42     media: 30.6     media: 30.6 (7%)     massimo: 30.73 fps
specvp12 mediacal-01 +
SPECviewperf 12 - specvp12 mediacal-01
min: 22.84     media: 23     media: 23 (6%)     massimo: 23.11 fps
specvp12 maya-04 +
SPECviewperf 12 - specvp12 maya-04
min: 59.2     media: 59.8     media: 59.8 (16%)     massimo: 60.3 fps
specvp12 energy-01 +
SPECviewperf 12 - specvp12 energy-01
min: 5.27     media: 5.4     media: 5.4 (5%)     massimo: 5.62 fps
specvp12 creo-01 +
specvp12 catia-04 +
SPECviewperf 12 - specvp12 catia-04
min: 69.6     media: 70.2     media: 70.2 (12%)     massimo: 70.8 fps
specvp12 3dsmax-05 +
SPECviewperf 12 - specvp12 3dsmax-05
71.9 fps (13%)
SPECviewperf 13 specvp13 sw-04 +
SPECviewperf 13 - specvp13 sw-04
96.1 fps (26%)
specvp13 snx-03 +
SPECviewperf 13 - specvp13 snx-03
121.9 fps (14%)
specvp13 showcase-02 +
SPECviewperf 13 - specvp13 showcase-02
30.3 fps (7%)
specvp13 medical-02 +
SPECviewperf 13 - specvp13 medical-02
18.5 fps (4%)
specvp13 maya-05 +
SPECviewperf 13 - specvp13 maya-05
89.3 fps (10%)
specvp13 energy-02 +
SPECviewperf 13 - specvp13 energy-02
5.3 fps (2%)
specvp13 creo-02 +
SPECviewperf 13 - specvp13 creo-02
82.1 fps (12%)
specvp13 catia-05 +
SPECviewperf 13 - specvp13 catia-05
104 fps (12%)
specvp13 3dsmax-06 +
SPECviewperf 13 - specvp13 3dsmax-06
71.7 fps (12%)
Cinebench R10 Cinebench R10 Shading (32bit) +
Cinebench R11.5 Cinebench R11.5 OpenGL 64 Bit +
Cinebench R15
Cinebench R15 OpenGL 64 Bit +
Cinebench R15 OpenGL Ref. Match 64 Bit +
LuxMark v2.0 64Bit - LuxMark v2.0 Room GPU
min: 870     media: 1075     media: 1075 (5%)     massimo: 1280 Samples/s
LuxMark v2.0 64Bit - LuxMark v2.0 Sala GPU
min: 2636     media: 2692     media: 2691.5 (5%)     massimo: 2747 Samples/s
ComputeMark v2.1 - ComputeMark v2.1 Result
min: 4723     media: 4859     media: 4858.5 (5%)     massimo: 4994 punti
Power Consumption - Witcher 3 Power Consumption *
76.5 Watt (17%)
Power Consumption - Witcher 3 ultra Power Efficiency
0.3 fps per Watt (34%)
Emissions Witcher 3 Fan Noise +
- Valori di benchmark per questa scheda grafica
- Valori medi di benchmark per questa scheda grafica
* Numeri più piccoli rappresentano prestazioni supeiori

Benchmarks per i giochi

I seguenti benchmarks deirivano dai benchmarks dei portatili recensiti. Le prestazioni dipendono dalla scheda grafica utilizzata, dal clock rate, dal processore, dai settaggi di sistema, dai drivers, e dai sistemi operativi. Quindi i risultati non sono rappresentativi per i portatili con questa GPU. Per informazioni dettagliate sui risultati del benchmark, cliccate sul numero di fps.

F1 2018

F1 2018

2018
basso 1280x720
139  fps    + Confronta
medio 1920x1080
77  fps    + Confronta
alto 1920x1080
61  fps    + Confronta
ultra 1920x1080
32  fps    + Confronta
QHD 2560x1440
22  fps    + Confronta
4K 3840x2160
12  fps    + Confronta
» Giocabile con tutti i portatili testati con dettagli alto.
Far Cry 5

Far Cry 5

2018
basso 1280x720
89  fps    + Confronta
medio 1920x1080
47  fps    + Confronta
alto 1920x1080
41  fps    + Confronta
ultra 1920x1080
35  fps    + Confronta
QHD 2560x1440
21  fps    + Confronta
4K 3840x2160
9  fps    + Confronta
» Giocabile con tutti i portatili testati con dettagli alto.
basso 1280x720
93  fps    + Confronta
medio 1920x1080
86  fps    + Confronta
alto 1920x1080
72  fps    + Confronta
» Giocabile con tutti i portatili testati con dettagli alto.
basso 1280x720
104  fps    + Confronta
medio 1920x1080
42  fps    + Confronta
alto 1920x1080
33  fps    + Confronta
ultra 1920x1080
26  fps    + Confronta
QHD 2560x1440
14  fps    + Confronta
4K 3840x2160
7  fps    + Confronta
» Giocabile con tutti i portatili testati con dettagli medio.
basso 1280x720
59  fps    + Confronta
medio 1920x1080
35  fps    + Confronta
alto 1920x1080
26  fps    + Confronta
4K 3840x2160
10  fps    + Confronta
» Giocabile con tutti i portatili testati con dettagli basso.
Fortnite

Fortnite

2018
basso 1280x720
201  fps    + Confronta
medio 1920x1080
144  fps    + Confronta
alto 1920x1080
60  fps    + Confronta
ultra 1920x1080
45  fps    + Confronta
QHD 2560x1440
24  fps    + Confronta
4K 3840x2160
10  fps    + Confronta
» Giocabile con tutti i portatili testati con dettagli ultra.
basso 1280x720
59  fps    + Confronta
medio 1920x1080
32  fps    + Confronta
alto 1920x1080
29  fps    + Confronta
ultra 1920x1080
28  fps    + Confronta
4K 3840x2160
3  fps    + Confronta
» Giocabile con tutti i portatili testati con dettagli basso.
Additional Benchmarks
Ultra Preset FXAA + TAA 2560x1440
22
basso 1280x720
115  fps    + Confronta
medio 1920x1080
61  fps    + Confronta
alto 1920x1080
41  fps    + Confronta
ultra 1920x1080
28  fps    + Confronta
4K 3840x2160
9  fps    + Confronta
» Giocabile con tutti i portatili testati con dettagli alto.
Additional Benchmarks
Ultra Preset TAA 2560x1440
23
basso 1280x720
85  fps    + Confronta
medio 1920x1080
30  fps    + Confronta
alto 1920x1080
19  fps    + Confronta
ultra 1920x1080
12  fps    + Confronta
4K 3840x2160
3  fps    + Confronta
» Giocabile con tutti i portatili testati con dettagli basso.
Additional Benchmarks
Medium Preset (100 % Resolution Scale) 1366x768
6
F1 2017

F1 2017

2017
basso 1280x720
169  fps    + Confronta
medio 1920x1080
89  fps    + Confronta
alto 1920x1080
63  fps    + Confronta
ultra 1920x1080
38  fps    + Confronta
4K 3840x2160
11  fps    + Confronta
» Giocabile con tutti i portatili testati con dettagli ultra.
Additional Benchmarks
Medium Preset 4xAF 1366x768
111
basso 1280x720
101  fps    + Confronta
medio 1920x1080
53  fps    + Confronta
alto 1920x1080
41  fps    + Confronta
ultra 1920x1080
29  fps    + Confronta
4K 3840x2160
7  fps    + Confronta
» Giocabile con tutti i portatili testati con dettagli alto.
Additional Benchmarks
Medium Preset 1366x768
78
Dirt 4

Dirt 4

2017
basso 1280x720
201  fps    + Confronta
medio 1920x1080
105  fps    + Confronta
alto 1920x1080
59  fps    + Confronta
ultra 1920x1080
40  fps    + Confronta
4K 3840x2160
19  fps    + Confronta
» Giocabile con tutti i portatili testati con dettagli ultra.
Additional Benchmarks
Medium Preset 4xAF 1366x768
135
basso 1280x720
249  fps    + Confronta
medio 1920x1080
164  fps    + Confronta
alto 1920x1080
110  fps    + Confronta
4K 3840x2160
39  fps    + Confronta
» Giocabile con tutti i portatili testati con dettagli alto.
Additional Benchmarks
Performance 1920x1080
247
Prey

Prey

2017
basso 1280x720
125  fps    + Confronta
medio 1920x1080
89  fps    + Confronta
alto 1920x1080
78  fps    + Confronta
ultra 1920x1080
62  fps    + Confronta
4K 3840x2160
20  fps    + Confronta
» Giocabile con tutti i portatili testati con dettagli ultra.
Additional Benchmarks
Medium Preset 4xAF FXAA 1366x768
98
basso 1280x720
244  fps    + Confronta
medio 1920x1080
119  fps    + Confronta
alto 1920x1080
60  fps    + Confronta
ultra 1920x1080
25  fps    + Confronta
4K 3840x2160
17  fps    + Confronta
» Giocabile con tutti i portatili testati con dettagli alto.
Additional Benchmarks
Medium / Off FXAA 1366x768
188
basso 1280x720
350  fps    + Confronta
medio 1366x768
288  fps    + Confronta
alto 1920x1080
162  fps    + Confronta
ultra 1920x1080
114  fps    + Confronta
4K 3840x2160
62  fps    + Confronta
» Giocabile con tutti i portatili testati con dettagli ultra.
basso 1024x768
116  fps    + Confronta
medio 1366x768
89  fps    + Confronta
alto 1920x1080
51  fps    + Confronta
ultra 1920x1080
46  fps    + Confronta
4K 3840x2160
30  fps    + Confronta
» Giocabile con tutti i portatili testati con dettagli ultra.
basso 1280x720
87  fps    + Confronta
medio 1366x768
63  fps    + Confronta
alto 1920x1080
34  fps    + Confronta
ultra 1920x1080
17  fps    + Confronta
4K 3840x2160
11  fps    + Confronta
» Giocabile con tutti i portatili testati con dettagli medio.
Additional Benchmarks
Medium Preset 2xAF 1920x1080
41
Doom

Doom

2016
basso 1280x720
112  fps    + Confronta
medio 1366x768
101  fps    + Confronta
alto 1920x1080
60  fps    + Confronta
ultra 1920x1080
54  fps    + Confronta
4K 3840x2160
17  fps    + Confronta
» Giocabile con tutti i portatili testati con dettagli ultra.
Additional Benchmarks
Medium Preset 1920x1080
69
basso 1280x768
70  fps    + Confronta
medio 1920x1080
41  fps    + Confronta
alto 1920x1080
36  fps    + Confronta
4K 3840x2160
16  fps    + Confronta
» Giocabile con tutti i portatili testati con dettagli alto.
Additional Benchmarks
extreme 3840x2160
20
basso 1280x720
88  fps    + Confronta
medio 1366x768
78  fps    + Confronta
alto 1920x1080
37  fps    + Confronta
ultra 1920x1080
36  fps    + Confronta
4K 3840x2160
16  fps    + Confronta
» Giocabile con tutti i portatili testati con dettagli ultra.
Additional Benchmarks
Medium / Off 4xAF 1920x1080
67
basso 1024x768
82  fps    + Confronta
medio 1366x768
62  fps    + Confronta
alto 1920x1080
38  fps    + Confronta
ultra 1920x1080
32  fps    + Confronta
4K 3840x2160
15  fps    + Confronta
» Giocabile con tutti i portatili testati con dettagli alto.
Fallout 4

Fallout 4

2015
basso 1280x720
98  fps    + Confronta
medio 1366x768
88  fps    + Confronta
alto 1920x1080
51  fps    + Confronta
ultra 1920x1080
38  fps    + Confronta
4K 3840x2160
13  fps    + Confronta
» Giocabile con tutti i portatili testati con dettagli ultra.
basso 1024x768
60  fps    + Confronta
medio 1366x768
60  fps    + Confronta
alto 1920x1080
60  fps    + Confronta
ultra 1920x1080
60  fps    + Confronta
4K 3840x2160
25  fps    + Confronta
» Giocabile con tutti i portatili testati con dettagli ultra.
basso 1280x720
130.2  fps    + Confronta
medio 1366x768
115.4  fps    + Confronta
alto 1920x1080
102.4  fps    + Confronta
ultra 1920x1080
97.5  fps    + Confronta
» Giocabile con tutti i portatili testati con dettagli ultra.
basso 1280x720
109  fps    + Confronta
medio 1366x768
95  fps    + Confronta
alto 1920x1080
52  fps    + Confronta
ultra 1920x1080
36  fps    + Confronta
4K 3840x2160
17  fps    + Confronta
» Giocabile con tutti i portatili testati con dettagli ultra.
basso 1024x768
103 130.3 ~ 117 fps    + Confronta
medio 1366x768
71 76.1 ~ 74 fps    + Confronta
alto 1920x1080
33 43.2 ~ 38 fps    + Confronta + 📈 Graph
ultra 1920x1080
24.3 26 ~ 25 fps    + Confronta
4K 3840x2160
13  fps    + Confronta
» Giocabile con la maggior parte dei portatili testati con dettagli alto.
Thief

Thief

2014
basso 1024x768
133  fps    + Confronta
medio 1366x768
99  fps    + Confronta
alto 1366x768
85  fps    + Confronta
ultra 1920x1080
47  fps    + Confronta
» Giocabile con tutti i portatili testati con dettagli ultra.
basso 1280x720
317  fps    + Confronta
medio 1366x768
213  fps    + Confronta
alto 1366x768
184  fps    + Confronta
ultra 1920x1080
68  fps    + Confronta
» Giocabile con tutti i portatili testati con dettagli ultra.
bassomedioaltoultraQHD4K
F1 20181397761322212
Far Cry 589474135219
X-Plane 11.11938672
Kingdom Come: Deliverance104423326147
Final Fantasy XV Benchmark59352610
Fortnite20114460452410
The Evil Within 2593229283
Middle-earth: Shadow of War1156141289
Ark Survival Evolved853019123
F1 201716989633811
Playerunknown's Battlegrounds (PUBG)1015341297
Dirt 4201105594019
Rocket League24916411039
Prey12589786220
Resident Evil 7244119602517
Farming Simulator 1735028816211462
Civilization VI11689514630
Deus Ex Mankind Divided8763341711
Doom112101605417
Ashes of the Singularity70413616
Hitman 20168878373616
Rise of the Tomb Raider8262383215
Fallout 49888513813
Metal Gear Solid V6060606025
Dota 2 Reborn130.2115.4102.497.5
Batman: Arkham Knight10995523617
The Witcher 311774382513
Thief133998547
BioShock Infinite31721318468
< 30 fps
< 60 fps
< 120 fps
≥ 120 fps

2
16
11

7
18
4
3
13
11
2
8
12
5
4


22
2
1

Per conoscere altri giochi che potrebbero essere utilizzabili e per una lista completa di tutti i giochi e delle schede grafiche visitate la nostra Gaming List

v1.26
log 17. 09:16:42

#0 no ids found in url (should be separated by "_") +0s ... 0s

#1 not redirecting to Ajax server +0s ... 0s

#2 did not recreate cache, as it is less than 5 days old! Created at Sat, 16 Mar 2024 05:38:32 +0100 +0.001s ... 0.001s

#3 no comparison url found in template nbc.compare_page_1 needed +0.062s ... 0.064s

#4 no comparison url found in template nbc.compare_page_1 needed +0s ... 0.064s

#5 no comparison url found in template nbc.compare_page_1 needed +0s ... 0.064s

#6 no comparison url found in template nbc.compare_page_1 needed +0s ... 0.064s

#7 no comparison url found in template nbc.compare_page_1 needed +0s ... 0.064s

#8 no comparison url found in template nbc.compare_page_1 needed +0s ... 0.064s

#9 no comparison url found in template nbc.compare_page_1 needed +0s ... 0.064s

#10 no comparison url found in template nbc.compare_page_1 needed +0s ... 0.065s

#11 no comparison url found in template nbc.compare_page_1 needed +0s ... 0.065s

#12 no comparison url found in template nbc.compare_page_1 needed +0s ... 0.065s

#13 no comparison url found in template nbc.compare_page_1 needed +0s ... 0.065s

#14 no comparison url found in template nbc.compare_page_1 needed +0s ... 0.065s

#15 composed specs +0s ... 0.065s

#16 did output specs +0s ... 0.065s

#17 start showIntegratedCPUs +0s ... 0.065s

#18 getting avg benchmarks for device 8886 +0.03s ... 0.095s

#19 got single benchmarks 8886 +0.021s ... 0.116s

#20 got avg benchmarks for devices +0s ... 0.116s

#21 min, max, avg, median took s +0.798s ... 0.915s

#22 before gaming benchmark output +0s ... 0.915s

#23 Got 145 rows for game benchmarks. +0.015s ... 0.929s

#24 composed SQL query for gamebenchmarks +0s ... 0.929s

#25 got data and put it in $dataArray +0.024s ... 0.953s

#26 benchmarks composed for output. +1.294s ... 2.247s

#27 no comparison url found in template nbc.compare_page_1 needed +0.004s ... 2.251s

#28 return log +0s ... 2.251s

Recensioni Notebook con NVIDIA Quadro P2000 la scheda grafica

Recensione della Workstation Fujitsu Celsius H780 (i7-8850H, P2000, FHD)

Recensione della Workstation Fujitsu Celsius H780 (i7-8850H, P2000, FHD)

Come player un po' più piccolo, Fujitsu sta affrontando una battaglia in salita nel mercato delle workstations mobili. Fujitsu può imporre il suo Celsius H780 c...
Intel Core i7-8850H | NVIDIA Quadro P2000 | 15.60" | 2.8 kg
Recensione della workstation Dell Precision 5530 (Xeon E-2176M, Quadro P2000)

Recensione della workstation Dell Precision 5530 (Xeon E-2176M, Quadro P2000)

Il Precision 5530 è, per molti versi, quello che avrebbe dovuto essere il Precision 5520. Sebbene la macchina aggiornata sia ancora alle prese con il thermal th...
Intel Xeon E-2176M | NVIDIA Quadro P2000 | 15.60" | 2 kg

HP ZBook 15 G6 6TU88EA: Intel Core i7-9850H, 15.60", 2.6 kg
  Recensioni esterne » HP ZBook 15 G6 6TU88EA

HP ZBook Studio x360 G5-9AV38PA: Intel Core i7-8850H, 15.60", 2.2 kg
  Recensioni esterne » HP ZBook Studio x360 G5-9AV38PA

HP ZBook Studio x360 G5 5UC06EA: Intel Core i9-8950HK, 15.60", 2.3 kg
  Recensioni esterne » HP ZBook Studio x360 G5 5UC06EA

Lenovo ThinkPad P1-20MD000NGE: Intel Core i7-8850H, 15.60", 1.7 kg
  Recensioni esterne » Lenovo ThinkPad P1-20MD000NGE

Lenovo ThinkPad P1-20MD0023US: Intel Core i7-8850H, 15.60", 1.7 kg
  Recensioni esterne » Lenovo ThinkPad P1-20MD0023US

Lenovo ThinkPad P72-20MB0005GE: Intel Core i7-8750H, 17.30", 3.4 kg
  Recensioni esterne » Lenovo ThinkPad P72-20MB0005GE

Lenovo ThinkPad P52-20M90017GE: Intel Core i7-8850H, 15.60", 2.9 kg
  Recensioni esterne » Lenovo ThinkPad P52-20M90017GE

HP ZBook 15 G5-2ZC66EA: Intel Core i7-8850H, 15.60", 2.6 kg
  Recensioni esterne » HP ZBook 15 G5-2ZC66EA

MSI WS63 8SJ-047ES: Intel Core i7-8750H, 15.60", 1.9 kg
  Recensioni esterne » MSI WS63 8SJ-047ES

Dell Precision 5530 Xeon E-2176M: Intel Xeon E-2176M, 15.60", 2 kg
  Recensioni esterne » Dell Precision 5530 Xeon E-2176M

Please share our article, every link counts!

Classe 0

Arc A380

Classe 1

GeForce RTX 2080 Super Mobile

Classe 2

M1 Max 32-Core GPU *
GeForce RTX 2070 Super Mobile
M1 Max 24-Core GPU *
Radeon RX 5700M *
M1 Pro 16-Core GPU *
Radeon PRO W6600M *
GeForce RTX 2070 Super Max-Q
M1 Pro 14-Core GPU *
Quadro P4200
Quadro P5000 Max-Q *
GeForce RTX 3050 4GB Laptop GPU
Quadro P4000 Max-Q
Radeon RX 580X (Laptop) *
Radeon RX 580 (Laptop)
Radeon Pro 5300M
Radeon RX 5300M
Quadro P3000 Max-Q *
Radeon Pro WX 7100 *
Radeon RX 570X (Laptop) *
Radeon RX 570 (Laptop) *
Radeon RX 470 (Laptop) *

Classe 3

GeForce GTX 1050 Ti Mobile
Radeon 680M
Quadro P2000 Max-Q
Radeon R9 M395X
GeForce GTX 1050 Ti Max-Q *
WX Vega M GL
Radeon R9 M485X
GeForce GTX 1050 Max-Q *
Radeon 660M
Radeon RX 560X (Laptop)
Radeon RX 560 (Laptop)
Radeon Pro 560X
Radeon Pro 560
Radeon Pro 460
Radeon Pro WX 4130 *
Quadro P620 *
Radeon RX 550X (Laptop)
Radeon Pro 555X
Radeon Pro 555
Radeon Pro 455
Quadro P600
Radeon RX 540X *
Radeon Pro WX 2100 *
Radeon Pro WX 3100 *
Radeon Pro 450
Radeon 630
Radeon 540X *
Quadro P520
Quadro P500 *
Iris Plus Graphics G7 (Ice Lake 64 EU) *
Vega 10 *
Iris Pro Graphics 580
Vega 9
FirePro W5130M
UHD Graphics Xe G4 48EUs *
UHD Graphics 32EUs
UHD Graphics Xe 32EUs (Tiger Lake-H) *
UHD Graphics 750
Vega 7
Radeon R7 M465
Vega 8
Iris Plus Graphics G4 (Ice Lake 48 EU)
Quadro M600M
FirePro W4190M
Radeon R7 M445
UHD Graphics 24EUs (Alder Lake-N) *
Radeon R7 M340
Radeon 610M *
UHD Graphics G1 (Ice Lake 32 EU)
UHD Graphics Xe 16EUs (Tiger Lake-H) *
Radeon R5 (Bristol Ridge)
Adreno 690 *
Adreno 685 *
Adreno 680 *

Classe 4

UHD Graphics 730
Radeon R5 M315 *
Radeon R5 M420 *
UHD Graphics 617
UHD Graphics 615
Radeon R4 (Stoney Ridge)
Radeon R2 (Stoney Ridge)
HD Graphics (Broadwell)

Classe 5

Posizione approssimativa dell'adattatore grafico

> Recensioni e prove di notebook, tablets e smartphones > Info Techniche / Tips > Confronto delle schede video > NVIDIA > NVIDIA Quadro P2000
Klaus Hinum, 2018-09-27 (Update: 2018-09-27)