Notebookcheck Logo

NVIDIA GeForce RTX 2060 Max-Q

La NVIDIA GeForce RTX 2060 con design Max-Q è la variante a risparmio energetico della GeForce RTX 2060 mobile. Si tratta quindi di una scheda grafica di gioco di fascia alta per computer portatili sottili. Si basa sullo stesso chip della RTX 2060 ma con velocità di clock ridotte e un consumo energetico inferiore. È stata rilasciata nel 2020 con il portatile da gioco Zephyrus G14.

Con il refresh, Nvidia ha anche rielaborato le tecnologie Max-Q per una maggiore efficienza. La GDDR6 a basso voltaggio (clock più basso ma maggiore margine per la GPU) e la migliore efficienza del regolatore dovrebbero migliorare le prestazioni per Watt. Inoltre, l'OEM può implementare due nuove funzionalità opzionali. La Max-Q Dynamic Boost è in grado di spostare la potenza dalla CPU alla GPU su una base per frame per aumentare le prestazioni complessive. Inoltre, il produttore del laptop può anche implementare Advanced Optimus con uno switch dinamico del display (hardware) per abilitare Optimus, G-SYNC e display ad alta frequenza di aggiornamento (fino a 4K 120 Hz).

Il clock non è però l'unica differenza rispetto alla GTX 1080 normale. I drivers per la versione Max-Q sono stati ottimizzati per l'efficienza (e non per le prestazioni; solo per i modelli Max-Q), ci sono convertitori di tensione ottimizzati per il funzionamento a 1V, metodi di raffreddamento di fascia alta, e un limite di 40 dB per il rumore della ventola (con regolazioni del clock per garantire sempre questo livello).

Le prestazioni dovrebbero essere solo leggermente inferiori alla RTX 2060 normale a causa della diminuzione del clock. Dovrebbe essere il più adatta per il gioco a 1080p al massimo livello di dettaglio. Le funzioni di raytracing, tuttavia, possono ridurre molto i framerate, quindi l'uso del raytracing sarà limitato ad alcuni giochi.

Il chip ha un TGP di circa 65 Watt e quindi chiaramente inferiore agli 80 - 90 Watt della RTX 2060 Mobile normale.

GeForce RTX 2000 Serie

NVIDIA Titan RTX 4608 @ 1.35 - 1.77 GHz384 Bit @ 14000 MHz
GeForce RTX 2080 Ti (Desktop) 4352 @ 1.35 - 1.55 GHz352 Bit @ 14000 MHz
GeForce RTX 2080 Super (Desktop) 3072 @ 1.65 - 1.82 GHz256 Bit @ 15500 MHz
GeForce RTX 2080 (Desktop) 2944 @ 1.52 - 1.71 GHz256 Bit @ 14000 MHz
GeForce RTX 2080 Super Mobile 3072 @ 1.37 - 1.56 GHz256 Bit @ 14000 MHz
GeForce RTX 2080 Mobile 2944 @ 1.38 - 1.59 GHz256 Bit @ 14000 MHz
GeForce RTX 2070 Super (Desktop) 2560 @ 1.61 - 1.77 GHz256 Bit @ 14000 MHz
GeForce RTX 2070 (Desktop) 2304 @ 1.41 - 1.62 GHz256 Bit @ 14000 MHz
GeForce RTX 2070 Super Mobile 2560 @ 1.14 - 1.38 GHz256 Bit @ 14002 MHz
GeForce RTX 2080 Super Max-Q 3072 @ 0.98 - 1.23 GHz256 Bit @ 11000 MHz
GeForce RTX 2060 Super (Desktop) 2176 @ 1.47 - 1.65 GHz256 Bit @ 14000 MHz
GeForce RTX 2070 Mobile 2304 @ 1.22 - 1.44 GHz256 Bit @ 14000 MHz
GeForce RTX 2080 Max-Q 2944 @ 0.74 - 1.1 GHz256 Bit @ 12000 MHz
GeForce RTX 2060 (Desktop) 1920 @ 1.32 - 1.62 GHz192 Bit @ 14000 MHz
GeForce RTX 2070 Super Max-Q 2560 @ 0.93 - 1.16 GHz256 Bit @ 11000 MHz
GeForce RTX 2070 Max-Q 2304 @ 0.89 - 1.19 GHz256 Bit @ 12000 MHz
GeForce RTX 2060 Mobile 1920 @ 0.96 - 1.2 GHz192 Bit @ 14000 MHz
GeForce RTX 2060 Max-Q 1920 @ 0.98 - 1.19 GHz192 Bit @ 11000 MHz
GeForce RTX 2050 Mobile 2048 @ 1.48 GHz64 Bit @ 14000 MHz
Nome in codiceN18E-G1 MAX-Q TU106
ArchitetturaTuring
Pipelines1920 - unified
Velocità del core975 - 1185 (Boost) MHz
Velocità della memoria11000 MHz
Larghezza del bus di memoria192 Bit
Tipo di memoriaGDDR6
Max. quantità di memoria6 GB
Memoria condivisano
APIDirectX 12_1, OpenGL 4.6
Consumo di corrente65 Watt
tecnologia12 nm
CaratteristicheDLSS, Raytraycing, VR Ready, G-SYNC, Vulkan, Multi Monitor
Dimensione del portatilegrande
Data dell'annuncio06.01.2019

Benchmark

Performance Rating - 3DMark 11 + Fire Strike + Time Spy
6.8 pt (20%)
3DMark - 3DMark Time Spy Graphics
min: 5357     media: 5637     media: 5638.5 (15%)     massimo: 5914 Points
3DMark - 3DMark Ice Storm Unlimited Graphics
308872 Points (35%)
3DMark - 3DMark Cloud Gate Score
min: 25407     media: 31253     media: 30659.5 (33%)     massimo: 38287 Points
3DMark - 3DMark Cloud Gate Graphics
min: 38074     media: 58101     media: 58890 (15%)     massimo: 76551 Points
3DMark - 3DMark Fire Strike Standard Score
min: 12716     media: 13699     media: 13716 (24%)     massimo: 14649 Points
3DMark - 3DMark Fire Strike Standard Graphics
min: 14129     media: 14900     media: 14909.5 (17%)     massimo: 15650 Points
3DMark - 3DMark Ice Storm Graphics
95273 Points (11%)
3DMark 11 - 3DM11 Performance Score
min: 16516     media: 17896     media: 18065 (25%)     massimo: 18937 Points
3DMark 11 - 3DM11 Performance GPU
min: 18863     media: 19881     media: 19778.5 (17%)     massimo: 21105 Points
3DMark Vantage
3DM Vant. Perf. total +
3DM Vant. Perf. GPU no PhysX +
3DMark 06 3DMark 06 - Standard 1280x1024 +
3DMark 06
37332 Points (49%)
Cinebench R10 Cinebench R10 Shading (32bit) +
Cinebench R10 - Cinebench R10 Shading (32bit)
11800 punti (8%)
Cinebench R11.5 Cinebench R11.5 OpenGL 64 Bit +
Cinebench R11.5 - Cinebench R11.5 OpenGL 64 Bit
76.3 fps (26%)
Cinebench R15
Cinebench R15 OpenGL 64 Bit +
Cinebench R15 - Cinebench R15 OpenGL 64 Bit
min: 104.1     media: 132.3     media: 137 (8%)     massimo: 151 fps
Cinebench R15 OpenGL Ref. Match 64 Bit +
Cinebench R15 - Cinebench R15 OpenGL Ref. Match 64 Bit
99.6 % (100%)
GFXBench 3.1 - GFXBench Manhattan ES 3.1 Offscreen
411.3 fps (9%)
GFXBench (DX / GLBenchmark) 2.7
GFXBench T-Rex HD Offscreen C24Z16 +
GFXBench (DX / GLBenchmark) 2.7 - GFXBench T-Rex HD Offscreen C24Z16
1123 fps (9%)
Power Consumption - Furmark Stress Test Power Consumption - external Monitor *
min: 96.6     media: 116.3     media: 116.3 (17%)     massimo: 136 Watt
Power Consumption - The Witcher 3 Power Consumption - external Monitor *
min: 107.5     media: 120.8     media: 120.8 (17%)     massimo: 134 Watt
Power Consumption - Witcher 3 Power Consumption *
min: 99.2     media: 110.6     media: 108.9 (24%)     massimo: 125.5 Watt
Power Consumption - Witcher 3 ultra Power Efficiency
min: 0.4858     media: 0.5     media: 0.5 (51%)     massimo: 0.566 fps per Watt
Power Consumption - Witcher 3 ultra Power Efficiency - external Monitor
min: 0.4694     media: 0.5     media: 0.5 (42%)     massimo: 0.543 fps per Watt
Emissions Witcher 3 Fan Noise +
Emissions - Witcher 3 Fan Noise
min: 41.3     media: 49.4     media: 51.3 (82%)     massimo: 53.7 dB(A)
Clock Speed - GPU Clock Witcher 3 ultra
1418 MHz (56%)
Clock Speed - GPU Clock Speed Furmark
1171 MHz (46%)
- Valori di benchmark per questa scheda grafica
- Valori medi di benchmark per questa scheda grafica
* Numeri più piccoli rappresentano prestazioni supeiori

Benchmarks per i giochi

I seguenti benchmarks deirivano dai benchmarks dei portatili recensiti. Le prestazioni dipendono dalla scheda grafica utilizzata, dal clock rate, dal processore, dai settaggi di sistema, dai drivers, e dai sistemi operativi. Quindi i risultati non sono rappresentativi per i portatili con questa GPU. Per informazioni dettagliate sui risultati del benchmark, cliccate sul numero di fps.

basso 1280x720
257.9  fps    + Confronta
medio 1920x1080
120.4  fps    + Confronta
alto 1920x1080
76.4  fps    + Confronta
ultra 1920x1080
56.9  fps    + Confronta
4K 3840x2160
18.9  fps    + Confronta
» Giocabile con tutti i portatili testati con dettagli ultra.
basso 1280x720
176.1  fps    + Confronta
medio 1920x1080
108.7  fps    + Confronta
alto 1920x1080
95.7  fps    + Confronta
ultra 1920x1080
93.3  fps    + Confronta
» Giocabile con tutti i portatili testati con dettagli ultra.
basso 1280x720
194.2  fps    + Confronta
medio 1920x1080
96.3  fps    + Confronta
alto 1920x1080
75.7  fps    + Confronta
» Giocabile con tutti i portatili testati con dettagli alto.
basso 1280x720
78.5  fps    + Confronta
medio 1920x1080
68.5  fps    + Confronta
alto 1920x1080
68.2  fps    + Confronta
ultra 1920x1080
85.3  fps    + Confronta
» Giocabile con tutti i portatili testati con dettagli ultra.
medio 1920x1080
92.9  fps    + Confronta
alto 1920x1080
88  fps    + Confronta
ultra 1920x1080
77.8  fps    + Confronta
» Giocabile con tutti i portatili testati con dettagli ultra.
basso 1280x720
103.2  fps    + Confronta
medio 1920x1080
88.7  fps    + Confronta
alto 1920x1080
82.2  fps    + Confronta
ultra 1920x1080
79  fps    + Confronta
» Giocabile con tutti i portatili testati con dettagli ultra.
GRID 2019

GRID 2019

2019
basso 1280x720
157.4  fps    + Confronta
medio 1920x1080
109.4  fps    + Confronta
alto 1920x1080
103.4  fps    + Confronta
ultra 1920x1080
73.5  fps    + Confronta
4K 3840x2160
33.1  fps    + Confronta
» Giocabile con tutti i portatili testati con dettagli ultra.
basso 1280x720
123  fps    + Confronta
medio 1920x1080
82  fps    + Confronta
alto 1920x1080
75  fps    + Confronta
ultra 1920x1080
55  fps    + Confronta
» Giocabile con tutti i portatili testati con dettagli ultra.
basso 1280x720
117  fps    + Confronta
medio 1920x1080
89.5  fps    + Confronta
alto 1920x1080
61.9  fps    + Confronta
ultra 1920x1080
48.3  fps    + Confronta
» Giocabile con tutti i portatili testati con dettagli ultra.
Control

Control

2019
basso 1280x720
183.7  fps    + Confronta
medio 1920x1080
67.1  fps    + Confronta
alto 1920x1080
50.4  fps    + Confronta
» Giocabile con tutti i portatili testati con dettagli alto.
F1 2019

F1 2019

2019
basso 1280x720
196  fps    + Confronta
medio 1920x1080
137  fps    + Confronta
alto 1920x1080
116  fps    + Confronta
ultra 1920x1080
101  fps    + Confronta
» Giocabile con tutti i portatili testati con dettagli ultra.
basso 1280x720
201.1  fps    + Confronta
medio 1920x1080
103.3  fps    + Confronta
alto 1920x1080
69.2  fps    + Confronta
ultra 1920x1080
50.7  fps    + Confronta
» Giocabile con tutti i portatili testati con dettagli ultra.
Anno 1800

Anno 1800

2019
basso 1280x720
81.5  fps    + Confronta
medio 1920x1080
81.6  fps    + Confronta
alto 1920x1080
61.4  fps    + Confronta
ultra 1920x1080
36.5  fps    + Confronta
» Giocabile con tutti i portatili testati con dettagli ultra.
basso 1280x720
154  fps    + Confronta
medio 1920x1080
92  fps    + Confronta
alto 1920x1080
74  fps    + Confronta
ultra 1920x1080
56  fps    + Confronta
» Giocabile con tutti i portatili testati con dettagli ultra.
basso 1280x720
276.7  fps    + Confronta
medio 1920x1080
125.3  fps    + Confronta
alto 1920x1080
105.3  fps    + Confronta
ultra 1920x1080
60.5  fps    + Confronta
4K 3840x2160
24.4  fps    + Confronta
» Giocabile con tutti i portatili testati con dettagli ultra.
basso 1280x720
105  fps    + Confronta
medio 1920x1080
75  fps    + Confronta
alto 1920x1080
70  fps    + Confronta
ultra 1920x1080
63  fps    + Confronta
» Giocabile con tutti i portatili testati con dettagli ultra.
basso 1280x720
129.6  fps    + Confronta
medio 1920x1080
72.7  fps    + Confronta
alto 1920x1080
55.2  fps    + Confronta
ultra 1920x1080
43.8  fps    + Confronta
» Giocabile con tutti i portatili testati con dettagli ultra.
basso 1280x720
143.6  fps    + Confronta
medio 1920x1080
142.8  fps    + Confronta
alto 1920x1080
126.2  fps    + Confronta
ultra 1920x1080
116.6  fps    + Confronta
» Giocabile con tutti i portatili testati con dettagli ultra.
basso 1280x720
97  fps    + Confronta
medio 1920x1080
79  fps    + Confronta
alto 1920x1080
65  fps    + Confronta
ultra 1920x1080
45  fps    + Confronta
» Giocabile con tutti i portatili testati con dettagli ultra.
basso 1280x720
118 118 ~ 118 fps    + Confronta
medio 1920x1080
84 90 ~ 87 fps    + Confronta
alto 1920x1080
75 84 ~ 80 fps    + Confronta
ultra 1920x1080
65 74 ~ 70 fps    + Confronta
4K 3840x2160
20  fps    + Confronta
» Giocabile con tutti i portatili testati con dettagli ultra.
Additional Benchmarks
Lowest Preset 1920x1080
111
Strange Brigade

Strange Brigade

2018
basso 1280x720
276  fps    + Confronta
medio 1920x1080
130  fps    + Confronta
alto 1920x1080
106  fps    + Confronta
ultra 1920x1080
93.1  fps    + Confronta
» Giocabile con tutti i portatili testati con dettagli ultra.
basso 1280x720
104.5  fps    + Confronta
medio 1920x1080
94.2  fps    + Confronta
alto 1920x1080
75.6  fps    + Confronta
ultra 1920x1080
63.6  fps    + Confronta
» Giocabile con tutti i portatili testati con dettagli ultra.
basso 1280x720
94.9 102 103 111 ~ 103 fps    + Confronta
medio 1920x1080
81.9 90 90.7 97.8 ~ 90 fps    + Confronta
alto 1920x1080
69.7 75.6 77.4 79.8 ~ 76 fps    + Confronta
4K 3840x2160
59.3 63.7 ~ 62 fps    + Confronta
» Giocabile con tutti i portatili testati con dettagli alto.
basso 1280x720
126 139 141 ~ 135 fps    + Confronta
medio 1920x1080
74.1 79 82.7 ~ 79 fps    + Confronta
alto 1920x1080
55.7 61.3 62.4 ~ 60 fps    + Confronta
QHD 2560x1440
43.6  fps    + Confronta
4K 3840x2160
24.9  fps    + Confronta
» Giocabile con tutti i portatili testati con dettagli alto.
Fortnite

Fortnite

2018
basso 1280x720
124  fps    + Confronta
medio 1920x1080
110.2  fps    + Confronta
alto 1920x1080
107.4  fps    + Confronta
ultra 1920x1080
81.2  fps    + Confronta
» Giocabile con tutti i portatili testati con dettagli ultra.
basso 1280x720
155  fps    + Confronta
medio 1920x1080
123  fps    + Confronta
alto 1920x1080
97  fps    + Confronta
ultra 1920x1080
76  fps    + Confronta
» Giocabile con tutti i portatili testati con dettagli ultra.
basso 1280x720
246.9  fps    + Confronta
medio 1920x1080
249.7  fps    + Confronta
alto 1920x1080
219.3  fps    + Confronta
» Giocabile con tutti i portatili testati con dettagli alto.
Additional Benchmarks
Performance 1920x1080
249.7
Overwatch

Overwatch

2016
basso 1280x720
299.9  fps    + Confronta
medio 1366x768
299.7  fps    + Confronta
alto 1920x1080
229.7  fps    + Confronta
ultra 1920x1080
146.9  fps    + Confronta
» Giocabile con tutti i portatili testati con dettagli ultra.
Additional Benchmarks
Medium (Render Scale 100 %) 2xAF FXAA 1920x1080
268.7
Doom

Doom

2016
basso 1280x720
125  fps    + Confronta
medio 1366x768
125  fps    + Confronta
alto 1920x1080
118.2  fps    + Confronta
ultra 1920x1080
111.5  fps    + Confronta
» Giocabile con tutti i portatili testati con dettagli ultra.
Additional Benchmarks
Medium Preset 1920x1080
119.4
basso 1280x768
100.4  fps    + Confronta
medio 1920x1080
72.8  fps    + Confronta
alto 1920x1080
66.8  fps    + Confronta
» Giocabile con tutti i portatili testati con dettagli alto.
basso 1024x768
60  fps    + Confronta
medio 1366x768
60  fps    + Confronta
alto 1920x1080
60  fps    + Confronta
ultra 1920x1080
59.2  fps    + Confronta
» Giocabile con tutti i portatili testati con dettagli ultra.
basso 1280x720
120.8 141 144 152 ~ 139 fps    + Confronta
medio 1366x768
115.1 129 130 140 ~ 129 fps    + Confronta
alto 1920x1080
107.8 119 120 131 ~ 119 fps    + Confronta
ultra 1920x1080
103.8 114 116 123 ~ 114 fps    + Confronta
4K 3840x2160
75.5 83.2 ~ 79 fps    + Confronta
» Giocabile con tutti i portatili testati con dettagli ultra.
basso 1024x768
232.2 235.1 284.8 310.8 ~ 266 fps    + Confronta
medio 1366x768
139.9 168.2 182.1 209.6 ~ 175 fps    + Confronta
alto 1920x1080
88.9 100.6 109 119 ~ 104 fps    + Confronta + 📈 Graph
ultra 1920x1080
51.2 56.1 58.4 62.9 ~ 57 fps    + Confronta + 📈 Graph
4K 3840x2160
24.9 45.5 ~ 35 fps    + Confronta
» Giocabile con tutti i portatili testati con dettagli ultra.
GTA V

GTA V

2015
basso 1024x768
173  fps    + Confronta
medio 1366x768
164  fps    + Confronta
alto 1920x1080
119  fps    + Confronta
ultra 1920x1080
68.2  fps    + Confronta
» Giocabile con tutti i portatili testati con dettagli ultra.
Additional Benchmarks
Normal/Off 4xAF 1920x1080
157
Lowest Settings possible 1920x1080
163
basso 1280x720
278.3  fps    + Confronta
medio 1366x768
252.3  fps    + Confronta
alto 1366x768
229.5  fps    + Confronta
ultra 1920x1080
126.2  fps    + Confronta
» Giocabile con tutti i portatili testati con dettagli ultra.
basso 1024x768
130.3  fps    + Confronta
alto 1366x768
67.3  fps    + Confronta
ultra 1920x1080
67.4  fps    + Confronta
» Giocabile con tutti i portatili testati con dettagli ultra.
bassomedioaltoultraQHD4K
Gears Tactics257.9120.476.456.918.9
Doom Eternal176.1108.795.793.3
Hunt Showdown194.296.375.7
Escape from Tarkov78.568.568.285.3
Star Wars Jedi Fallen Order92.98877.8
Need for Speed Heat103.288.782.279
GRID 2019157.4109.4103.473.533.1
Ghost Recon Breakpoint123827555
Borderlands 311789.561.948.3
Control183.767.150.4
F1 2019196137116101
Total War: Three Kingdoms201.1103.369.250.7
Anno 180081.581.661.436.5
The Division 2154927456
Dirt Rally 2.0276.7125.3105.360.524.4
Far Cry New Dawn105757063
Metro Exodus129.672.755.243.8
Apex Legends143.6142.8126.2116.6
Assassin´s Creed Odyssey97796545
Shadow of the Tomb Raider11887807020
Strange Brigade27613010693.1
Monster Hunter World104.594.275.663.6
X-Plane 11.11103907662
Final Fantasy XV Benchmark135796043.624.9
Fortnite124110.2107.481.2
Middle-earth: Shadow of War1551239776
Rocket League246.9249.7219.3
Overwatch299.9299.7229.7146.9
Doom125125118.2111.5
Ashes of the Singularity100.472.866.8
Metal Gear Solid V60606059.2
Dota 2 Reborn13912911911479
The Witcher 32661751045735
GTA V17316411968.2
BioShock Infinite278.3252.3229.5126.2
Guild Wars 2130.367.367.4
< 30 fps
< 60 fps
< 120 fps
≥ 120 fps


11
24


22
13

2
30
4

10
18
2

1

4
2
2

Per conoscere altri giochi che potrebbero essere utilizzabili e per una lista completa di tutti i giochi e delle schede grafiche visitate la nostra Gaming List

v1.26
log 17. 04:11:09

#0 no ids found in url (should be separated by "_") +0s ... 0s

#1 not redirecting to Ajax server +0s ... 0s

#2 did not recreate cache, as it is less than 5 days old! Created at Sat, 16 Mar 2024 05:38:32 +0100 +0.001s ... 0.001s

#3 no comparison url found in template nbc.compare_page_1 needed +0.052s ... 0.053s

#4 no comparison url found in template nbc.compare_page_1 needed +0s ... 0.054s

#5 no comparison url found in template nbc.compare_page_1 needed +0s ... 0.054s

#6 no comparison url found in template nbc.compare_page_1 needed +0s ... 0.054s

#7 no comparison url found in template nbc.compare_page_1 needed +0s ... 0.054s

#8 no comparison url found in template nbc.compare_page_1 needed +0s ... 0.055s

#9 no comparison url found in template nbc.compare_page_1 needed +0s ... 0.055s

#10 no comparison url found in template nbc.compare_page_1 needed +0s ... 0.055s

#11 no comparison url found in template nbc.compare_page_1 needed +0s ... 0.055s

#12 no comparison url found in template nbc.compare_page_1 needed +0s ... 0.056s

#13 no comparison url found in template nbc.compare_page_1 needed +0s ... 0.056s

#14 no comparison url found in template nbc.compare_page_1 needed +0s ... 0.057s

#15 no comparison url found in template nbc.compare_page_1 needed +0s ... 0.057s

#16 no comparison url found in template nbc.compare_page_1 needed +0s ... 0.057s

#17 no comparison url found in template nbc.compare_page_1 needed +0s ... 0.057s

#18 no comparison url found in template nbc.compare_page_1 needed +0s ... 0.057s

#19 no comparison url found in template nbc.compare_page_1 needed +0s ... 0.058s

#20 no comparison url found in template nbc.compare_page_1 needed +0s ... 0.058s

#21 composed specs +0s ... 0.058s

#22 did output specs +0s ... 0.058s

#23 start showIntegratedCPUs +0s ... 0.058s

#24 getting avg benchmarks for device 9631 +0.032s ... 0.09s

#25 got single benchmarks 9631 +0.036s ... 0.126s

#26 got avg benchmarks for devices +0s ... 0.126s

#27 min, max, avg, median took s +0.786s ... 0.912s

#28 before gaming benchmark output +0s ... 0.912s

#29 Got 191 rows for game benchmarks. +0.056s ... 0.969s

#30 composed SQL query for gamebenchmarks +0s ... 0.969s

#31 got data and put it in $dataArray +0.027s ... 0.995s

#32 benchmarks composed for output. +1.575s ... 2.57s

#33 no comparison url found in template nbc.compare_page_1 needed +0.004s ... 2.574s

#34 return log +0s ... 2.574s

Recensioni Notebook con NVIDIA GeForce RTX 2060 Max-Q la scheda grafica

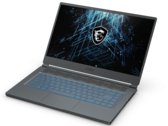
Recensione del laptop MSI Stealth 15M GeForce RTX: Grafica più veloce di Dell XPS 15, HP Spectre x360 o Asus ZenBook

Recensione del laptop MSI Stealth 15M GeForce RTX: Grafica più veloce di Dell XPS 15, HP Spectre x360 o Asus ZenBook

Le prestazioni grezze dello Stealth 15M A11SEK sono impressionanti considerando quanto è leggero e che gira su una CPU Core serie U. Sfortunatamente, la debole ...
Intel Core i7-1185G7 | NVIDIA GeForce RTX 2060 Max-Q | 15.60" | 1.7 kg
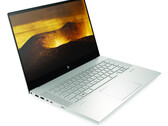
Recensione dell'Envy 15 Creator Core i7 2020: la risposta di HP all'Apple MacBook Pro
Recensione dell'Envy 15 Creator Core i7 2020: la risposta di HP all'Apple MacBook Pro

HP punta tutto su 4K AMOLED, grafica GeForce RTX più veloce e prezzi di partenza più economici per sfidare la popolarissima serie MacBook Pro e attirare più cre...
Intel Core i7-10750H | NVIDIA GeForce RTX 2060 Max-Q | 15.60" | 2 kg
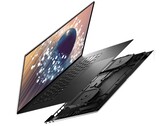
Recensione del Laptop Dell XPS 17 9700 Core i7: quasi un MacBook Pro 17
Recensione del Laptop Dell XPS 17 9700 Core i7: quasi un MacBook Pro 17

Dell può dominare il mercato dei 17 pollici nello stesso modo in cui ha conquistato quello dei 15 pollici? L'XPS 17 è sorprendentemente compatto con specifiche ...
Intel Core i7-10875H | NVIDIA GeForce RTX 2060 Max-Q | 17.00" | 2.5 kg
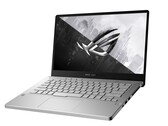
Recensione del Laptop Asus Zephyrus G14 Ryzen 9 GeForce RTX 2060 Max-Q: mette il Core i9 alle corde

Recensione del Laptop Asus Zephyrus G14 Ryzen 9 GeForce RTX 2060 Max-Q: mette il Core i9 alle corde

L'octa-core Ryzen 9 4900HS sarebbe impressionante su qualsiasi portatile da 15,6 pollici o 17,3 pollici da gioco, ma vederlo funzionare così bene in un così pic...
AMD Ryzen 9 4900HS | NVIDIA GeForce RTX 2060 Max-Q | 14.00" | 1.6 kg

Asus ROG Zephyrus G15 GA502IV-PH96: AMD Ryzen 9 4900HS, 15.60", 2.1 kg
  Recensioni esterne » Asus ROG Zephyrus G15 GA502IV-PH96

HP Pavilion Gaming 16-a0043ns: Intel Core i7-10750H, 16.10", 2.4 kg
  Recensioni esterne » HP Pavilion Gaming 16-a0043ns

HP Envy 15-ep0041ur: Intel Core i7-10750H, 15.60", 2.1 kg
  Recensioni esterne » HP Envy 15-ep0041ur

HP Envy 15-ep0175nd: Intel Core i7-10750H, 15.60", 2.1 kg
  Recensioni esterne » HP Envy 15-ep0175nd

Asus ROG Zephyrus G15 GA502IV-HN042: AMD Ryzen 9 4900HS, 15.60", 2.1 kg
  Recensioni esterne » Asus ROG Zephyrus G15 GA502IV-HN042

HP Pavilion Gaming 16-a0042ns: Intel Core i5-10300H, 16.10", 2.4 kg
  Recensioni esterne » HP Pavilion Gaming 16-a0042ns

HP Pavilion Gaming 16-a0033ns: Intel Core i7-10750H, 16.10"
  Recensioni esterne » HP Pavilion Gaming 16-a0033ns

HP Envy 15-ep008n: Intel Core i7-10750H, 15.60", 2.2 kg
  Recensioni esterne » HP Envy 15-ep008n

HP Envy 15-ep0016tx: Intel Core i7-10750H, 15.60", 2.2 kg
  Recensioni esterne » HP Envy 15-ep0016tx

HP Envy 15-ep0015nl: Intel Core i7-10750H, 15.60", 2.2 kg
  Recensioni esterne » HP Envy 15-ep0015nl

HP Pavilion Gaming 16-A0029NS: Intel Core i7-10750H, 16.10", 2.4 kg
  Recensioni esterne » HP Pavilion Gaming 16-A0029NS

HP Envy 15-ep0190nd: Intel Core i9-10885H, 15.60", 2.2 kg
  Recensioni esterne » HP Envy 15-ep0190nd

Asus Zephyrus G14 GA401IVC-HA275T (ACRNM RMT01): AMD Ryzen 9 4900HS, 15.60", 1.7 kg
  Recensioni esterne » Asus Zephyrus G14 GA401IVC-HA275T (ACRNM RMT01)

HP Gaming Pavilion 15-dk1064tx: Intel Core i5-10300H, 15.60", 2.2 kg
  Recensioni esterne » HP Gaming Pavilion 15-dk1064tx

Dell XPS 17 9700-C9T5T: Intel Core i9-10885H, 17.30", 2.5 kg
  Recensioni esterne » Dell XPS 17 9700-C9T5T

HP Envy 15-ep0098nr: Intel Core i7-10750H, 15.60", 2 kg
  Recensioni esterne » HP Envy 15-ep0098nr

HP Gaming Pavilion 15-dk1003ns: Intel Core i7-10750H, 15.60", 2.2 kg
  Recensioni esterne » HP Gaming Pavilion 15-dk1003ns

Dell XPS 17 9700 Core i7 RTX 2060 Max-Q: Intel Core i7-10875H, 17.00", 2.5 kg
  Recensioni esterne » Dell XPS 17 9700 Core i7 RTX 2060 Max-Q

Asus ROG Zephyrus G15 GA502IV-HN020: AMD Ryzen 7 4800HS, 15.60", 2.1 kg
  Recensioni esterne » Asus Zephyrus G15 GA502IV-HN020

Asus Zephyrus G14 GA401IV-HE003T: AMD Ryzen 7 4800HS, 14.00", 1.6 kg
  Recensioni esterne » Asus Zephyrus G14 GA401IV-HE003T

Asus Zephyrus G14 GA401IV-HE253T: AMD Ryzen 7 4800HS, 14.00", 1.7 kg
  Recensioni esterne » Asus Zephyrus G14 GA401IV-HE253T

Asus Zephyrus G14 GA401IV-HA116T: AMD Ryzen 9 4900HS, 14.00", 1.7 kg
  Recensioni esterne » Asus Zephyrus G14 GA401IV-HA116T

Asus Zephyrus G14 GA401IV-HE022: AMD Ryzen 7 4800HS, 14.00", 1.6 kg
  Recensioni esterne » Asus Zephyrus G14 GA401IV-HE022

Razer Blade 15 Base Model 2020, i7-10750H, RTX 2060 Max-Q: Intel Core i7-10750H, 15.60", 2.1 kg
  Recensioni esterne » Razer Blade 15 Base Model 2020, i7-10750H, RTX 2060 Max-Q

Asus ProArt StudioBook 17 H700GV RTX 2060, Xeon E-2276M: Intel Xeon E-2276M, 17.00", 2.4 kg
  Recensioni esterne » Asus ProArt StudioBook 17 H700GV RTX 2060, Xeon E-2276M

Asus Zephyrus G14 GA401IV: AMD Ryzen 9 4900HS, 14.00", 1.6 kg
  Recensioni esterne » Asus Zephyrus G14 GA401IV

Lenovo Legion Y540-15IRH-81SX00CKSP: Intel Core i7-9750H, 15.60", 2.3 kg
  Recensioni esterne » Lenovo Legion Y540-15IRH-81SX00CKSP

MSI Stealth 15M A11SEK: Intel Core i7-1185G7, 15.60", 1.7 kg
   » L'MSI Stealth 15M è la prova che i portatili gaming con CPU Tiger Lake Core U da 15 W a 25 W funzionano bene.

Please share our article, every link counts!

Classe 0

Arc A380

Classe 1

GeForce RTX 2080 Super Mobile

Classe 2

M1 Max 32-Core GPU *
GeForce RTX 2070 Super Mobile
M1 Max 24-Core GPU *
Radeon RX 5700M *
M1 Pro 16-Core GPU *
Radeon PRO W6600M *
GeForce RTX 2070 Super Max-Q
M1 Pro 14-Core GPU *
Quadro P4200
Quadro P5000 Max-Q *
GeForce RTX 3050 4GB Laptop GPU
Quadro P4000 Max-Q
Radeon RX 580X (Laptop) *
Radeon RX 580 (Laptop)
Radeon Pro 5300M
Radeon RX 5300M
Quadro P3000 Max-Q *
Radeon Pro WX 7100 *
Radeon RX 570X (Laptop) *
Radeon RX 570 (Laptop) *
Radeon RX 470 (Laptop) *

Classe 3

GeForce GTX 1050 Ti Mobile
Radeon 680M
Quadro P2000 Max-Q
Radeon R9 M395X
GeForce GTX 1050 Ti Max-Q *
WX Vega M GL
Radeon R9 M485X
GeForce GTX 1050 Max-Q *
Radeon 660M
Radeon RX 560X (Laptop)
Radeon RX 560 (Laptop)
Radeon Pro 560X
Radeon Pro 560
Radeon Pro 460
Radeon Pro WX 4130 *
Quadro P620 *
Radeon RX 550X (Laptop)
Radeon Pro 555X
Radeon Pro 555
Radeon Pro 455
Quadro P600
Radeon RX 540X *
Radeon Pro WX 2100 *
Radeon Pro WX 3100 *
Radeon Pro 450
Radeon 630
Radeon 540X *
Quadro P520
Quadro P500 *
Iris Plus Graphics G7 (Ice Lake 64 EU) *
Vega 10 *
Iris Pro Graphics 580
Vega 9
FirePro W5130M
UHD Graphics Xe G4 48EUs *
UHD Graphics 32EUs
UHD Graphics Xe 32EUs (Tiger Lake-H) *
UHD Graphics 750
Vega 7
Radeon R7 M465
Vega 8
Iris Plus Graphics G4 (Ice Lake 48 EU)
Quadro M600M
FirePro W4190M
Radeon R7 M445
UHD Graphics 24EUs (Alder Lake-N) *
Radeon R7 M340
Radeon 610M *
UHD Graphics G1 (Ice Lake 32 EU)
UHD Graphics Xe 16EUs (Tiger Lake-H) *
Radeon R5 (Bristol Ridge)
Adreno 690 *
Adreno 685 *
Adreno 680 *

Classe 4

UHD Graphics 730
Radeon R5 M315 *
Radeon R5 M420 *
UHD Graphics 617
UHD Graphics 615
Radeon R4 (Stoney Ridge)
Radeon R2 (Stoney Ridge)
HD Graphics (Broadwell)

Classe 5

Posizione approssimativa dell'adattatore grafico

> Recensioni e prove di notebook, tablets e smartphones > Info Techniche / Tips > Confronto delle schede video > NVIDIA > NVIDIA GeForce RTX 2060 Max-Q
Klaus Hinum, 2020-04-13 (Update: 2020-04-13)