Recensioni Notebook con Intel UHD Graphics 600 la scheda grafica
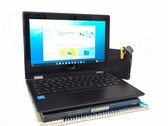
Recensione dell'Higole PC Stick: Il PC stick più piccolo del mondo ha un Intel Celeron J4125, 8 GB di RAM e un SSD da 128 GB
I PC non devono sempre essere grandi e ingombranti. Molti mini PC che abbiamo testato in precedenza lo hanno dimostrato. Il produttore di Higole PC Stick ha fatto un ulteriore passo avanti, riuscendo a inserire l'intero hardware del PC in un case che ricorda una chiavetta USB sovradimensionata. Abbiamo dato un'occhiata più da vicino al dispositivo e alle capacità del suo Intel Celeron J4125.
Intel Celeron J4125, UHD Graphics 600, 108 grTest del GeoFlex 140 2-in-1 Geo Computers: Un convertibile a circa 160 dollari
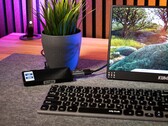
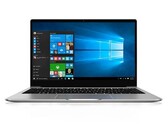
Il GeoFlex 140 è un convertibile che viene offerto a meno di 200 euro (~$218) in alcuni eventi commerciali. Non si ottengono molte prestazioni per questo prezzo, ma si ottiene un portatile 2-in-1 con licenza Windows 11 Home e un anno di Microsoft Office 365. Se si ottengono entrambi tramite Microsoft, costano già più del convertibile.
Intel Celeron N4020, UHD Graphics 600, 14.1", 2 kgRecensione GMK NucBox 3: HTPC senza ventola con Windows 11
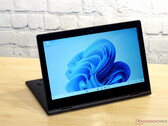
Il Celeron J4125 potrebbe essere un po' vecchio, ma i suoi bassi requisiti energetici possono consentire sia un profilo del telaio più sottile che un design senza ventola per essere attraente per gli utenti HTPC. Sfortunatamente, le prestazioni non sono dove vorremmo che fossero anche per carichi HTPC poco esigenti.
Intel Celeron J4125, UHD Graphics 600, 410 grAcer Chromebook Spin 511 R752T in recensione - Il portatile 2-in-1 per la classe
L'Acer Chromebook Spin è uno dei dispositivi digitali che i bambini austriaci in età scolare avranno a partire dall'autunno 2021. Il portatile è economico e offre una prestazione equilibrata. La domanda più pressante che si pone nel test è: Un portatile con Chrome OS può sostituire un computer con Windows?
Intel Celeron N4120, UHD Graphics 600, 11.6", 1.2 kgRecensione del computer portatile Blackview AceBook 1: Buono per carichi bassi ma non molto altro
L'AceBook 1 attirerà molte persone con il suo prezzo inferiore ai 400 dollari, ma ci sono un mucchio di avvertimenti di cui gli acquirenti dovrebbero essere consapevoli. Questo portatile Celeron raffreddato passivamente può portarvi solo fino a un certo punto prima che le cose rallentino.
Intel Celeron N4120, UHD Graphics 600, 14", 1.3 kgAC6-M Mini-PC: Intel Celeron J4125, 0.00"
recensione » La recensione del mini PC AC6-M di Newsmay Technology: Un mini PC completo per l'ufficio!
Beelink GK Mini: Intel Celeron J4125, 0.3 kg
recensione » Recensione del Mini PC Beelink GK: HTPC pronto all'uso
Zotac ZBOX EDGE CI341: Intel Celeron N4100, 0.00"
recensione » Recensione dell'economico mini PC Zotac ZBOX edge
Teclast F7 Air: Intel Celeron N4120, 14.00", 1.2 kg
recensione » Recensione del portatile Teclast F7 Air
Chuwi LarkBook CWI509: Intel Celeron N4120, 13.30", 1.1 kg
recensione » Recensione del laptop Chuwi LarkBook: Buon aspetto, Scarse prestazioni
Jumper Tech Ez Book X3 Air: Intel Celeron N4100, 13.30", 1.1 kg
recensione » Recensione del Laptop Jumper Tech EZbook X3 Air: design attraente e prezzo ragionevole
GMK NucBox K1: Intel Celeron J4125, 0.1 kg
recensione » Recensione del Mini PC GMK NucBox K1 vs. Chuwi LarkBox: figli dello stesso padre
Chuwi GemiBook CWI528: Intel Celeron J4115, 13.00", 1.3 kg
recensione » Recensione del Laptop Chuwi GemiBook CWI528: copertura completa sRGB per $300 USD
Chuwi LarkBox 4K Mini PC: Intel Celeron J4115, 0.1 kg
recensione » Recensione del Chuwi LarkBox Celeron J4115: un Mini PC 4K così piccolo che è più leggero del suo alimentatore.
Lenovo IdeaPad Flex 3 11IGL05: Intel Celeron N4020, 11.60", 1.1 kg
recensione » Recensione del Laptop Lenovo IdeaPad Flex 3 11IGL05: convertibile silenzioso, efficiente e lento
Chuwi Hi10 X: Intel Celeron N4100, 10.10", 0.6 kg
recensione » Recensione del Convertibile Chuwi Hi10 X: Chassis in metallo per $230 USD
BMAX MaxBook Y11 H1M6: Intel Celeron N4100, 11.60", 1 kg
recensione » Recensione del Convertibile BMAX MaxBook Y11 H1M6
Lenovo Chromebook S340-14T 81V30002GE: Intel Celeron N4000, 14.00", 1.4 kg
recensione » Recensione del Lenovo Chromebook S340-14T: un semplice Chromebook con un touchscreen con riflessi limitati
Chuwi UBook CWI509: Intel Celeron N4100, 11.60", 0.8 kg
recensione » Recensione del Tablet Chuwi UBook CWI509: un aspirante Surface Go
Chuwi LapBook Pro: Intel Celeron N4100, 14.00", 1.4 kg
recensione » Recensione del Computer portatile Chuwi LapBook Pro: un economico dispositivo da 14" con una buona autonomia e adeguata gamma cromatica
Chuwi MiniBook CWI526: Intel Celeron N4100, 8.00", 0.7 kg
recensione » Recensione del Netbook Chuwi MiniBook
Lenovo Tablet 10-20L3000KGE: Intel Celeron N4100, 10.10", 0.7 kg
recensione » Recensione del Tablet Lenovo Tablet 10 (Celeron N4100, eMMC, LTE, WUXGA)
Chuwi LapBook SE: Intel Celeron N4100, 13.30", 1.4 kg
recensione » Recensione del portatile Chuwi LapBook SE
Lenovo IdeaPad 330-15IGM: Intel Celeron N4100, 15.60", 2 kg
recensione » Recensione del Portatile Lenovo IdeaPad 330-15IGM (Celeron N4100)
Chuwi GBox CWI560: Intel Celeron N4100, 0.6 kg
recensione » Recensione del Mini PC Chuwi GBox CWI560 (Celeron N4100)
Intel NUC7CJYH: Intel Celeron J4005, 0.00", 0.6 kg
recensione » Recensione del Mini PC Intel NUC Kit NUC7CJYH (Celeron J4005, UHD 600)
Lenovo Flex 6-11IGM: Intel Celeron N4000, 11.60", 1.3 kg
recensione » Recensione del Convertibile Lenovo Flex 6 11 (Celeron N4000)
Asus Chromebook C424MA: Intel Celeron N4020, 14.00", 1.5 kg
Recensioni esterne » Asus Chromebook C424MA
HP Stream 11-ak0013ns: Intel Celeron N4120, 11.60", 1.1 kg
Recensioni esterne » HP Stream 11-ak0013ns
HP Stream 14s-dq0024ns: Intel Celeron N4120, 14.00", 1.5 kg
Recensioni esterne » HP Stream 14s-dq0024ns
Chuwi MiniBook, Celeron J4125: Intel Celeron J4125, 13.00", 1.3 kg
Recensioni esterne » Chuwi MiniBook, Celeron J4125
Asus VivoBook 14 E410MA-EK1987WS: Intel Celeron N4020, 14.00", 1.3 kg
Recensioni esterne » Asus VivoBook 14 E410MA-EK1987WS
Acer Aspire 3 A315-34-C8K1: Intel Celeron N4000, 15.60", 1.9 kg
Recensioni esterne » Acer Aspire 3 A315-34-C8K1
Acer Chromebook Spin 311 CP311-2H-C7QD: Intel Celeron N4000, 11.60", 1.2 kg
Recensioni esterne » Acer Chromebook Spin 311 CP311-2H-C7QD
Acer Chromebook 311 C733-C6M8: Intel Celeron N4000, 11.00", 1.3 kg
Recensioni esterne » Acer Chromebook 311 C733-C6M8
Gateway GWNC21524-RD: Intel Celeron N4020, 15.60", 1.6 kg
Recensioni esterne » Gateway GWNC21524-RD
Asus VivoBook 14 E410MA-EK007WS: Intel Celeron N4020, 14.00", 1.3 kg
Recensioni esterne » Asus VivoBook 14 E410MA-EK007WS
Acer Chromebook 315 CB315-3H-C6UR: Intel Celeron N4120, 15.60", 1.6 kg
Recensioni esterne » Acer Chromebook 315 CB315-3H-C6UR
HP ChromeBook 14a-na0014ns: Intel Celeron N4020, 14.00", 1.5 kg
Recensioni esterne » HP ChromeBook 14a-na0014ns
Acer Travelmate B3 TMB311-31-C369: Intel Celeron N4120, 11.60", 1.4 kg
Recensioni esterne » Acer Travelmate B3 TMB311-31-C369
HP 15s-fq0011ns: Intel Celeron N4020, 15.60", 1.7 kg
Recensioni esterne » HP 15s-fq0011ns
Microsoft Surface Laptop SE, Celeron N4120: Intel Celeron N4120, 11.60", 1.1 kg
Recensioni esterne » Microsoft Surface Laptop SE, Celeron N4120
Asus VivoBook 14 E410MA-EK007TS: Intel Celeron N4020, 14.00", 1.3 kg
Recensioni esterne » Asus VivoBook 14 E410MA-EK007TS
HP Stream 14s-dq0009ns: Intel Celeron N4020, 14.00", 1.5 kg
Recensioni esterne » HP Stream 14s-dq0009ns
HP Stream 14s-dq0014ns: Intel Celeron N4020, 14.00", 1.5 kg
Recensioni esterne » HP Stream 14s-dq0014ns
HP Stream 14s-dq0008ns: Intel Celeron N4020, 14.00", 1.5 kg
Recensioni esterne » HP Stream 14s-dq0008ns
Asus Chromebook Flip C214MA-BU0410: Intel Celeron N4020, 11.60", 1.2 kg
Recensioni esterne » Asus Chromebook Flip C214MA-BU0410
HP Chromebook 14a-na0023nr: Intel Celeron N4020, 14.00", 1.5 kg
Recensioni esterne » HP Chromebook 14a-na0023nr
Asus Chromebook CX1101: Intel Celeron N4020, 11.60", 1.2 kg
Recensioni esterne » Asus Chromebook CX1101
Alldocube iWork 20 Pro: Intel Celeron N4120, 10.50", 0.6 kg
Recensioni esterne » Alldocube iWork 20 Pro
Lenovo V14 IGL-82C2001QGE: Intel Celeron N4020, 14.00", 1.6 kg
Recensioni esterne » Lenovo V14 IGL-82C2001QGE
HP Chromebook 14a-na0006ns: Intel Celeron N4020, 14.00", 1.5 kg
Recensioni esterne » HP Chromebook 14a-na0006ns
HP Chromebook 11 G8 EE-1A762UT: Intel Celeron N4020, 11.60", 1.3 kg
Recensioni esterne » HP Chromebook 11 G8 EE-1A762UT
HP Chromebook x360 14a-ca0003ns: Intel Celeron N4020, 14.00", 1.5 kg
Recensioni esterne » HP Chromebook x360 14a-ca0003ns
Acer TravelMate B3 TMB311-31-C1VR: Intel Celeron N4120, 11.60", 1.4 kg
Recensioni esterne » Acer TravelMate B3 TMB311-31-C1VR
Acer Chromebook Spin 311 CP311-2H-C95K: Intel Celeron N4120, 11.60", 1.2 kg
Recensioni esterne » Acer Chromebook Spin 311 CP311-2H-C95K
HP Stream 14-dq0010nr: Intel Celeron N4020, 14.00", 1.5 kg
Recensioni esterne » HP Stream 14-dq0010nr
HP Chromebook 14a-na0004ns: Intel Celeron N4020, 14.00", 1.5 kg
Recensioni esterne » HP Chromebook 14a-na0004ns
HP Chromebook 14a-na0005ns: Intel Celeron N4020, 14.00", 1.5 kg
Recensioni esterne » HP Chromebook 14a-na0005ns
Asus VivoBook 15 F515MA-BR040: Intel Celeron N4020, 15.60", 1.8 kg
Recensioni esterne » Asus VivoBook 15 F515MA-BR040
HP Stream 11-ak0004ns: Intel Celeron N4020, 11.60", 1.1 kg
Recensioni esterne » HP Stream 11-ak0004ns
Lenovo 500e Chromebook G2: Intel Celeron N4100, 11.60", 1.3 kg
Recensioni esterne » Lenovo 500e Chromebook G2
Lenovo 300e G2-81M9006EGE: Intel Celeron N4120, 11.60", 1.2 kg
Recensioni esterne » Lenovo 300e G2-81M9006EGE
Asus Chromebook Flip C214 C214MA-Q1R-CB: Intel Celeron N4020, 11.60", 1.2 kg
Recensioni esterne » Asus Chromebook Flip C214 C214MA-Q1R-CB
Dynabook E10-S: Intel Celeron N4020, 11.60", 1.1 kg
Recensioni esterne » Dynabook E10-S
Asus E510MA-EJ133T: Intel Celeron N4020, 15.60", 1.6 kg
Recensioni esterne » Asus E510MA-EJ133T
Acer Spin 1 SP111-33-C690: Intel Celeron N4020, 11.60", 1.3 kg
Recensioni esterne » Acer Spin 1 SP111-33-C690
HP Chromebook x360 12b-ca0001ns: Intel Celeron N4020, 12.00", 1.4 kg
Recensioni esterne » HP Chromebook x360 12b-ca0001ns
Asus L410MA-DB02: Intel Celeron N4020, 14.00", 1.3 kg
Recensioni esterne » Asus L410MA-DB02
Acer Chromebook 14 CB314-1H-C7PS: Intel Celeron N4020, 14.00", 1.5 kg
Recensioni esterne » Acer Chromebook 14 CB314-1H-C7PS
HP Chromebook x360 14b-ca0001ns: Intel Celeron N4020, 14.00", 1.6 kg
Recensioni esterne » HP Chromebook x360 14b-ca0001ns
Lenovo IdeaPad 3 15IGL05-81WQ002QGE: Intel Celeron N4020, 15.60", 1.7 kg
Recensioni esterne » Lenovo IdeaPad 3 15IGL05-81WQ002QGE
Lenovo IdeaPad 1 14IGL05-81VU0079US: Intel Celeron N4020, 14.00", 1.4 kg
Recensioni esterne » Lenovo IdeaPad 1 14IGL05-81VU0079US
HP Chromebook 14a-na0021nr: Intel Celeron N4000, 14.00", 1.5 kg
Recensioni esterne » HP Chromebook 14a-na0021nr
Asus L510MA-DS04: Intel Celeron N4020, 15.60", 1.6 kg
Recensioni esterne » Asus L510MA-DS04
Samsung Chromebook 4 XE310XBA-KA1US: Intel Celeron N4020, 11.60", 1.2 kg
Recensioni esterne » Samsung Chromebook 4 XE310XBA-KA1US
Chuwi GemiBook CWI528: Intel Celeron J4115, 13.00", 1.3 kg
Recensioni esterne » Chuwi GemiBook CWI528
Asus VivoBook L203MA-DS04: Intel Celeron N4000, 11.60", 1.1 kg
Recensioni esterne » Asus VivoBook L203MA-DS04
Prestigio Ecliptica 116 C3: Intel Celeron N4100, 11.60", 1.4 kg
Recensioni esterne » Prestigio Ecliptica 116 C3
Acer Aspire 1 A115-31-C2Y3: Intel Celeron N4020, 15.60", 1.9 kg
Recensioni esterne » Acer Aspire 1 A115-31-C2Y3
Lenovo IdeaPad 1 11IGL05-81VT003ASP: Intel Celeron N4020, 11.60", 1.2 kg
Recensioni esterne » Lenovo IdeaPad 1 11IGL05-81VT003ASP
Acer Chromebook 311 C733-C37P: Intel Celeron N4000, 11.60", 1.3 kg
Recensioni esterne » Acer Chromebook 311 C733-C37P
Acer Chromebook Spin 511 R752T-C3M5: Intel Celeron N4020, 11.60", 1.3 kg
Recensioni esterne » Acer Chromebook Spin 511 R752T-C3M5
Dell Chromebook 11 3100-0JWC5: Intel Celeron N4020, 11.60", 1.3 kg
Recensioni esterne » Dell Chromebook 11 3100-0JWC5
HP Stream 11-ak0005ns: Intel Celeron N4020, 11.60"
Recensioni esterne » HP Stream 11-ak0005ns
HP Stream 11-ak0003ns: Intel Celeron N4020, 11.60"
Recensioni esterne » HP Stream 11-ak0003ns
HP Chromebook x360 14a-ca0102nd: Intel Celeron N4020, 14.00", 1.5 kg
Recensioni esterne » HP Chromebook x360 14a-ca0102nd
HP 240 G8: Intel Celeron N4020, 14.00", 1.5 kg
Recensioni esterne » HP 240 G8
Acer Chromebook 315 CB315-3H-C7JF: Intel Celeron N4020, 15.60", 1.7 kg
Recensioni esterne » Acer Chromebook 315 CB315-3H-C7JF
Samsung Chromebook 4 11.6 inch XE310XBA-K01US: Intel Celeron N4000, 11.60", 1.2 kg
Recensioni esterne » Samsung Chromebook 4 11.6 inch XE310XBA-K01US
Acer Chromebook 11 CB311-9H-C4PP: Intel Celeron N4000, 11.60", 1.6 kg
Recensioni esterne » Acer Chromebook 11 CB311-9H-C4PP
Acer Chromebook 315 CB315-3H-C5JS: Intel Celeron N4020, 15.60", 1.6 kg
Recensioni esterne » Acer Chromebook 315 CB315-3H-C5JS
Asus VivoBook 14 E410MA-EK018TS: Intel Celeron N4020, 14.00", 1.3 kg
Recensioni esterne » Asus VivoBook 14 E410MA-EK018TS
Lenovo IdeaPad Flex 3 11IGL05: Intel Celeron N4020, 11.60", 1.1 kg
Recensioni esterne » Lenovo IdeaPad Flex 3 11IGL05
Chuwi LarkBook CWI509: Intel Celeron N4120, 13.30", 1.1 kg
Recensioni esterne » Chuwi LarkBook CWI509
Acer Chromebook Spin 311 CP311-2H-C679: Intel Celeron N4000, 11.60", 1.2 kg
Recensioni esterne » Acer Chromebook Spin 311 CP311-2H-C679
Samsung Chromebook 4+ XE350XBA-K03US: Intel Celeron N4000, 15.60", 1.7 kg
Recensioni esterne » Samsung Chromebook 4+ XE350XBA-K03US
Asus L406MA-WH02: Intel Celeron N4000, 14.00", 1.3 kg
Recensioni esterne » Asus L406MA-WH02
Chuwi Hi10 XR: Intel Celeron N4120, 10.10", 0.6 kg
Recensioni esterne » Chuwi Hi10 XR
Asus Vivobook 12 E210MA-GJ001TS: Intel Celeron N4020, 11.60", 1.1 kg
Recensioni esterne » Asus Vivobook 12 E210MA-GJ001TS
Lenovo IdeaPad 3 14IGL05-81WH0000MJ: Intel Celeron N4020, 14.00", 1.5 kg
Recensioni esterne » Lenovo IdeaPad 3 14IGL05-81WH0000MJ
Lenovo IdeaPad Duet 3 10IGL5-82AT002YSP: Intel Celeron N4020, 10.30", 0.9 kg
Recensioni esterne » Lenovo IdeaPad Duet 3 10IGL5-82AT002YSP
Asus Vivobook 12 L210MA-GJ050TS: Intel Celeron N4020, 11.60", 1.1 kg
Recensioni esterne » Asus Vivobook 12 L210MA-GJ050TS
Asus VivoBook 14 A416: Intel Celeron N4020, 14.00", 1.6 kg
Recensioni esterne » Asus VivoBook 14 A416
Chuwi GemiBook Pro: Intel Celeron J4125, 14.00", 1.5 kg
Recensioni esterne » Chuwi GemiBook Pro
Asus Chromebook C204MA-GJ0114: Intel Celeron N4000, 11.60", 1.2 kg
Recensioni esterne » Asus Chromebook C204MA-GJ0114
Acer Chromebook 314 CB314-1H-C75Z: Intel Celeron N4020, 14.00", 1.5 kg
Recensioni esterne » Acer Chromebook 314 CB314-1H-C75Z
Lenovo IdeaPad Duet 3 10IGL5-82AT002VGE: Intel Celeron N4020, 10.30", 0.6 kg
Recensioni esterne » Lenovo IdeaPad Duet 3 10IGL5-82AT002VGE
Asus VivoBook 14 E410MA-EK367TS: Intel Celeron N4020, 14.00", 1.3 kg
Recensioni esterne » Asus VivoBook 14 E410MA-EK367TS
Jumper EZbook X3 Air: Intel Celeron N4100, 13.30", 1.1 kg
Recensioni esterne » Jumper EZbook X3 Air
Lenovo IdeaPad Flex 3 Chromebook 11IGL05: Intel Celeron N4020, 11.60", 1.2 kg
Recensioni esterne » Lenovo IdeaPad Flex 3 Chromebook 11IGL05
Samsung Chromebook 4+ 15.6 inch XE350XBA-K01US: Intel Celeron N4000, 15.60", 1.7 kg
Recensioni esterne » Samsung Chromebook 4+ 15.6 inch XE350XBA-K01US
Acer Aspire 3 A317-32-C20M: Intel Celeron N4000, 17.30", 2.7 kg
Recensioni esterne » Acer Aspire 3 A317-32-C20M
Lenovo IdeaPad 3 CB 14IGL05-82C10004US: Intel Celeron N4020, 14.00", 1.4 kg
Recensioni esterne » Lenovo IdeaPad 3 CB 14IGL05-82C10004US
Chuwi HeroBook Pro: Intel Celeron N4000, 14.10", 1.4 kg
Recensioni esterne » Chuwi HeroBook Pro
Lenovo IdeaPad 3 11IGL05 (Chromebook 3 11): Intel Celeron N4020, 11.60", 1.1 kg
Recensioni esterne » Lenovo IdeaPad 3 11IGL05
Acer Chromebook 314 CB314-1H-C0YY: Intel Celeron N4020, 14.00", 1.5 kg
Recensioni esterne » Acer Chromebook 314 CB314-1H-C0YY
HP 15-da0263ns: Intel Celeron N4000, 15.60", 1.8 kg
Recensioni esterne » HP 15-da0263ns
Acer Chromebook Spin 11 CP311-2H-C7BG: Intel Celeron N4100, 11.60", 1.2 kg
Recensioni esterne » Acer Chromebook Spin 11 CP311-2H-C7BG
Lenovo Chromebook C340-11-81TA0008MH: Intel Celeron N4000, 11.60", 1.2 kg
Recensioni esterne » Lenovo Chromebook C340-11-81TA0008MH
Acer Aspire 3 A317-32-C5QZ: Intel Celeron N4000, 17.30", 2.7 kg
Recensioni esterne » Acer Aspire 3 A317-32-C5QZ
Acer Chromebook 11 CB311-9HT-C783: Intel Celeron N4100, 11.60", 1.1 kg
Recensioni esterne » Acer Chromebook 11 CB311-9HT-C783
Acer Chromebook 314 CB314-1H-C54R: Intel Celeron N4000, 14.00", 1.7 kg
Recensioni esterne » Acer Chromebook 314 CB314-1H-C54R
HP Chromebook X360 12b-ca0002no: Intel Celeron N4000, 12.00", 1.4 kg
Recensioni esterne » HP Chromebook X360 12b-ca0002no
HP Chromebook x360 12b-ca0005nf: Intel Celeron N4000, 12.00", 1.4 kg
Recensioni esterne » HP Chromebook x360 12b-ca0005nf
Medion Akoya E4251-MD61555: Intel Celeron N4000, 14.00", 1.3 kg
Recensioni esterne » Medion Akoya E4251-MD61555
HP 15-da0177ns: Intel Celeron N4000, 15.60", 2.1 kg
Recensioni esterne » HP 15-da0177ns
Lenovo Chromebook C340-11-81TA000GGE: Intel Celeron N4000, 11.60", 1.2 kg
Recensioni esterne » Lenovo Chromebook C340-11-81TA000GGE
Lenovo Ideapad S130-14IGM: Intel Celeron N4000, 14.00", 1.5 kg
Recensioni esterne » Lenovo Ideapad S130-14IGM
Medion Akoya E4271 MD61263: Intel Celeron N4000, 14.00", 1.7 kg
Recensioni esterne » Medion Akoya E4271 MD61263
Asus R540MA-GQ757: Intel Celeron N4000, 15.60", 1.9 kg
Recensioni esterne » Asus R540MA-GQ757
Lenovo 300e Chromebook G2-81MB0003US: Intel Celeron N4000, 11.60", 1.3 kg
Recensioni esterne » Lenovo 300e Chromebook G2-81MB0003US
HP 14-cf0005ns: Intel Celeron N4000, 14.00", 1.5 kg
Recensioni esterne » HP 14-cf0005ns
Chuwi MiniBook CWI526: Intel Celeron N4100, 8.00", 0.7 kg
Recensioni esterne » Chuwi MiniBook CWI526
Dell Chromebook 3100-6VTNP 2-in-1: Intel Celeron N4000, 11.60", 1.4 kg
Recensioni esterne » Dell Chromebook 3100-6VTNP 2-in-1
Asus Chromebook Flip C214MA-YS02T: Intel Celeron N4000, 11.60", 1.3 kg
Recensioni esterne » Asus Chromebook Flip C214MA-YS02T
Acer Swift 1 SF114-32-C73V: Intel Celeron N4000, 14.00", 1.4 kg
Recensioni esterne » Acer Swift 1 SF114-32-C73V
Lenovo IdeaPad 330-15IGM-81D1003TUS: Intel Celeron N4100, 15.60", 2 kg
Recensioni esterne » Lenovo IdeaPad 330-15IGM-81D1003TUS
Lenovo Ideapad D330-10IGM-81H3000VSP: Intel Celeron N4000, 10.10", 1.1 kg
Recensioni esterne » Lenovo Ideapad D330-10IGM-81H3000VSP
Lenovo Ideapad D330-10IGM-81MD0006GE: Intel Celeron N4000, 10.10", 0.6 kg
Recensioni esterne » Lenovo Ideapad D330-10IGM-81MD0006GE
Asus X507MA-BR072T: Intel Celeron N4000, 15.60", 1.8 kg
Recensioni esterne » Asus X507MA-BR072T
HP 250 G6 4WV09EA: Intel Celeron N4000, 15.60", 1.9 kg
Recensioni esterne » HP 250 G6 4WV09EA
Samsung NoteBook Flash NP530XBB-K01US: Intel Celeron N4000, 13.30", 1.4 kg
Recensioni esterne » Samsung NoteBook Flash NP530XBB-K01US
Acer Aspire 1 A114-32-C1B2: Intel Celeron N4000, 14.00", 1.7 kg
Recensioni esterne » Acer Aspire 1 A114-32-C1B2
Lenovo Yoga 330-11IGM-81A6001CSP: Intel Celeron N4000, 11.60", 1.3 kg
Recensioni esterne » Lenovo Yoga 330-11IGM-81A6001CSP
Lenovo Tablet 10-20L3000RGE: Intel Celeron N4100, 10.10", 0.7 kg
Recensioni esterne » Lenovo Tablet 10-20L3000RGE
Medion Akoya E4251-MD61202: Intel Celeron N4000, 14.00", 1.4 kg
Recensioni esterne » Medion Akoya E4251-MD61202
Lenovo Ideapad 330-15IKB-81DC00HMSP: Intel Celeron N4000, 15.60", 2.2 kg
Recensioni esterne » Lenovo Ideapad 330-15IKB-81DC00HMSP
Lenovo Yoga 330-11IGM-81A6002FSP: Intel Celeron N4000, 11.60", 1.3 kg
Recensioni esterne » Lenovo Yoga 330-11IGM-81A6002FSP
Lenovo Ideapad 330-15IGM-81D100CESP: Intel Celeron N4000, 15.60", 2.2 kg
Recensioni esterne » Lenovo Ideapad 330-15IGM-81D100CESP
HP 15-da0084ns: Intel Celeron N4000, 15.60", 1.8 kg
Recensioni esterne » HP 15-da0084ns
Lenovo V130-14 81HMS00C00: Intel Celeron N4000, 14.00", 1.8 kg
Recensioni esterne » Lenovo V130-14 81HMS00C00
Lenovo Ideapad S130-11IGM-81J1003NGE: Intel Celeron N4000, 11.60", 1.2 kg
Recensioni esterne » Lenovo Ideapad S130-11IGM-81J1003NGE
Teclast F5: Intel Celeron N4100, 11.60", 1.1 kg
Recensioni esterne » Teclast F5
HP 15-da0010ns: Intel Celeron N4000, 15.60", 2.1 kg
Recensioni esterne » HP 15-da0010ns
Medion Akoya E4251-MD61227: Intel Celeron N4000, 14.00", 1.3 kg
Recensioni esterne » Medion Akoya E4251-MD61227
Lenovo Ideapad D330-10IGM-81H30077GE: Intel Celeron N4000, 10.10", 0.6 kg
Recensioni esterne » Lenovo Ideapad D330-10IGM-81H30077GE
Lenovo Tablet 10-20L3000KGE: Intel Celeron N4100, 10.10", 0.7 kg
Recensioni esterne » Lenovo Tablet 10-20L3000KGE
Chuwi LapBook SE: Intel Celeron N4100, 13.30", 1.4 kg
Recensioni esterne » Chuwi LapBook SE
Chuwi SurBook SE: Intel Celeron N4100, 10.10"
Recensioni esterne » Chuwi SurBook SE
Lenovo V130-15IGM-81HL001CSP: Intel Celeron N4000, 15.60", 1.9 kg
Recensioni esterne » Lenovo V130-15IGM-81HL001CSP
Acer Aspire 1 A114-32-C1YA: Intel Celeron N4000, 14.00", 1.7 kg
Recensioni esterne » Acer Aspire 1 A114-32-C1YA
Jumper EZBook X4: Intel Celeron N4100, 14.00", 1.3 kg
Recensioni esterne » Jumper EZBook X4
Jumper EZBook X1: Intel Celeron N4100, 11.60", 1 kg
Recensioni esterne » Jumper EZBook X1
Lenovo Flex 6-11IGM: Intel Celeron N4000, 11.60", 1.3 kg
Recensioni esterne » Lenovo Flex 6-11IGM