Recensione del Laptop Chuwi GemiBook CWI528: copertura completa sRGB per $300 USD
Punteggio | Data | Modello | Peso | Altezza | Dimensione | Risoluzione | Prezzo |
|---|---|---|---|---|---|---|---|
| 73.5 % v7 (old) | 09/2020 | Chuwi GemiBook CWI528 Celeron J4115, UHD Graphics 600 | 1.3 kg | 17.75 mm | 13.00" | 2160x1440 | |
| 75.2 % v7 (old) | LincPlus P1 Celeron N4000, UHD Graphics 600 | 1.4 kg | 16 mm | 13.30" | 1920x1080 | ||
| 67.7 % v7 (old) | 04/2020 | Jumper EZbook X3 Celeron N3350, HD Graphics 500 | 1.3 kg | 18 mm | 13.30" | 1920x1080 | |
| 89.6 % v7 (old) | 05/2020 | Apple MacBook Air 2020 i3 i3-1000NG4, Iris Plus Graphics G4 (Ice Lake 48 EU) | 1.3 kg | 16.1 mm | 13.30" | 2560x1600 | |
| 84.5 % v7 (old) | 08/2019 | HP Envy 13-aq0003ng i7-8565U, GeForce MX250 | 1.2 kg | 14.7 mm | 13.30" | 1920x1080 | |
| 83.9 % v6 (old) | 02/2019 | Tuxedo Book BU1307 i5-8550U, UHD Graphics 620 | 1.4 kg | 21 mm | 13.30" | 1920x1080 |
| SD Card Reader | |
| average JPG Copy Test (av. of 3 runs) | |
| HP Envy 13-aq0003ng (Toshiba Exceria Pro M501 microSDXC 64GB) | |
| Chuwi GemiBook CWI528 (Toshiba Exceria Pro M501 microSDXC 64GB) | |
| Jumper EZbook X3 | |
| LincPlus P1 | |
| maximum AS SSD Seq Read Test (1GB) | |
| HP Envy 13-aq0003ng (Toshiba Exceria Pro M501 microSDXC 64GB) | |
| Chuwi GemiBook CWI528 (Toshiba Exceria Pro M501 microSDXC 64GB) | |
| Jumper EZbook X3 | |
| LincPlus P1 | |
| Networking | |
| iperf3 transmit AX12 | |
| Asus ZenBook 13 UX325JA | |
| Samsung Galaxy Book S Intel | |
| Samsung Galaxy Book Ion 13.3 | |
| Chuwi GemiBook CWI528 | |
| iperf3 receive AX12 | |
| Asus ZenBook 13 UX325JA | |
| Samsung Galaxy Book S Intel | |
| Samsung Galaxy Book Ion 13.3 | |
| Chuwi GemiBook CWI528 | |


| |||||||||||||||||||||||||
Distribuzione della luminosità: 91 %
Al centro con la batteria: 255.8 cd/m²
Contrasto: 1066:1 (Nero: 0.24 cd/m²)
ΔE ColorChecker Calman: 3.61 | ∀{0.5-29.43 Ø4.73}
calibrated: 0.9
ΔE Greyscale Calman: 5.9 | ∀{0.09-98 Ø4.97}
99% sRGB (Argyll 1.6.3 3D)
63.1% AdobeRGB 1998 (Argyll 1.6.3 3D)
68.7% AdobeRGB 1998 (Argyll 3D)
98.6% sRGB (Argyll 3D)
67.2% Display P3 (Argyll 3D)
Gamma: 2.19
CCT: 6805 K
| Chuwi GemiBook CWI528 Chi Mei P130ZFA-BA1, IPS, 13", 2160x1440 | LincPlus P1 LC133LF2L03, IPS, 13.3", 1920x1080 | Jumper EZbook X3 PBTB133F006 A, IPS, 13.3", 1920x1080 | Apple MacBook Air 2020 i3 APPA042, IPS, 13.3", 2560x1600 | HP Envy 13-aq0003ng InfoVision M133NVF3 R2, IPS, 13.3", 1920x1080 | Tuxedo Book BU1307 AUO272D, IPS, 13.3", 1920x1080 | |
|---|---|---|---|---|---|---|
| Display | -3% | -10% | 3% | -5% | ||
| Display P3 Coverage (%) | 67.2 | 65.4 -3% | 60.4 -10% | 70.3 5% | 64.4 -4% | |
| sRGB Coverage (%) | 98.6 | 94.9 -4% | 88.7 -10% | 98 -1% | 91.7 -7% | |
| AdobeRGB 1998 Coverage (%) | 68.7 | 66.8 -3% | 61.7 -10% | 71.6 4% | 65.2 -5% | |
| Response Times | 5% | 1% | 3% | 20% | 21% | |
| Response Time Grey 50% / Grey 80% * (ms) | 37.6 ? | 36 ? 4% | 34 ? 10% | 38.4 ? -2% | 31 ? 18% | 34 ? 10% |
| Response Time Black / White * (ms) | 30.4 ? | 29 ? 5% | 33 ? -9% | 28.4 ? 7% | 24 ? 21% | 21 ? 31% |
| PWM Frequency (Hz) | 250 ? | 119000 ? | 4000 ? | 400 ? | ||
| Screen | -31% | -36% | 34% | 24% | 1% | |
| Brightness middle (cd/m²) | 255.8 | 264 3% | 209 -18% | 416 63% | 768 200% | 333 30% |
| Brightness (cd/m²) | 246 | 256 4% | 203 -17% | 403 64% | 778 216% | 319 30% |
| Brightness Distribution (%) | 91 | 84 -8% | 95 4% | 95 4% | 82 -10% | 83 -9% |
| Black Level * (cd/m²) | 0.24 | 0.25 -4% | 0.2 17% | 0.34 -42% | 0.48 -100% | 0.3 -25% |
| Contrast (:1) | 1066 | 1056 -1% | 1045 -2% | 1224 15% | 1600 50% | 1110 4% |
| Colorchecker dE 2000 * | 3.61 | 7.36 -104% | 8.43 -134% | 0.9 75% | 3.49 3% | |
| Colorchecker dE 2000 max. * | 8.73 | 12.72 -46% | 14.77 -69% | 1.4 84% | 7.41 15% | |
| Colorchecker dE 2000 calibrated * | 0.9 | 2.12 -136% | 1.68 -87% | 0.6 33% | 2.07 -130% | |
| Greyscale dE 2000 * | 5.9 | 8.74 -48% | 9.81 -66% | 1 83% | 4.09 31% | 7.35 -25% |
| Gamma | 2.19 100% | 2.41 91% | 2.46 89% | 2.2 100% | 2.54 87% | 2.35 94% |
| CCT | 6805 96% | 8741 74% | 10135 64% | 6629 98% | 6452 101% | 7156 91% |
| Color Space (Percent of AdobeRGB 1998) (%) | 63.1 | 62 -2% | 57 -10% | 63.9 1% | 60 -5% | |
| Color Space (Percent of sRGB) (%) | 99 | 95 -4% | 89 -10% | 97.6 -1% | 92 -7% | |
| Media totale (Programma / Settaggio) | -10% /
-22% | -15% /
-26% | 13% /
25% | 13% /
18% | 11% /
6% |
* ... Meglio usare valori piccoli
Tempi di risposta del Display
| ↔ Tempi di risposta dal Nero al Bianco | ||
|---|---|---|
| 30.4 ms ... aumenta ↗ e diminuisce ↘ combinato | ↗ 16.4 ms Incremento | 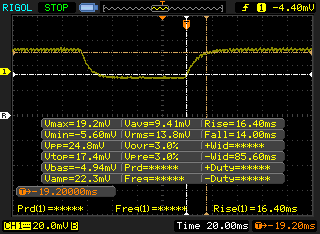 |
| ↘ 14 ms Calo | ||
| Lo schermo mostra tempi di risposta lenti nei nostri tests e sarà insoddisfacente per i gamers. In confronto, tutti i dispositivi di test variano da 0.1 (minimo) a 240 (massimo) ms. » 82 % di tutti i dispositivi è migliore. Questo significa che i tempi di risposta rilevati sono peggiori rispetto alla media di tutti i dispositivi testati (19.9 ms). | ||
| ↔ Tempo di risposta dal 50% Grigio all'80% Grigio | ||
| 37.6 ms ... aumenta ↗ e diminuisce ↘ combinato | ↗ 18.8 ms Incremento | 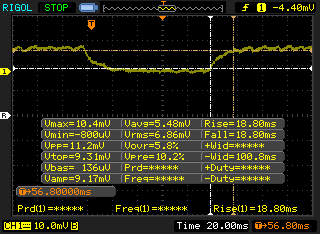 |
| ↘ 18.8 ms Calo | ||
| Lo schermo mostra tempi di risposta lenti nei nostri tests e sarà insoddisfacente per i gamers. In confronto, tutti i dispositivi di test variano da 0.165 (minimo) a 636 (massimo) ms. » 54 % di tutti i dispositivi è migliore. Questo significa che i tempi di risposta rilevati sono peggiori rispetto alla media di tutti i dispositivi testati (31.1 ms). | ||
Sfarfallio dello schermo / PWM (Pulse-Width Modulation)
| flickering dello schermo / PWM non rilevato | 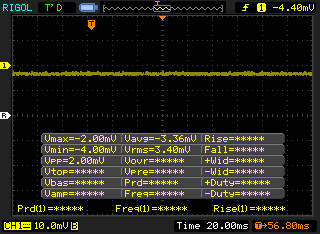 | ||
In confronto: 52 % di tutti i dispositivi testati non utilizza PWM per ridurre la luminosita' del display. Se è rilevato PWM, una media di 7798 (minimo: 5 - massimo: 343500) Hz è stata rilevata. | |||
Cinebench R15: CPU Multi 64Bit | CPU Single 64Bit
Blender: v2.79 BMW27 CPU
7-Zip 18.03: 7z b 4 -mmt1 | 7z b 4
Geekbench 5.5: Single-Core | Multi-Core
HWBOT x265 Benchmark v2.2: 4k Preset
LibreOffice : 20 Documents To PDF
R Benchmark 2.5: Overall mean
| Cinebench R20 / CPU (Multi Core) | |
| Lenovo IdeaPad 3 14IIL05 | |
| HP 17-by2437ng | |
| Dell Latitude 3400 | |
| Media Intel Celeron J4115 (503 - 590, n=2) | |
| Chuwi GemiBook CWI528 | |
| Chuwi Hi10 X | |
| Lenovo IdeaPad Flex 3 11IGL05 | |
| Chuwi LapBook Plus | |
| XIDU PhilBook Max | |
| Cinebench R20 / CPU (Single Core) | |
| HP 17-by2437ng | |
| Lenovo IdeaPad 3 14IIL05 | |
| Dell Latitude 3400 | |
| Lenovo IdeaPad Flex 3 11IGL05 | |
| Chuwi GemiBook CWI528 | |
| Media Intel Celeron J4115 (156 - 157, n=2) | |
| Chuwi Hi10 X | |
| XIDU PhilBook Max | |
| Chuwi LapBook Plus | |
| Cinebench R15 / CPU Multi 64Bit | |
| Lenovo IdeaPad 3 14IIL05 | |
| Dell Latitude 3400 | |
| HP 17-by2437ng | |
| Media Intel Celeron J4115 (225 - 263, n=2) | |
| Chuwi GemiBook CWI528 | |
| Chuwi Hi10 X | |
| Lenovo IdeaPad Flex 3 11IGL05 | |
| Chuwi LapBook Plus | |
| XIDU PhilBook Max | |
| Cinebench R15 / CPU Single 64Bit | |
| HP 17-by2437ng | |
| Lenovo IdeaPad 3 14IIL05 | |
| Dell Latitude 3400 | |
| Lenovo IdeaPad Flex 3 11IGL05 | |
| Media Intel Celeron J4115 (70.1 - 71.1, n=2) | |
| Chuwi GemiBook CWI528 | |
| Chuwi Hi10 X | |
| XIDU PhilBook Max | |
| Chuwi LapBook Plus | |
| Blender / v2.79 BMW27 CPU | |
| XIDU PhilBook Max | |
| Chuwi LapBook Plus | |
| Lenovo IdeaPad Flex 3 11IGL05 | |
| Chuwi Hi10 X | |
| Chuwi GemiBook CWI528 | |
| Media Intel Celeron J4115 (2380 - 2650, n=2) | |
| HP 17-by2437ng | |
| Lenovo IdeaPad 3 14IIL05 | |
| 7-Zip 18.03 / 7z b 4 -mmt1 | |
| HP 17-by2437ng | |
| Lenovo IdeaPad 3 14IIL05 | |
| Lenovo IdeaPad Flex 3 11IGL05 | |
| Media Intel Celeron J4115 (2184 - 2215, n=2) | |
| Chuwi GemiBook CWI528 | |
| Chuwi Hi10 X | |
| XIDU PhilBook Max | |
| Chuwi LapBook Plus | |
| 7-Zip 18.03 / 7z b 4 | |
| Lenovo IdeaPad 3 14IIL05 | |
| HP 17-by2437ng | |
| Media Intel Celeron J4115 (7129 - 8098, n=2) | |
| Chuwi GemiBook CWI528 | |
| Chuwi Hi10 X | |
| Chuwi LapBook Plus | |
| Lenovo IdeaPad Flex 3 11IGL05 | |
| XIDU PhilBook Max | |
| Geekbench 5.5 / Single-Core | |
| Lenovo IdeaPad 3 14IIL05 | |
| HP 17-by2437ng | |
| Lenovo IdeaPad Flex 3 11IGL05 | |
| Chuwi GemiBook CWI528 | |
| Chuwi Hi10 X | |
| Media Intel Celeron J4115 (388 - 410, n=2) | |
| Geekbench 5.5 / Multi-Core | |
| Lenovo IdeaPad 3 14IIL05 | |
| HP 17-by2437ng | |
| Chuwi GemiBook CWI528 | |
| Media Intel Celeron J4115 (1410 - 1431, n=2) | |
| Chuwi Hi10 X | |
| Lenovo IdeaPad Flex 3 11IGL05 | |
| HWBOT x265 Benchmark v2.2 / 4k Preset | |
| Lenovo IdeaPad 3 14IIL05 | |
| HP 17-by2437ng | |
| Media Intel Celeron J4115 (1.34 - 1.49, n=2) | |
| Chuwi GemiBook CWI528 | |
| Chuwi Hi10 X | |
| Chuwi LapBook Plus | |
| Lenovo IdeaPad Flex 3 11IGL05 | |
| XIDU PhilBook Max | |
| LibreOffice / 20 Documents To PDF | |
| Chuwi Hi10 X | |
| Media Intel Celeron J4115 (134 - 150, n=2) | |
| Lenovo IdeaPad Flex 3 11IGL05 | |
| Chuwi GemiBook CWI528 | |
| HP 17-by2437ng | |
| Lenovo IdeaPad 3 14IIL05 | |
| R Benchmark 2.5 / Overall mean | |
| Chuwi Hi10 X | |
| Chuwi GemiBook CWI528 | |
| Media Intel Celeron J4115 (n=1) | |
| Lenovo IdeaPad Flex 3 11IGL05 | |
| Lenovo IdeaPad 3 14IIL05 | |
| HP 17-by2437ng | |
* ... Meglio usare valori piccoli
| PCMark 10 | |
| Score | |
| HP Envy 13-aq0003ng | |
| Tuxedo Book BU1307 | |
| Apple MacBook Air 2020 i3 | |
| Chuwi GemiBook CWI528 | |
| LincPlus P1 | |
| Jumper EZbook X3 | |
| Essentials | |
| HP Envy 13-aq0003ng | |
| Tuxedo Book BU1307 | |
| Apple MacBook Air 2020 i3 | |
| Chuwi GemiBook CWI528 | |
| LincPlus P1 | |
| Jumper EZbook X3 | |
| Productivity | |
| HP Envy 13-aq0003ng | |
| Tuxedo Book BU1307 | |
| Apple MacBook Air 2020 i3 | |
| Chuwi GemiBook CWI528 | |
| LincPlus P1 | |
| Jumper EZbook X3 | |
| Digital Content Creation | |
| HP Envy 13-aq0003ng | |
| Tuxedo Book BU1307 | |
| Apple MacBook Air 2020 i3 | |
| Chuwi GemiBook CWI528 | |
| LincPlus P1 | |
| Jumper EZbook X3 | |
| PCMark 8 | |
| Home Score Accelerated v2 | |
| Tuxedo Book BU1307 | |
| HP Envy 13-aq0003ng | |
| Apple MacBook Air 2020 i3 | |
| Chuwi GemiBook CWI528 | |
| Work Score Accelerated v2 | |
| HP Envy 13-aq0003ng | |
| Chuwi GemiBook CWI528 | |
| PCMark 8 Home Score Accelerated v2 | 1866 punti | |
| PCMark 8 Work Score Accelerated v2 | 2926 punti | |
| PCMark 10 Score | 1738 punti | |
Aiuto | ||
| DPC Latencies / LatencyMon - interrupt to process latency (max), Web, Youtube, Prime95 | |
| HP 17-by2437ng | |
| Lenovo IdeaPad Flex 3 11IGL05 | |
| Chuwi GemiBook CWI528 | |
| Asus ZenBook 13 UX325JA | |
| Chuwi Hi10 X | |
| Samsung Galaxy Book S Intel | |
| Samsung Galaxy Book Ion 13.3 | |
| Acer Swift 3 SF314-42-R27B | |
| Lenovo ThinkPad X1 Carbon 2020-20UAS04T00 | |
| Chuwi LarkBox 4K Mini PC | |
| Lenovo IdeaPad 3 14IIL05 | |
* ... Meglio usare valori piccoli
| Chuwi GemiBook CWI528 Morebeck-S100 256GB | LincPlus P1 64 GB eMMC Flash | Jumper EZbook X3 64 GB eMMC Flash | Apple MacBook Air 2020 i3 Apple SSD AP0256 | HP Envy 13-aq0003ng Toshiba KBG30ZMV512G | Tuxedo Book BU1307 Samsung SSD 970 EVO 250GB | |
|---|---|---|---|---|---|---|
| AS SSD | -88% | -81% | 89% | 107% | 18% | |
| Seq Read (MB/s) | 434.7 | 236.1 -46% | 246.2 -43% | 1135 161% | 1295 198% | 2406 453% |
| Seq Write (MB/s) | 415.9 | 151.4 -64% | 155.8 -63% | 1090 162% | 593 43% | 435.1 5% |
| 4K Read (MB/s) | 14.37 | 19.26 34% | 18.41 28% | 14.87 3% | 45.58 217% | 50.2 249% |
| 4K Write (MB/s) | 54.2 | 23.21 -57% | 22 -59% | 26.27 -52% | 118.8 119% | 1.45 -97% |
| 4K-64 Read (MB/s) | 139.3 | 21.08 -85% | 22.45 -84% | 585 320% | 604 334% | 818 487% |
| 4K-64 Write (MB/s) | 246.5 | 23.41 -91% | 22.73 -91% | 154.6 -37% | 272.4 11% | 145.6 -41% |
| Access Time Read * (ms) | 0.127 | 0.23 -81% | 0.246 -94% | 0.126 1% | 0.147 -16% | 0.047 63% |
| Access Time Write * (ms) | 0.172 | 0.774 -350% | 0.621 -261% | 0.058 66% | 0.168 2% | 2.784 -1519% |
| Score Read (Points) | 197 | 64 -68% | 65 -67% | 713 262% | 779 295% | 1108 462% |
| Score Write (Points) | 342 | 62 -82% | 60 -82% | 290 -15% | 450 32% | 191 -44% |
| Score Total (Points) | 644 | 163 -75% | 163 -75% | 1365 112% | 1607 150% | 1780 176% |
| Copy ISO MB/s (MB/s) | 448.9 | 593 32% | ||||
| Copy Program MB/s (MB/s) | 165.3 | 277.6 68% | ||||
| Copy Game MB/s (MB/s) | 413 | 452.7 10% | ||||
| CrystalDiskMark 5.2 / 6 | -73% | -72% | 104% | 90% | 204% | |
| Write 4K (MB/s) | 72.1 | 20.32 -72% | 19.21 -73% | 34.57 -52% | 106.2 47% | 158.2 119% |
| Read 4K (MB/s) | 23.82 | 10.69 -55% | 7.435 -69% | 28.48 20% | 44.89 88% | 38.78 63% |
| Write Seq (MB/s) | 417.6 | 98.6 -76% | 138.8 -67% | 1026 146% | 639 53% | 1487 256% |
| Read Seq (MB/s) | 504 | 217.7 -57% | 219.8 -56% | 1109 120% | 849 68% | 913 81% |
| Write 4K Q32T1 (MB/s) | 125.7 | 23.81 -81% | 24.39 -81% | 178.4 42% | 217.4 73% | 330.5 163% |
| Read 4K Q32T1 (MB/s) | 145 | 21.84 -85% | 22.2 -85% | 557 284% | 322.1 122% | 423.8 192% |
| Write Seq Q32T1 (MB/s) | 496.4 | 79.6 -84% | 122.3 -75% | 970 95% | 865 74% | 1540 210% |
| Read Seq Q32T1 (MB/s) | 550 | 140.8 -74% | 147.6 -73% | 1513 175% | 1630 196% | 3556 547% |
| Media totale (Programma / Settaggio) | -81% /
-82% | -77% /
-77% | 97% /
95% | 99% /
101% | 111% /
96% |
* ... Meglio usare valori piccoli

Throttling disco: DiskSpd Read Loop, Queue Depth 8
| 3DMark 11 Performance | 472 punti | |
| 3DMark Ice Storm Standard Score | 21920 punti | |
| 3DMark Cloud Gate Standard Score | 2672 punti | |
| 3DMark Fire Strike Score | 300 punti | |
Aiuto | ||
| basso | medio | alto | ultra | |
|---|---|---|---|---|
| Dota 2 Reborn (2015) | 32.2 | 15.5 | 6 | 5.5 |
| X-Plane 11.11 (2018) | 6.15 | 4 | 3.63 |
| Chuwi GemiBook CWI528 UHD Graphics 600, Celeron J4115, Morebeck-S100 256GB | LincPlus P1 UHD Graphics 600, Celeron N4000, 64 GB eMMC Flash | Jumper EZbook X3 HD Graphics 500, Celeron N3350, 64 GB eMMC Flash | Apple MacBook Air 2020 i3 Iris Plus Graphics G4 (Ice Lake 48 EU), i3-1000NG4, Apple SSD AP0256 | HP Envy 13-aq0003ng GeForce MX250, i7-8565U, Toshiba KBG30ZMV512G | Tuxedo Book BU1307 UHD Graphics 620, i5-8550U, Samsung SSD 970 EVO 250GB | |
|---|---|---|---|---|---|---|
| Noise | -19% | -22% | -21% | |||
| off /ambiente * (dB) | 26.2 | 29 -11% | 30 -15% | 30.5 -16% | ||
| Idle Minimum * (dB) | 26.2 | 29 -11% | 30 -15% | 30.5 -16% | ||
| Idle Average * (dB) | 26.2 | 29 -11% | 30 -15% | 30.8 -18% | ||
| Idle Maximum * (dB) | 26.2 | 29 -11% | 30 -15% | 30.8 -18% | ||
| Load Average * (dB) | 26.5 | 31.6 -19% | 34.3 -29% | |||
| Load Maximum * (dB) | 26.7 | 39.4 -48% | 39.5 -48% | 34.3 -28% |
* ... Meglio usare valori piccoli
Rumorosità
| Idle |
| 26.2 / 26.2 / 26.2 dB(A) |
| Sotto carico |
| 26.5 / 26.7 dB(A) |
 | ||
30 dB silenzioso 40 dB(A) udibile 50 dB(A) rumoroso |
||
min: | ||
(+) La temperatura massima sul lato superiore è di 33 °C / 91 F, rispetto alla media di 35.9 °C / 97 F, che varia da 21.4 a 59 °C per questa classe Subnotebook.
(+) Il lato inferiore si riscalda fino ad un massimo di 38 °C / 100 F, rispetto alla media di 39.2 °C / 103 F
(+) In idle, la temperatura media del lato superiore è di 27.1 °C / 81 F, rispetto alla media deld ispositivo di 30.8 °C / 87 F.
(+) I poggiapolsi e il touchpad sono piu' freddi della temperatura della pelle con un massimo di 26.2 °C / 79.2 F e sono quindi freddi al tatto.
(±) La temperatura media della zona del palmo della mano di dispositivi simili e'stata di 28.2 °C / 82.8 F (+2 °C / 3.6 F).
Chuwi GemiBook CWI528 analisi audio
(+) | gli altoparlanti sono relativamente potenti (90.1 dB)
Bassi 100 - 315 Hz
(-) | quasi nessun basso - in media 27.6% inferiori alla media
(+) | bassi in lineaa (6.3% delta rispetto alla precedente frequenza)
Medi 400 - 2000 Hz
(±) | medi ridotti - circa 5% inferiori alla media
(+) | medi lineari (5.5% delta rispetto alla precedente frequenza)
Alti 2 - 16 kHz
(+) | Alti bilanciati - appena 3.3% dalla media
(+) | alti lineari (2.9% delta rispetto alla precedente frequenza)
Nel complesso 100 - 16.000 Hz
(±) | la linearità complessiva del suono è media (17.7% di differenza rispetto alla media
Rispetto alla stessa classe
» 49% di tutti i dispositivi testati in questa classe è stato migliore, 7% simile, 44% peggiore
» Il migliore ha avuto un delta di 5%, medio di 18%, peggiore di 53%
Rispetto a tutti i dispositivi testati
» 35% di tutti i dispositivi testati in questa classe è stato migliore, 8% similare, 57% peggiore
» Il migliore ha avuto un delta di 4%, medio di 24%, peggiore di 134%
Apple MacBook 12 (Early 2016) 1.1 GHz analisi audio
(+) | gli altoparlanti sono relativamente potenti (83.6 dB)
Bassi 100 - 315 Hz
(±) | bassi ridotti - in media 11.3% inferiori alla media
(±) | la linearità dei bassi è media (14.2% delta rispetto alla precedente frequenza)
Medi 400 - 2000 Hz
(+) | medi bilanciati - solo only 2.4% rispetto alla media
(+) | medi lineari (5.5% delta rispetto alla precedente frequenza)
Alti 2 - 16 kHz
(+) | Alti bilanciati - appena 2% dalla media
(+) | alti lineari (4.5% delta rispetto alla precedente frequenza)
Nel complesso 100 - 16.000 Hz
(+) | suono nel complesso lineare (10.2% differenza dalla media)
Rispetto alla stessa classe
» 7% di tutti i dispositivi testati in questa classe è stato migliore, 2% simile, 91% peggiore
» Il migliore ha avuto un delta di 5%, medio di 18%, peggiore di 53%
Rispetto a tutti i dispositivi testati
» 5% di tutti i dispositivi testati in questa classe è stato migliore, 1% similare, 94% peggiore
» Il migliore ha avuto un delta di 4%, medio di 24%, peggiore di 134%
| Off / Standby | |
| Idle | |
| Sotto carico |
|
Leggenda:
min: | |
| Chuwi GemiBook CWI528 Celeron J4115, UHD Graphics 600, Morebeck-S100 256GB, IPS, 2160x1440, 13" | LincPlus P1 Celeron N4000, UHD Graphics 600, 64 GB eMMC Flash, IPS, 1920x1080, 13.3" | Jumper EZbook X3 Celeron N3350, HD Graphics 500, 64 GB eMMC Flash, IPS, 1920x1080, 13.3" | Apple MacBook Air 2020 i3 i3-1000NG4, Iris Plus Graphics G4 (Ice Lake 48 EU), Apple SSD AP0256, IPS, 2560x1600, 13.3" | HP Envy 13-aq0003ng i7-8565U, GeForce MX250, Toshiba KBG30ZMV512G, IPS, 1920x1080, 13.3" | Tuxedo Book BU1307 i5-8550U, UHD Graphics 620, Samsung SSD 970 EVO 250GB, IPS, 1920x1080, 13.3" | |
|---|---|---|---|---|---|---|
| Power Consumption | 27% | 32% | 6% | -77% | -38% | |
| Idle Minimum * (Watt) | 7.1 | 2.9 59% | 3.3 54% | 2.1 70% | 3.9 45% | 5.5 23% |
| Idle Average * (Watt) | 9.3 | 7.7 17% | 6.4 31% | 6.2 33% | 7.8 16% | 8.9 4% |
| Idle Maximum * (Watt) | 9.6 | 8.2 15% | 7 27% | 7 27% | 10.8 -13% | 11.5 -20% |
| Load Average * (Watt) | 14.1 | 13.8 2% | 13.4 5% | 24.7 -75% | 53 -276% | 34.6 -145% |
| Load Maximum * (Watt) | 24.4 | 14.5 41% | 14 43% | 30.6 -25% | 62.7 -157% | 36.6 -50% |
* ... Meglio usare valori piccoli
| Chuwi GemiBook CWI528 Celeron J4115, UHD Graphics 600, 38 Wh | LincPlus P1 Celeron N4000, UHD Graphics 600, 34 Wh | Jumper EZbook X3 Celeron N3350, HD Graphics 500, 34.9 Wh | Apple MacBook Air 2020 i3 i3-1000NG4, Iris Plus Graphics G4 (Ice Lake 48 EU), 49.9 Wh | HP Envy 13-aq0003ng i7-8565U, GeForce MX250, 53.2 Wh | Tuxedo Book BU1307 i5-8550U, UHD Graphics 620, 66 Wh | |
|---|---|---|---|---|---|---|
| Autonomia della batteria | ||||||
| WiFi v1.3 (h) | 5.6 | 6.2 11% | 7.9 41% | 11 96% | 8.5 52% | 9.2 64% |
Pro
Contro
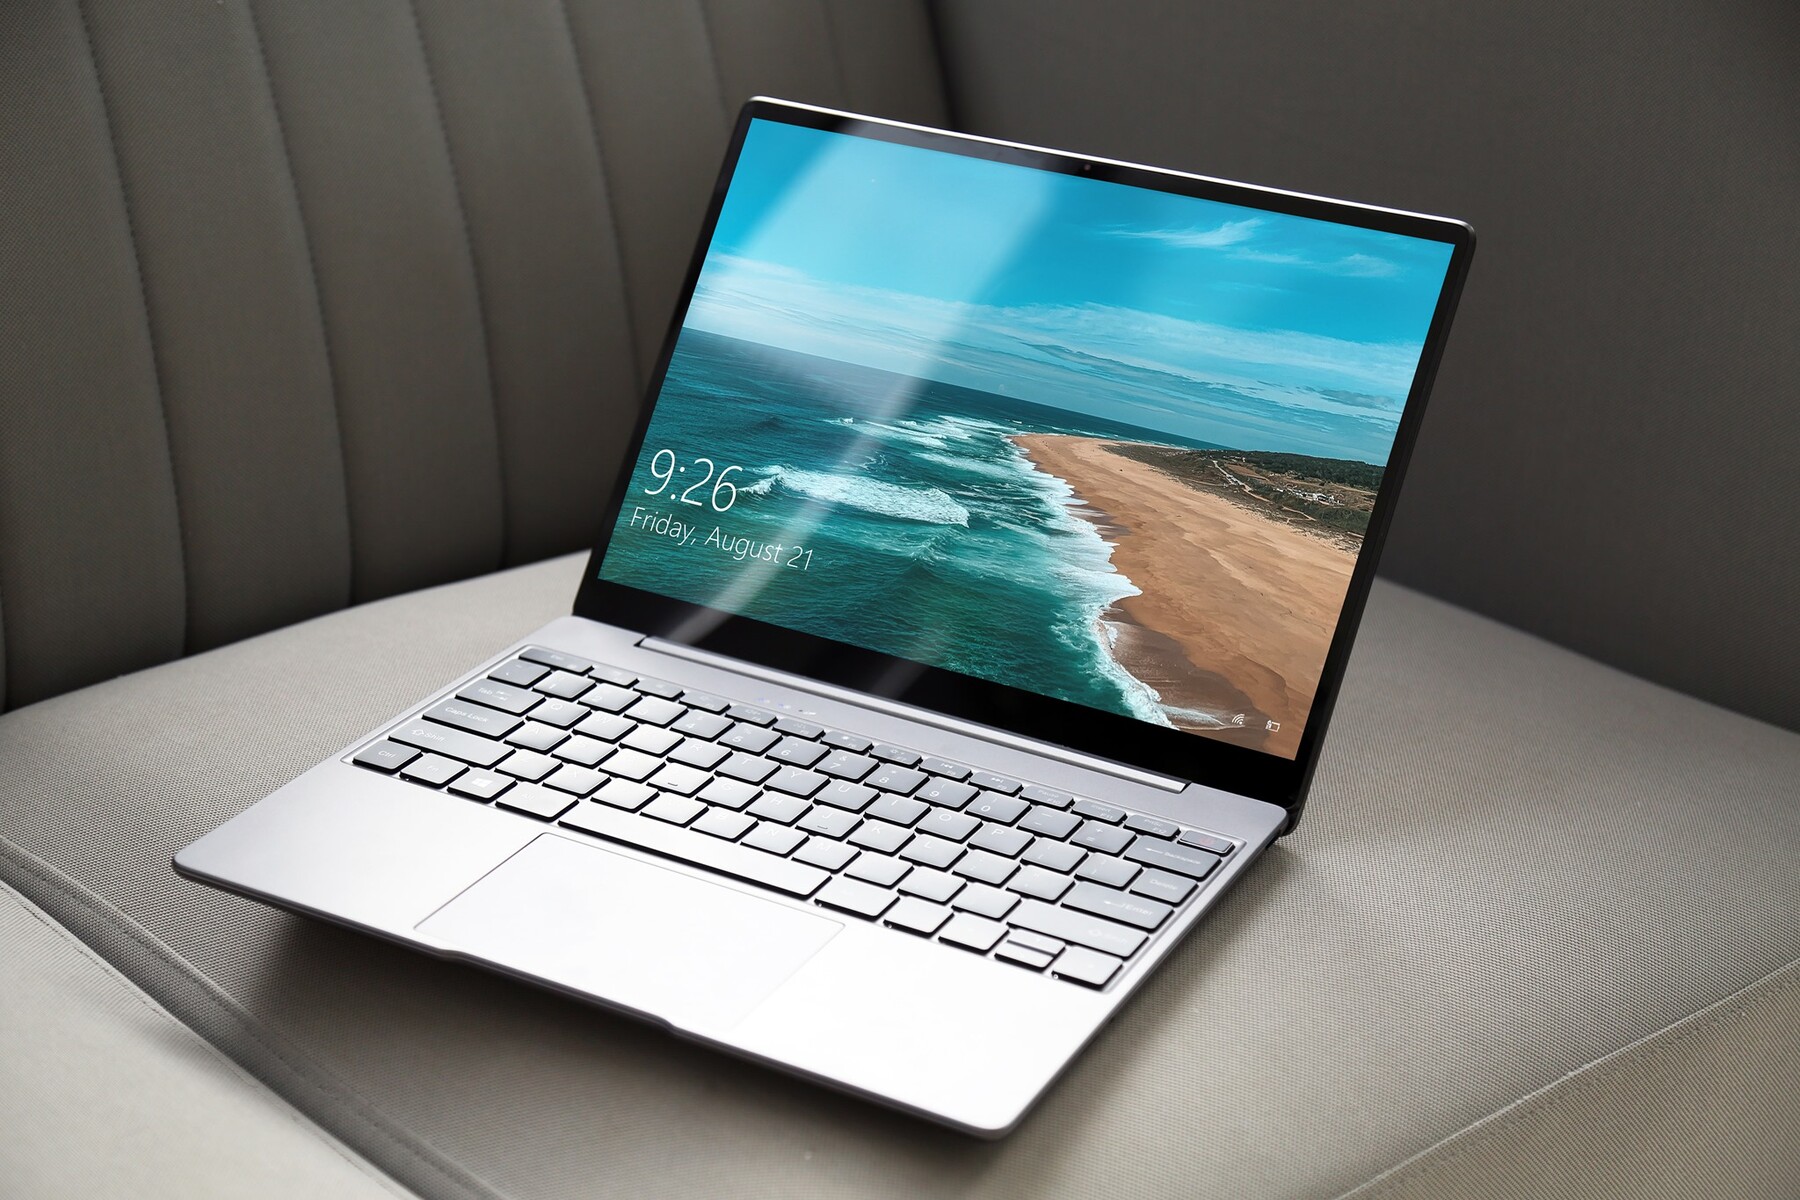
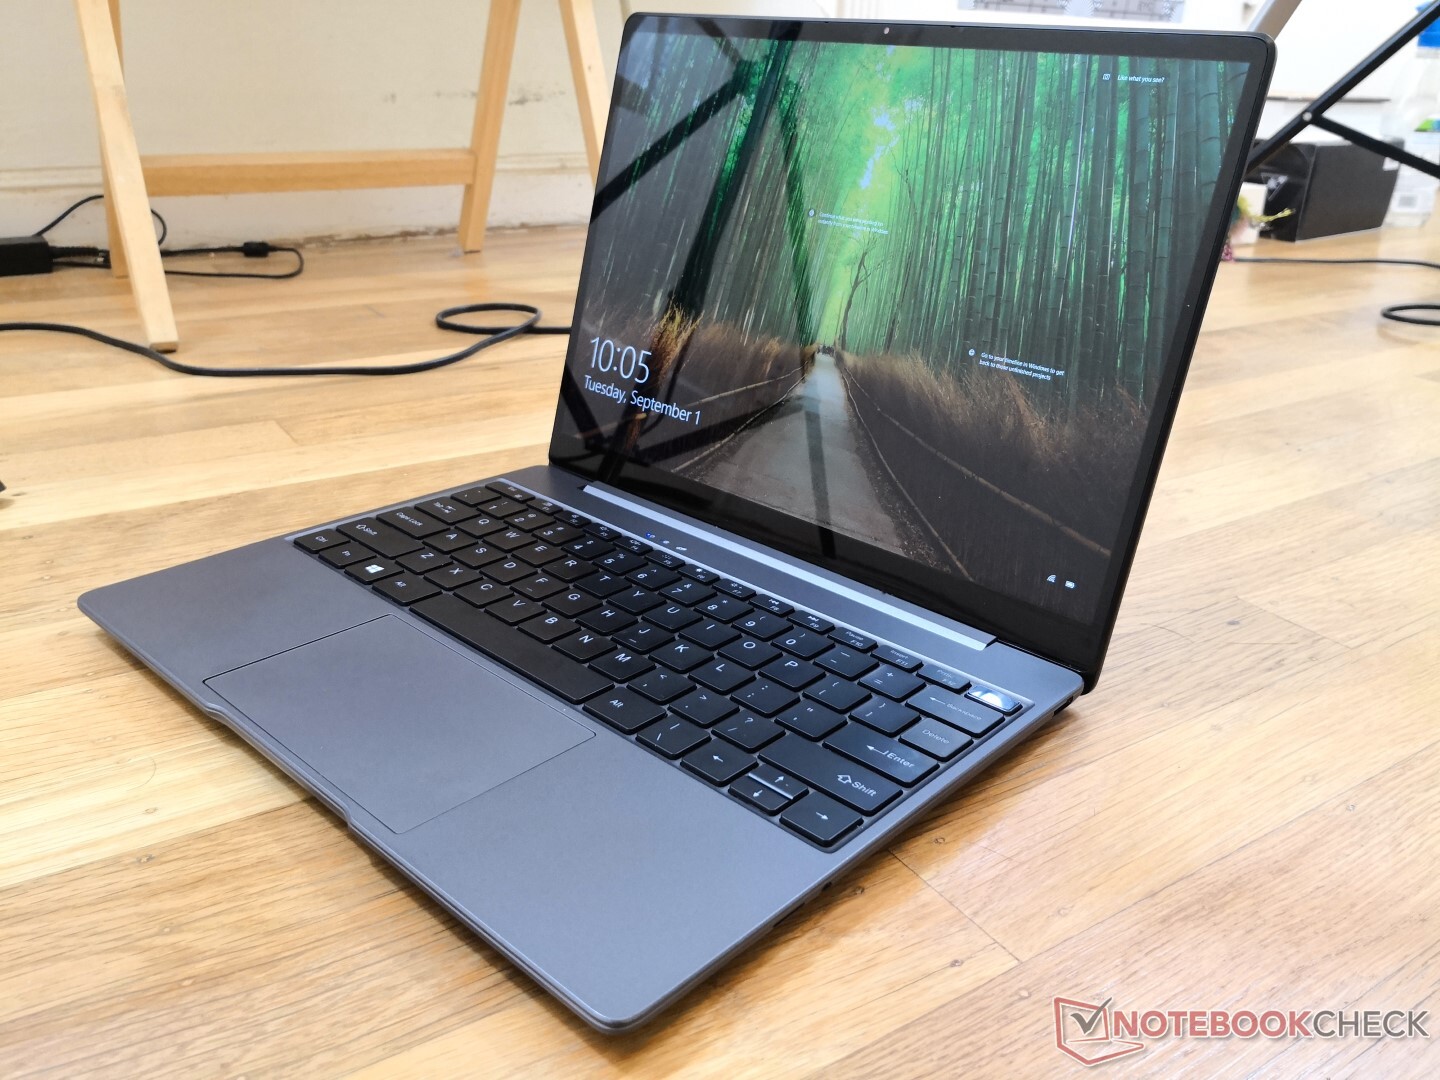
Senza dubbio la parte migliore del Chuwi GemiBook è il suo display ad alta risoluzione 3:2. Questo display è lo stesso che Huawei utilizza per il suo fiore all'occhiello MateBook 13, il che significa che da questo Chuwi da 300 dollari otterrete la stessa esperienza visiva di un Ultrabook da oltre 1000 dollari. È un'impresa impressionante da questo particolare punto di vista.
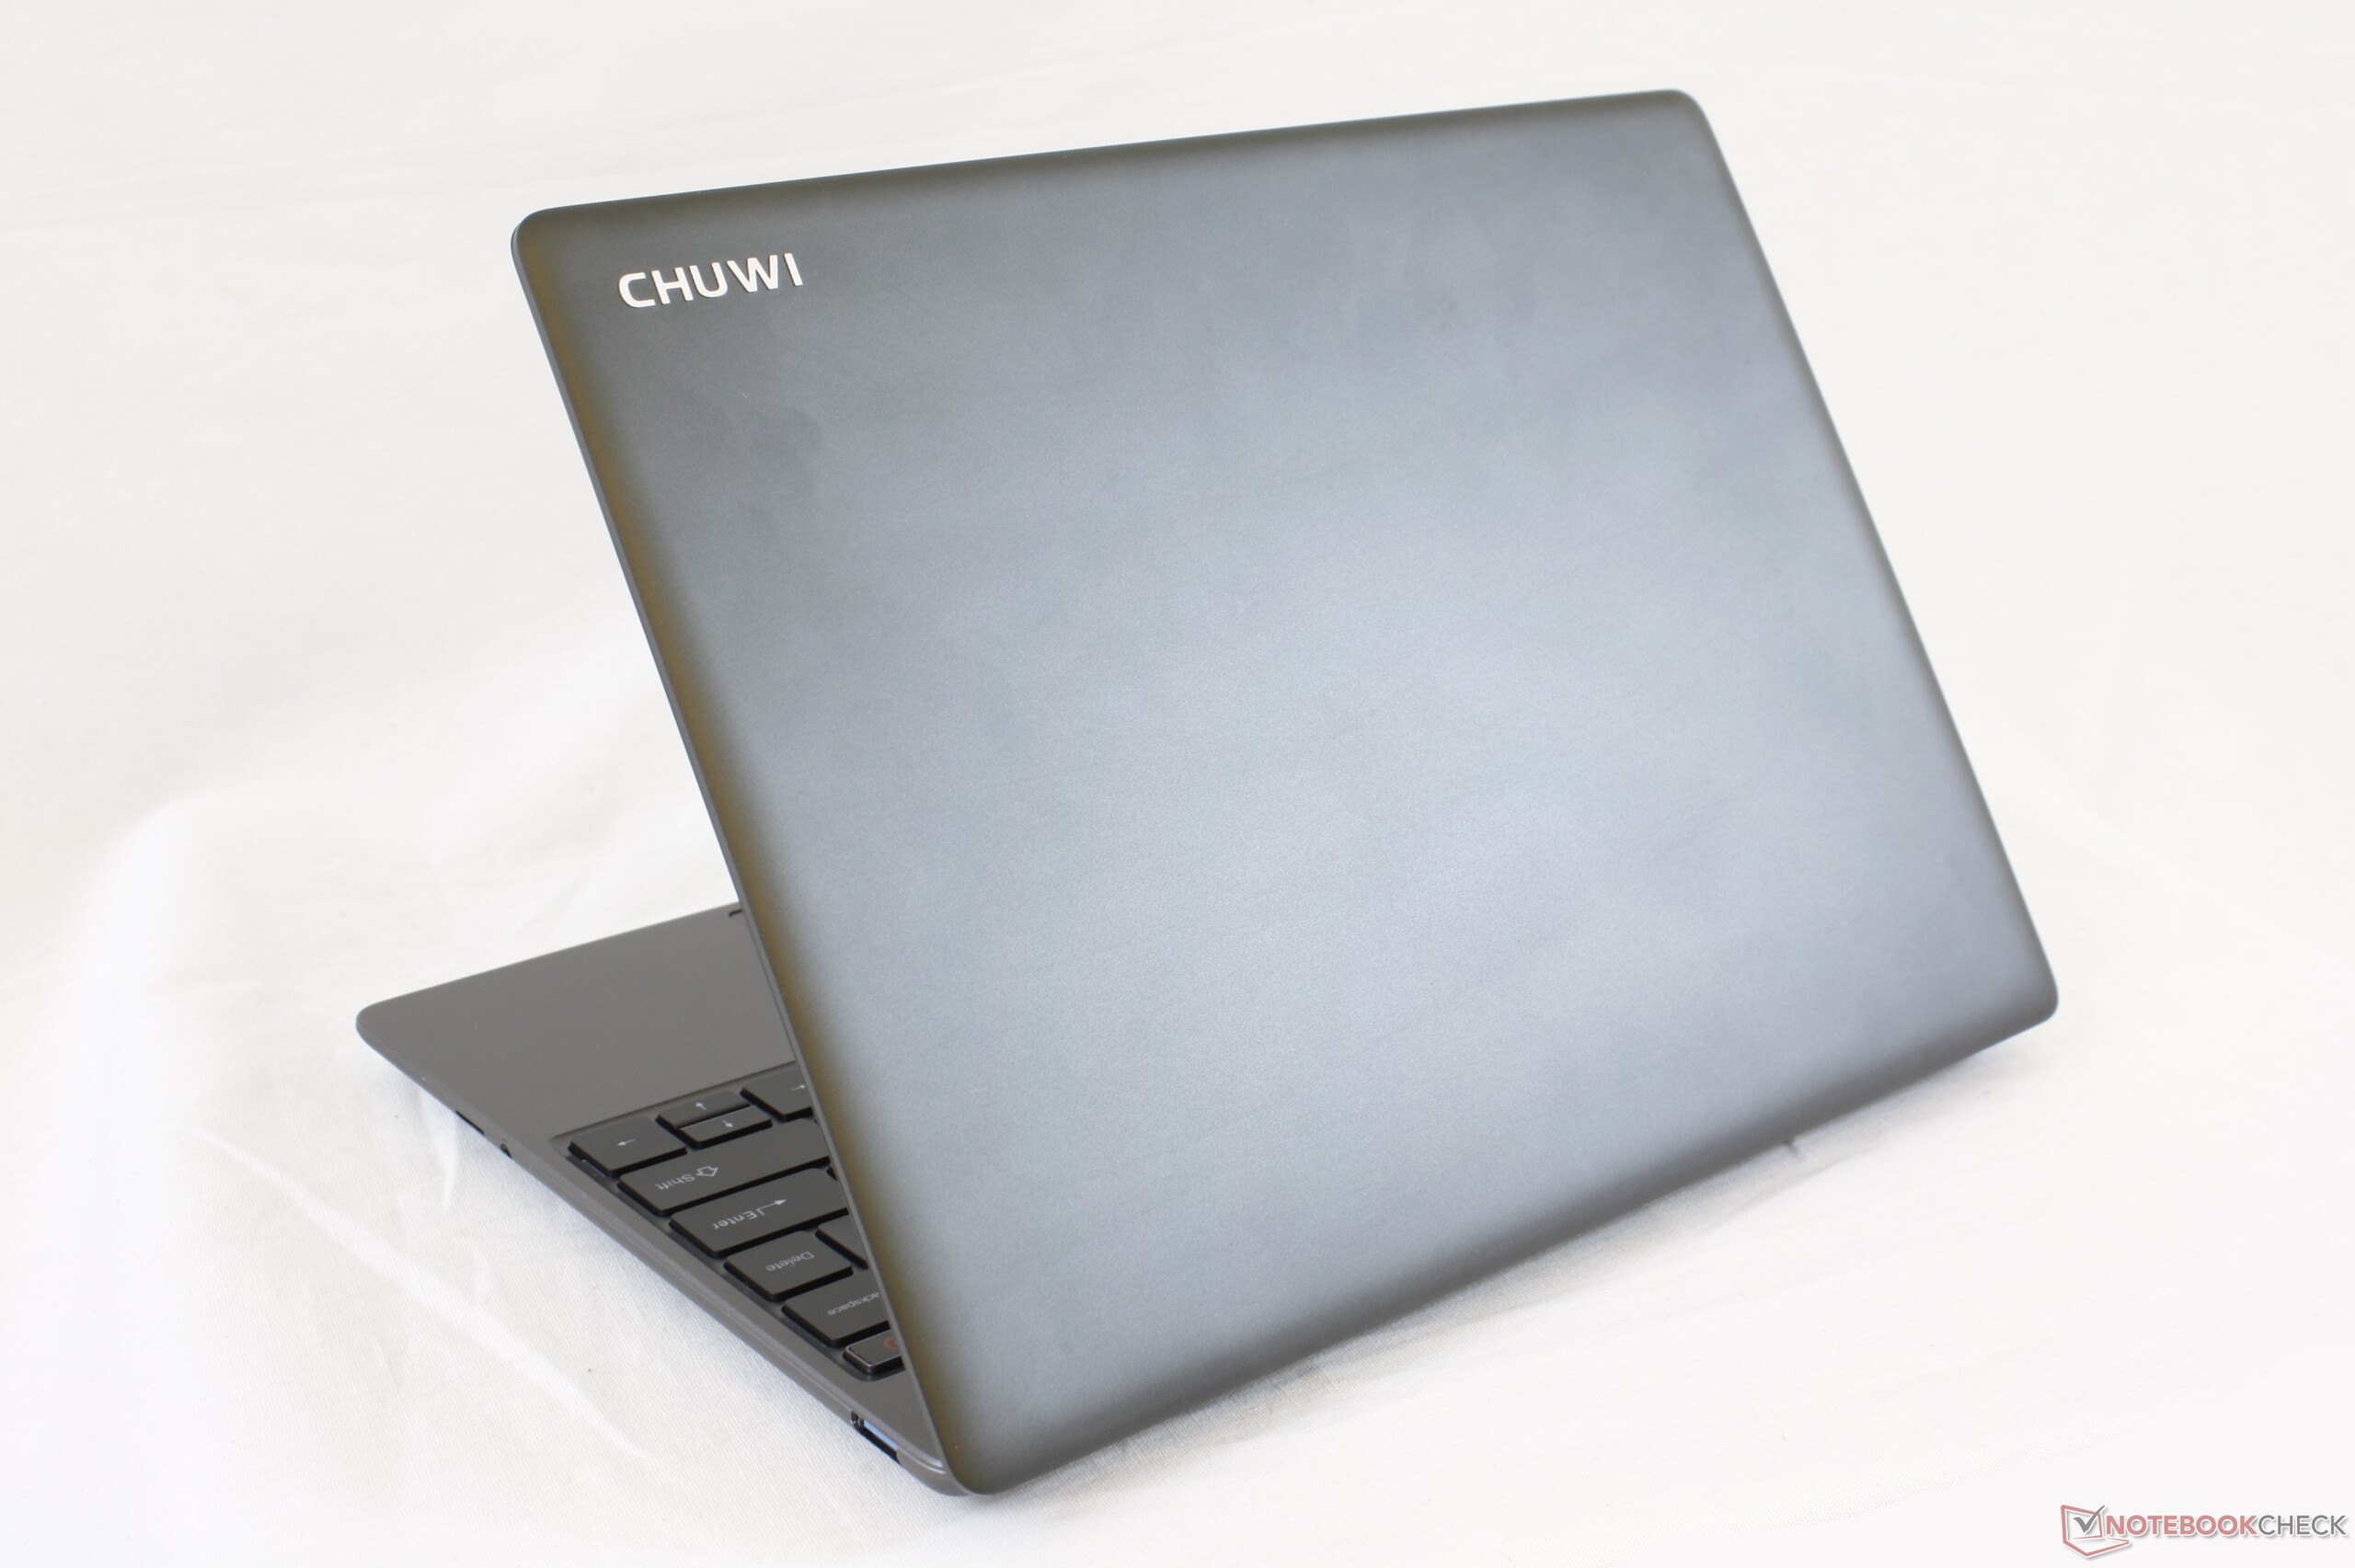
Quasi tutto il resto cade a pezzi una volta che si guarda oltre il display. La carica è molto lenta, le prestazioni sono ancora più lente, i tasti della tastiera sono rumorosi e le cerniere sono deboli a certe angolazioni. Il design simile al MateBook, la ventola silenziosa e i doppi alloggiamenti M.2 non sono sufficienti a compensare i numerosi inconvenienti che influiscono sulla fruibilità e la longevità del sistema. Per 300 dollari, tuttavia, il GemiBook è ancora una macchina decente se non squilibrata, considerando il prezzo richiesto. Per i nostri soldi, il Walmart Motile alimentato da AMD è l'affare migliore nel complesso, poiché si destreggia tra display, prestazioni e design molto meglio del Chuwi.
Chuwi GemiBook CWI528
- 09/03/2020 v7 (old)
Allen Ngo
Price comparison
