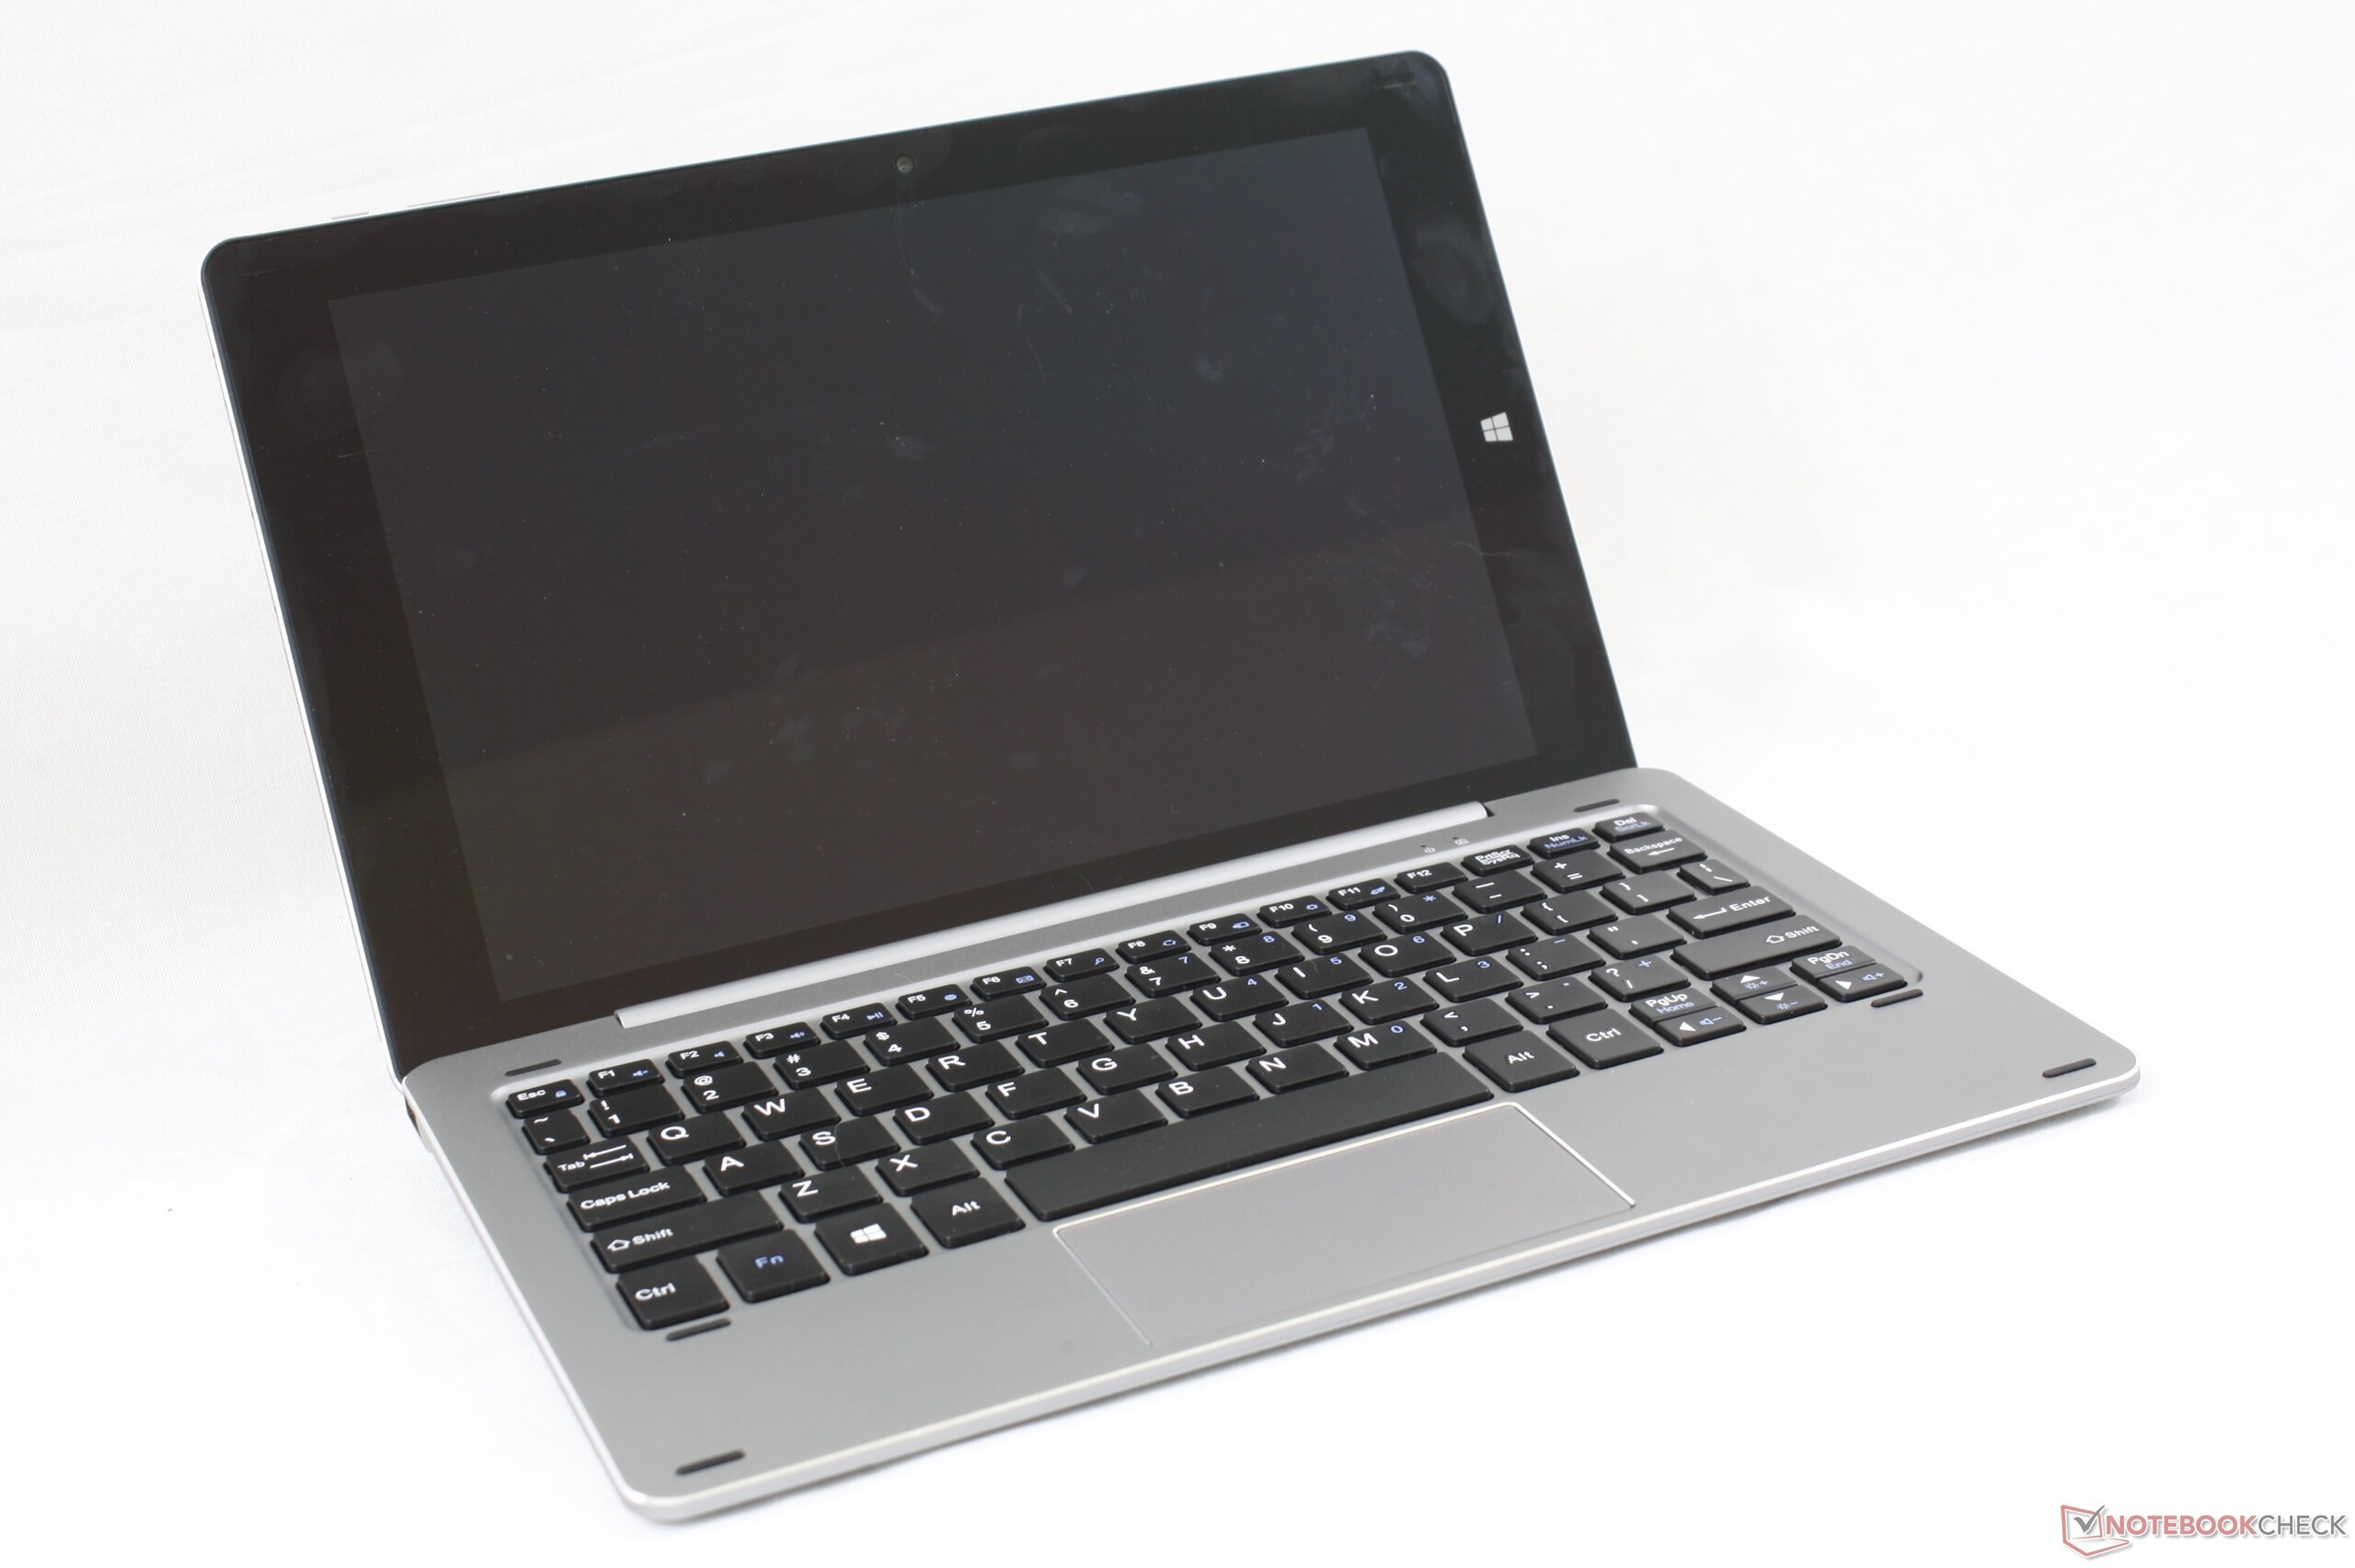
Recensione del Convertibile Chuwi Hi10 X: Chassis in metallo per $230 USD
Punteggio | Data | Modello | Peso | Altezza | Dimensione | Risoluzione | Prezzo |
|---|---|---|---|---|---|---|---|
| 69.1 % v7 (old) | 05/2020 | Chuwi Hi10 X Celeron N4100, UHD Graphics 600 | 600 gr | 8.8 mm | 10.10" | 1920x1200 | |
| 83.3 % v7 (old) | 10/2018 | Microsoft Surface Go MHN-00003 Pentium 4415Y, UHD Graphics 615 | 523 gr | 8.3 mm | 10.00" | 1800x1200 | |
| 80.4 % v6 (old) | 08/2017 | Lenovo IdeaPad Miix 320-10ICR Pro LTE Z8350, HD Graphics 400 (Braswell) | 1 kg | 17.5 mm | 10.10" | 1920x1200 | |
| 77.3 % v6 (old) | 12/2018 | HP x2 210 G2 Z8350, HD Graphics 400 (Braswell) | 1.2 kg | 23.5 mm | 10.10" | 1280x800 | |
| 67.7 % v7 (old) | 04/2020 | Jumper EZbook X3 Celeron N3350, HD Graphics 500 | 1.3 kg | 18 mm | 13.30" | 1920x1080 |
| SD Card Reader | |
| average JPG Copy Test (av. of 3 runs) | |
| Microsoft Surface Go MHN-00003 (Toshiba Exceria Pro M501) | |
| HP x2 210 G2 (Toshiba Exceria Pro M501 microSDXC 64GB) | |
| Jumper EZbook X3 | |
| Chuwi Hi10 X (Toshiba Exceria Pro M501 64 GB UHS-II) | |
| Acer TravelMate Spin B1 B118-G2-RN-P7ED (Toshiba Exceria Pro SDXC 64 GB UHS-II) | |
| Dell Latitude 3400 (Toshiba Exceria Pro SDXC 64 GB UHS-II) | |
| LincPlus P1 | |
| maximum AS SSD Seq Read Test (1GB) | |
| Microsoft Surface Go MHN-00003 (Toshiba Exceria Pro M501) | |
| HP x2 210 G2 (Toshiba Exceria Pro M501 microSDXC 64GB) | |
| Dell Latitude 3400 (Toshiba Exceria Pro SDXC 64 GB UHS-II) | |
| Acer TravelMate Spin B1 B118-G2-RN-P7ED (Toshiba Exceria Pro SDXC 64 GB UHS-II) | |
| Jumper EZbook X3 | |
| LincPlus P1 | |
| Chuwi Hi10 X (Toshiba Exceria Pro M501 64 GB UHS-II) | |
| Networking | |
| iperf3 transmit AX12 | |
| HP x2 210 G2 | |
| Microsoft Surface Go MHN-00003 | |
| Chuwi Hi10 X | |
| Lenovo IdeaPad Miix 320-10ICR Pro LTE | |
| iperf3 receive AX12 | |
| Microsoft Surface Go MHN-00003 | |
| HP x2 210 G2 | |
| Chuwi Hi10 X | |
| Lenovo IdeaPad Miix 320-10ICR Pro LTE | |


| |||||||||||||||||||||||||
Distribuzione della luminosità: 93 %
Al centro con la batteria: 256.3 cd/m²
Contrasto: 625:1 (Nero: 0.41 cd/m²)
ΔE ColorChecker Calman: 10.04 | ∀{0.5-29.43 Ø4.73}
calibrated: 2.17
ΔE Greyscale Calman: 10.4 | ∀{0.09-98 Ø4.97}
96.7% sRGB (Argyll 1.6.3 3D)
63% AdobeRGB 1998 (Argyll 1.6.3 3D)
68.9% AdobeRGB 1998 (Argyll 3D)
96.8% sRGB (Argyll 3D)
67.9% Display P3 (Argyll 3D)
Gamma: 2.23
CCT: 10211 K
| Chuwi Hi10 X AU Optronics AUO17D8, IPS, 10.1", 1920x1200 | Amazon Fire HD 10 2019 IPS, 10.1", 1920x1200 | Samsung Galaxy Tab A 10.1 2019 TFT-LCD, 10.1", 1920x1200 | Chuwi HiPad IPS, 10.1", 1920x1200 | Microsoft Surface Go MHN-00003 Sharp SHP14A6, IPS, 10", 1800x1200 | Lenovo IdeaPad Miix 320-10ICR Pro LTE YF102, MS_9003, IPS, 10.1", 1920x1200 | |
|---|---|---|---|---|---|---|
| Display | -1% | -18% | ||||
| Display P3 Coverage (%) | 67.9 | 66.5 -2% | 54.2 -20% | |||
| sRGB Coverage (%) | 96.8 | 97.5 1% | 81.4 -16% | |||
| AdobeRGB 1998 Coverage (%) | 68.9 | 67.5 -2% | 56 -19% | |||
| Response Times | -34% | -52% | -39% | -25% | -2% | |
| Response Time Grey 50% / Grey 80% * (ms) | 30.4 ? | 49.6 ? -63% | 52.8 ? -74% | 33.2 ? -9% | 44 ? -45% | 32 ? -5% |
| Response Time Black / White * (ms) | 24.4 ? | 25.6 ? -5% | 31.6 ? -30% | 41.2 ? -69% | 25.6 ? -5% | 24 ? 2% |
| PWM Frequency (Hz) | 1020 ? | 19000 ? | ||||
| Screen | 38% | 39% | 36% | 55% | 12% | |
| Brightness middle (cd/m²) | 256.3 | 449 75% | 401 56% | 408.7 59% | 456 78% | 251 -2% |
| Brightness (cd/m²) | 255 | 425 67% | 396 55% | 396 55% | 426 67% | 244 -4% |
| Brightness Distribution (%) | 93 | 89 -4% | 86 -8% | 85 -9% | 88 -5% | 79 -15% |
| Black Level * (cd/m²) | 0.41 | 0.6 -46% | 0.5 -22% | 0.51 -24% | 0.31 24% | 0.33 20% |
| Contrast (:1) | 625 | 748 20% | 802 28% | 801 28% | 1471 135% | 761 22% |
| Colorchecker dE 2000 * | 10.04 | 3.1 69% | 2.9 71% | 4.13 59% | 1.3 87% | 5.34 47% |
| Colorchecker dE 2000 max. * | 17.49 | 6.4 63% | 5.8 67% | 7.34 58% | 3 83% | 9.91 43% |
| Colorchecker dE 2000 calibrated * | 2.17 | 1.1 49% | ||||
| Greyscale dE 2000 * | 10.4 | 3.8 63% | 4.1 61% | 4.4 58% | 1.4 87% | 6.04 42% |
| Gamma | 2.23 99% | 2.09 105% | 2.36 93% | 2.24 98% | 2.24 98% | 3.23 68% |
| CCT | 10211 64% | 7202 90% | 7263 89% | 7389 88% | 6687 97% | 7491 87% |
| Color Space (Percent of AdobeRGB 1998) (%) | 63 | 62.3 -1% | 51 -19% | |||
| Color Space (Percent of sRGB) (%) | 96.7 | 96.8 0% | 81 -16% | |||
| Media totale (Programma / Settaggio) | 2% /
24% | -7% /
20% | -2% /
21% | 10% /
34% | -3% /
4% |
* ... Meglio usare valori piccoli
Tempi di risposta del Display
| ↔ Tempi di risposta dal Nero al Bianco | ||
|---|---|---|
| 24.4 ms ... aumenta ↗ e diminuisce ↘ combinato | ↗ 12.4 ms Incremento | 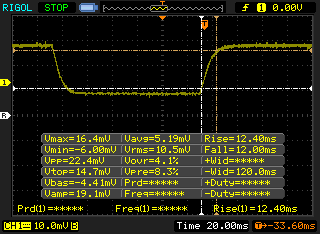 |
| ↘ 12 ms Calo | ||
| Lo schermo mostra buoni tempi di risposta durante i nostri tests, ma potrebbe essere troppo lento per i gamers competitivi. In confronto, tutti i dispositivi di test variano da 0.1 (minimo) a 240 (massimo) ms. » 57 % di tutti i dispositivi è migliore. Questo significa che i tempi di risposta rilevati sono peggiori rispetto alla media di tutti i dispositivi testati (19.9 ms). | ||
| ↔ Tempo di risposta dal 50% Grigio all'80% Grigio | ||
| 30.4 ms ... aumenta ↗ e diminuisce ↘ combinato | ↗ 18.8 ms Incremento | 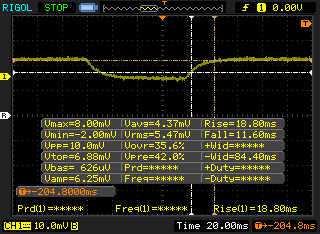 |
| ↘ 11.6 ms Calo | ||
| Lo schermo mostra tempi di risposta lenti nei nostri tests e sarà insoddisfacente per i gamers. In confronto, tutti i dispositivi di test variano da 0.165 (minimo) a 636 (massimo) ms. » 41 % di tutti i dispositivi è migliore. Questo significa che i tempi di risposta rilevati sono simili alla media di tutti i dispositivi testati (31.1 ms). | ||
Sfarfallio dello schermo / PWM (Pulse-Width Modulation)
| flickering dello schermo / PWM non rilevato | 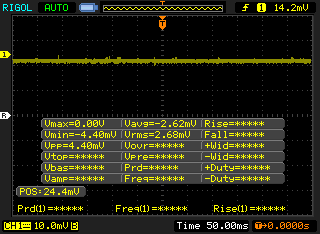 | ||
In confronto: 52 % di tutti i dispositivi testati non utilizza PWM per ridurre la luminosita' del display. Se è rilevato PWM, una media di 7798 (minimo: 5 - massimo: 343500) Hz è stata rilevata. | |||
Cinebench R20: CPU (Single Core) | CPU (Multi Core)
Blender: v2.79 BMW27 CPU
7-Zip 18.03: 7z b 4 -mmt1 | 7z b 4
Geekbench 5.5: Single-Core | Multi-Core
HWBOT x265 Benchmark v2.2: 4k Preset
LibreOffice : 20 Documents To PDF
R Benchmark 2.5: Overall mean
| Cinebench R15 / CPU Multi 64Bit | |
| Dell XPS 13 7390 2-in-1 Core i3 | |
| Dell Latitude 3400 | |
| Acer TravelMate Spin B1 B118-G2-RN-P7ED | |
| Media Intel Celeron N4100 (161 - 254, n=12) | |
| Dell Venue 11 Pro 7140 | |
| Chuwi Hi10 X | |
| Microsoft Surface Go MHN-00003 | |
| Lhmzniy A9 15.6 | |
| LincPlus P1 | |
| HP x2 210 G2 | |
| Lenovo IdeaPad Miix 320-10ICR Pro LTE | |
| Jumper EZbook X3 | |
| Cinebench R15 / CPU Single 64Bit | |
| Dell XPS 13 7390 2-in-1 Core i3 | |
| Dell Latitude 3400 | |
| Dell Venue 11 Pro 7140 | |
| Acer TravelMate Spin B1 B118-G2-RN-P7ED | |
| LincPlus P1 | |
| Chuwi Hi10 X | |
| Media Intel Celeron N4100 (62 - 71, n=12) | |
| Microsoft Surface Go MHN-00003 | |
| Jumper EZbook X3 | |
| Lenovo IdeaPad Miix 320-10ICR Pro LTE | |
| HP x2 210 G2 | |
| Cinebench R20 / CPU (Single Core) | |
| Dell XPS 13 7390 2-in-1 Core i3 | |
| Dell Latitude 3400 | |
| LincPlus P1 | |
| Chuwi Hi10 X | |
| Media Intel Celeron N4100 (151 - 155, n=7) | |
| Jumper EZbook X3 | |
| Cinebench R20 / CPU (Multi Core) | |
| Dell XPS 13 7390 2-in-1 Core i3 | |
| Dell Latitude 3400 | |
| Media Intel Celeron N4100 (368 - 560, n=7) | |
| Chuwi Hi10 X | |
| LincPlus P1 | |
| Jumper EZbook X3 | |
| Lhmzniy A9 15.6 | |
| Blender / v2.79 BMW27 CPU | |
| Jumper EZbook X3 | |
| LincPlus P1 | |
| Chuwi Hi10 X | |
| Media Intel Celeron N4100 (2437 - 3527, n=7) | |
| Dell XPS 13 7390 2-in-1 Core i3 | |
| 7-Zip 18.03 / 7z b 4 -mmt1 | |
| Dell XPS 13 7390 2-in-1 Core i3 | |
| LincPlus P1 | |
| Media Intel Celeron N4100 (2125 - 2459, n=7) | |
| Chuwi Hi10 X | |
| Jumper EZbook X3 | |
| 7-Zip 18.03 / 7z b 4 | |
| Dell XPS 13 7390 2-in-1 Core i3 | |
| Media Intel Celeron N4100 (5620 - 7835, n=7) | |
| Chuwi Hi10 X | |
| LincPlus P1 | |
| Jumper EZbook X3 | |
| Geekbench 5.5 / Single-Core | |
| LincPlus P1 | |
| Lhmzniy A9 15.6 | |
| Chuwi Hi10 X | |
| Media Intel Celeron N4100 (378 - 414, n=7) | |
| Jumper EZbook X3 | |
| Geekbench 5.5 / Multi-Core | |
| Media Intel Celeron N4100 (1082 - 1419, n=7) | |
| Chuwi Hi10 X | |
| Lhmzniy A9 15.6 | |
| LincPlus P1 | |
| Jumper EZbook X3 | |
| HWBOT x265 Benchmark v2.2 / 4k Preset | |
| Dell XPS 13 7390 2-in-1 Core i3 | |
| Media Intel Celeron N4100 (0.974 - 1.5, n=6) | |
| Microsoft Surface Go MHN-00003 | |
| Chuwi Hi10 X | |
| LincPlus P1 | |
| Jumper EZbook X3 | |
| LibreOffice / 20 Documents To PDF | |
| Jumper EZbook X3 | |
| Media Intel Celeron N4100 (155 - 178, n=5) | |
| Chuwi Hi10 X | |
| LincPlus P1 | |
| R Benchmark 2.5 / Overall mean | |
| Jumper EZbook X3 | |
| Media Intel Celeron N4100 (1.75 - 1.786, n=5) | |
| Chuwi Hi10 X | |
| LincPlus P1 | |
* ... Meglio usare valori piccoli
| PCMark 8 Home Score Accelerated v2 | 1670 punti | |
| PCMark 8 Work Score Accelerated v2 | 2738 punti | |
| PCMark 10 Score | 1527 punti | |
Aiuto | ||
| DPC Latencies / LatencyMon - interrupt to process latency (max), Web, Youtube, Prime95 | |
| Chuwi Hi10 X | |
* ... Meglio usare valori piccoli
| Chuwi Hi10 X SanDisk DF4128 | Microsoft Surface Go MHN-00003 64 GB eMMC Flash | Lenovo IdeaPad Miix 320-10ICR Pro LTE SanDisk DF4128 | HP x2 210 G2 64 GB eMMC Flash | Dell Venue 11 Pro 7140 Sandisk X110 M.2 SD6SP1M-128G | |
|---|---|---|---|---|---|
| AS SSD | 83% | -22% | 382% | ||
| Seq Read (MB/s) | 258.5 | 289.8 12% | 127.5 -51% | 405.4 57% | |
| Seq Write (MB/s) | 120.8 | 126.7 5% | 41.75 -65% | 134.7 12% | |
| 4K Read (MB/s) | 5.94 | 18.29 208% | 5.51 -7% | 19.3 225% | |
| 4K Write (MB/s) | 12.4 | 35.07 183% | 7.42 -40% | 33.22 168% | |
| 4K-64 Read (MB/s) | 25.96 | 40.27 55% | 28.99 12% | 242 832% | |
| 4K-64 Write (MB/s) | 10.16 | 44.48 338% | 12.91 27% | 152.5 1401% | |
| Access Time Read * (ms) | 0.597 | 0.151 75% | 0.454 24% | 0.16 73% | |
| Access Time Write * (ms) | 1.105 | 0.233 79% | 0.896 19% | 0.104 91% | |
| Score Read (Points) | 58 | 88 52% | 47 -19% | 302 421% | |
| Score Write (Points) | 35 | 92 163% | 28 -20% | 199 469% | |
| Score Total (Points) | 117 | 225 92% | 94 -20% | 648 454% | |
| Copy ISO MB/s (MB/s) | 130.2 | 99.1 -24% | 57.2 -56% | ||
| Copy Program MB/s (MB/s) | 88.3 | 44.34 -50% | 36.15 -59% | ||
| Copy Game MB/s (MB/s) | 103.8 | 76.5 -26% | 51.4 -50% | ||
| CrystalDiskMark 5.2 / 6 | 77% | 17% | |||
| Write 4K (MB/s) | 12.85 | 26.91 109% | 18.11 41% | ||
| Read 4K (MB/s) | 10.02 | 19.72 97% | 15.77 57% | ||
| Write Seq (MB/s) | 120.8 | 126.2 4% | 62.5 -48% | ||
| Read Seq (MB/s) | 259.7 | 268 3% | 121.8 -53% | ||
| Write 4K Q32T1 (MB/s) | 15.17 | 62.9 315% | 31.72 109% | ||
| Read 4K Q32T1 (MB/s) | 33.09 | 39.82 20% | 48.64 47% | ||
| Write Seq Q32T1 (MB/s) | 108.8 | 131.3 21% | 95.6 -12% | ||
| Read Seq Q32T1 (MB/s) | 180.1 | 259.3 44% | 166.5 -8% | ||
| Media totale (Programma / Settaggio) | 80% /
81% | -22% /
-22% | 17% /
17% | 382% /
382% |
* ... Meglio usare valori piccoli

| 3DMark 11 | |
| 1280x720 Performance GPU | |
| Dell XPS 13 7390 2-in-1 Core i3 | |
| Dell Latitude 3400 | |
| Microsoft Surface Go MHN-00003 | |
| Dell Venue 11 Pro 7140 | |
| Acer TravelMate Spin B1 B118-G2-RN-P7ED | |
| Media Intel UHD Graphics 600 (410 - 854, n=27) | |
| Chuwi Hi10 X | |
| HP x2 210 G2 | |
| Lenovo IdeaPad Miix 320-10ICR Pro LTE | |
| 1280x720 Performance Combined | |
| Dell XPS 13 7390 2-in-1 Core i3 | |
| Dell Latitude 3400 | |
| Microsoft Surface Go MHN-00003 | |
| Dell Venue 11 Pro 7140 | |
| Acer TravelMate Spin B1 B118-G2-RN-P7ED | |
| Media Intel UHD Graphics 600 (362 - 983, n=27) | |
| HP x2 210 G2 | |
| Chuwi Hi10 X | |
| Lenovo IdeaPad Miix 320-10ICR Pro LTE | |
| 3DMark | |
| 1280x720 Cloud Gate Standard Graphics | |
| Dell XPS 13 7390 2-in-1 Core i3 | |
| Dell Latitude 3400 | |
| Microsoft Surface Go MHN-00003 | |
| Dell Venue 11 Pro 7140 | |
| Acer TravelMate Spin B1 B118-G2-RN-P7ED | |
| Media Intel UHD Graphics 600 (2346 - 4958, n=20) | |
| Chuwi Hi10 X | |
| HP x2 210 G2 | |
| 1920x1080 Fire Strike Graphics | |
| Dell XPS 13 7390 2-in-1 Core i3 | |
| Dell Latitude 3400 | |
| Microsoft Surface Go MHN-00003 | |
| Dell Venue 11 Pro 7140 | |
| Acer TravelMate Spin B1 B118-G2-RN-P7ED | |
| Media Intel UHD Graphics 600 (307 - 637, n=21) | |
| LincPlus P1 | |
| Jumper EZbook X3 | |
| Chuwi Hi10 X | |
| HP x2 210 G2 | |
| 1920x1080 Ice Storm Extreme Graphics | |
| Dell XPS 13 7390 2-in-1 Core i3 | |
| Microsoft Surface Go MHN-00003 | |
| Dell Latitude 3400 | |
| Media Intel UHD Graphics 600 (8277 - 19919, n=12) | |
| 2560x1440 Time Spy Graphics | |
| Dell Latitude 3400 | |
| Media Intel UHD Graphics 600 (85 - 124, n=12) | |
| Chuwi Hi10 X | |
| 3DMark 11 Performance | 519 punti | |
| 3DMark Ice Storm Standard Score | 14062 punti | |
| 3DMark Cloud Gate Standard Score | 2346 punti | |
| 3DMark Fire Strike Score | 327 punti | |
| 3DMark Time Spy Score | 107 punti | |
Aiuto | ||
| basso | medio | alto | ultra | |
|---|---|---|---|---|
| Dota 2 Reborn (2015) | 19.1 | 12.4 | 5.9 | 5.7 |
| X-Plane 11.11 (2018) | 3.94 | 3.48 | 3.18 |
(±) La temperatura massima sul lato superiore è di 41.8 °C / 107 F, rispetto alla media di 35.4 °C / 96 F, che varia da 19.6 a 60 °C per questa classe Convertible.
(±) Il lato inferiore si riscalda fino ad un massimo di 42.8 °C / 109 F, rispetto alla media di 36.9 °C / 98 F
(+) In idle, la temperatura media del lato superiore è di 28.6 °C / 83 F, rispetto alla media deld ispositivo di 30.3 °C / 87 F.
(±) I poggiapolsi e il touchpad possono diventare molto caldi al tatto con un massimo di 39 °C / 102.2 F.
(-) La temperatura media della zona del palmo della mano di dispositivi simili e'stata di 28 °C / 82.4 F (-11 °C / -19.8 F).
Chuwi Hi10 X analisi audio
(-) | altoparlanti non molto potenti (71 dB)
Bassi 100 - 315 Hz
(±) | bassi ridotti - in media 14.4% inferiori alla media
(+) | bassi in lineaa (5.2% delta rispetto alla precedente frequenza)
Medi 400 - 2000 Hz
(±) | medi elevati - circa 6.2% superiore alla media
(±) | linearità dei medi adeguata (14.8% delta rispetto alla precedente frequenza)
Alti 2 - 16 kHz
(±) | alti elevati - circa 7.3% superiori alla media
(-) | alti non lineari (21.2% delta rispetto alla precedente frequenza)
Nel complesso 100 - 16.000 Hz
(-) | suono nel complesso non lineare (44.6% di differenza rispetto alla media
Rispetto alla stessa classe
» 99% di tutti i dispositivi testati in questa classe è stato migliore, 0% simile, 1% peggiore
» Il migliore ha avuto un delta di 6%, medio di 20%, peggiore di 57%
Rispetto a tutti i dispositivi testati
» 96% di tutti i dispositivi testati in questa classe è stato migliore, 0% similare, 4% peggiore
» Il migliore ha avuto un delta di 4%, medio di 24%, peggiore di 134%
Apple MacBook 12 (Early 2016) 1.1 GHz analisi audio
(+) | gli altoparlanti sono relativamente potenti (83.6 dB)
Bassi 100 - 315 Hz
(±) | bassi ridotti - in media 11.3% inferiori alla media
(±) | la linearità dei bassi è media (14.2% delta rispetto alla precedente frequenza)
Medi 400 - 2000 Hz
(+) | medi bilanciati - solo only 2.4% rispetto alla media
(+) | medi lineari (5.5% delta rispetto alla precedente frequenza)
Alti 2 - 16 kHz
(+) | Alti bilanciati - appena 2% dalla media
(+) | alti lineari (4.5% delta rispetto alla precedente frequenza)
Nel complesso 100 - 16.000 Hz
(+) | suono nel complesso lineare (10.2% differenza dalla media)
Rispetto alla stessa classe
» 7% di tutti i dispositivi testati in questa classe è stato migliore, 2% simile, 91% peggiore
» Il migliore ha avuto un delta di 5%, medio di 18%, peggiore di 53%
Rispetto a tutti i dispositivi testati
» 5% di tutti i dispositivi testati in questa classe è stato migliore, 1% similare, 94% peggiore
» Il migliore ha avuto un delta di 4%, medio di 24%, peggiore di 134%
| Off / Standby | |
| Idle | |
| Sotto carico |
|
Leggenda:
min: | |
| Chuwi Hi10 X Celeron N4100, UHD Graphics 600, SanDisk DF4128, IPS, 1920x1200, 10.1" | Microsoft Surface Go MHN-00003 Pentium 4415Y, UHD Graphics 615, 64 GB eMMC Flash, IPS, 1800x1200, 10" | Lenovo IdeaPad Miix 320-10ICR Pro LTE Z8350, HD Graphics 400 (Braswell), SanDisk DF4128, IPS, 1920x1200, 10.1" | HP x2 210 G2 Z8350, HD Graphics 400 (Braswell), 64 GB eMMC Flash, IPS, 1280x800, 10.1" | Dell Venue 11 Pro 7140 5Y10a, HD Graphics 5300, Sandisk X110 M.2 SD6SP1M-128G, IPS, 1920x1080, 10.8" | |
|---|---|---|---|---|---|
| Power Consumption | -10% | 17% | 24% | -1% | |
| Idle Minimum * (Watt) | 3.7 | 2.88 22% | 3 19% | 2.9 22% | 2 46% |
| Idle Average * (Watt) | 6.3 | 4.8 24% | 5.3 16% | 4.8 24% | 5.9 6% |
| Idle Maximum * (Watt) | 6.7 | 7.5 -12% | 6.4 4% | 5.2 22% | 6.2 7% |
| Load Average * (Watt) | 14 | 16.9 -21% | 10.9 22% | 10.4 26% | 19.1 -36% |
| Load Maximum * (Watt) | 14.5 | 23.8 -64% | 11 24% | 10.9 25% | 18.2 -26% |
* ... Meglio usare valori piccoli
| Chuwi Hi10 X Celeron N4100, UHD Graphics 600, 24 Wh | Microsoft Surface Go MHN-00003 Pentium 4415Y, UHD Graphics 615, 28 Wh | Lenovo IdeaPad Miix 320-10ICR Pro LTE Z8350, HD Graphics 400 (Braswell), 33.3 Wh | HP x2 210 G2 Z8350, HD Graphics 400 (Braswell), 32.5 Wh | Dell Venue 11 Pro 7140 5Y10a, HD Graphics 5300, 38 Wh | Lenovo Yoga Smart Tab YT-X705F SD 439, Adreno 505, 27 Wh | |
|---|---|---|---|---|---|---|
| Autonomia della batteria | 34% | 38% | 64% | 138% | ||
| WiFi v1.3 (h) | 5.6 | 7.5 34% | 7.7 38% | 9.2 64% | 13.3 138% | |
| Reader / Idle (h) | 12.9 | 13 | 34.7 | |||
| Load (h) | 3 | 4.1 | 4.8 | |||
| WiFi (h) | 9.4 |
Pro
Contro
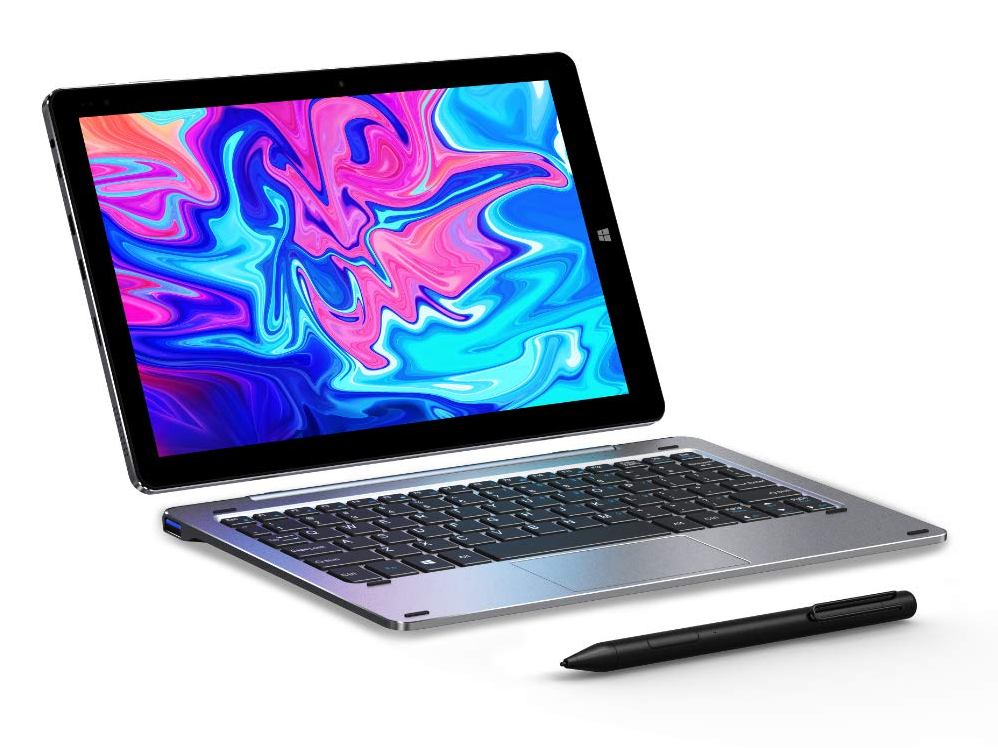
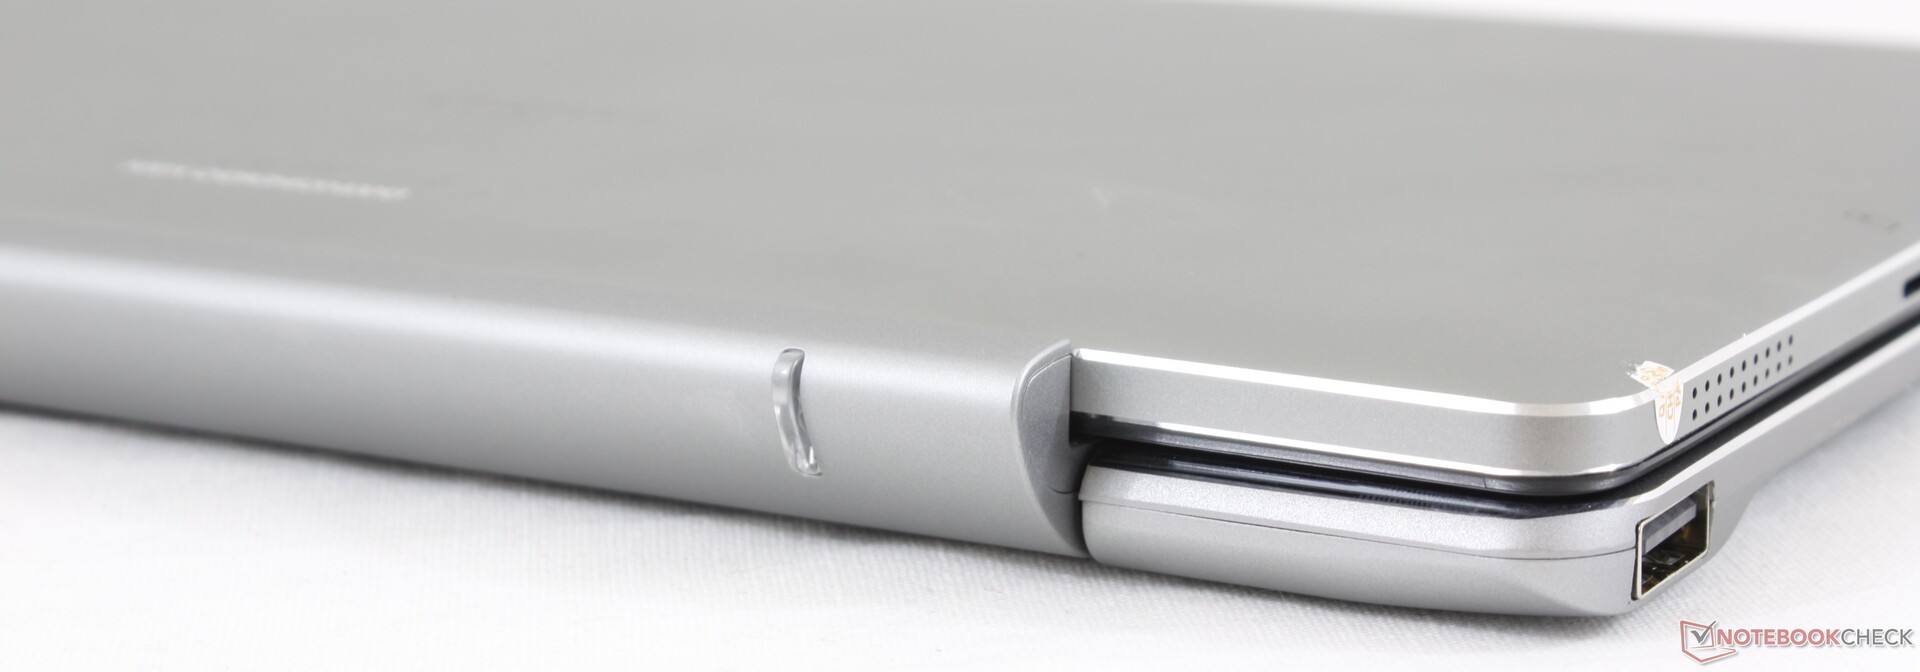
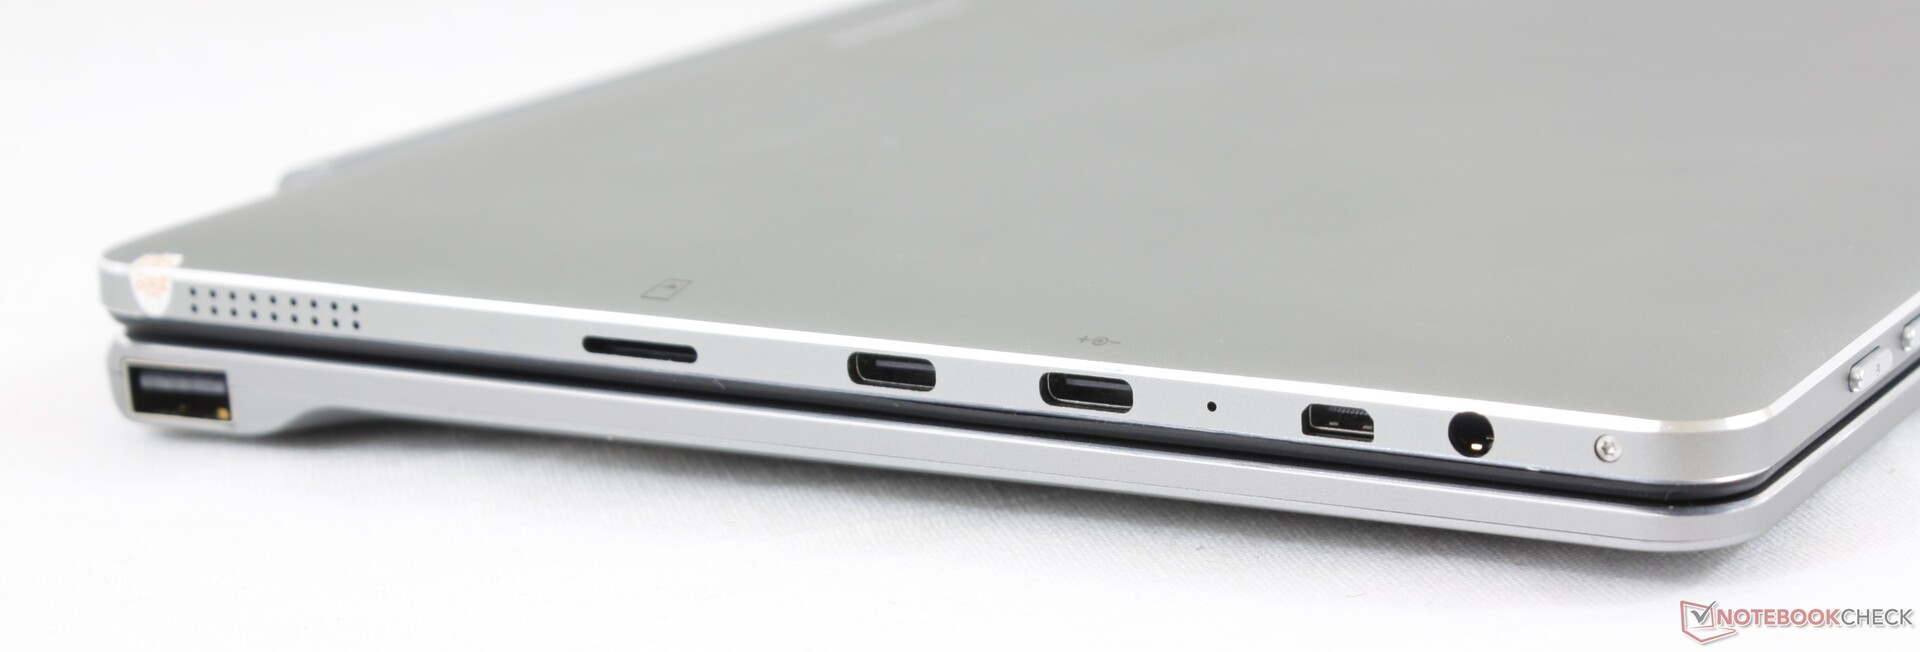
Ci sono alcune qualità che riscattano il Chuwi Hi10 X. Il robusto telaio e la base della tastiera lasciano una prima impressione solida, considerando il prezzo basso e il numero di opzioni di porte integrate è lodevole. Sfortunatamente, queste non compensano l'inaffidabile clickpad, le cerniere traballanti, l'oscuramento del display o il ritardo di Windows. Cercare di utilizzare il tablet all'esterno o anche all'interno senza un mouse dedicato può essere frustrante. Questo è più che altro un tablet di backup per Windows o un tablet per una navigazione leggera e lo streaming video, perché qualsiasi cosa più pesante lo rallenterà a fatica.
Un tablet Windows decente per bassi carichi di elaborazione o anche come HTPC solo per lo streaming video. Per il resto, il clickpad è inaffidabile e il display è troppo timido per le condizioni esterne.
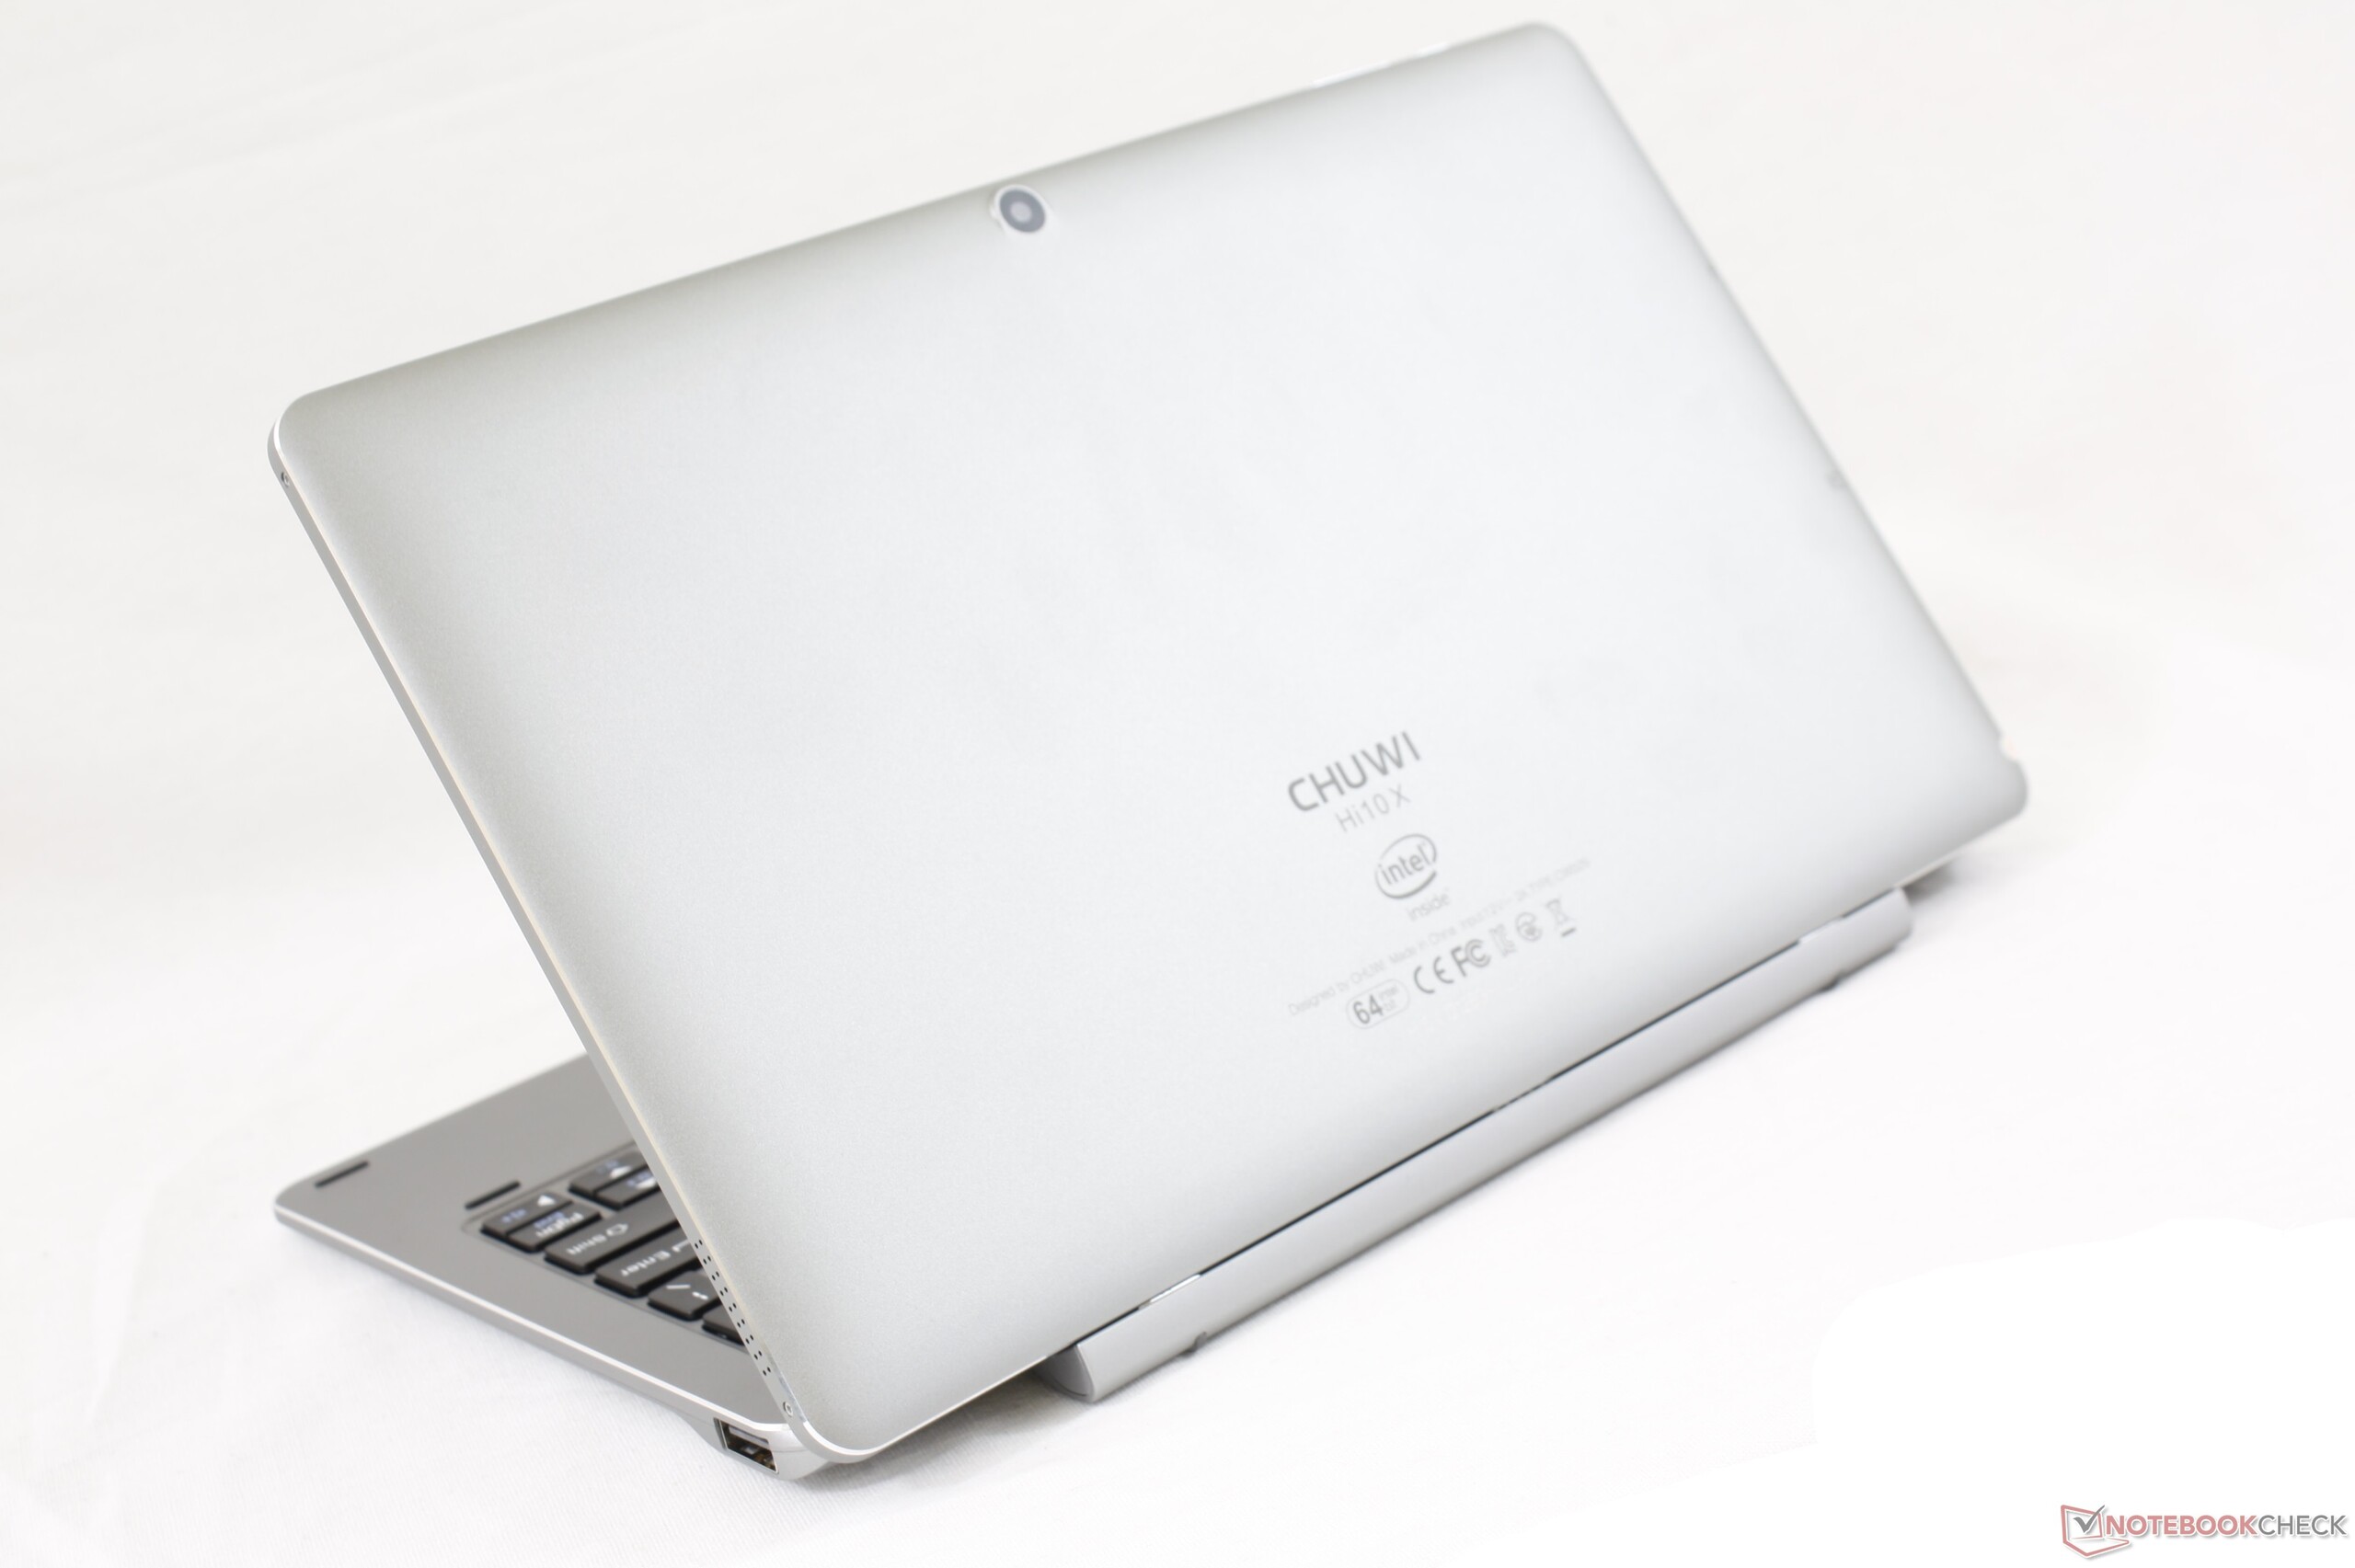
Chuwi Hi10 X
- 05/05/2020 v7 (old)
Allen Ngo
Price comparison
