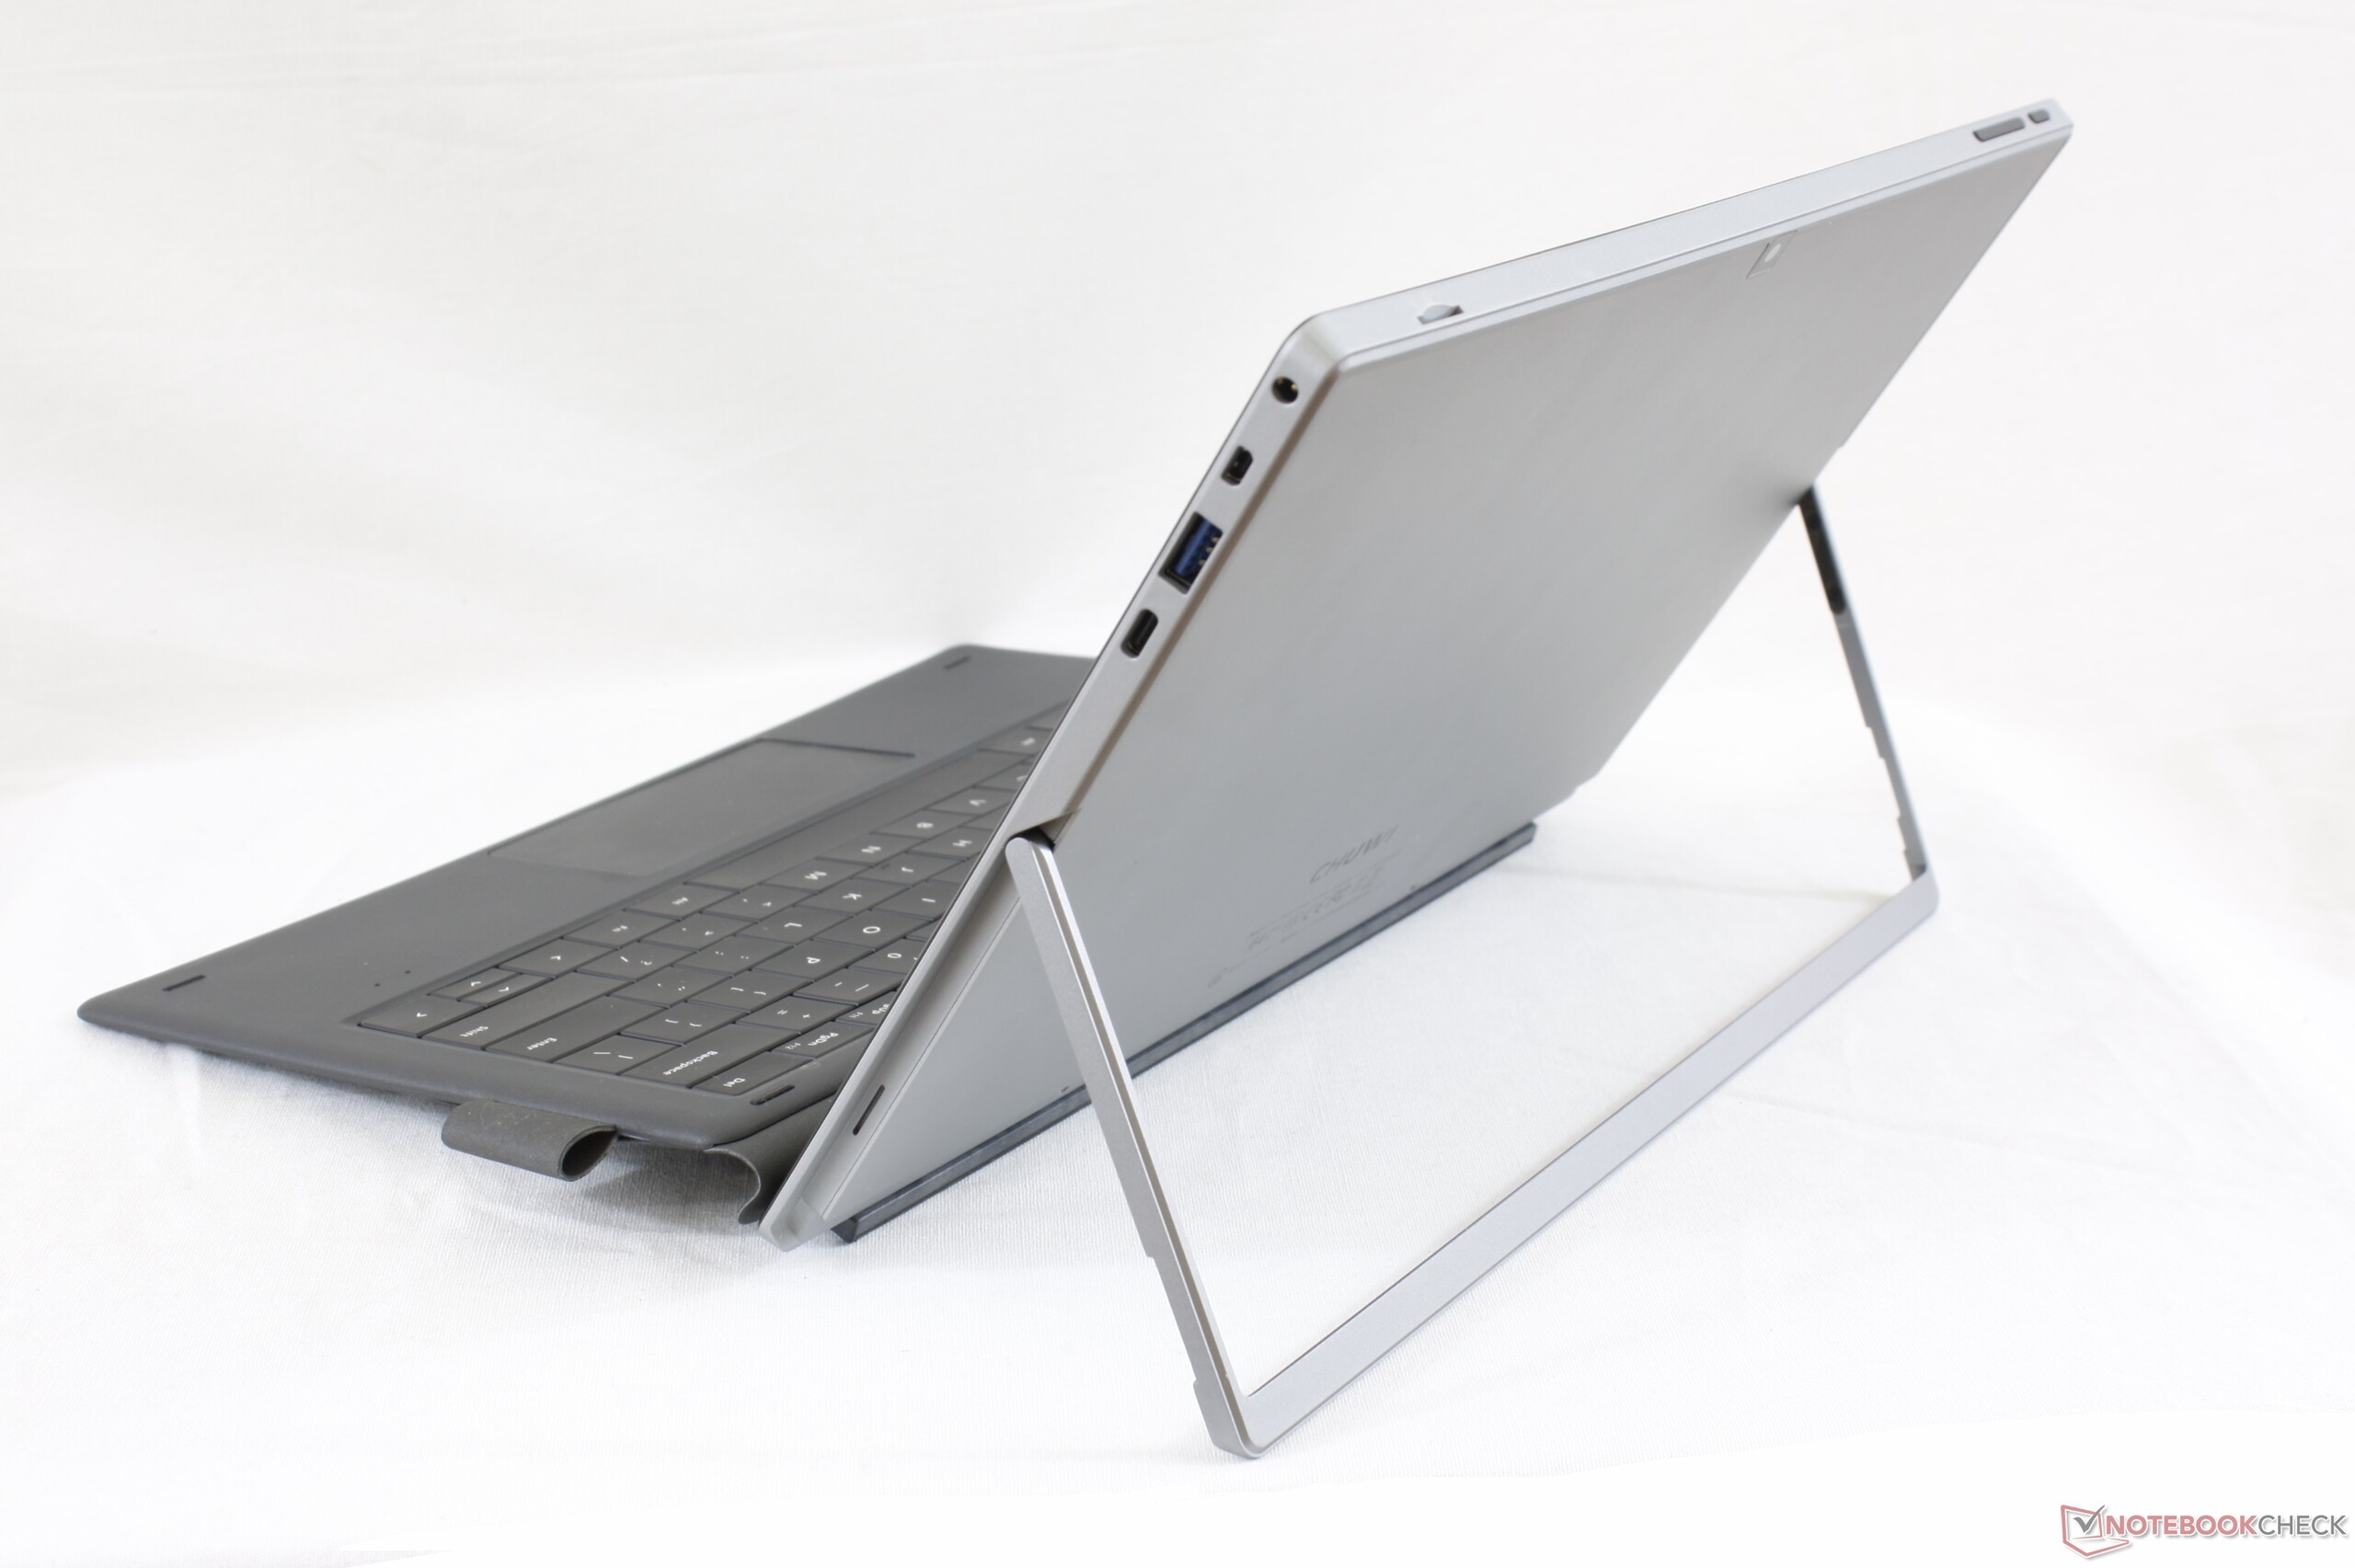
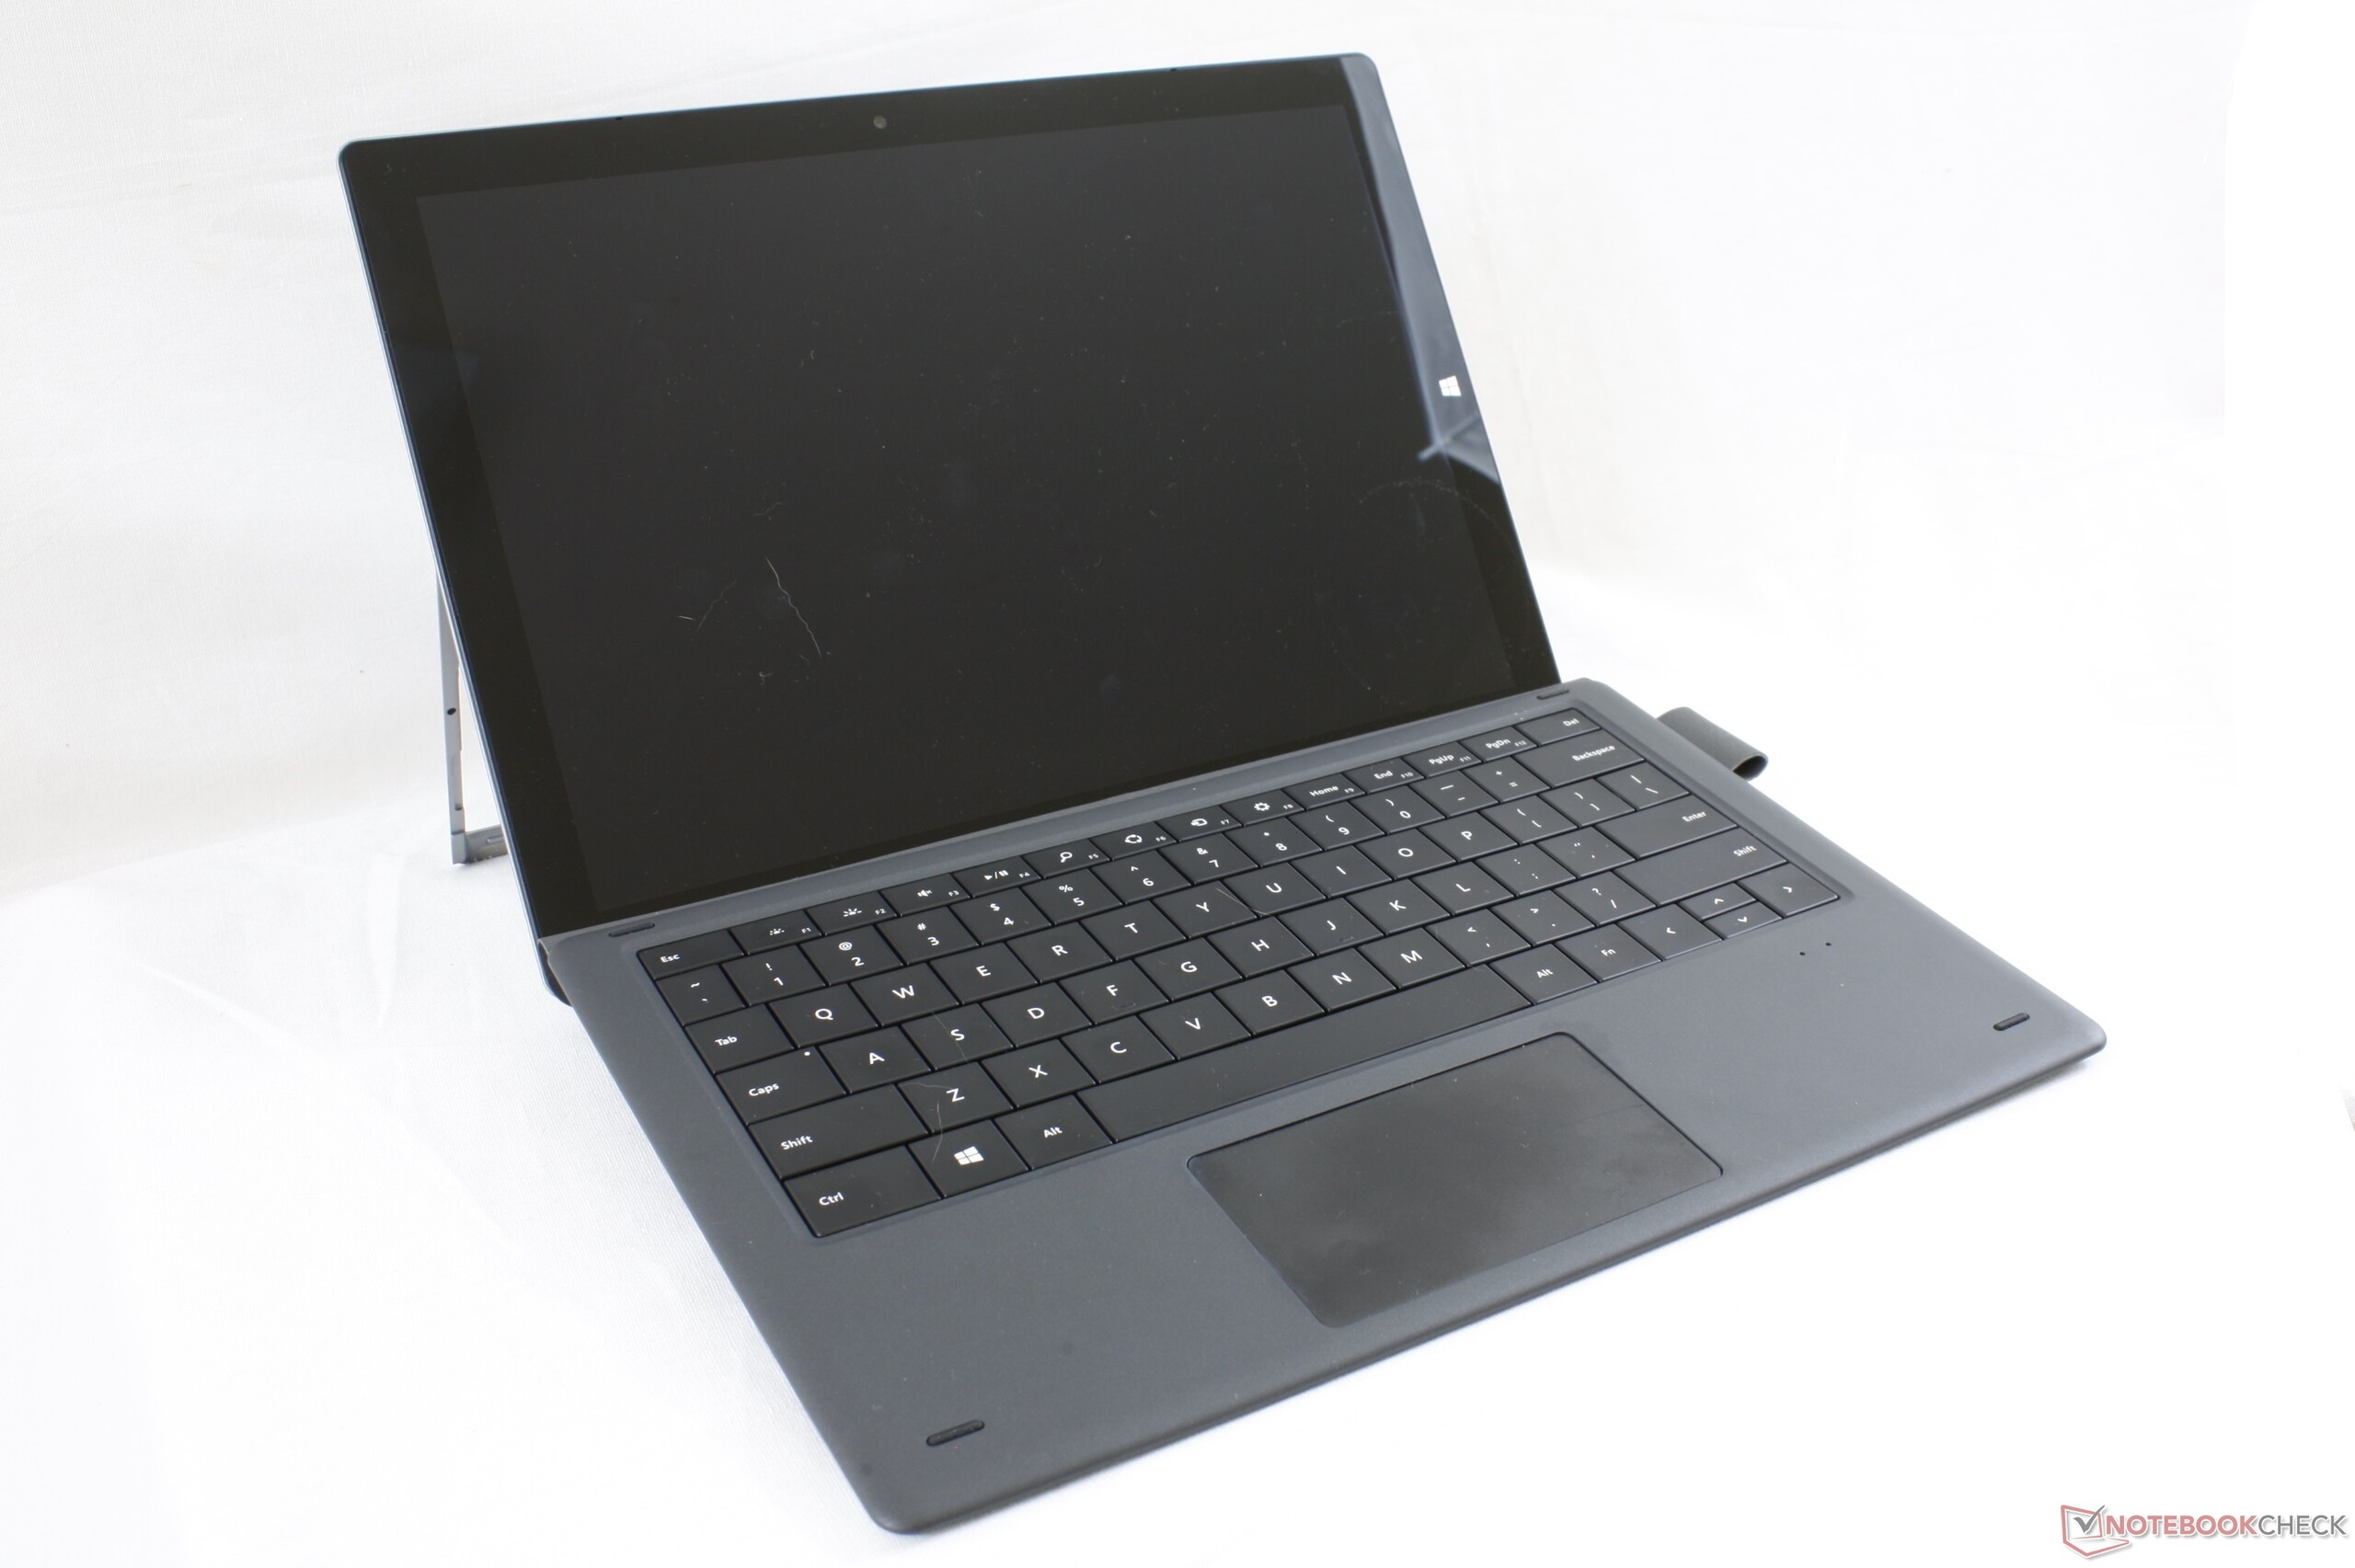
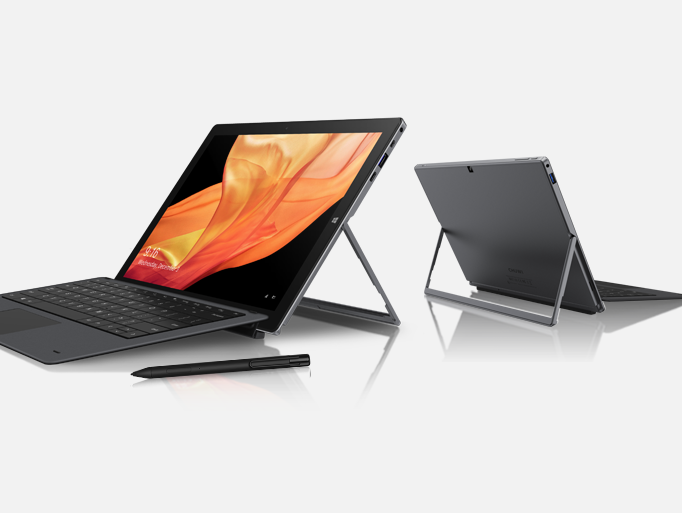
Recensione del Tablet Chuwi UBook Pro: il clone del Microsoft Surface Pro
Punteggio | Data | Modello | Peso | Altezza | Dimensione | Risoluzione | Prezzo |
|---|---|---|---|---|---|---|---|
| 70.1 % v7 (old) | 11/2019 | Chuwi UBook Pro m3-8100Y, UHD Graphics 615 | 780 gr | 9 mm | 12.30" | 1920x1280 | |
| 87.2 % v7 (old) | 11/2018 | Microsoft Surface Pro 6, Core i5, 128 GB i5-8250U, UHD Graphics 620 | 781 gr | 8.5 mm | 12.30" | 2736x1834 | |
| 82.2 % v6 (old) | 12/2017 | Lenovo Miix 520-12IKB 81CG i5-8250U, UHD Graphics 620 | 1.2 kg | 15.9 mm | 12.20" | 1920x1200 | |
| 87 % v7 (old) | 11/2018 | HP Elite x2 1013 G3-2TT14EA i5-8350U, UHD Graphics 620 | 1.2 kg | 7.9 mm | 13.00" | 3000x2000 | |
| 83.3 % v7 (old) | 10/2018 | Microsoft Surface Go MHN-00003 Pentium 4415Y, UHD Graphics 615 | 523 gr | 8.3 mm | 10.00" | 1800x1200 |
| SD Card Reader | |
| average JPG Copy Test (av. of 3 runs) | |
| Dell Latitude 7200 (Toshiba Exceria Pro M501 64 GB UHS-II) | |
| Lenovo Miix 520-12IKB 81CG | |
| Microsoft Surface Pro 6, Core i5, 128 GB (Toshiba Exceria Pro M501 microSDXC 64GB) | |
| Chuwi UBook Pro (Toshiba Exceria Pro M501 64 GB UHS-II) | |
| maximum AS SSD Seq Read Test (1GB) | |
| Dell Latitude 7200 (Toshiba Exceria Pro M501 64 GB UHS-II) | |
| Lenovo Miix 520-12IKB 81CG | |
| Microsoft Surface Pro 6, Core i5, 128 GB (Toshiba Exceria Pro M501 microSDXC 64GB) | |
| Chuwi UBook Pro (Toshiba Exceria Pro M501 64 GB UHS-II) | |
| |||||||||||||||||||||||||
Distribuzione della luminosità: 83 %
Al centro con la batteria: 867.7 cd/m²
Contrasto: 1112:1 (Nero: 0.78 cd/m²)
ΔE ColorChecker Calman: 4.64 | ∀{0.5-29.43 Ø4.71}
calibrated: 2.31
ΔE Greyscale Calman: 6.1 | ∀{0.09-98 Ø4.96}
93.7% sRGB (Argyll 1.6.3 3D)
59% AdobeRGB 1998 (Argyll 1.6.3 3D)
65.1% AdobeRGB 1998 (Argyll 3D)
94% sRGB (Argyll 3D)
63.3% Display P3 (Argyll 3D)
Gamma: 2.22
CCT: 7346 K
| Chuwi UBook Pro BOE TV123WAM-ND0, IPS, 12.3", 1920x1280 | Microsoft Surface Pro 6, Core i5, 128 GB LGPhilips LP123WQ112604, IPS, 12.3", 2736x1834 | Lenovo Miix 520-12IKB 81CG Unknown, IPS, 12.2", 1920x1200 | Dell Latitude 7200 SHP14A3 LQ123N1, IPS LED, 12.3", 1920x1280 | Apple iPad 7 2019 IPS, 10.2", 2160x1620 | HP Elite x2 1013 G3-2TT14EA AU Optronics AUO101A, IPS, 13", 3000x2000 | |
|---|---|---|---|---|---|---|
| Display | 0% | -0% | 10% | 5% | ||
| Display P3 Coverage (%) | 63.3 | 65.5 3% | 64.4 2% | 71.6 13% | 67.5 7% | |
| sRGB Coverage (%) | 94 | 90.4 -4% | 90.8 -3% | 99.5 6% | 96.7 3% | |
| AdobeRGB 1998 Coverage (%) | 65.1 | 65.6 1% | 65.4 0% | 72.6 12% | 68.2 5% | |
| Response Times | -15% | -10% | -50% | 5% | -25% | |
| Response Time Grey 50% / Grey 80% * (ms) | 30.8 ? | 42 ? -36% | 35.6 ? -16% | 52 ? -69% | 38 ? -23% | 47 ? -53% |
| Response Time Black / White * (ms) | 26.8 ? | 25 ? 7% | 28 ? -4% | 34.8 ? -30% | 18 ? 33% | 26 ? 3% |
| PWM Frequency (Hz) | 20800 ? | 198.4 ? | 1645 ? | |||
| Screen | 6% | -28% | 24% | 24% | 3% | |
| Brightness middle (cd/m²) | 867.6 | 463 -47% | 348.8 -60% | 401 -54% | 499 -42% | 452 -48% |
| Brightness (cd/m²) | 818 | 450 -45% | 339 -59% | 385 -53% | 470 -43% | 412 -50% |
| Brightness Distribution (%) | 83 | 83 0% | 87 5% | 88 6% | 87 5% | 85 2% |
| Black Level * (cd/m²) | 0.78 | 0.32 59% | 0.4 49% | 0.28 64% | 0.49 37% | 0.48 38% |
| Contrast (:1) | 1112 | 1447 30% | 872 -22% | 1432 29% | 1018 -8% | 942 -15% |
| Colorchecker dE 2000 * | 4.64 | 3.76 19% | 7 -51% | 1.8 61% | 0.97 79% | 4.05 13% |
| Colorchecker dE 2000 max. * | 9.22 | 7.35 20% | 16.2 -76% | 3.4 63% | 1.98 79% | 6.64 28% |
| Colorchecker dE 2000 calibrated * | 2.31 | 2.68 -16% | 1.1 52% | 1.56 32% | ||
| Greyscale dE 2000 * | 6.1 | 3.18 48% | 10.1 -66% | 1.6 74% | 0.9 85% | 4.87 20% |
| Gamma | 2.22 99% | 2.53 87% | 2.22 99% | 2.14 103% | 2.135 103% | 2.71 81% |
| CCT | 7346 88% | 6994 93% | 9065 72% | 6702 97% | 6571 99% | 7160 91% |
| Color Space (Percent of AdobeRGB 1998) (%) | 59 | 59 0% | 58.7 -1% | 66.6 13% | 62 5% | |
| Color Space (Percent of sRGB) (%) | 93.7 | 90 -4% | 90.9 -3% | 99.4 6% | 97 4% | |
| Media totale (Programma / Settaggio) | -3% /
2% | -13% /
-20% | -5% /
12% | 15% /
20% | -6% /
-0% |
* ... Meglio usare valori piccoli
Tempi di risposta del Display
| ↔ Tempi di risposta dal Nero al Bianco | ||
|---|---|---|
| 26.8 ms ... aumenta ↗ e diminuisce ↘ combinato | ↗ 15.6 ms Incremento | 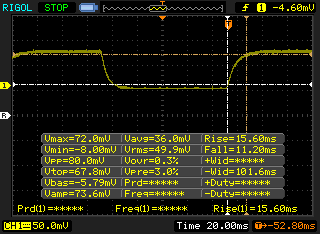 |
| ↘ 11.2 ms Calo | ||
| Lo schermo mostra tempi di risposta relativamente lenti nei nostri tests e potrebbe essere troppo lento per i gamers. In confronto, tutti i dispositivi di test variano da 0.1 (minimo) a 240 (massimo) ms. » 67 % di tutti i dispositivi è migliore. Questo significa che i tempi di risposta rilevati sono peggiori rispetto alla media di tutti i dispositivi testati (19.8 ms). | ||
| ↔ Tempo di risposta dal 50% Grigio all'80% Grigio | ||
| 30.8 ms ... aumenta ↗ e diminuisce ↘ combinato | ↗ 14.8 ms Incremento | 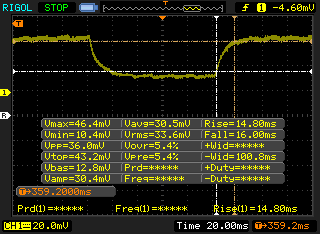 |
| ↘ 16 ms Calo | ||
| Lo schermo mostra tempi di risposta lenti nei nostri tests e sarà insoddisfacente per i gamers. In confronto, tutti i dispositivi di test variano da 0.165 (minimo) a 636 (massimo) ms. » 41 % di tutti i dispositivi è migliore. Questo significa che i tempi di risposta rilevati sono simili alla media di tutti i dispositivi testati (30.9 ms). | ||
Sfarfallio dello schermo / PWM (Pulse-Width Modulation)
| flickering dello schermo / PWM non rilevato | 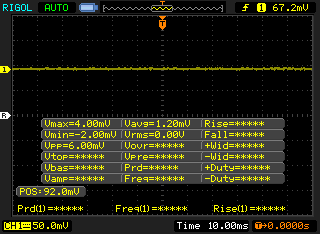 | ||
In confronto: 52 % di tutti i dispositivi testati non utilizza PWM per ridurre la luminosita' del display. Se è rilevato PWM, una media di 7741 (minimo: 5 - massimo: 343500) Hz è stata rilevata. | |||
| wPrime 2.10 - 1024m | |
| Chuwi HeroBook 14 | |
| Microsoft Surface Go MHN-00003 | |
| Chuwi LapBook Plus | |
| Media Intel Core m3-8100Y (n=1) | |
| Dell XPS 13 7390 2-in-1 Core i3 | |
* ... Meglio usare valori piccoli
| PCMark 8 Home Score Accelerated v2 | 2209 punti | |
| PCMark 8 Work Score Accelerated v2 | 3700 punti | |
| PCMark 10 Score | 2341 punti | |
Aiuto | ||
| Chuwi UBook Pro Netac SSD 256GB | Microsoft Surface Pro 6, Core i5, 128 GB Toshiba KBG30ZPZ128G | Lenovo Miix 520-12IKB 81CG Samsung PM961 MZVLW256HEHP | Dell Latitude 7200 WDC PC SN520 SDAPNUW-512G | HP Elite x2 1013 G3-2TT14EA Samsung PM961 MZVLW256HEHP | |
|---|---|---|---|---|---|
| AS SSD | -21% | 206% | 344% | 232% | |
| Seq Read (MB/s) | 246.8 | 1114 351% | 1523 517% | 1294 424% | 2062 735% |
| Seq Write (MB/s) | 147.2 | 340 131% | 1182 703% | 856 482% | 832 465% |
| 4K Read (MB/s) | 21.63 | 40.46 87% | 48.69 125% | 42.52 97% | 41.45 92% |
| 4K Write (MB/s) | 71.1 | 80.6 13% | 107.9 52% | 141 98% | 91.1 28% |
| 4K-64 Read (MB/s) | 166.3 | 277.9 67% | 999 501% | 983 491% | 669 302% |
| 4K-64 Write (MB/s) | 171 | 129.3 -24% | 345.5 102% | 1183 592% | 596 249% |
| Access Time Read * (ms) | 0.084 | 0.913 -987% | 0.49 -483% | 0.057 32% | 0.063 25% |
| Access Time Write * (ms) | 0.374 | 0.301 20% | 0.33 12% | 0.026 93% | 0.041 89% |
| Score Read (Points) | 213 | 430 102% | 1200 463% | 1155 442% | 917 331% |
| Score Write (Points) | 257 | 244 -5% | 572 123% | 1410 449% | 770 200% |
| Score Total (Points) | 582 | 870 49% | 2378 309% | 3142 440% | 2105 262% |
| Copy ISO MB/s (MB/s) | 233.9 | 128.1 -45% | 659 182% | 1387 493% | 761 225% |
| Copy Program MB/s (MB/s) | 101.1 | 94 -7% | 310.4 207% | 449.5 345% | 237.3 135% |
| Copy Game MB/s (MB/s) | 243.6 | 124.4 -49% | 410.8 69% | 1059 335% | 512 110% |
* ... Meglio usare valori piccoli

| 3DMark 11 Performance | 893 punti | |
| 3DMark Cloud Gate Standard Score | 3490 punti | |
| 3DMark Fire Strike Score | 509 punti | |
Aiuto | ||
| basso | medio | alto | ultra | |
|---|---|---|---|---|
| BioShock Infinite (2013) | 27.5 | 15.8 | 13.3 | 4.4 |
(+) La temperatura massima sul lato superiore è di 37.6 °C / 100 F, rispetto alla media di 33.7 °C / 93 F, che varia da 20.7 a 53.2 °C per questa classe Tablet.
(+) Il lato inferiore si riscalda fino ad un massimo di 38.6 °C / 101 F, rispetto alla media di 33.2 °C / 92 F
(+) In idle, la temperatura media del lato superiore è di 27.2 °C / 81 F, rispetto alla media deld ispositivo di 30 °C / 86 F.
Chuwi UBook Pro analisi audio
(-) | altoparlanti non molto potenti (67.8 dB)
Bassi 100 - 315 Hz
(±) | bassi ridotti - in media 14.4% inferiori alla media
(±) | la linearità dei bassi è media (8.4% delta rispetto alla precedente frequenza)
Medi 400 - 2000 Hz
(±) | medi elevati - circa 5.4% superiore alla media
(-) | medi non in linea (15.1% delta rispetto alla precedente frequenza)
Alti 2 - 16 kHz
(±) | alti elevati - circa 5% superiori alla media
(-) | alti non lineari (15.2% delta rispetto alla precedente frequenza)
Nel complesso 100 - 16.000 Hz
(-) | suono nel complesso non lineare (40% di differenza rispetto alla media
Rispetto alla stessa classe
» 98% di tutti i dispositivi testati in questa classe è stato migliore, 0% simile, 2% peggiore
» Il migliore ha avuto un delta di 7%, medio di 20%, peggiore di 129%
Rispetto a tutti i dispositivi testati
» 95% di tutti i dispositivi testati in questa classe è stato migliore, 0% similare, 5% peggiore
» Il migliore ha avuto un delta di 4%, medio di 23%, peggiore di 134%
Apple MacBook 12 (Early 2016) 1.1 GHz analisi audio
(+) | gli altoparlanti sono relativamente potenti (83.6 dB)
Bassi 100 - 315 Hz
(±) | bassi ridotti - in media 11.3% inferiori alla media
(±) | la linearità dei bassi è media (14.2% delta rispetto alla precedente frequenza)
Medi 400 - 2000 Hz
(+) | medi bilanciati - solo only 2.4% rispetto alla media
(+) | medi lineari (5.5% delta rispetto alla precedente frequenza)
Alti 2 - 16 kHz
(+) | Alti bilanciati - appena 2% dalla media
(+) | alti lineari (4.5% delta rispetto alla precedente frequenza)
Nel complesso 100 - 16.000 Hz
(+) | suono nel complesso lineare (10.2% differenza dalla media)
Rispetto alla stessa classe
» 7% di tutti i dispositivi testati in questa classe è stato migliore, 2% simile, 90% peggiore
» Il migliore ha avuto un delta di 5%, medio di 18%, peggiore di 53%
Rispetto a tutti i dispositivi testati
» 5% di tutti i dispositivi testati in questa classe è stato migliore, 1% similare, 94% peggiore
» Il migliore ha avuto un delta di 4%, medio di 23%, peggiore di 134%
| Off / Standby | |
| Idle | |
| Sotto carico |
|
Leggenda:
min: | |
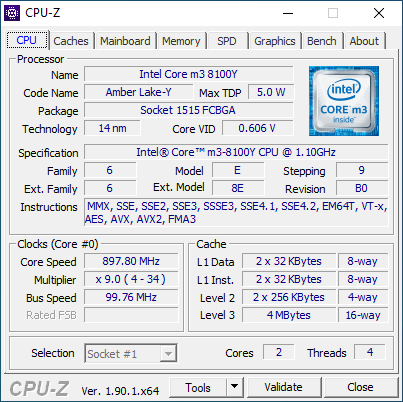
| Chuwi UBook Pro m3-8100Y, UHD Graphics 615, Netac SSD 256GB, IPS, 1920x1280, 12.3" | Microsoft Surface Pro 6, Core i5, 128 GB i5-8250U, UHD Graphics 620, Toshiba KBG30ZPZ128G, IPS, 2736x1834, 12.3" | Lenovo Miix 520-12IKB 81CG i5-8250U, UHD Graphics 620, Samsung PM961 MZVLW256HEHP, IPS, 1920x1200, 12.2" | Dell Latitude 7200 i5-8365U, UHD Graphics 620, WDC PC SN520 SDAPNUW-512G, IPS LED, 1920x1280, 12.3" | Apple iPad 7 2019 A10 Fusion, A10 Fusion GPU, 128 GB NVMe, IPS, 2160x1620, 10.2" | HP Elite x2 1013 G3-2TT14EA i5-8350U, UHD Graphics 620, Samsung PM961 MZVLW256HEHP, IPS, 3000x2000, 13" | |
|---|---|---|---|---|---|---|
| Power Consumption | 0% | -22% | -11% | 45% | -12% | |
| Idle Minimum * (Watt) | 5.4 | 4.3 20% | 5.5 -2% | 3.3 39% | 2.2 59% | 4.9 9% |
| Idle Average * (Watt) | 11.2 | 8.7 22% | 8.3 26% | 5.8 48% | 6.7 40% | 8.9 21% |
| Idle Maximum * (Watt) | 12.5 | 9.4 25% | 11.5 8% | 6.5 48% | 8.2 34% | 11 12% |
| Load Average * (Watt) | 19.5 | 24.5 -26% | 38.3 -96% | 37 -90% | 11.3 42% | 32 -64% |
| Load Maximum * (Watt) | 25.9 | 36 -39% | 37.7 -46% | 51.3 -98% | 12.5 52% | 36 -39% |
* ... Meglio usare valori piccoli
| Chuwi UBook Pro m3-8100Y, UHD Graphics 615, 38 Wh | Microsoft Surface Pro 6, Core i5, 128 GB i5-8250U, UHD Graphics 620, 45 Wh | Lenovo Miix 520-12IKB 81CG i5-8250U, UHD Graphics 620, 38 Wh | Dell Latitude 7200 i5-8365U, UHD Graphics 620, 38 Wh | Apple iPad 7 2019 A10 Fusion, A10 Fusion GPU, 32.4 Wh | HP Elite x2 1013 G3-2TT14EA i5-8350U, UHD Graphics 620, 50 Wh | |
|---|---|---|---|---|---|---|
| Autonomia della batteria | 65% | 2% | 27% | 115% | 40% | |
| WiFi v1.3 (h) | 5.5 | 9.1 65% | 5.6 2% | 7 27% | 11.8 115% | 7.7 40% |
| Reader / Idle (h) | 17.8 | 12.3 | 24.8 | 13 | ||
| Load (h) | 2 | 1.1 | 1.8 | 3.3 | 2.3 |
Pro
Contro
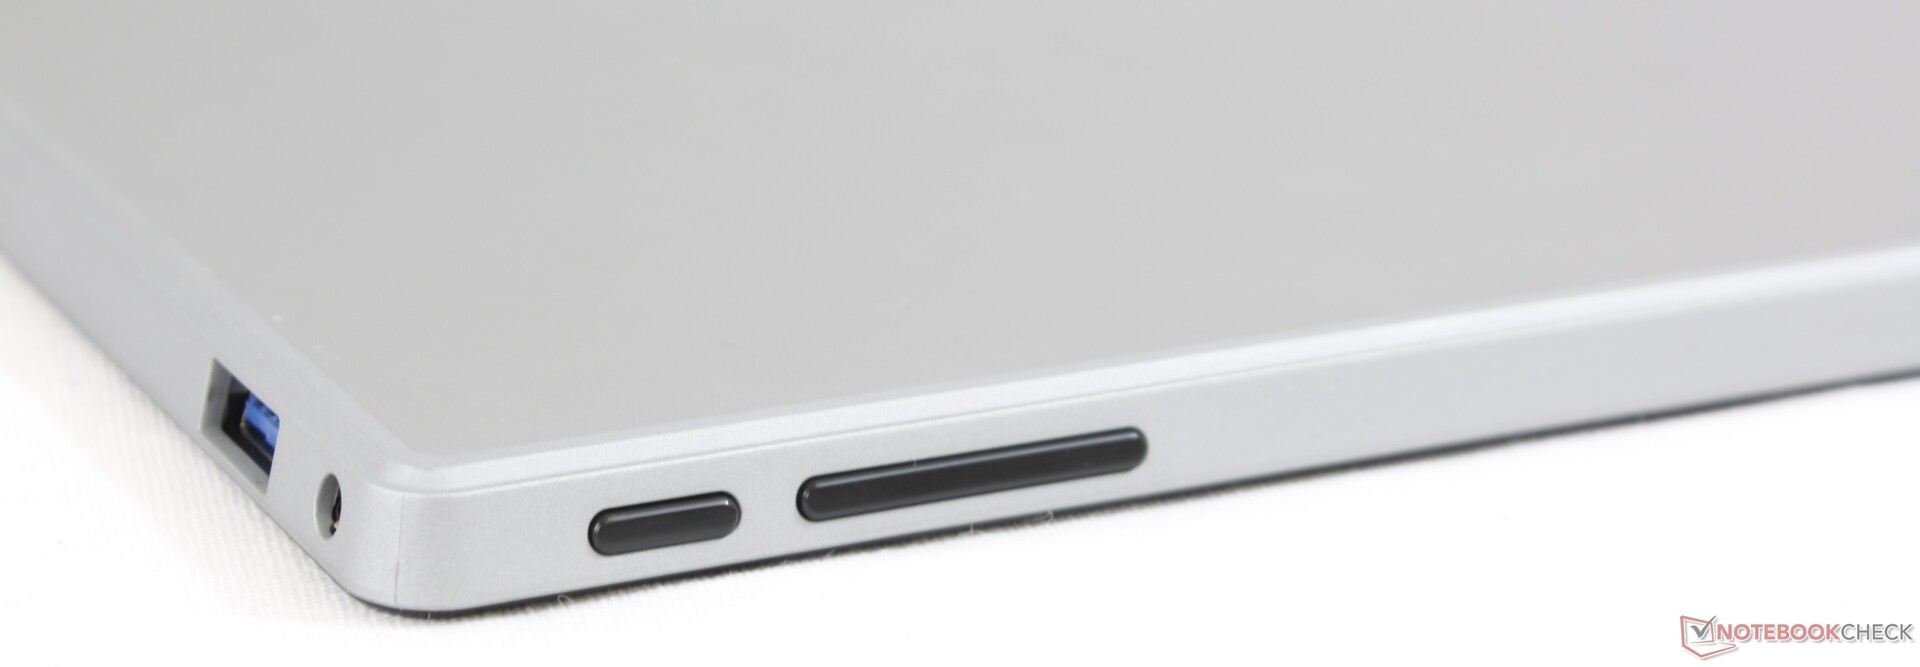
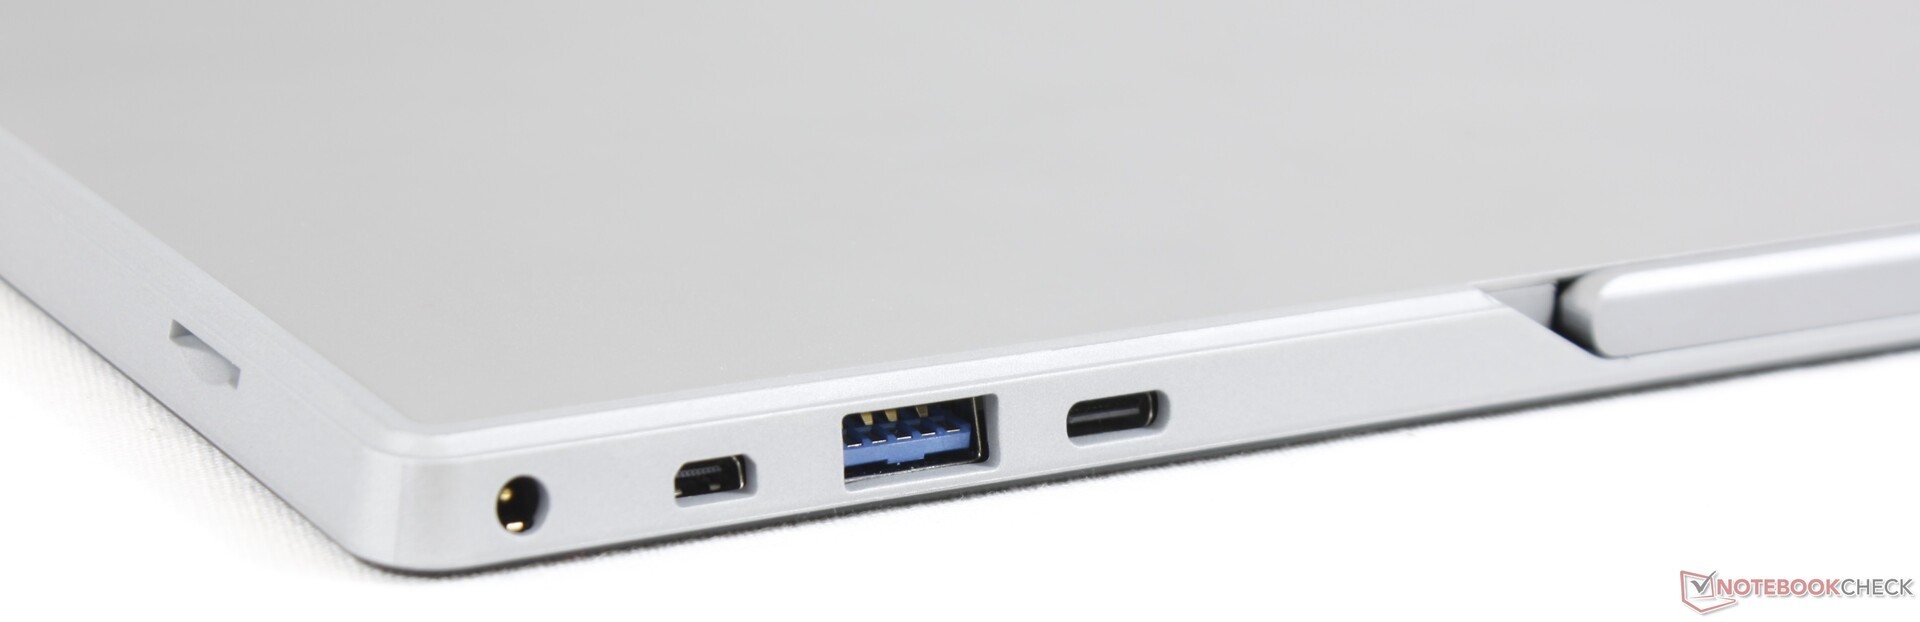
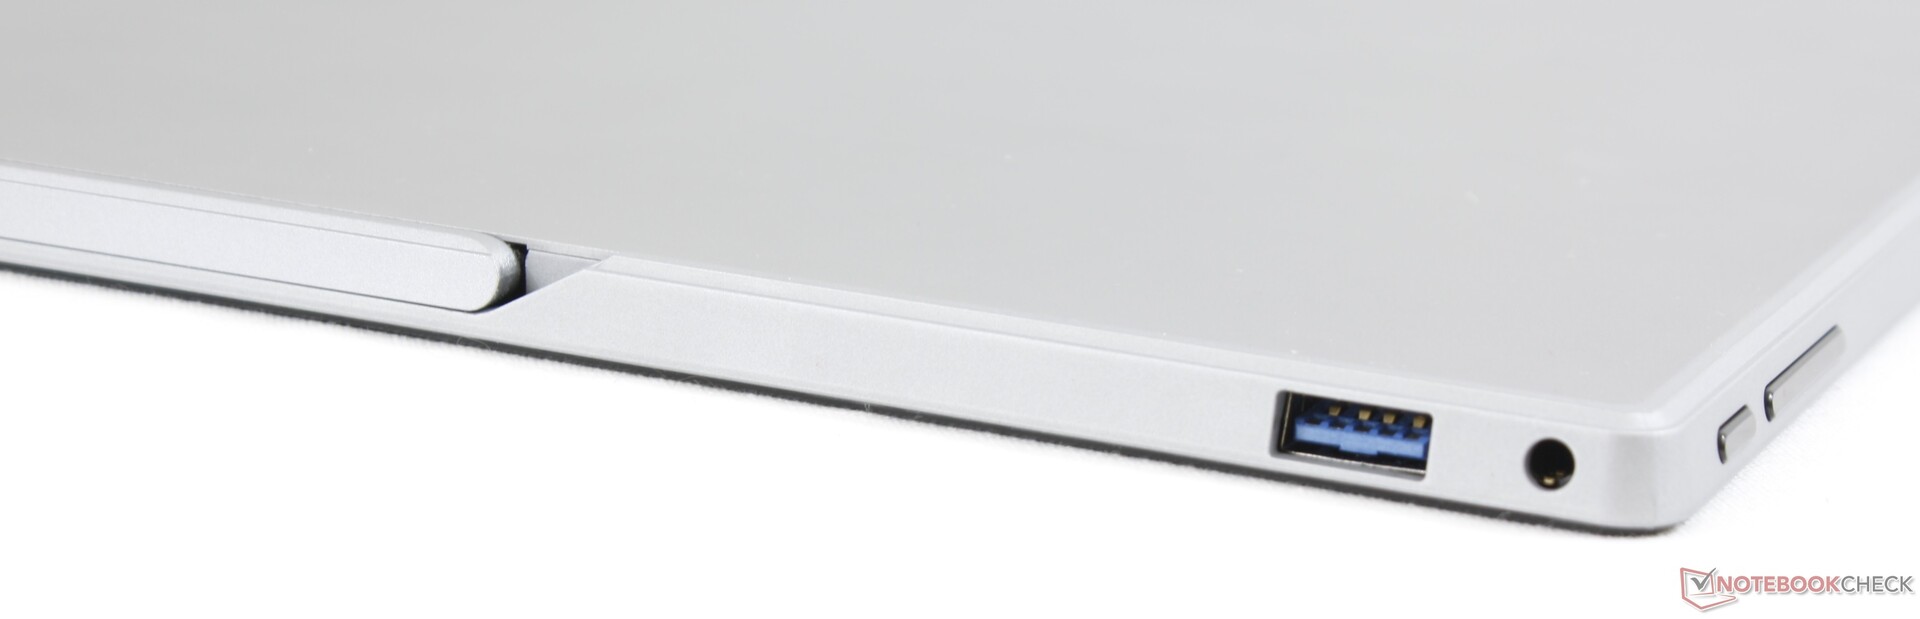
L'UBook Pro supera la serie Surface Pro in due aree chiave: luminosità del display e opzioni delle porte. È più facile da vedere all'aperto e meno dipendente da ingombranti docking station esterne, poiché integra più porte rispetto a qualsiasi tablet Surface.
Mettete da parte questi due vantaggi e l'UBook Pro diventa un mediocre tablet Windows. La CPU Core m3 è notevolmente più lenta rispetto alle SKU Core i5 o i7 del Surface Pro e la tastiera rimovibile è inferiore alla versione di Microsoft sia in termini di qualità che di feedback dei tasti. Fareste meglio ad usare il Surface se avete intenzione di scrivere molto. Per una navigazione web molto leggera e l'elaborazione testi, tuttavia, l'UBook Pro si dimostrerà sufficiente soprattutto in questa fascia di prezzo.
Un tablet Windows con un display più luminoso e più porte integrate rispetto al Surface Pro che costa centinaia di dollari in meno. I grandi svantaggi sono le prestazioni e il feedback della tastiera che non dovrebbe avere un impatto sulla navigazione leggera o sull'invio occasionale di e-mail.
Chuwi UBook Pro
- 11/14/2019 v7 (old)
Allen Ngo
Price comparison
