Recensione del Netbook Chuwi MiniBook
| SD Card Reader | |
| average JPG Copy Test (av. of 3 runs) | |
| Microsoft Surface Go MHN-00003 (Toshiba Exceria Pro M501) | |
| Chuwi MiniBook CWI526 (Toshiba Exceria Pro M501) | |
| maximum AS SSD Seq Read Test (1GB) | |
| Microsoft Surface Go MHN-00003 (Toshiba Exceria Pro M501) | |
| Lenovo Yoga Book C930 YB-J912F (Toshiba Exceria Pro M501 microSDXC 64GB) | |
| Chuwi MiniBook CWI526 (Toshiba Exceria Pro M501) | |
| |||||||||||||||||||||||||
Distribuzione della luminosità: 86 %
Al centro con la batteria: 507.7 cd/m²
Contrasto: 1238:1 (Nero: 0.41 cd/m²)
ΔE ColorChecker Calman: 6.08 | ∀{0.5-29.43 Ø4.73}
calibrated: 3.03
ΔE Greyscale Calman: 7.2 | ∀{0.09-98 Ø4.97}
91.5% sRGB (Argyll 1.6.3 3D)
58.9% AdobeRGB 1998 (Argyll 1.6.3 3D)
64.9% AdobeRGB 1998 (Argyll 3D)
92.1% sRGB (Argyll 3D)
64.3% Display P3 (Argyll 3D)
Gamma: 2.11
CCT: 8495 K
| Chuwi MiniBook CWI526 AU Optronics AUO17D8, IPS, 8", 1920x1200 | Topjoy Falcon AUO17D8, IPS, 8", 1920x1200 | Huawei MediaPad M3 8.4 inch IPS, 8.4", 2560x1600 | Apple iPad Air 3 2019 IPS, 10.5", 2224x1668 | Lenovo Yoga Book C930 YB-J912F BOE 0765, IPS, 10.8", 2560x1660 | Microsoft Surface Go MHN-00003 Sharp SHP14A6, IPS, 10", 1800x1200 | |
|---|---|---|---|---|---|---|
| Display | 25% | 4% | ||||
| Display P3 Coverage (%) | 64.3 | 88.5 38% | 66.5 3% | |||
| sRGB Coverage (%) | 92.1 | 99.9 8% | 97.5 6% | |||
| AdobeRGB 1998 Coverage (%) | 64.9 | 83.2 28% | 67.5 4% | |||
| Response Times | -14% | -48% | -32% | -9% | -8% | |
| Response Time Grey 50% / Grey 80% * (ms) | 36 ? | 37 ? -3% | 59 ? -64% | 58 ? -61% | 43 ? -19% | 44 ? -22% |
| Response Time Black / White * (ms) | 27.2 ? | 33.6 ? -24% | 36 ? -32% | 28 ? -3% | 27 ? 1% | 25.6 ? 6% |
| PWM Frequency (Hz) | 200 ? | 1020 ? | ||||
| Screen | 2% | -4% | 25% | 8% | 30% | |
| Brightness middle (cd/m²) | 507.7 | 266 -48% | 460 -9% | 515 1% | 351 -31% | 456 -10% |
| Brightness (cd/m²) | 475 | 269 -43% | 445 -6% | 483 2% | 338 -29% | 426 -10% |
| Brightness Distribution (%) | 86 | 88 2% | 90 5% | 90 5% | 87 1% | 88 2% |
| Black Level * (cd/m²) | 0.41 | 0.34 17% | 0.45 -10% | 0.41 -0% | 0.23 44% | 0.31 24% |
| Contrast (:1) | 1238 | 782 -37% | 1022 -17% | 1256 1% | 1526 23% | 1471 19% |
| Colorchecker dE 2000 * | 6.08 | 3.6 41% | 6.2 -2% | 1.6 74% | 4.59 25% | 1.3 79% |
| Colorchecker dE 2000 max. * | 10.32 | 8.2 21% | 10.5 -2% | 4.4 57% | 9.81 5% | 3 71% |
| Colorchecker dE 2000 calibrated * | 3.03 | 2.7 11% | 3.26 -8% | 1.1 64% | ||
| Greyscale dE 2000 * | 7.2 | 3.6 50% | 6.5 10% | 2.8 61% | 5.2 28% | 1.4 81% |
| Gamma | 2.11 104% | 2.19 100% | 2.33 94% | 2.21 100% | 2.41 91% | 2.24 98% |
| CCT | 8495 77% | 6442 101% | 8056 81% | 6944 94% | 7712 84% | 6687 97% |
| Color Space (Percent of AdobeRGB 1998) (%) | 58.9 | 74 26% | 62.3 6% | |||
| Color Space (Percent of sRGB) (%) | 91.5 | 100 9% | 96.8 6% | |||
| Media totale (Programma / Settaggio) | -6% /
-1% | -26% /
-13% | -4% /
14% | 8% /
9% | 9% /
21% |
* ... Meglio usare valori piccoli
Tempi di risposta del Display
| ↔ Tempi di risposta dal Nero al Bianco | ||
|---|---|---|
| 27.2 ms ... aumenta ↗ e diminuisce ↘ combinato | ↗ 18.8 ms Incremento |  |
| ↘ 8.4 ms Calo | ||
| Lo schermo mostra tempi di risposta relativamente lenti nei nostri tests e potrebbe essere troppo lento per i gamers. In confronto, tutti i dispositivi di test variano da 0.1 (minimo) a 240 (massimo) ms. » 69 % di tutti i dispositivi è migliore. Questo significa che i tempi di risposta rilevati sono peggiori rispetto alla media di tutti i dispositivi testati (19.9 ms). | ||
| ↔ Tempo di risposta dal 50% Grigio all'80% Grigio | ||
| 36 ms ... aumenta ↗ e diminuisce ↘ combinato | ↗ 18.8 ms Incremento | 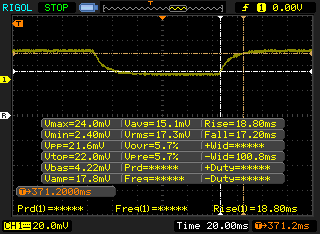 |
| ↘ 17.2 ms Calo | ||
| Lo schermo mostra tempi di risposta lenti nei nostri tests e sarà insoddisfacente per i gamers. In confronto, tutti i dispositivi di test variano da 0.165 (minimo) a 636 (massimo) ms. » 50 % di tutti i dispositivi è migliore. Questo significa che i tempi di risposta rilevati sono peggiori rispetto alla media di tutti i dispositivi testati (31.1 ms). | ||
Sfarfallio dello schermo / PWM (Pulse-Width Modulation)
| flickering dello schermo / PWM non rilevato | 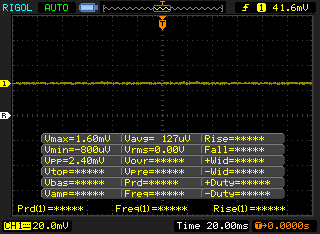 | ||
In confronto: 52 % di tutti i dispositivi testati non utilizza PWM per ridurre la luminosita' del display. Se è rilevato PWM, una media di 7794 (minimo: 5 - massimo: 343500) Hz è stata rilevata. | |||
| Cinebench R10 | |
| Rendering Multiple CPUs 32Bit | |
| Asus VivoBook Flip 14 TP412UA-EC969T | |
| Media Intel Celeron N4100 (4915 - 7123, n=5) | |
| Microsoft Surface Go MHN-00003 | |
| Chuwi LapBook Plus | |
| Rendering Single 32Bit | |
| Asus VivoBook Flip 14 TP412UA-EC969T | |
| Microsoft Surface Go MHN-00003 | |
| Media Intel Celeron N4100 (1664 - 2049, n=5) | |
| Chuwi LapBook Plus | |
| wPrime 2.10 - 1024m | |
| Microsoft Surface Go MHN-00003 | |
| Chuwi LapBook Plus | |
| Media Intel Celeron N4100 (591 - 790, n=3) | |
* ... Meglio usare valori piccoli
| PCMark 8 Home Score Accelerated v2 | 2259 punti | |
| PCMark 10 Score | 1920 punti | |
Aiuto | ||
| Chuwi MiniBook CWI526 128 GB eMMC Flash | Topjoy Falcon FORESEE 256GB | Lenovo Yoga Book C930 YB-J912F Toshiba KBG30ZMT256G | Microsoft Surface Go MHN-00003 64 GB eMMC Flash | Lenovo Flex 14IWL Samsung SSD PM981 MZVLB256HAHQ | |
|---|---|---|---|---|---|
| AS SSD | 155% | 558% | 19% | 1517% | |
| Seq Read (MB/s) | 221.5 | 472.2 113% | 1241 460% | 289.8 31% | 2533 1044% |
| Seq Write (MB/s) | 124.6 | 431.4 246% | 797 540% | 126.7 2% | 1438 1054% |
| 4K Read (MB/s) | 20.58 | 12.06 -41% | 43.38 111% | 18.29 -11% | 51.7 151% |
| 4K Write (MB/s) | 23.74 | 26.05 10% | 91.6 286% | 35.07 48% | 109.4 361% |
| 4K-64 Read (MB/s) | 19.43 | 87.9 352% | 582 2895% | 40.27 107% | 771 3868% |
| 4K-64 Write (MB/s) | 28.41 | 188 562% | 231.7 716% | 44.48 57% | 1268 4363% |
| Access Time Read * (ms) | 0.15 | 0.23 -53% | 0.057 62% | 0.151 -1% | 0.053 65% |
| Access Time Write * (ms) | 0.73 | 0.444 39% | 0.176 76% | 0.233 68% | 0.034 95% |
| Score Read (Points) | 62 | 147 137% | 749 1108% | 88 42% | 1076 1635% |
| Score Write (Points) | 65 | 257 295% | 403 520% | 92 42% | 1521 2240% |
| Score Total (Points) | 163 | 482 196% | 1526 836% | 225 38% | 3106 1806% |
| Copy ISO MB/s (MB/s) | 162.5 | 474 192% | 448.1 176% | 99.1 -39% | |
| Copy Program MB/s (MB/s) | 148.5 | 150 1% | 94.3 -36% | 44.34 -70% | |
| Copy Game MB/s (MB/s) | 159.9 | 344 115% | 254.5 59% | 76.5 -52% |
* ... Meglio usare valori piccoli

| 3DMark 11 Performance | 732 punti | |
| 3DMark Ice Storm Standard Score | 24922 punti | |
| 3DMark Cloud Gate Standard Score | 3231 punti | |
Aiuto | ||
| basso | medio | alto | ultra | |
|---|---|---|---|---|
| BioShock Infinite (2013) | 28.3 |
| Chuwi MiniBook CWI526 UHD Graphics 600, Celeron N4100, 128 GB eMMC Flash | Topjoy Falcon UHD Graphics 605, Pentium N5000, FORESEE 256GB | Microsoft Surface Go MHN-00003 UHD Graphics 615, Pentium 4415Y, 64 GB eMMC Flash | Lenovo Flex 14IWL UHD Graphics 620, i5-8265U, Samsung SSD PM981 MZVLB256HAHQ | Dell XPS 13 9380 2019 UHD Graphics 620, i5-8265U, SK hynix PC401 HFS256GD9TNG | |
|---|---|---|---|---|---|
| Noise | 1% | -2% | |||
| off /ambiente * (dB) | 28.2 | 28.4 -1% | 30.4 -8% | ||
| Idle Minimum * (dB) | 29.6 | 28.4 4% | 30.4 -3% | ||
| Idle Average * (dB) | 29.6 | 28.4 4% | 30.4 -3% | ||
| Idle Maximum * (dB) | 30 | 29.1 3% | 30.4 -1% | ||
| Load Average * (dB) | 30 | 33.8 -13% | 31.7 -6% | ||
| Load Maximum * (dB) | 40.8 | 37.7 8% | 38.1 7% |
* ... Meglio usare valori piccoli
Rumorosità
| Idle |
| 29.6 / 29.6 / 30 dB(A) |
| Sotto carico |
| 30 / 40.8 dB(A) |
 | ||
30 dB silenzioso 40 dB(A) udibile 50 dB(A) rumoroso |
||
min: | ||
(-) La temperatura massima sul lato superiore è di 51.4 °C / 125 F, rispetto alla media di 33.1 °C / 92 F, che varia da 21.6 a 53.2 °C per questa classe Netbook.
(-) Il lato inferiore si riscalda fino ad un massimo di 55.4 °C / 132 F, rispetto alla media di 36.6 °C / 98 F
(+) In idle, la temperatura media del lato superiore è di 31.3 °C / 88 F, rispetto alla media deld ispositivo di 29.8 °C / 86 F.
(-) I poggiapolsi e il touchpad possono diventare molto caldi al tatto con un massimo di 41.2 °C / 106.2 F.
(-) La temperatura media della zona del palmo della mano di dispositivi simili e'stata di 29.3 °C / 84.7 F (-11.9 °C / -21.5 F).
Chuwi MiniBook CWI526 analisi audio
(±) | potenza degli altiparlanti media ma buona (78.4 dB)
Bassi 100 - 315 Hz
(-) | quasi nessun basso - in media 19.5% inferiori alla media
(±) | la linearità dei bassi è media (8.8% delta rispetto alla precedente frequenza)
Medi 400 - 2000 Hz
(±) | medi elevati - circa 7.2% superiore alla media
(±) | linearità dei medi adeguata (12.2% delta rispetto alla precedente frequenza)
Alti 2 - 16 kHz
(±) | alti elevati - circa 5.1% superiori alla media
(±) | la linearità degli alti è media (8.9% delta rispetto alla precedente frequenza)
Nel complesso 100 - 16.000 Hz
(-) | suono nel complesso non lineare (35.2% di differenza rispetto alla media
Rispetto alla stessa classe
» 86% di tutti i dispositivi testati in questa classe è stato migliore, 14% simile, 0% peggiore
» Il migliore ha avuto un delta di 14%, medio di 25%, peggiore di 35%
Rispetto a tutti i dispositivi testati
» 93% di tutti i dispositivi testati in questa classe è stato migliore, 1% similare, 6% peggiore
» Il migliore ha avuto un delta di 4%, medio di 24%, peggiore di 134%
Apple MacBook 12 (Early 2016) 1.1 GHz analisi audio
(+) | gli altoparlanti sono relativamente potenti (83.6 dB)
Bassi 100 - 315 Hz
(±) | bassi ridotti - in media 11.3% inferiori alla media
(±) | la linearità dei bassi è media (14.2% delta rispetto alla precedente frequenza)
Medi 400 - 2000 Hz
(+) | medi bilanciati - solo only 2.4% rispetto alla media
(+) | medi lineari (5.5% delta rispetto alla precedente frequenza)
Alti 2 - 16 kHz
(+) | Alti bilanciati - appena 2% dalla media
(+) | alti lineari (4.5% delta rispetto alla precedente frequenza)
Nel complesso 100 - 16.000 Hz
(+) | suono nel complesso lineare (10.2% differenza dalla media)
Rispetto alla stessa classe
» 7% di tutti i dispositivi testati in questa classe è stato migliore, 2% simile, 91% peggiore
» Il migliore ha avuto un delta di 5%, medio di 18%, peggiore di 53%
Rispetto a tutti i dispositivi testati
» 5% di tutti i dispositivi testati in questa classe è stato migliore, 1% similare, 94% peggiore
» Il migliore ha avuto un delta di 4%, medio di 24%, peggiore di 134%
| Off / Standby | |
| Idle | |
| Sotto carico |
|
Leggenda:
min: | |
| Chuwi MiniBook CWI526 Celeron N4100, UHD Graphics 600, 128 GB eMMC Flash, IPS, 1920x1200, 8" | Topjoy Falcon Pentium N5000, UHD Graphics 605, FORESEE 256GB, IPS, 1920x1200, 8" | Huawei MediaPad M3 8.4 inch Kirin 950, Mali-T880 MP4, 32 GB eMMC Flash, IPS, 2560x1600, 8.4" | Apple iPad Air 3 2019 A12 Bionic, A12 Bionic GPU, 64 GB eMMC Flash, IPS, 2224x1668, 10.5" | Lenovo Yoga Book C930 YB-J912F i5-7Y54, HD Graphics 615, Toshiba KBG30ZMT256G, IPS, 2560x1660, 10.8" | Microsoft Surface Go MHN-00003 Pentium 4415Y, UHD Graphics 615, 64 GB eMMC Flash, IPS, 1800x1200, 10" | Lenovo Flex 14IWL i5-8265U, UHD Graphics 620, Samsung SSD PM981 MZVLB256HAHQ, IPS, 1920x1080, 14" | |
|---|---|---|---|---|---|---|---|
| Power Consumption | 34% | 52% | 29% | -24% | 6% | -125% | |
| Idle Minimum * (Watt) | 3.3 | 2.5 24% | 1.51 54% | 2.18 34% | 5.3 -61% | 2.88 13% | 9.4 -185% |
| Idle Average * (Watt) | 5.8 | 4 31% | 3.64 37% | 6.4 -10% | 6.9 -19% | 4.8 17% | 13.3 -129% |
| Idle Maximum * (Watt) | 6.4 | 4.1 36% | 3.68 43% | 6.43 -0% | 7.4 -16% | 7.5 -17% | 13.9 -117% |
| Load Average * (Watt) | 19 | 8.1 57% | 6.95 63% | 7.48 61% | 19.7 -4% | 16.9 11% | 39.7 -109% |
| Load Maximum * (Watt) | 25.4 | 19.6 23% | 9.11 64% | 10.65 58% | 30.5 -20% | 23.8 6% | 46.5 -83% |
* ... Meglio usare valori piccoli
| Chuwi MiniBook CWI526 Celeron N4100, UHD Graphics 600, 26.6 Wh | Topjoy Falcon Pentium N5000, UHD Graphics 605, 22 Wh | Huawei MediaPad M3 8.4 inch Kirin 950, Mali-T880 MP4, 19.5 Wh | Apple iPad Air 3 2019 A12 Bionic, A12 Bionic GPU, 30.8 Wh | Lenovo Yoga Book C930 YB-J912F i5-7Y54, HD Graphics 615, 36 Wh | Microsoft Surface Go MHN-00003 Pentium 4415Y, UHD Graphics 615, 28 Wh | Lenovo Flex 14IWL i5-8265U, UHD Graphics 620, 45 Wh | |
|---|---|---|---|---|---|---|---|
| Autonomia della batteria | -14% | 40% | 89% | -3% | 15% | 60% | |
| WiFi v1.3 (h) | 6.5 | 5.6 -14% | 9.1 40% | 12.3 89% | 6.3 -3% | 7.5 15% | 10.4 60% |
| Reader / Idle (h) | 18.5 | 25 | 11.5 | 12.9 | 13.6 | ||
| Load (h) | 4.5 | 3.6 | 2.6 | 3 | 1.2 |
Pro
Contro
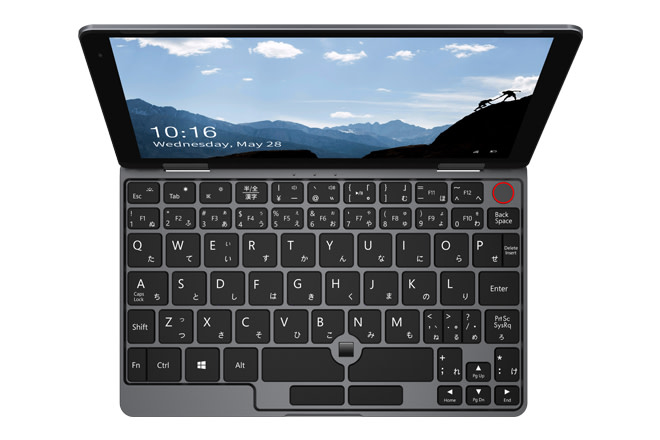
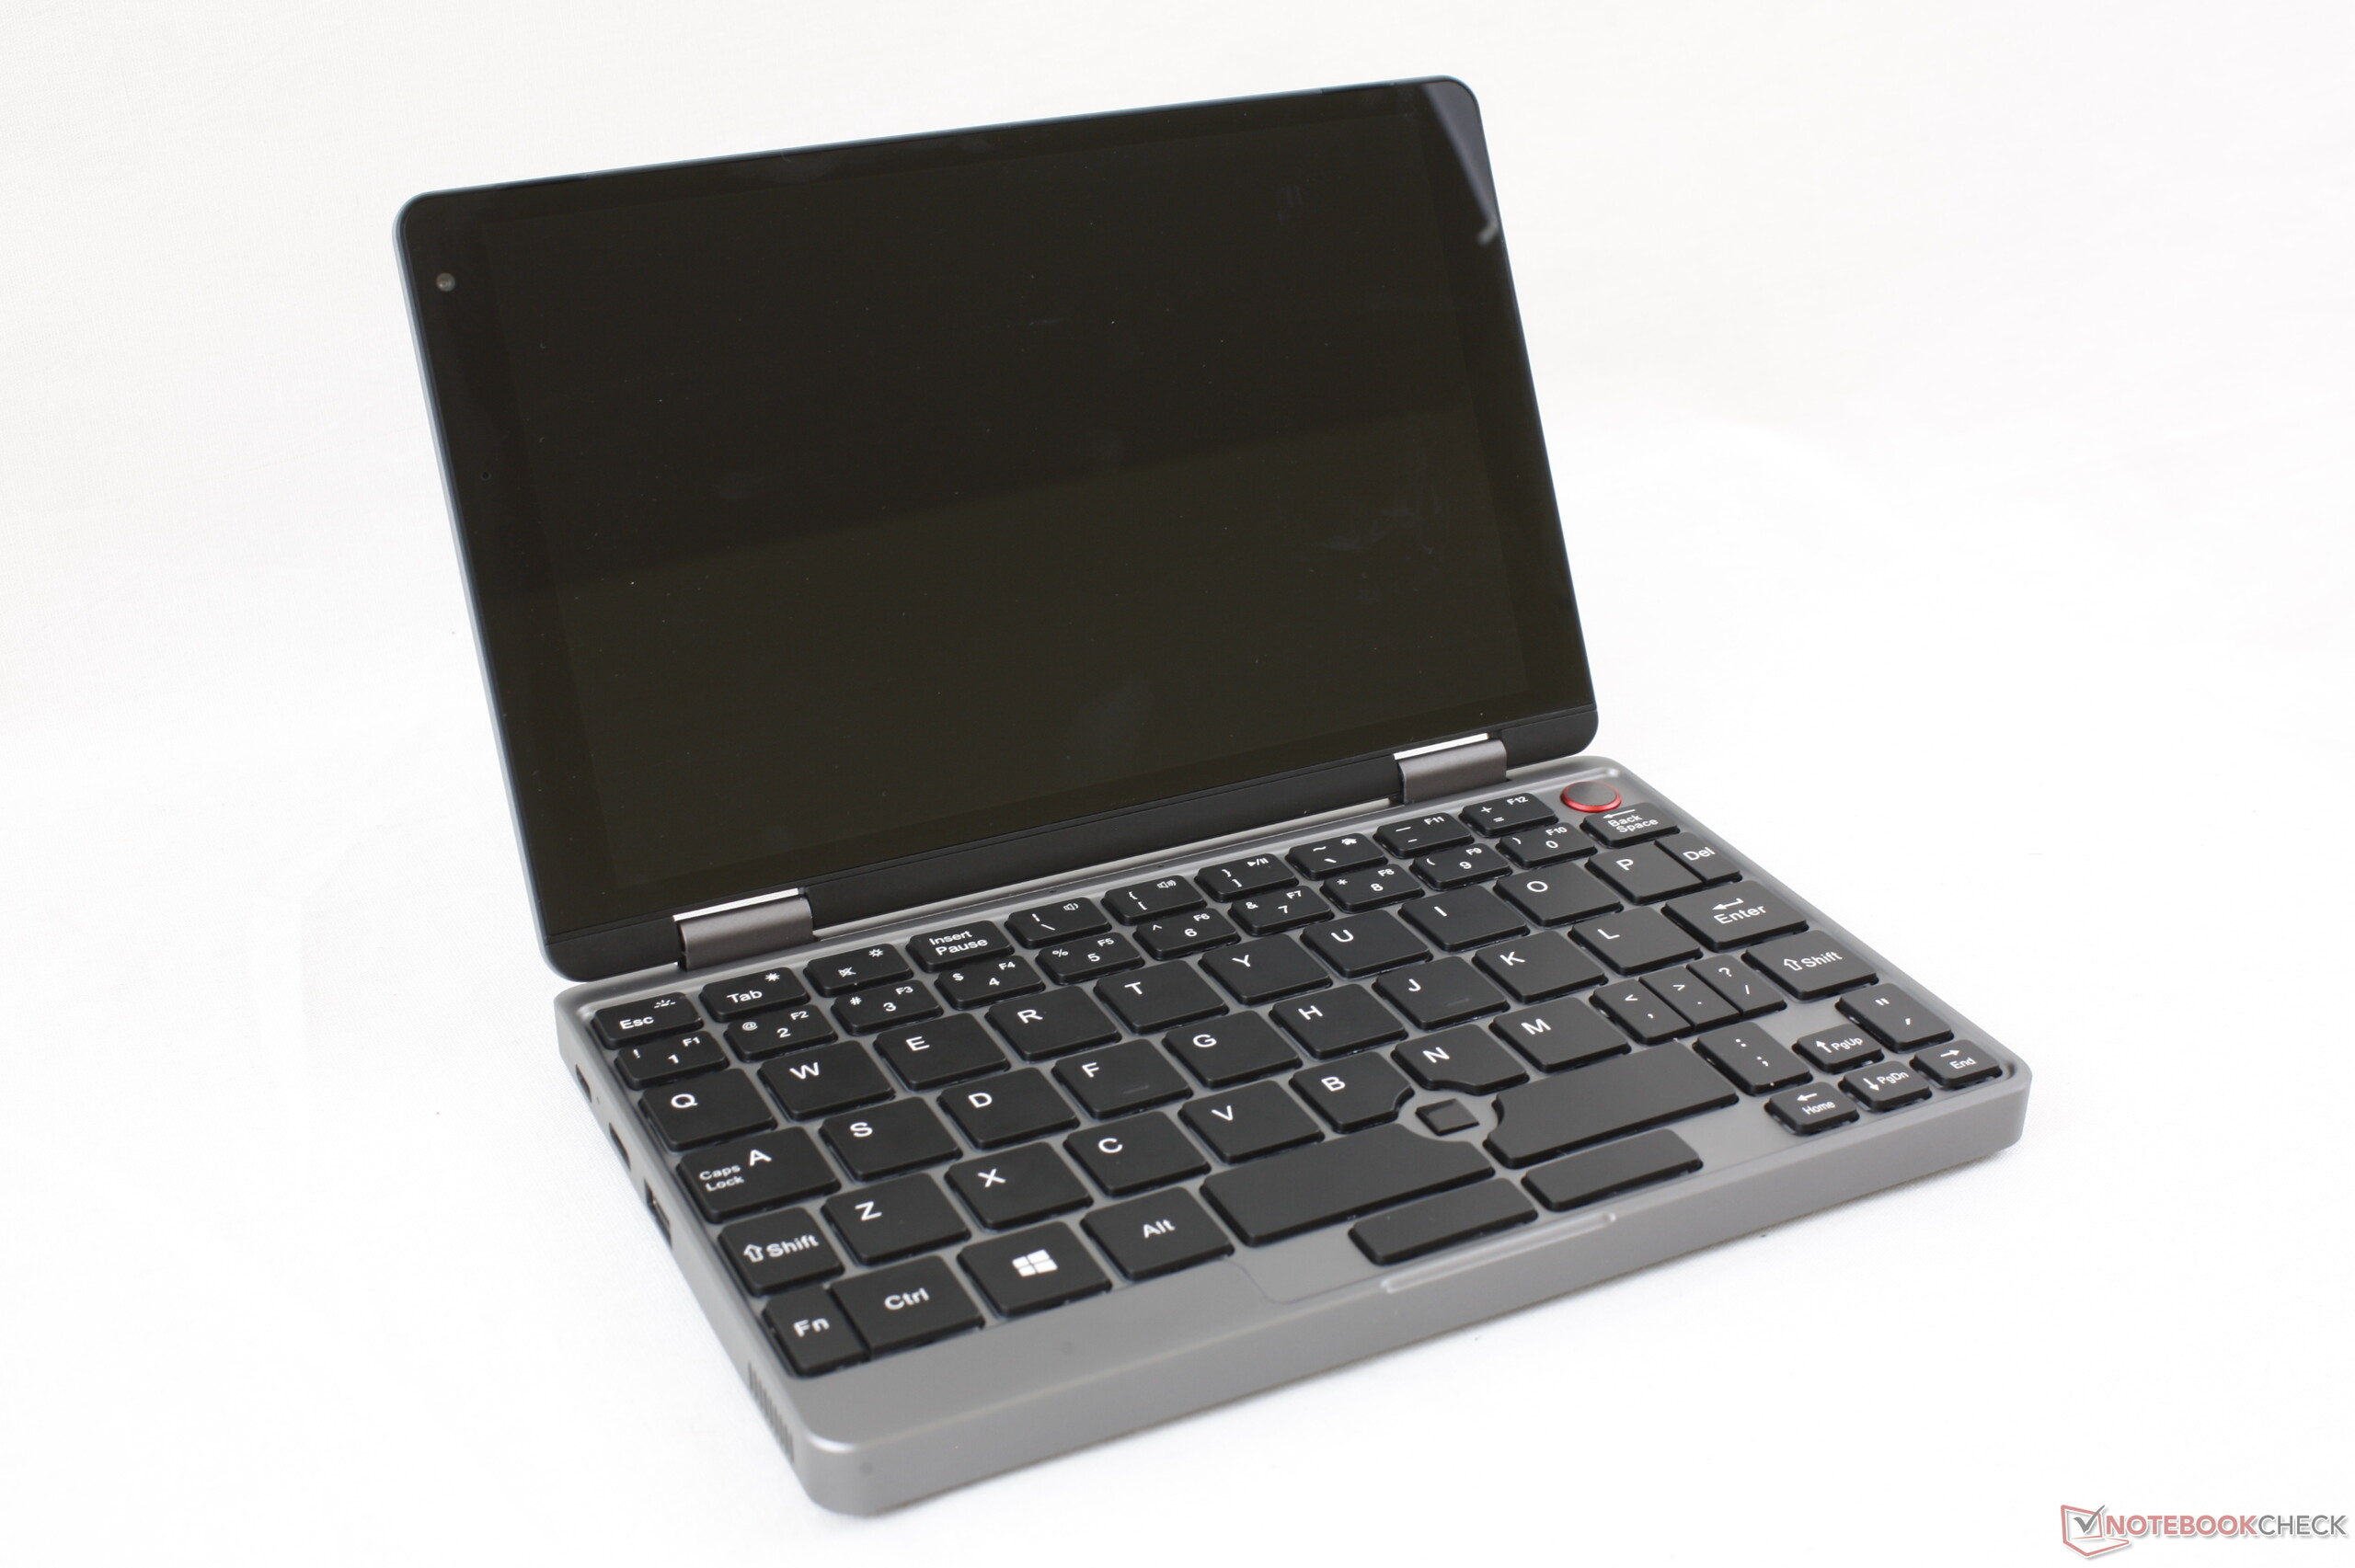
Abbiamo controllato un'ampia selezione di prodotti Chuwi in passato e tutti e tre sono accomunati da queste tre qualità: design elegante, prezzi economici e processori super lenti. Quest'ultimo è stato il flagello dei computer portatili Chuwi perché sembrerebbero i costosi Ultrabook di punta del 2019, ma si comportano come i netbook del 2009. Il MiniBook segue la tendenza bilanciando look, prezzo e prestazioni in modo più diligente rispetto agli attuali computer portatili Chuwi. Il telaio compatto è rigido, il display è di alta qualità, e la CPU Celeron si accoppia bene con questa dimensione dello schermo in contrasto con i LapBook Chuwi da 13" e 15" alimentati da CPU Atom ancora più lente. Il display e i tasti della tastiera, in particolare, sono sorprendentemente più luminosi e più solidi del Topjoy Falcon, rispettivamente, per una sensazione di qualità superiore.
Gli aspetti più fastidiosi del MiniBook saranno la disposizione non ortodossa della tastiera, l'input impreciso del cursore a bassa velocità e la rigidità irregolare della cerniera. Questi fattori influiscono direttamente sull'esperienza dell'utente, rendendo i primi giorni di utilizzo una fase di apprendimento in salita prima che tutto fili liscio.
Design robusto, tasti QWERTY solidi e un display luminoso sono i punti di forza del MiniBook Chuwi. La CPU Celeron a basso consumo offre prestazioni leggermente più veloci del previsto e si abbina bene con il fattore di forma del netbook da 8 pollici rispetto agli Ultrabook e LapBook più grandi da 13 pollici o 15 pollici.
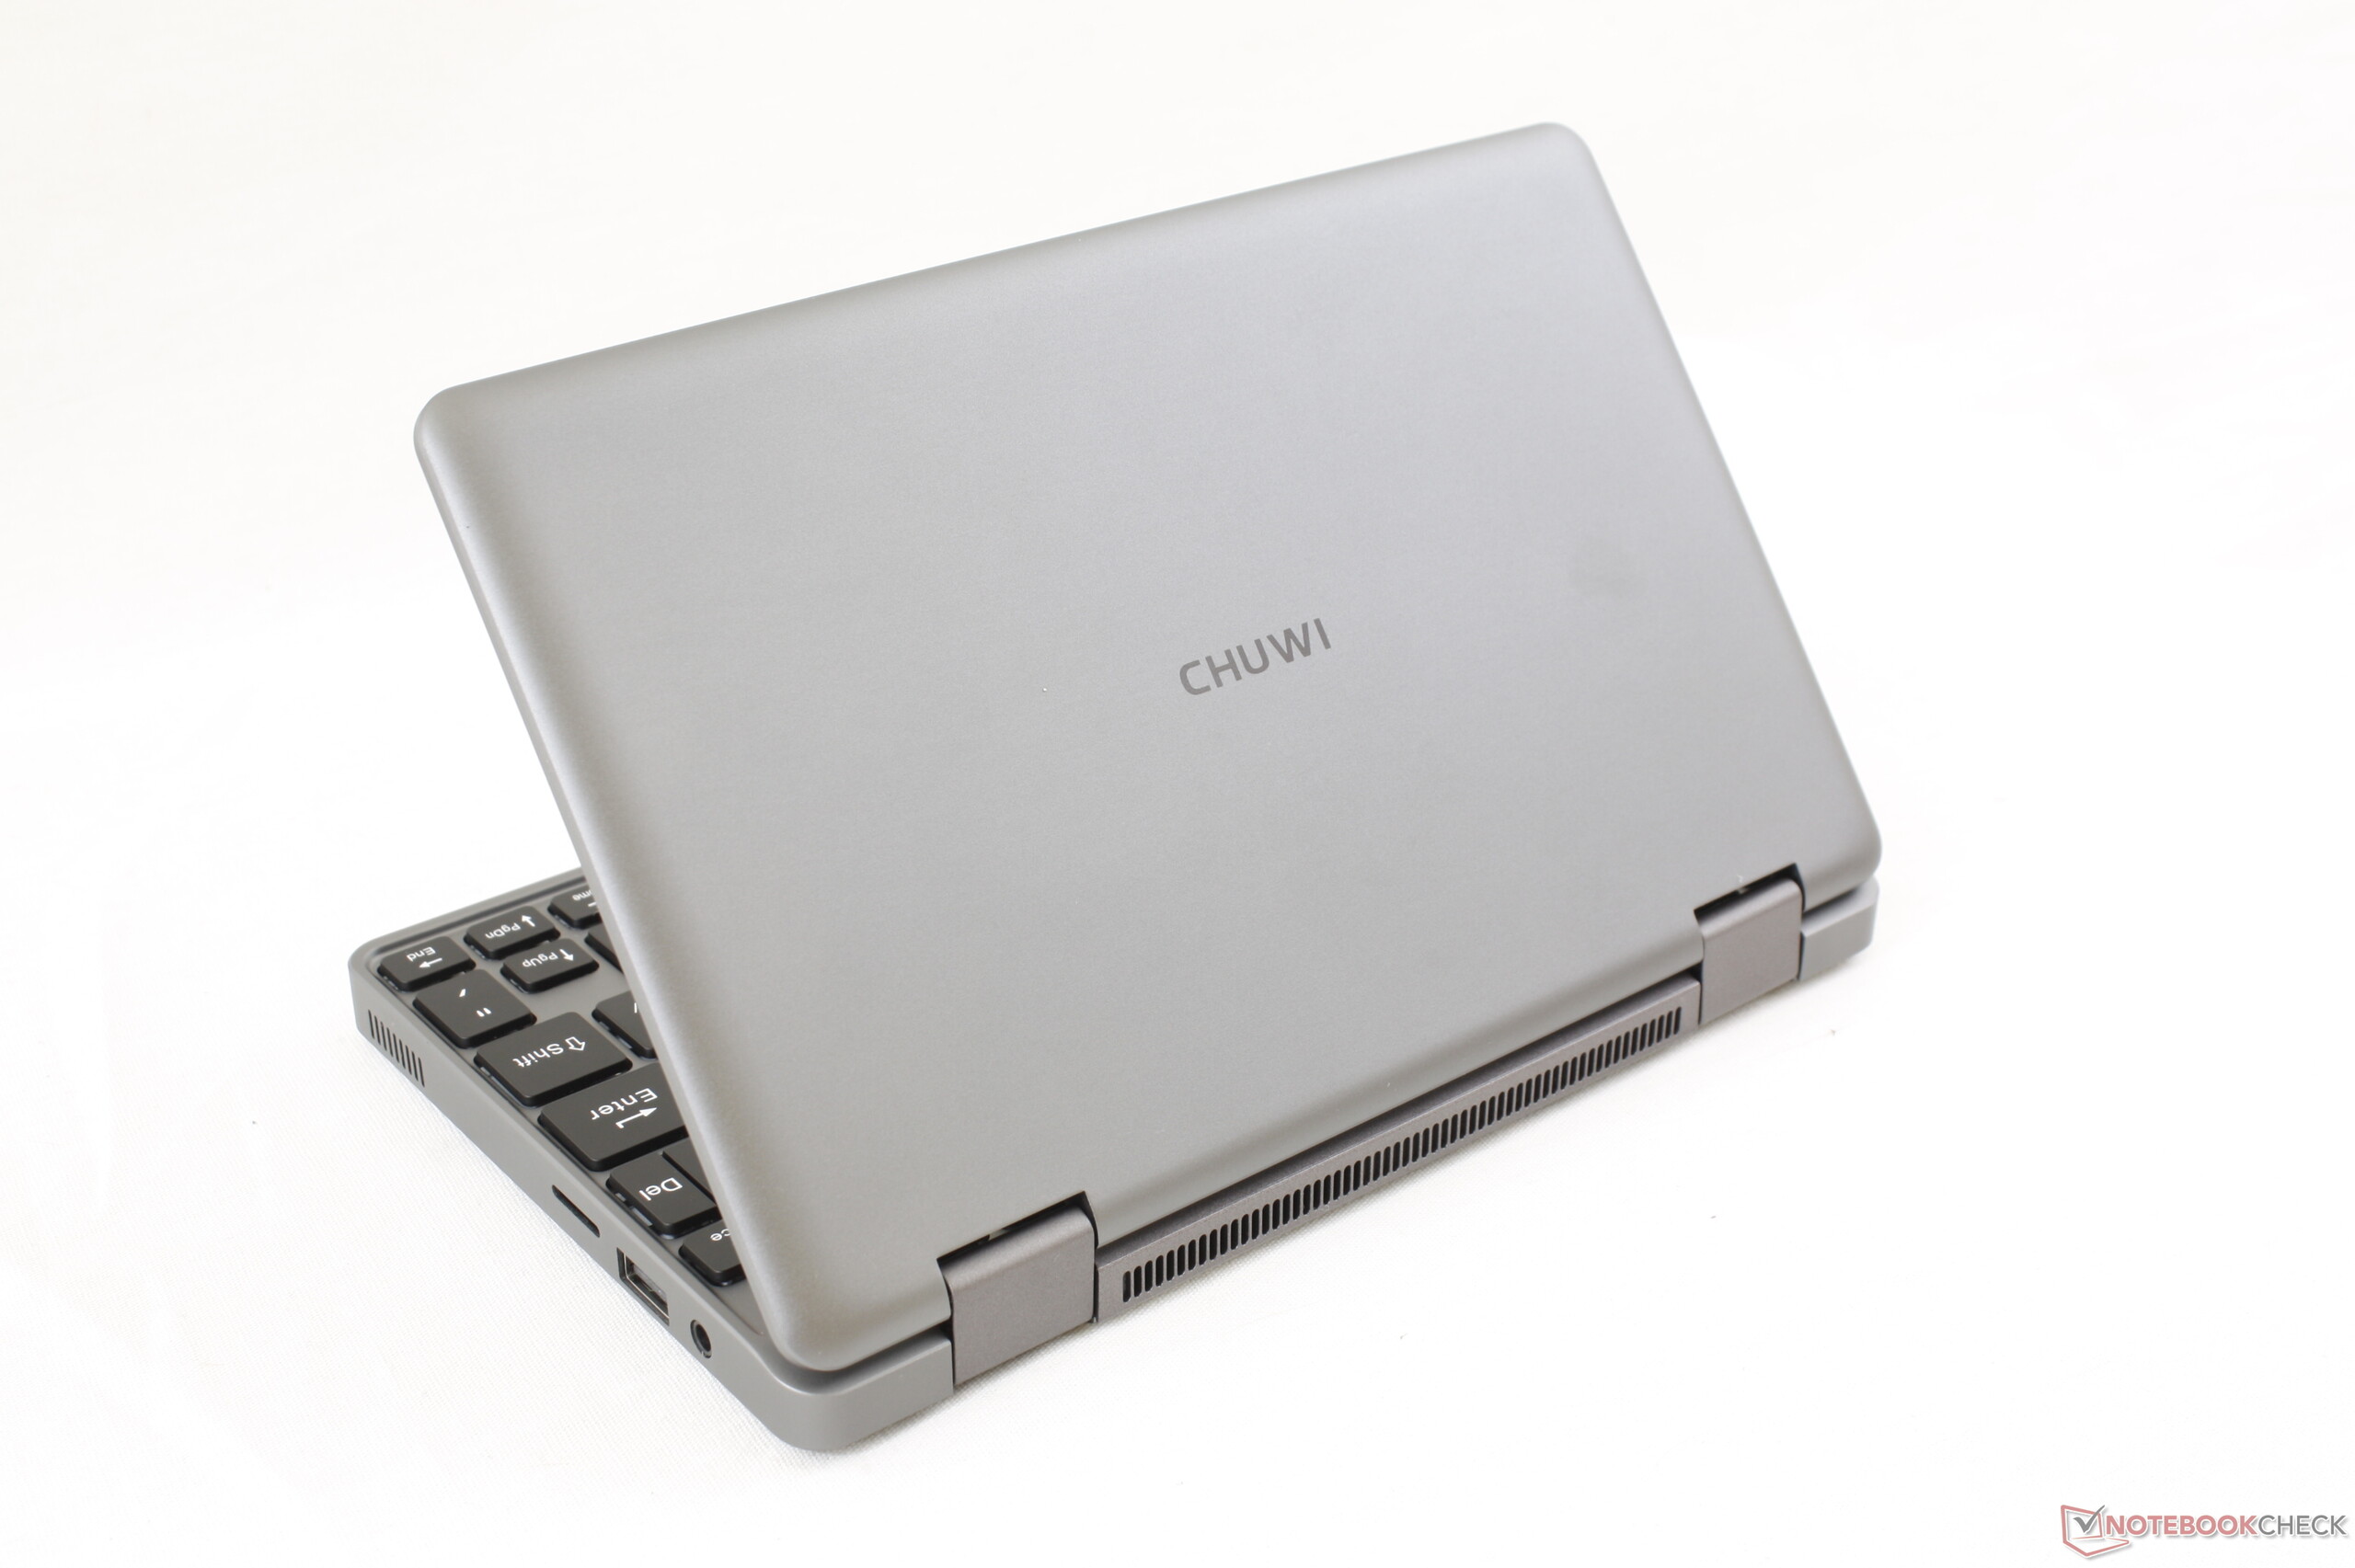
Chuwi MiniBook CWI526
- 08/05/2019 v6 (old)
Allen Ngo
Price comparison
