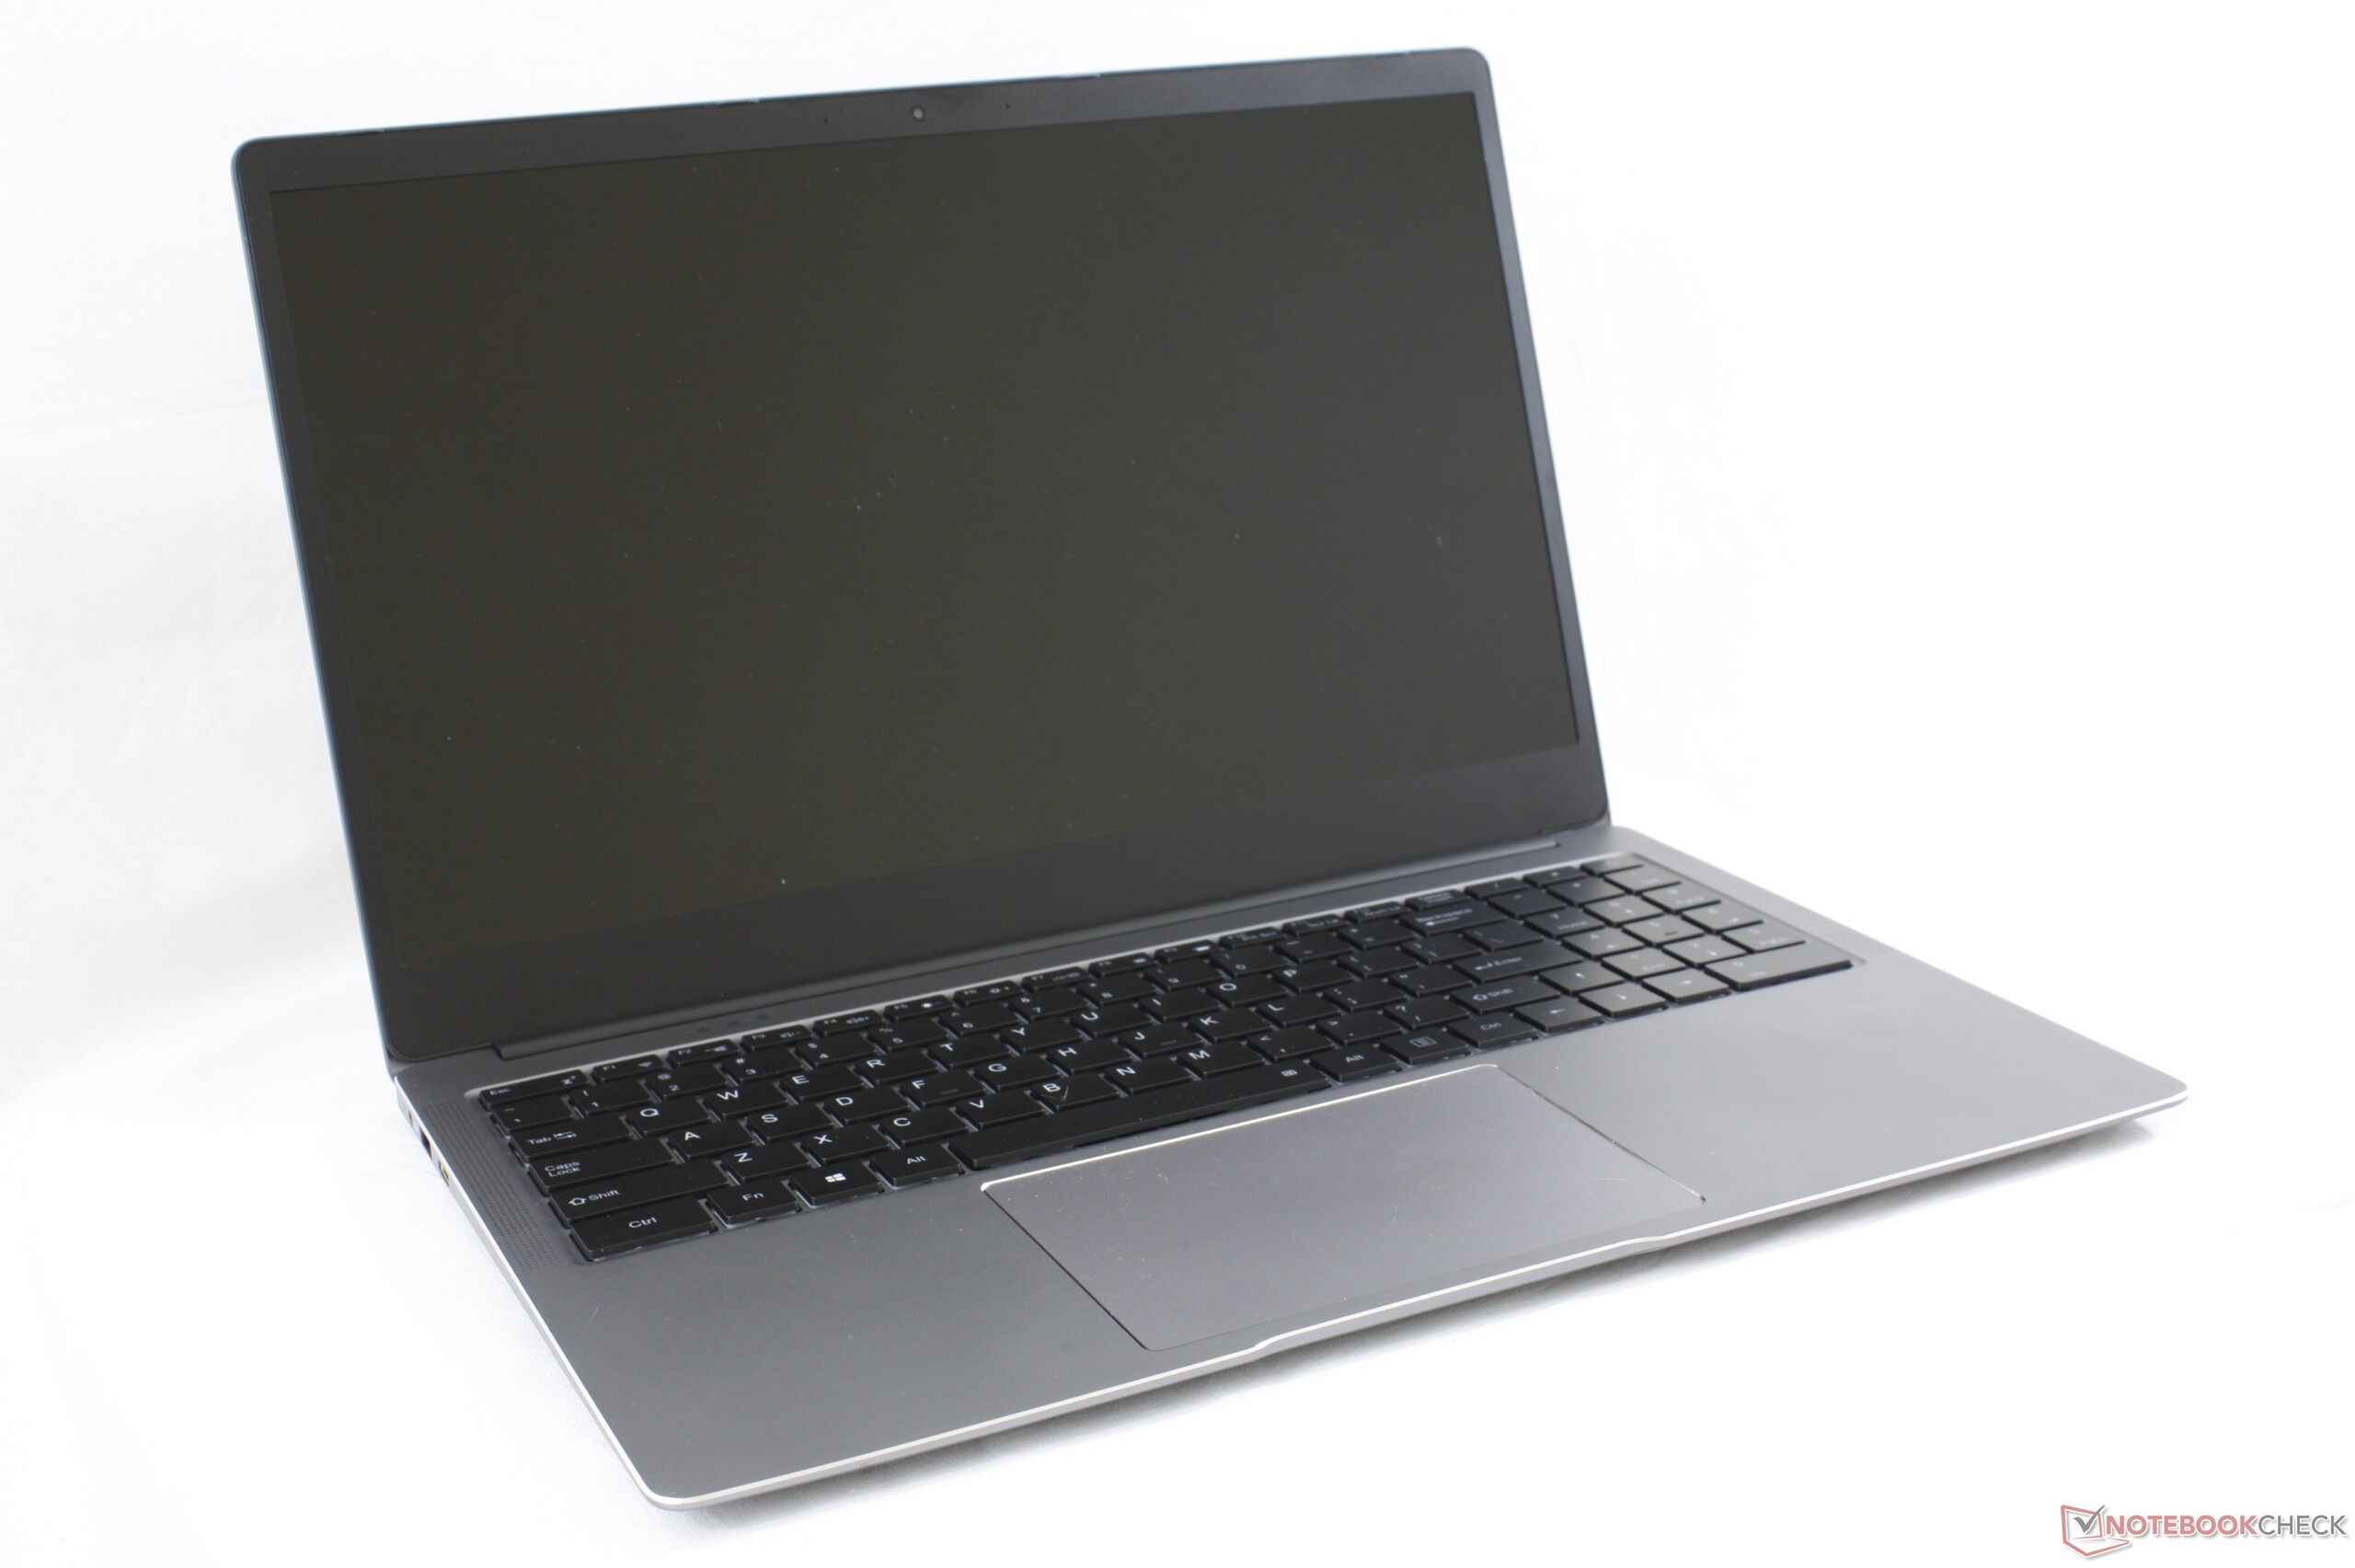
Recensione del Lapbook Chuwi un 4K per $440
| SD Card Reader | |
| average JPG Copy Test (av. of 3 runs) | |
| Dell XPS 15 9570 i7 UHD (Toshiba Exceria Pro SDXC 64 GB UHS-II) | |
| HP Spectre x360 15-df0126ng (Toshiba Exceria Pro M501 microSDXC 64GB) | |
| HP Pavilion 15-cs2019ng (Toshiba Exceria Pro SDXC 64 GB UHS-II) | |
| Asus VivoBook S15 S530UN-BQ097T (Toshiba Exceria Pro M501 64 GB UHS-II) | |
| Chuwi LapBook Plus (Toshiba Exceria Pro M501 microSDXC) | |
| maximum AS SSD Seq Read Test (1GB) | |
| HP Spectre x360 15-df0126ng (Toshiba Exceria Pro M501 microSDXC 64GB) | |
| Dell XPS 15 9570 i7 UHD (Toshiba Exceria Pro SDXC 64 GB UHS-II) | |
| HP Pavilion 15-cs2019ng (Toshiba Exceria Pro SDXC 64 GB UHS-II) | |
| Asus VivoBook S15 S530UN-BQ097T (Toshiba Exceria Pro M501 64 GB UHS-II) | |
| Chuwi LapBook Plus (Toshiba Exceria Pro M501 microSDXC) | |
| Networking | |
| iperf3 transmit AX12 | |
| Asus VivoBook S15 S530UN-BQ097T | |
| Dell XPS 15 9570 i7 UHD | |
| HP Pavilion 15-cs2019ng | |
| Chuwi LapBook Plus | |
| iperf3 receive AX12 | |
| HP Pavilion 15-cs2019ng | |
| Dell XPS 15 9570 i7 UHD | |
| Chuwi LapBook Plus | |
| Asus VivoBook S15 S530UN-BQ097T | |
| |||||||||||||||||||||||||
Distribuzione della luminosità: 82 %
Al centro con la batteria: 360.2 cd/m²
Contrasto: 1092:1 (Nero: 0.33 cd/m²)
ΔE ColorChecker Calman: 4.13 | ∀{0.5-29.43 Ø4.73}
calibrated: 3.8
ΔE Greyscale Calman: 5 | ∀{0.09-98 Ø4.97}
87.8% sRGB (Argyll 1.6.3 3D)
57.3% AdobeRGB 1998 (Argyll 1.6.3 3D)
64.5% AdobeRGB 1998 (Argyll 3D)
88.2% sRGB (Argyll 3D)
68.1% Display P3 (Argyll 3D)
Gamma: 2.23
CCT: 7532 K
| Chuwi LapBook Plus BOE NV156QUM-N51, IPS, 15.6", 3840x2160 | HP Pavilion 15-cs2019ng BOE080D, IPS, 15.6", 1920x1080 | Dell XPS 15 9570 i7 UHD LQ156D1, IPS, 15.6", 3840x2160 | Asus VivoBook S15 S530UN-BQ097T LP156WFC-SPD1, IPS LED, 15.6", 1920x1080 | Apple MacBook Pro 15 2018 (2.6 GHz, 560X) APPA040, IPS, 15.4", 2880x1800 | |
|---|---|---|---|---|---|
| Display | -0% | 17% | -38% | 31% | |
| Display P3 Coverage (%) | 68.1 | 67.2 -1% | 79.1 16% | 38.51 -43% | 98.7 45% |
| sRGB Coverage (%) | 88.2 | 88.1 0% | 98.8 12% | 57.9 -34% | 99.9 13% |
| AdobeRGB 1998 Coverage (%) | 64.5 | 64.4 0% | 79.2 23% | 39.79 -38% | 86.6 34% |
| Response Times | -12% | -22% | -2% | -16% | |
| Response Time Grey 50% / Grey 80% * (ms) | 40 ? | 43 ? -8% | 46.4 ? -16% | 38.8 ? 3% | 43.2 ? -8% |
| Response Time Black / White * (ms) | 25.2 ? | 29 ? -15% | 32 ? -27% | 26.8 ? -6% | 31.2 ? -24% |
| PWM Frequency (Hz) | 962 ? | 208 ? | 980 ? | 117000 ? | |
| Screen | 1% | 5% | -13% | 40% | |
| Brightness middle (cd/m²) | 360.2 | 320 -11% | 494 37% | 262 -27% | 520 44% |
| Brightness (cd/m²) | 337 | 293 -13% | 457 36% | 256 -24% | 492 46% |
| Brightness Distribution (%) | 82 | 86 5% | 88 7% | 90 10% | 88 7% |
| Black Level * (cd/m²) | 0.33 | 0.26 21% | 0.34 -3% | 0.21 36% | 0.39 -18% |
| Contrast (:1) | 1092 | 1231 13% | 1453 33% | 1248 14% | 1333 22% |
| Colorchecker dE 2000 * | 4.13 | 4.5 -9% | 5.2 -26% | 5.8 -40% | 1.2 71% |
| Colorchecker dE 2000 max. * | 8.15 | 8.81 -8% | 17.5 -115% | 14.3 -75% | 2.3 72% |
| Colorchecker dE 2000 calibrated * | 3.8 | 4.6 -21% | |||
| Greyscale dE 2000 * | 5 | 4.71 6% | 2.7 46% | 2.5 50% | 1.3 74% |
| Gamma | 2.23 99% | 2.45 90% | 2.1 105% | 1.99 111% | 2.18 101% |
| CCT | 7532 86% | 7085 92% | 7038 92% | 6528 100% | 6738 96% |
| Color Space (Percent of AdobeRGB 1998) (%) | 57.3 | 58 1% | 71.2 24% | 36.6 -36% | |
| Color Space (Percent of sRGB) (%) | 87.8 | 88 0% | 98.8 13% | 57.6 -34% | |
| Media totale (Programma / Settaggio) | -4% /
-1% | 0% /
4% | -18% /
-17% | 18% /
29% |
* ... Meglio usare valori piccoli
Tempi di risposta del Display
| ↔ Tempi di risposta dal Nero al Bianco | ||
|---|---|---|
| 25.2 ms ... aumenta ↗ e diminuisce ↘ combinato | ↗ 14 ms Incremento | 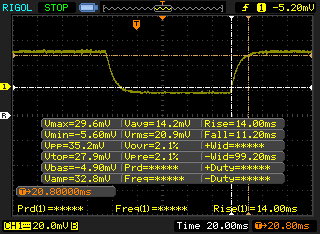 |
| ↘ 11.2 ms Calo | ||
| Lo schermo mostra tempi di risposta relativamente lenti nei nostri tests e potrebbe essere troppo lento per i gamers. In confronto, tutti i dispositivi di test variano da 0.1 (minimo) a 240 (massimo) ms. » 60 % di tutti i dispositivi è migliore. Questo significa che i tempi di risposta rilevati sono peggiori rispetto alla media di tutti i dispositivi testati (19.9 ms). | ||
| ↔ Tempo di risposta dal 50% Grigio all'80% Grigio | ||
| 40 ms ... aumenta ↗ e diminuisce ↘ combinato | ↗ 21.2 ms Incremento | 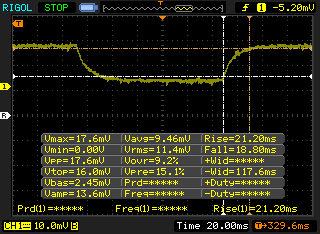 |
| ↘ 18.8 ms Calo | ||
| Lo schermo mostra tempi di risposta lenti nei nostri tests e sarà insoddisfacente per i gamers. In confronto, tutti i dispositivi di test variano da 0.165 (minimo) a 636 (massimo) ms. » 61 % di tutti i dispositivi è migliore. Questo significa che i tempi di risposta rilevati sono peggiori rispetto alla media di tutti i dispositivi testati (31.1 ms). | ||
Sfarfallio dello schermo / PWM (Pulse-Width Modulation)
| flickering dello schermo / PWM rilevato | 962 Hz | ≤ 99 % settaggio luminosita' | 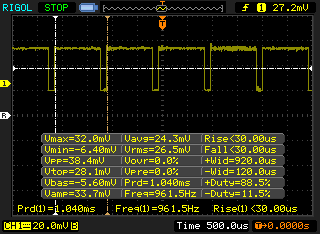 |
Il display sfarfalla a 962 Hz (Probabilmente a causa dell'uso di PWM) Flickering rilevato ad una luminosita' di 99 % o inferiore. Non dovrebbe verificarsi flickering o PWM sopra questo valore di luminosita'. La frequenza di 962 Hz è abbastanza alta, quindi la maggioranza degli utenti sensibili al PWM non dovrebbero notare alcun flickering. In confronto: 52 % di tutti i dispositivi testati non utilizza PWM per ridurre la luminosita' del display. Se è rilevato PWM, una media di 7798 (minimo: 5 - massimo: 343500) Hz è stata rilevata. | |||
| Cinebench R11.5 | |
| CPU Single 64Bit | |
| Acer Swift 3 SF314-55-31N8 | |
| Microsoft Surface Pro (2017) m3 | |
| Lenovo ThinkPad X1 Tablet | |
| Asus X555DA-BB11 | |
| Chuwi LapBook Plus | |
| Asus Transformer Book T200TA PL | |
| CPU Multi 64Bit | |
| Acer Swift 3 SF314-55-31N8 | |
| Microsoft Surface Pro (2017) m3 | |
| Lenovo ThinkPad X1 Tablet | |
| Asus X555DA-BB11 | |
| Chuwi LapBook Plus | |
| Asus Transformer Book T200TA PL | |
| Cinebench R10 | |
| Rendering Multiple CPUs 32Bit | |
| Acer Swift 3 SF314-55-31N8 | |
| Microsoft Surface Pro (2017) m3 | |
| Lenovo Tablet 10-20L3000KGE | |
| Asus X555DA-BB11 | |
| Asus Transformer Book T200TA PL | |
| Chuwi LapBook Plus | |
| Chuwi HeroBook 14 | |
| Trekstor SurfTab duo W3 | |
| HP x2 210 G1 | |
| Rendering Single 32Bit | |
| Acer Swift 3 SF314-55-31N8 | |
| Microsoft Surface Pro (2017) m3 | |
| Asus X555DA-BB11 | |
| Lenovo Tablet 10-20L3000KGE | |
| Chuwi LapBook Plus | |
| Asus Transformer Book T200TA PL | |
| Trekstor SurfTab duo W3 | |
| Chuwi HeroBook 14 | |
| HP x2 210 G1 | |
| wPrime 2.10 - 1024m | |
| Chuwi HeroBook 14 | |
| Chuwi LapBook Plus | |
| Asus Transformer Book T200TA PL | |
| Lenovo ThinkPad X1 Tablet | |
| Asus X555DA-BB11 | |
| Acer Swift 3 SF314-55-31N8 | |
* ... Meglio usare valori piccoli
| PCMark 8 Home Score Accelerated v2 | 1371 punti | |
| PCMark 10 Score | 1144 punti | |
Aiuto | ||
| Chuwi LapBook Plus Kimtigo KT256GM28S3 | HP Pavilion 15-cs2019ng Toshiba KBG30ZMV256G | HP Spectre x360 15-df0126ng Toshiba XG5-P KXG50PNV2T04 | Asus VivoBook S15 S530UN-BQ097T SanDisk SD9SN8W256G1027 | Chuwi HeroBook 14 SanDisk DF4064 | |
|---|---|---|---|---|---|
| AS SSD | 263% | 344% | 111% | -65% | |
| Seq Read (MB/s) | 391.5 | 1153 195% | 2018 415% | 504 29% | 127.9 -67% |
| Seq Write (MB/s) | 419.4 | 736 75% | 773 84% | 202.7 -52% | 85.9 -80% |
| 4K Read (MB/s) | 7.36 | 46.51 532% | 24.62 235% | 27.67 276% | 9.33 27% |
| 4K Write (MB/s) | 15.16 | 114.1 653% | 92.8 512% | 51.1 237% | 10.77 -29% |
| 4K-64 Read (MB/s) | 139.4 | 618 343% | 845 506% | 373.6 168% | 27.59 -80% |
| 4K-64 Write (MB/s) | 137.7 | 461.4 235% | 957 595% | 173 26% | 8.6 -94% |
| Access Time Read * (ms) | 0.361 | 0.421 -17% | 0.147 59% | 0.365 -1% | 0.408 -13% |
| Access Time Write * (ms) | 0.462 | 0.233 50% | 0.057 88% | 0.603 -31% | 0.904 -96% |
| Score Read (Points) | 186 | 780 319% | 1071 476% | 452 143% | 50 -73% |
| Score Write (Points) | 195 | 649 233% | 1127 478% | 244 25% | 28 -86% |
| Score Total (Points) | 479 | 1822 280% | 2684 460% | 921 92% | 105 -78% |
| Copy ISO MB/s (MB/s) | 464.9 | 1652 255% | 810 74% | 59 -87% | |
| Copy Program MB/s (MB/s) | 77.7 | 328.5 323% | 332.5 328% | 15.61 -80% | |
| Copy Game MB/s (MB/s) | 162 | 700 332% | 557 244% | 37.2 -77% |
* ... Meglio usare valori piccoli

| 3DMark 06 Standard Score | 4884 punti | |
| 3DMark Vantage P Result | 2744 punti | |
| 3DMark 11 Performance | 835 punti | |
| 3DMark Ice Storm Standard Score | 23656 punti | |
| 3DMark Cloud Gate Standard Score | 2880 punti | |
| 3DMark Time Spy Score | 161 punti | |
Aiuto | ||
| basso | medio | alto | ultra | |
|---|---|---|---|---|
| Rocket League (2017) | 21.4 | 15.3 |
(-) La temperatura massima sul lato superiore è di 46.2 °C / 115 F, rispetto alla media di 36.8 °C / 98 F, che varia da 21 a 71 °C per questa classe Multimedia.
(-) Il lato inferiore si riscalda fino ad un massimo di 51 °C / 124 F, rispetto alla media di 39.1 °C / 102 F
(+) In idle, la temperatura media del lato superiore è di 28.3 °C / 83 F, rispetto alla media deld ispositivo di 31.3 °C / 88 F.
(+) I poggiapolsi e il touchpad raggiungono la temperatura massima della pelle (33.6 °C / 92.5 F) e quindi non sono caldi.
(-) La temperatura media della zona del palmo della mano di dispositivi simili e'stata di 28.7 °C / 83.7 F (-4.9 °C / -8.8 F).
Chuwi LapBook Plus analisi audio
(-) | altoparlanti non molto potenti (69.8 dB)
Bassi 100 - 315 Hz
(-) | quasi nessun basso - in media 17.2% inferiori alla media
(±) | la linearità dei bassi è media (10.5% delta rispetto alla precedente frequenza)
Medi 400 - 2000 Hz
(+) | medi bilanciati - solo only 3.8% rispetto alla media
(±) | linearità dei medi adeguata (13.8% delta rispetto alla precedente frequenza)
Alti 2 - 16 kHz
(+) | Alti bilanciati - appena 4.5% dalla media
(±) | la linearità degli alti è media (12.6% delta rispetto alla precedente frequenza)
Nel complesso 100 - 16.000 Hz
(-) | suono nel complesso non lineare (35.5% di differenza rispetto alla media
Rispetto alla stessa classe
» 98% di tutti i dispositivi testati in questa classe è stato migliore, 0% simile, 1% peggiore
» Il migliore ha avuto un delta di 5%, medio di 17%, peggiore di 45%
Rispetto a tutti i dispositivi testati
» 94% di tutti i dispositivi testati in questa classe è stato migliore, 1% similare, 6% peggiore
» Il migliore ha avuto un delta di 4%, medio di 24%, peggiore di 134%
Apple MacBook 12 (Early 2016) 1.1 GHz analisi audio
(+) | gli altoparlanti sono relativamente potenti (83.6 dB)
Bassi 100 - 315 Hz
(±) | bassi ridotti - in media 11.3% inferiori alla media
(±) | la linearità dei bassi è media (14.2% delta rispetto alla precedente frequenza)
Medi 400 - 2000 Hz
(+) | medi bilanciati - solo only 2.4% rispetto alla media
(+) | medi lineari (5.5% delta rispetto alla precedente frequenza)
Alti 2 - 16 kHz
(+) | Alti bilanciati - appena 2% dalla media
(+) | alti lineari (4.5% delta rispetto alla precedente frequenza)
Nel complesso 100 - 16.000 Hz
(+) | suono nel complesso lineare (10.2% differenza dalla media)
Rispetto alla stessa classe
» 7% di tutti i dispositivi testati in questa classe è stato migliore, 2% simile, 91% peggiore
» Il migliore ha avuto un delta di 5%, medio di 18%, peggiore di 53%
Rispetto a tutti i dispositivi testati
» 5% di tutti i dispositivi testati in questa classe è stato migliore, 1% similare, 94% peggiore
» Il migliore ha avuto un delta di 4%, medio di 24%, peggiore di 134%
| Off / Standby | |
| Idle | |
| Sotto carico |
|
Leggenda:
min: | |
| Chuwi LapBook Plus x7-E3950, HD Graphics 505, Kimtigo KT256GM28S3, IPS, 3840x2160, 15.6" | HP Pavilion 15-cs2019ng i5-8265U, GeForce MX250, Toshiba KBG30ZMV256G, IPS, 1920x1080, 15.6" | Dell XPS 15 9570 i7 UHD i7-8750H, GeForce GTX 1050 Ti Max-Q, Toshiba XG5 KXG50ZNV512G, IPS, 3840x2160, 15.6" | Asus VivoBook S15 S530UN-BQ097T i5-8550U, GeForce MX150, SanDisk SD9SN8W256G1027, IPS LED, 1920x1080, 15.6" | HP Spectre x360 15-df0126ng i7-8750H, GeForce GTX 1050 Ti Max-Q, Toshiba XG5-P KXG50PNV2T04, IPS, 3840x2160, 15.6" | Microsoft Surface Pro 6, Core i5, 128 GB i5-8250U, UHD Graphics 620, Toshiba KBG30ZPZ128G, IPS, 2736x1834, 12.3" | |
|---|---|---|---|---|---|---|
| Power Consumption | -40% | -205% | -51% | -141% | -3% | |
| Idle Minimum * (Watt) | 6.6 | 4.9 26% | 9.48 -44% | 3.1 53% | 2.1 68% | 4.3 35% |
| Idle Average * (Watt) | 11.3 | 7.9 30% | 16.1 -42% | 6.3 44% | 6.7 41% | 8.7 23% |
| Idle Maximum * (Watt) | 11.7 | 10.1 14% | 16.9 -44% | 8.6 26% | 11.4 3% | 9.4 20% |
| Load Average * (Watt) | 21.1 | 60 -184% | 90.8 -330% | 56.4 -167% | 77.7 -268% | 24.5 -16% |
| Load Maximum * (Watt) | 20.2 | 38 -88% | 134.4 -565% | 62.7 -210% | 131.5 -551% | 36 -78% |
| Witcher 3 ultra * (Watt) | 45 |
* ... Meglio usare valori piccoli
| Chuwi LapBook Plus x7-E3950, HD Graphics 505, 36 Wh | HP Pavilion 15-cs2019ng i5-8265U, GeForce MX250, 41 Wh | Dell XPS 15 9570 i7 UHD i7-8750H, GeForce GTX 1050 Ti Max-Q, 97 Wh | HP Spectre x360 15-df0126ng i7-8750H, GeForce GTX 1050 Ti Max-Q, 84 Wh | Asus VivoBook S15 S530UN-BQ097T i5-8550U, GeForce MX150, 42 Wh | Apple MacBook Pro 15 2018 (2.6 GHz, 560X) i7-8850H, Radeon Pro 560X, 83 Wh | |
|---|---|---|---|---|---|---|
| Autonomia della batteria | 43% | 174% | 151% | 86% | 191% | |
| WiFi v1.3 (h) | 3.5 | 5 43% | 9.6 174% | 8.8 151% | 6.5 86% | 10.2 191% |
| Reader / Idle (h) | 8 | 18.8 | ||||
| Load (h) | 1.3 | 1.3 | 2.3 | |||
| Witcher 3 ultra (h) | 1 | 1.5 |
Pro
Contro
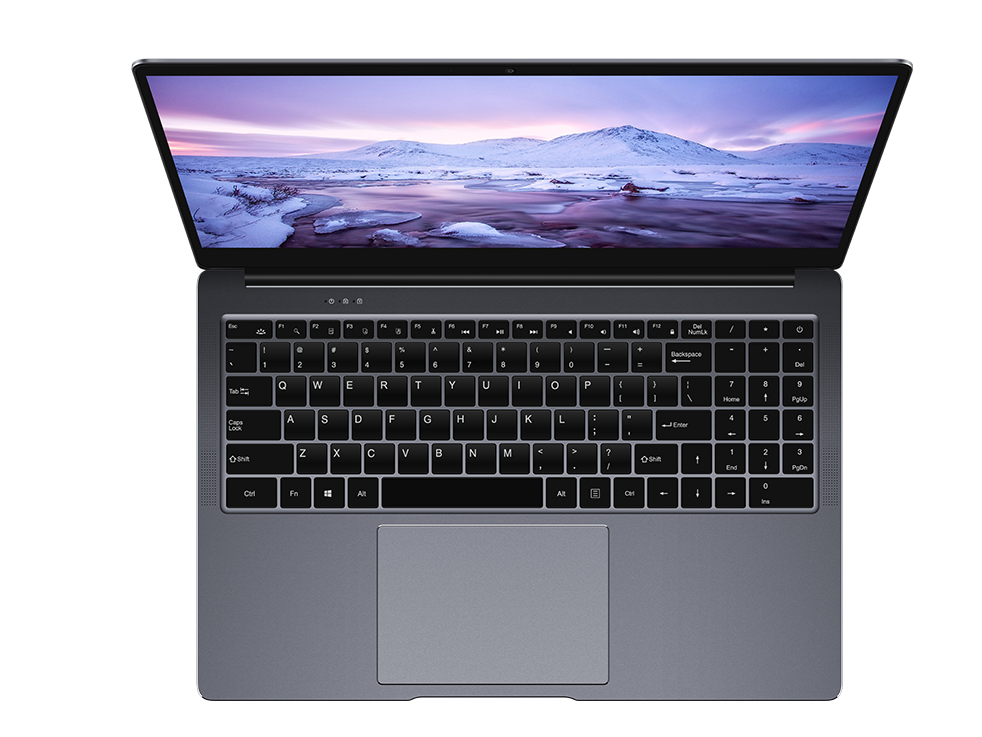
Per quanto sottile e sexy possa apparire, le prestazioni sono troppo lente da raccomandare il dispositivo per qualcosa di più di un semplice Print Server o stazione di posta elettronica. Anche le azioni più semplici come cliccare e digitare hanno notevoli ritardi e rendono questo LapBook Plus una scelta sbagliata per scopi multimediali, streaming o navigazione.
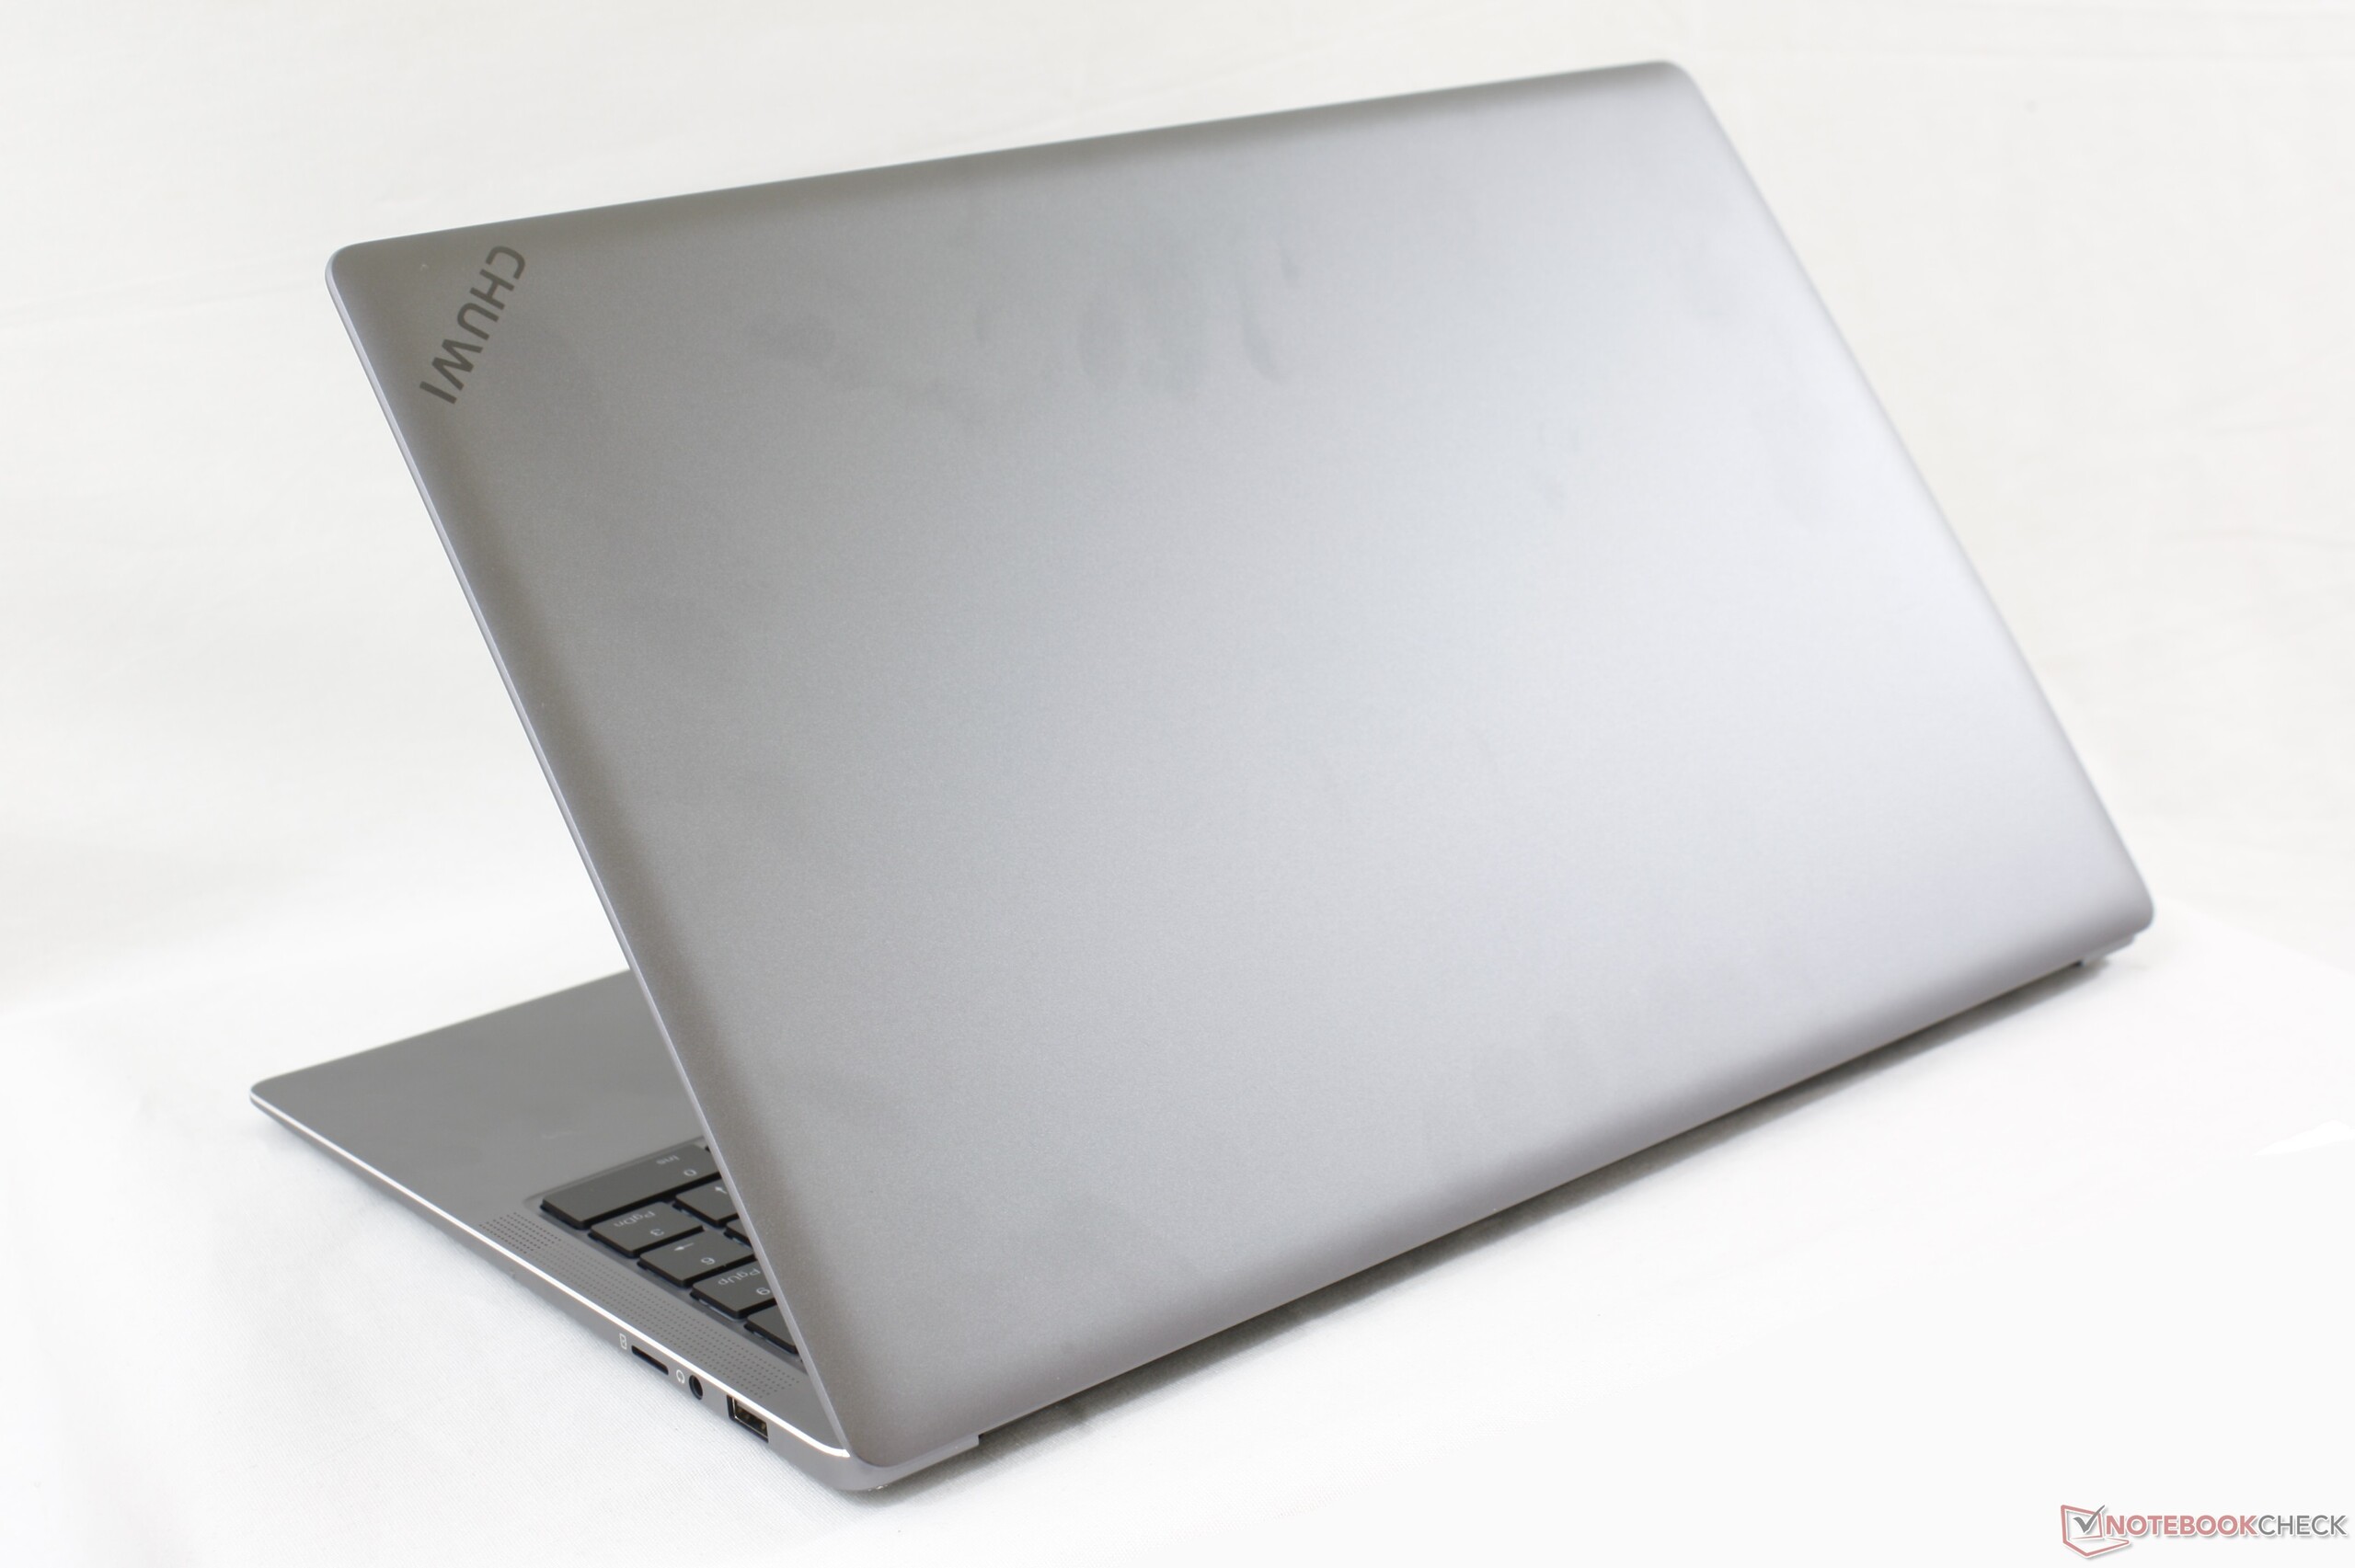
A giudizio di Chuwi, la tastiera è in realtà abbastanza buona rispetto ad altri Ultrabooks e il display 4K UHD non ha eguali in questa fascia di prezzo. Purtroppo, queste qualità rispettabili non sono di alcuna utilità pratica in quanto sono trascinati giù da uno dei processori più lenti che si possono trovare su qualsiasi computer portatile in uscita quest'anno.
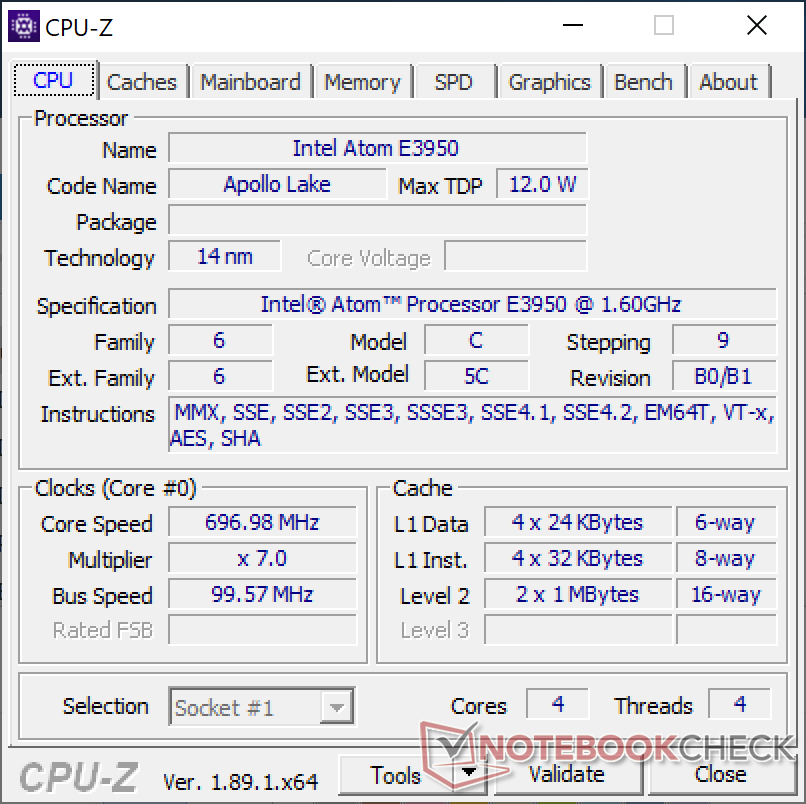
Un bel computer portatile intrappolato nel purgatorio di Intel Atom. Il processore molto lento trascina giù quello che avrebbe potuto essere un Ultrabook decente ed economico. Gli utenti farebbero meglio a scegliere un computer portatile Core i3 di ultima generazione per prestazioni più veloci e affidabili.
Chuwi LapBook Plus
- 07/05/2019 v6 (old)
Allen Ngo
Price comparison
