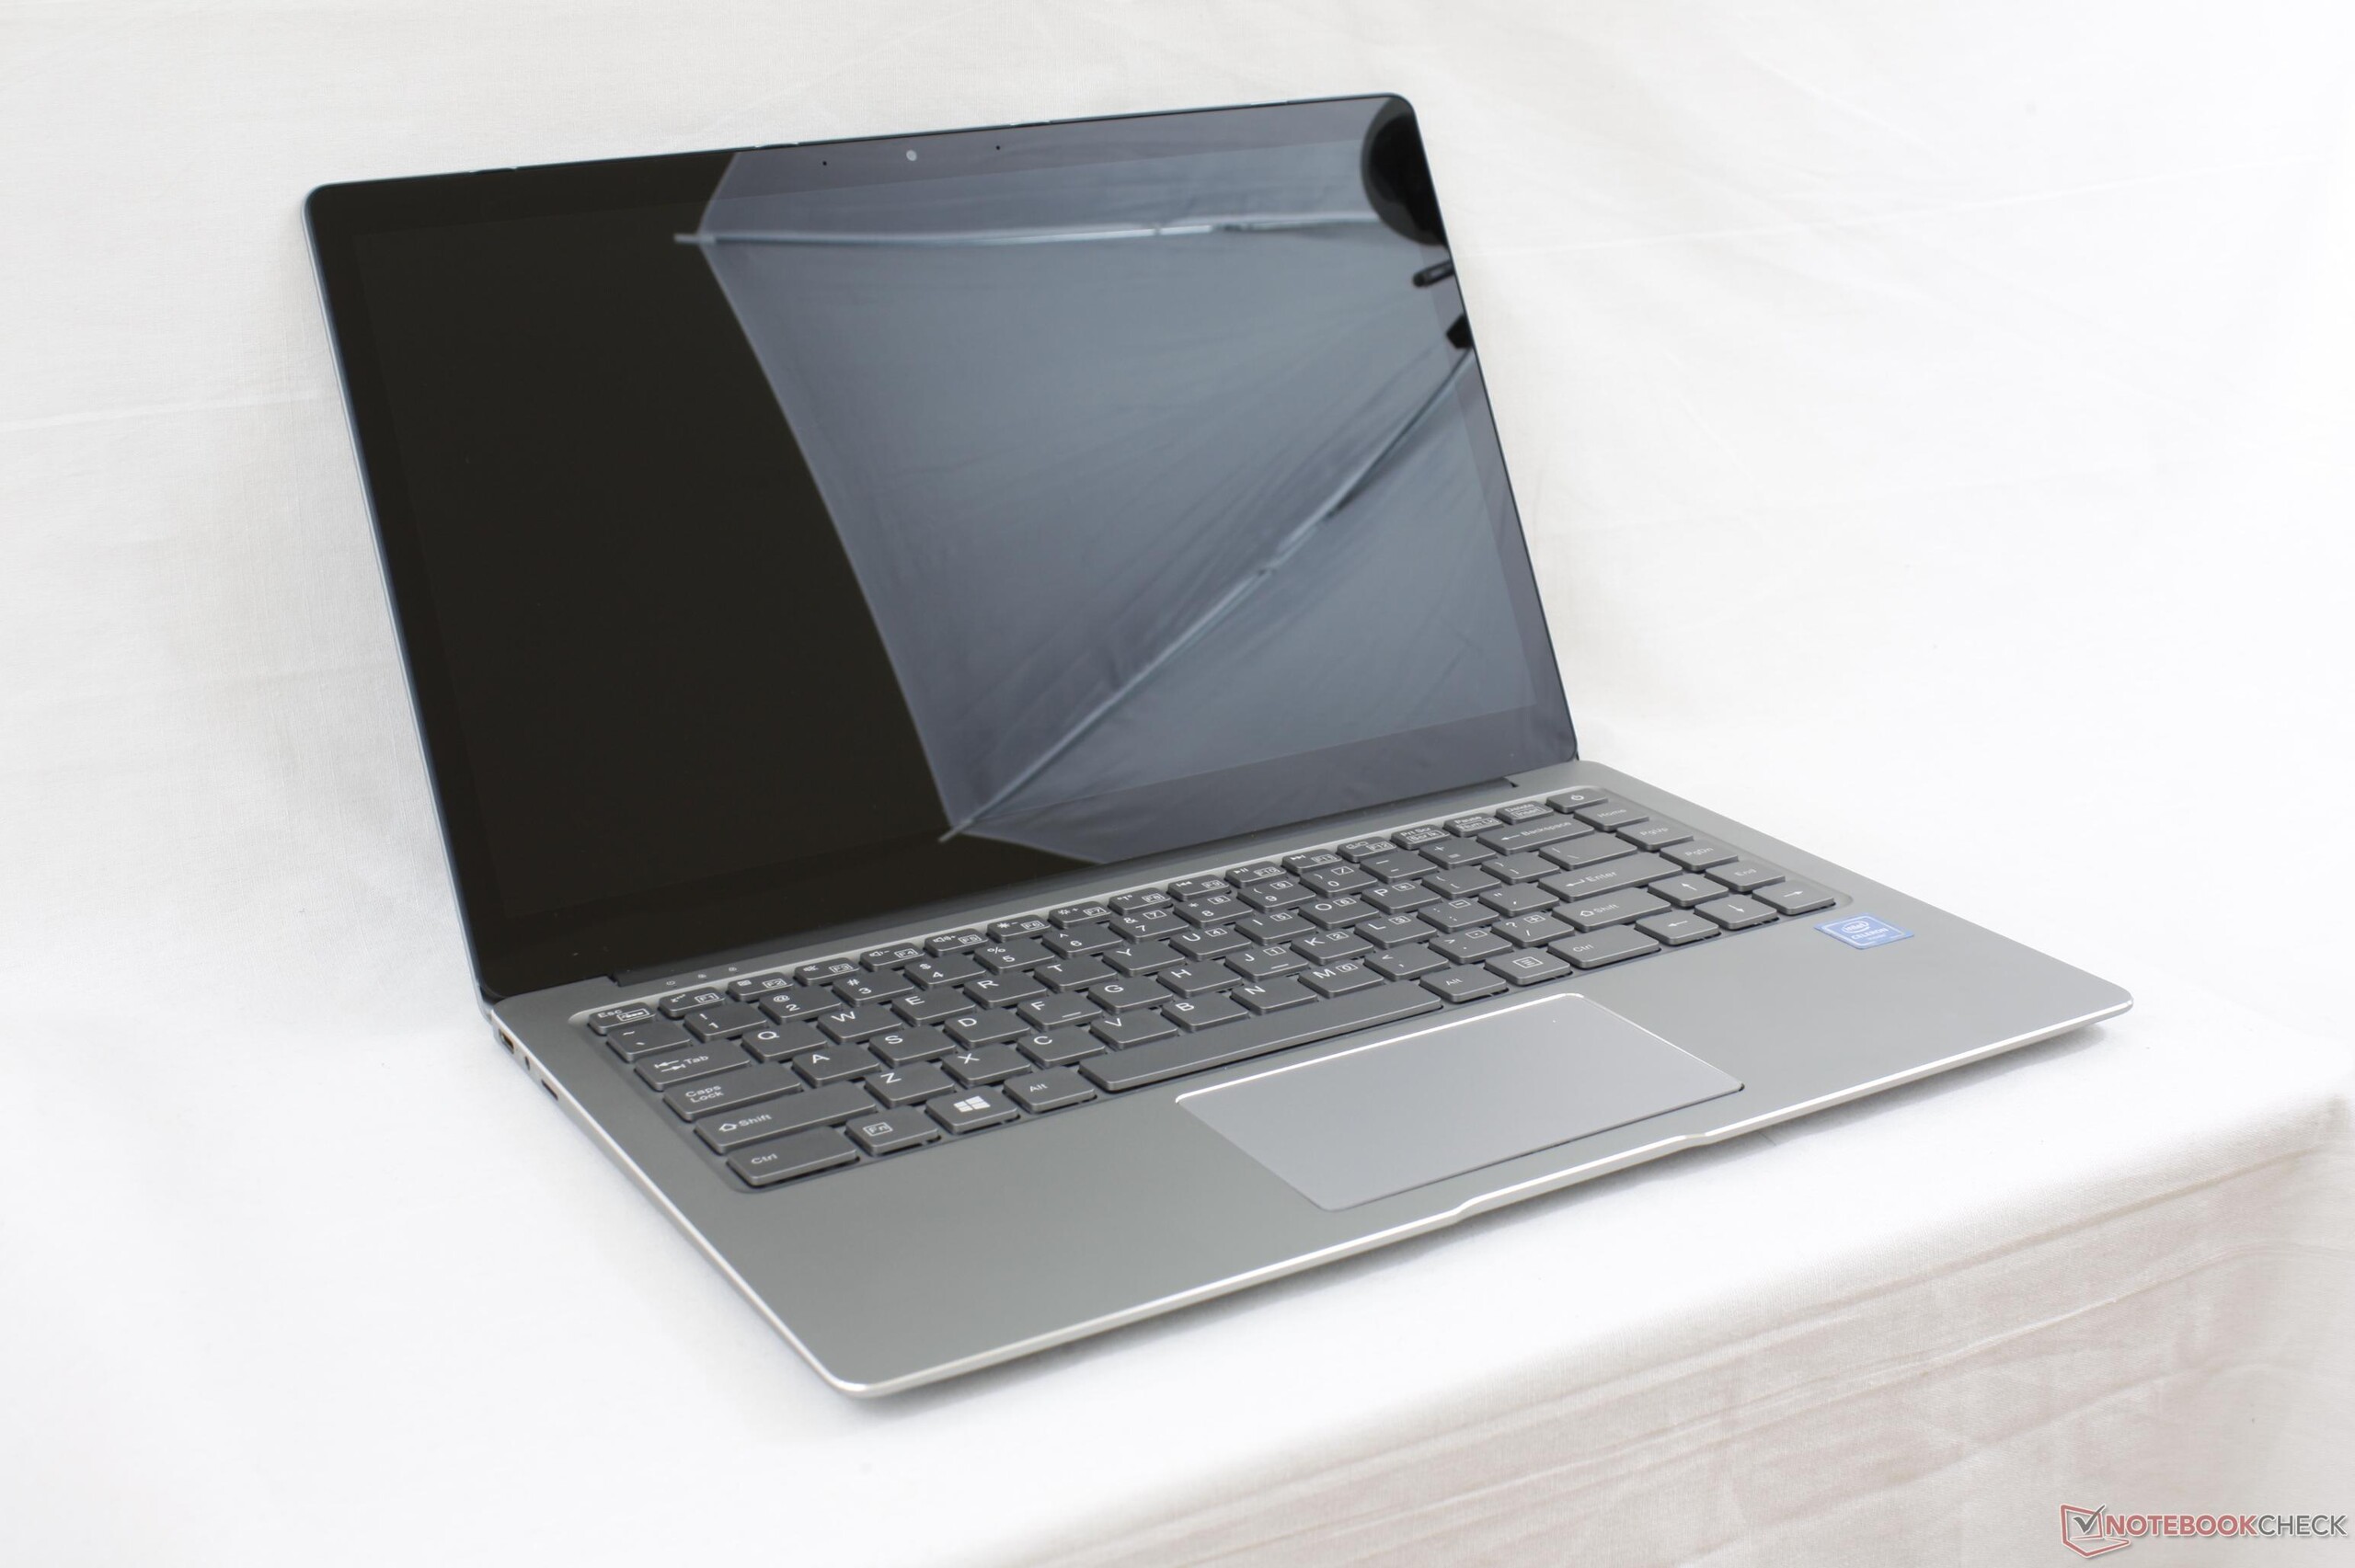
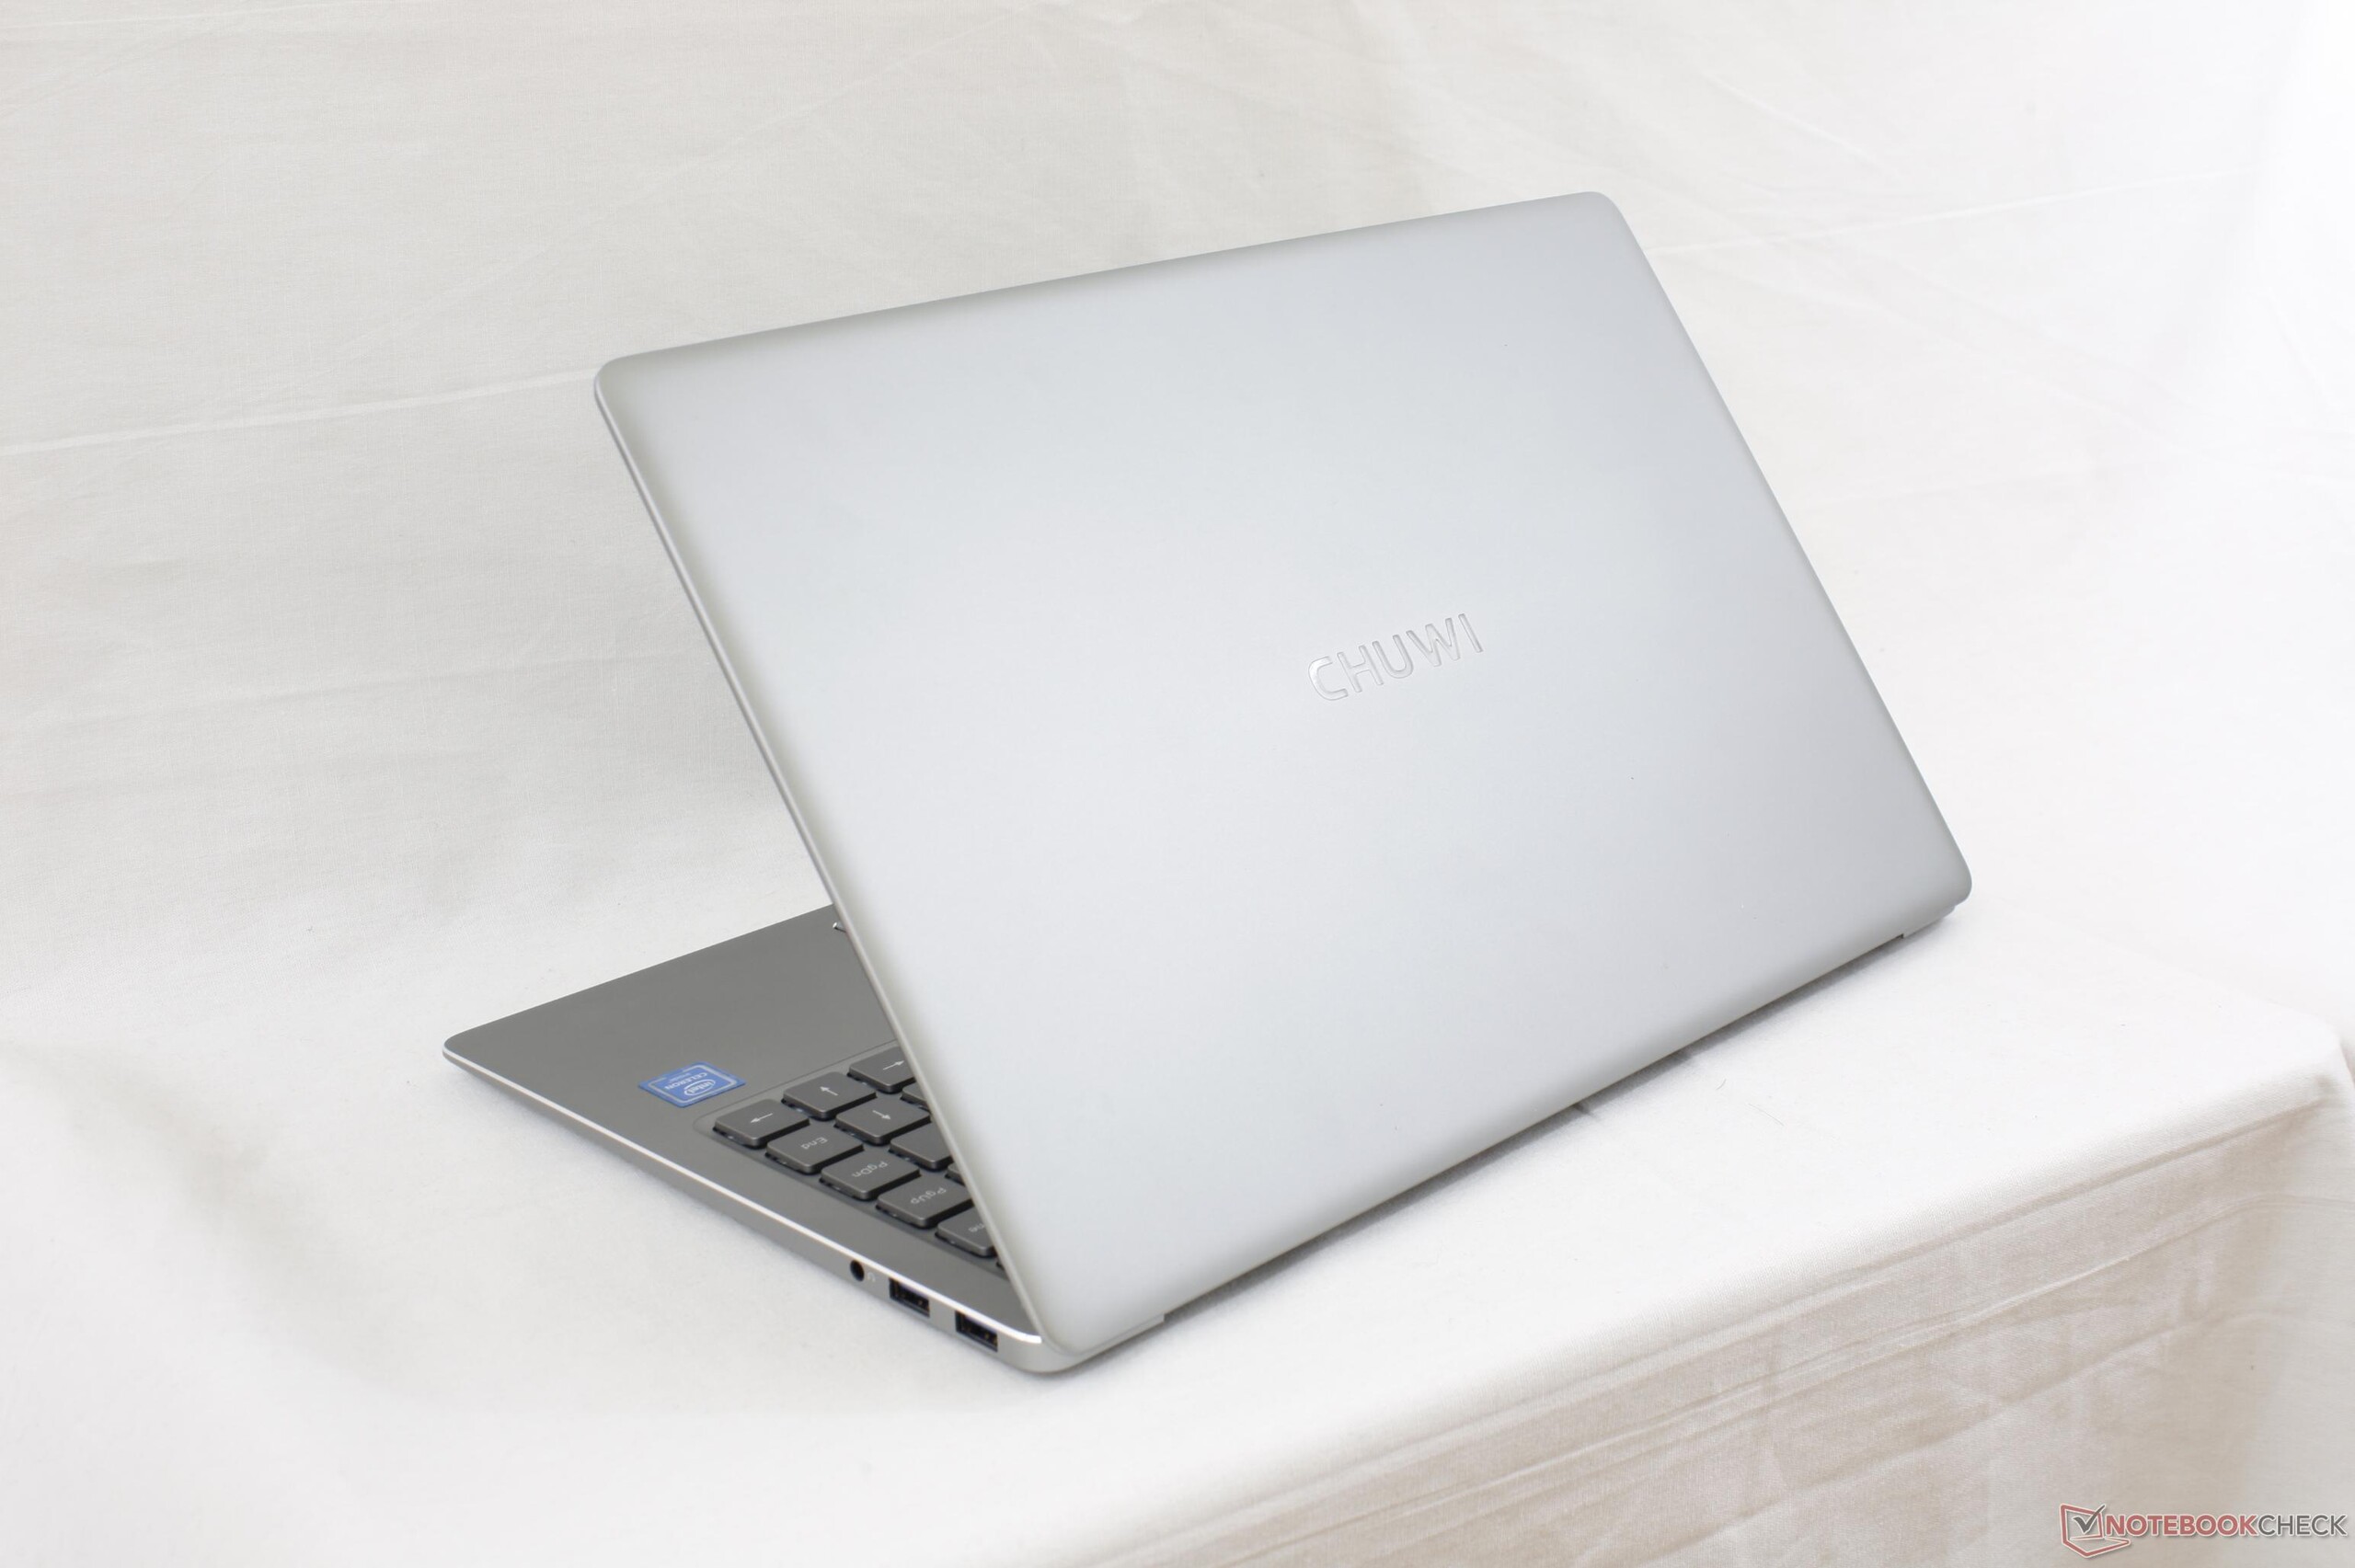
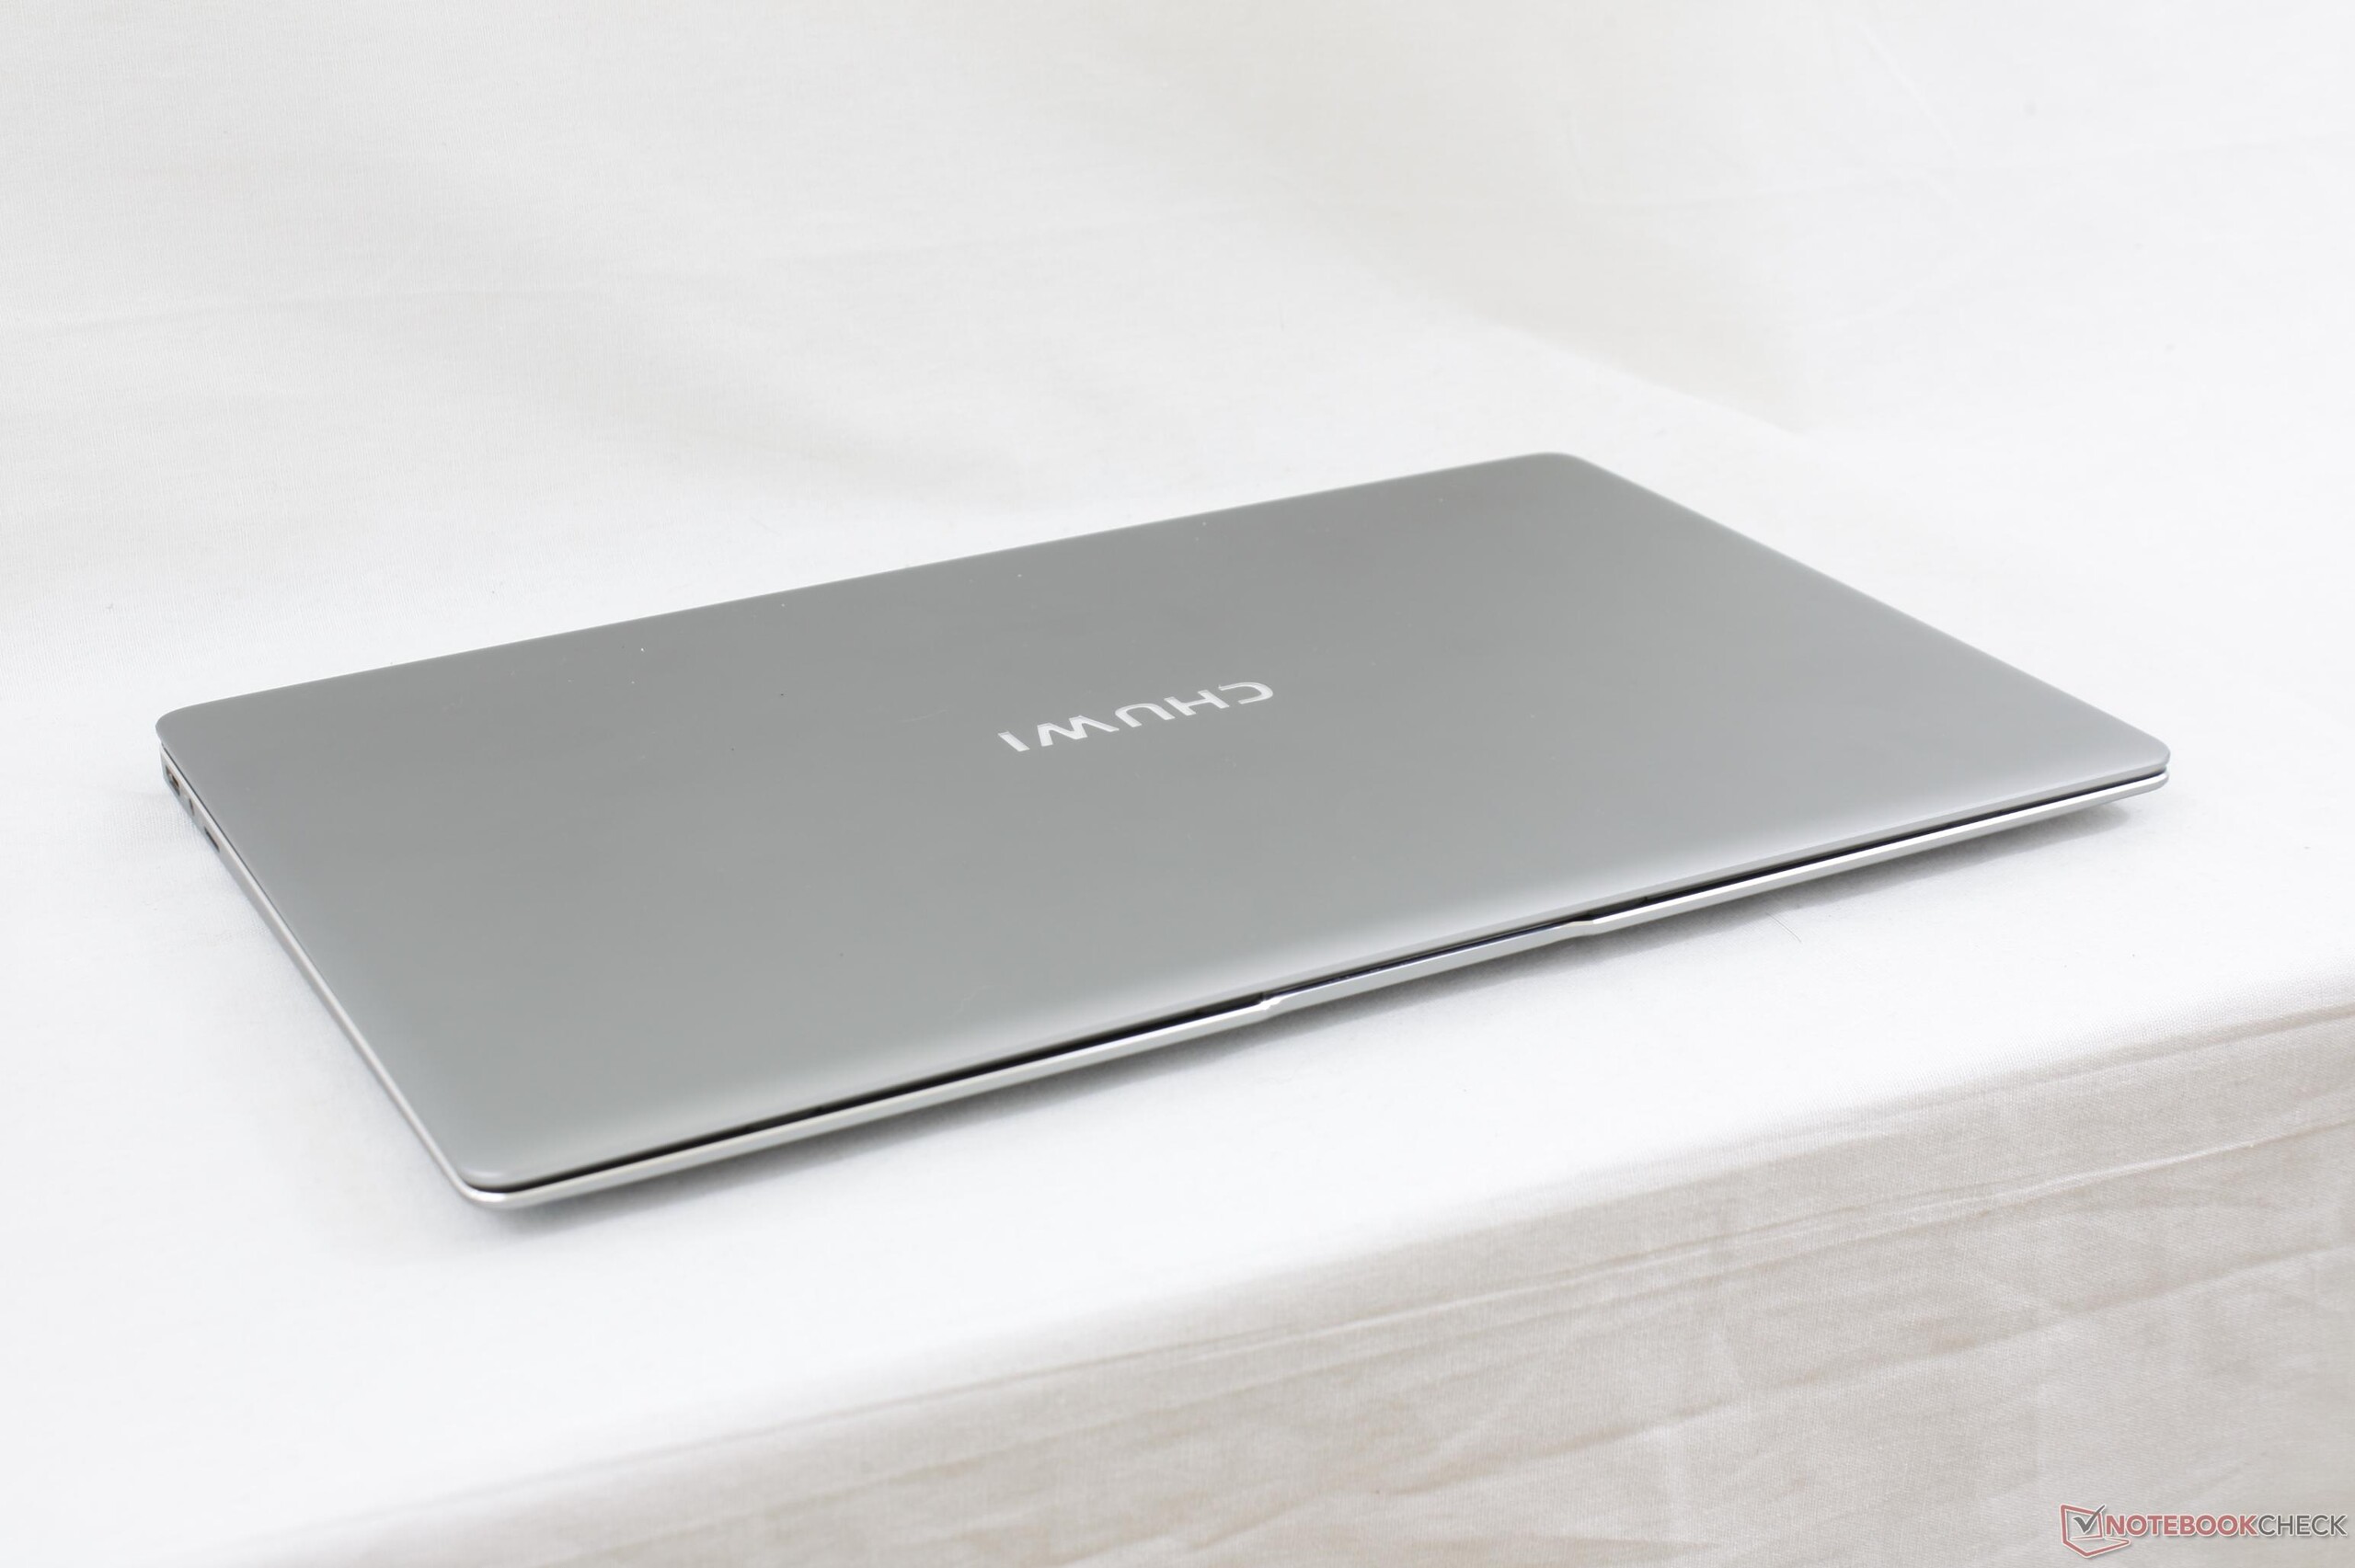
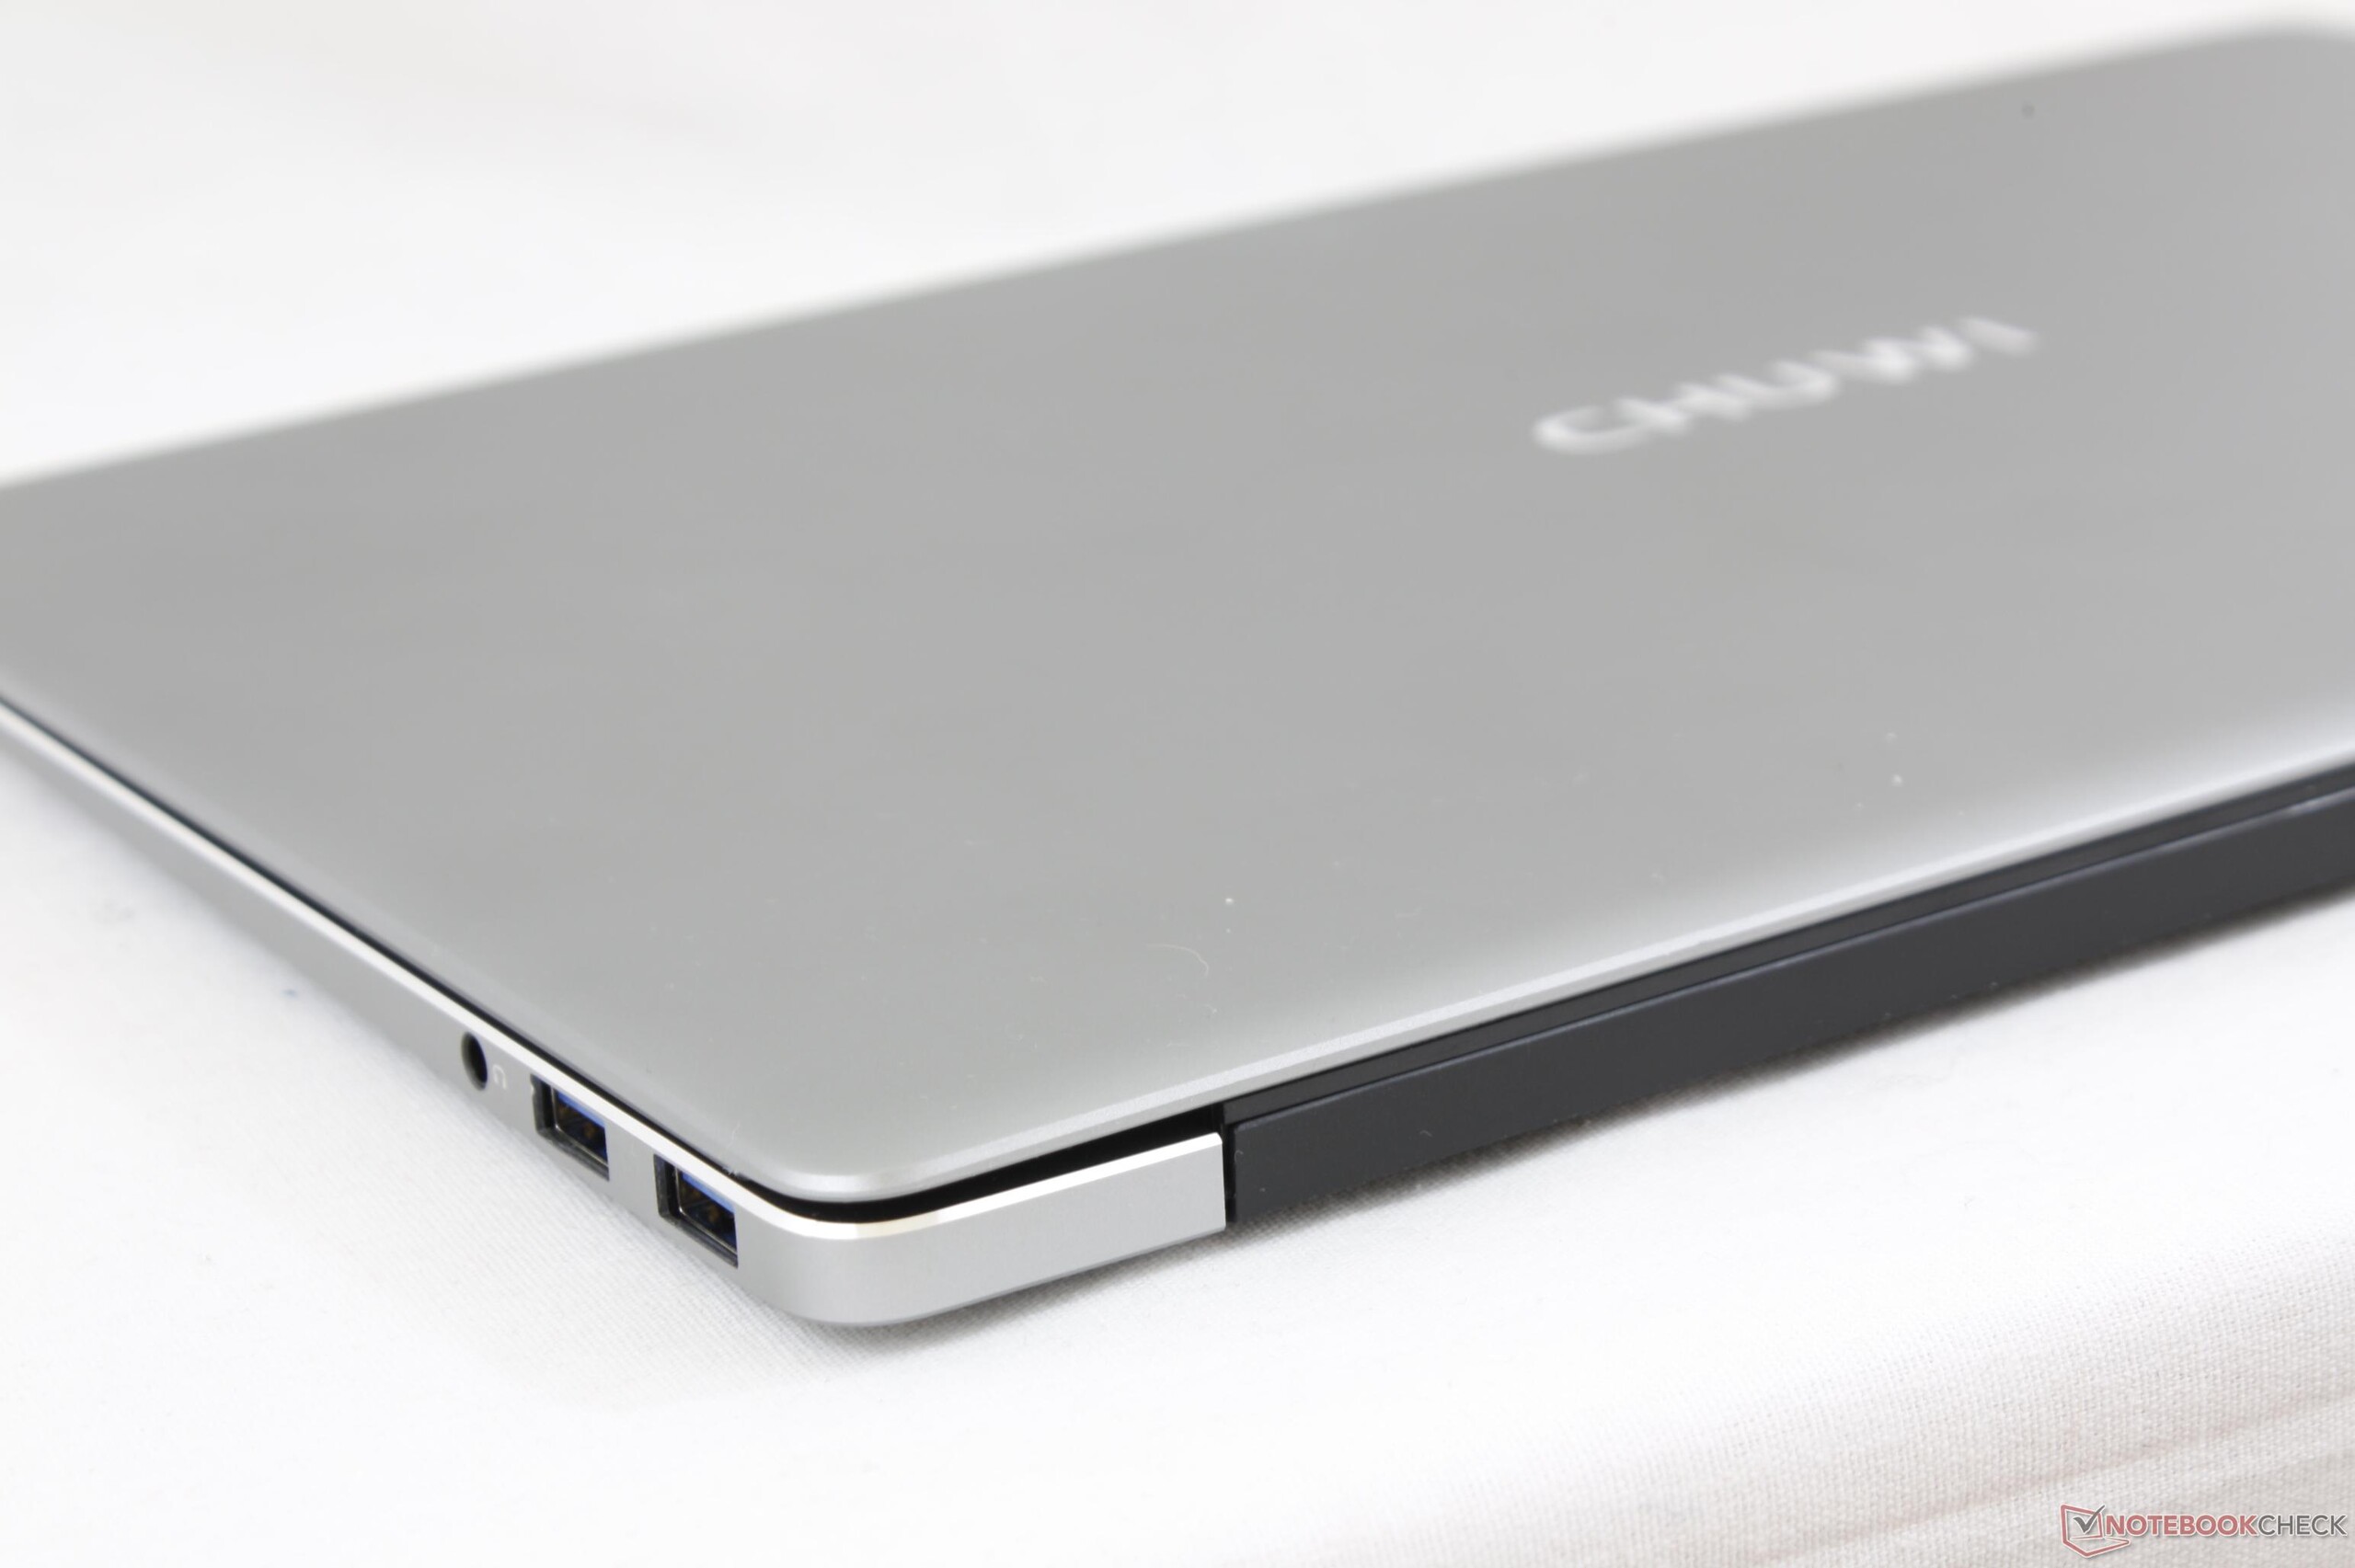
Recensione breve del Portatile Chuwi LapBook Air 14.1 (N3450, FHD)
| SD Card Reader | |
| average JPG Copy Test (av. of 3 runs) | |
| Dell XPS 13 i7-8550U | |
| Samsung Notebook 9 NP900X3N-K01US | |
| Chuwi LapBook 14 inch 2017 | |
| maximum AS SSD Seq Read Test (1GB) | |
| Dell XPS 13 i7-8550U | |
| Samsung Notebook 9 NP900X3N-K01US | |
| Chuwi LapBook 14 inch 2017 | |
| Networking | |
| iperf3 transmit AX12 | |
| Dell XPS 13 i7-8550U | |
| Samsung Notebook 9 NP900X3N-K01US | |
| Chuwi LapBook 14 inch 2017 | |
| iperf3 receive AX12 | |
| Samsung Notebook 9 NP900X3N-K01US | |
| Dell XPS 13 i7-8550U | |
| Chuwi LapBook 14 inch 2017 | |
| |||||||||||||||||||||||||
Distribuzione della luminosità: 92 %
Al centro con la batteria: 247.7 cd/m²
Contrasto: 774:1 (Nero: 0.32 cd/m²)
ΔE ColorChecker Calman: 6.4 | ∀{0.5-29.43 Ø4.71}
ΔE Greyscale Calman: 4.5 | ∀{0.09-98 Ø4.96}
62.9% sRGB (Argyll 1.6.3 3D)
39.8% AdobeRGB 1998 (Argyll 1.6.3 3D)
43.93% AdobeRGB 1998 (Argyll 3D)
63.6% sRGB (Argyll 3D)
42.53% Display P3 (Argyll 3D)
Gamma: 2.33
CCT: 7318 K
| Chuwi LapBook 14 inch 2017 Name: BOE06A8, IPS, 14.1", 1920x1080 | Lenovo Ideapad 110S-11IBR Chi Mei CMN1132, TN LED, 11.6", 1366x768 | Jumper EZbook 3 MS_9003, TN LED, 14.1", 1920x1080 | HP Pavilion 14-al103ng AU Optronics, IPS, 14", 1920x1080 | Apple MacBook Air 13 inch 2015-03 Apple APP9CF0, TN LED, 13.3", 1440x900 | |
|---|---|---|---|---|---|
| Display | 1% | 21% | -14% | -6% | |
| Display P3 Coverage (%) | 42.53 | 42.77 1% | 51.6 21% | 36.58 -14% | 40.1 -6% |
| sRGB Coverage (%) | 63.6 | 64.2 1% | 77.3 22% | 54.9 -14% | 59.8 -6% |
| AdobeRGB 1998 Coverage (%) | 43.93 | 44.2 1% | 53 21% | 37.79 -14% | 41.51 -6% |
| Response Times | -22% | 10% | -27% | ||
| Response Time Grey 50% / Grey 80% * (ms) | 32.8 ? | 46 ? -40% | 46 ? -40% | 53 ? -62% | |
| Response Time Black / White * (ms) | 29.2 ? | 30 ? -3% | 11.6 ? 60% | 27 ? 8% | |
| PWM Frequency (Hz) | 200 ? | 25770 ? | 200 ? | ||
| Screen | -29% | -54% | 16% | 15% | |
| Brightness middle (cd/m²) | 247.7 | 243 -2% | 384 55% | 200 -19% | 329 33% |
| Brightness (cd/m²) | 243 | 230 -5% | 341 40% | 191 -21% | 310 28% |
| Brightness Distribution (%) | 92 | 91 -1% | 76 -17% | 90 -2% | 82 -11% |
| Black Level * (cd/m²) | 0.32 | 0.4 -25% | 1.28 -300% | 0.14 56% | 0.405 -27% |
| Contrast (:1) | 774 | 608 -21% | 300 -61% | 1429 85% | 812 5% |
| Colorchecker dE 2000 * | 6.4 | 11.24 -76% | 8.7 -36% | 5.06 21% | 3.96 38% |
| Colorchecker dE 2000 max. * | 24.3 | 19.82 18% | 16.7 31% | 10.91 55% | 7.51 69% |
| Greyscale dE 2000 * | 4.5 | 12.78 -184% | 11.1 -147% | 3.94 12% | 3.51 22% |
| Gamma | 2.33 94% | 2.33 94% | 2.2 100% | 2.41 91% | 3.83 57% |
| CCT | 7318 89% | 15436 42% | 12445 52% | 6159 106% | 6711 97% |
| Color Space (Percent of AdobeRGB 1998) (%) | 39.8 | 41 3% | 35 -12% | 38.4 -4% | |
| Color Space (Percent of sRGB) (%) | 62.9 | 64 2% | 55 -13% | 59.8 -5% | |
| Media totale (Programma / Settaggio) | -17% /
-22% | -8% /
-27% | -8% /
4% | 5% /
10% |
* ... Meglio usare valori piccoli
Tempi di risposta del Display
| ↔ Tempi di risposta dal Nero al Bianco | ||
|---|---|---|
| 29.2 ms ... aumenta ↗ e diminuisce ↘ combinato | ↗ 16 ms Incremento | 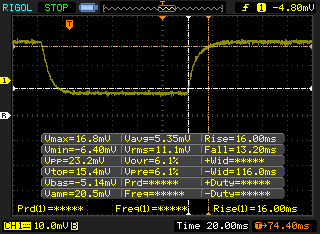 |
| ↘ 13.2 ms Calo | ||
| Lo schermo mostra tempi di risposta relativamente lenti nei nostri tests e potrebbe essere troppo lento per i gamers. In confronto, tutti i dispositivi di test variano da 0.1 (minimo) a 240 (massimo) ms. » 78 % di tutti i dispositivi è migliore. Questo significa che i tempi di risposta rilevati sono peggiori rispetto alla media di tutti i dispositivi testati (19.8 ms). | ||
| ↔ Tempo di risposta dal 50% Grigio all'80% Grigio | ||
| 32.8 ms ... aumenta ↗ e diminuisce ↘ combinato | ↗ 12.8 ms Incremento | 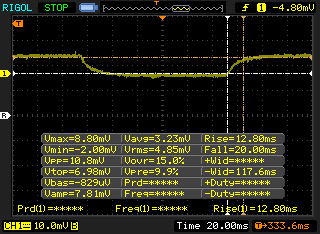 |
| ↘ 20 ms Calo | ||
| Lo schermo mostra tempi di risposta lenti nei nostri tests e sarà insoddisfacente per i gamers. In confronto, tutti i dispositivi di test variano da 0.165 (minimo) a 636 (massimo) ms. » 45 % di tutti i dispositivi è migliore. Questo significa che i tempi di risposta rilevati sono simili alla media di tutti i dispositivi testati (30.9 ms). | ||
Sfarfallio dello schermo / PWM (Pulse-Width Modulation)
| flickering dello schermo / PWM rilevato | 200 Hz | ≤ 20 % settaggio luminosita' | 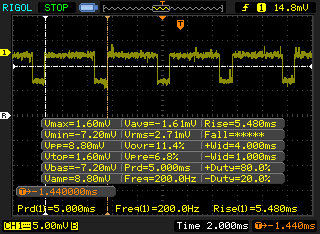 |
Il display sfarfalla a 200 Hz (Probabilmente a causa dell'uso di PWM) Flickering rilevato ad una luminosita' di 20 % o inferiore. Non dovrebbe verificarsi flickering o PWM sopra questo valore di luminosita'. La frequenza di 200 Hz è relativamente bassa, quindi gli utenti sensibili potrebbero notare il flickering ed accusare stanchezza agli occhi a questo livello di luminosità e a livelli inferiori. In confronto: 52 % di tutti i dispositivi testati non utilizza PWM per ridurre la luminosita' del display. Se è rilevato PWM, una media di 7744 (minimo: 5 - massimo: 343500) Hz è stata rilevata. | |||
| Cinebench R11.5 | |
| CPU Single 64Bit | |
| Lenovo IdeaPad Z40-59422614 | |
| Lenovo Thinkpad 13-20J1001BUS | |
| HP 15-bw077ax | |
| HP Pavilion 15z-bw000 | |
| HP 15z-ba000 | |
| Chuwi LapBook 14 inch 2017 | |
| Lenovo Ideapad 110S-11IBR | |
| CPU Multi 64Bit | |
| Lenovo Thinkpad 13-20J1001BUS | |
| HP Pavilion 15z-bw000 | |
| Lenovo IdeaPad Z40-59422614 | |
| HP 15z-ba000 | |
| Chuwi LapBook 14 inch 2017 | |
| HP 15-bw077ax | |
| Lenovo Ideapad 110S-11IBR | |
| wPrime 2.10 - 1024m | |
| Chuwi LapBook 14 inch 2017 | |
| Lenovo IdeaPad Z40-59422614 | |
| HP 15-bw077ax | |
| Lenovo Thinkpad 13-20J1001BUS | |
| HP Pavilion 15z-bw000 | |
* ... Meglio usare valori piccoli
| PCMark 8 | |
| Home Score Accelerated v2 | |
| Acer Swift 3 SF315-51G-57E5 | |
| Apple MacBook Air 13 inch 2015-03 | |
| Chuwi LapBook 14 inch 2017 | |
| Lenovo Yoga Book 2016 Windows 64GB LTE | |
| Work Score Accelerated v2 | |
| Acer Swift 3 SF315-51G-57E5 | |
| Apple MacBook Air 13 inch 2015-03 | |
| Chuwi LapBook 14 inch 2017 | |
| Lenovo Yoga Book 2016 Windows 64GB LTE | |
| Creative Score Accelerated v2 | |
| Acer Swift 3 SF315-51G-57E5 | |
| Apple MacBook Air 13 inch 2015-03 | |
| Chuwi LapBook 14 inch 2017 | |
| PCMark 8 Home Score Accelerated v2 | 1682 punti | |
| PCMark 8 Creative Score Accelerated v2 | 1952 punti | |
| PCMark 8 Work Score Accelerated v2 | 2552 punti | |
| PCMark 10 Score | 1243 punti | |
Aiuto | ||
| Chuwi LapBook 14 inch 2017 SanDisk DF4128 | Dell XPS 13 i7-8550U Toshiba XG5 KXG50ZNV256G | Samsung Notebook 9 NP900X3N-K01US Samsung CM871a MZNTY256HDHP | Lenovo Ideapad 110S-11IBR SanDisk DF4032 | Lenovo IdeaPad 320s-14IKB Samsung PM961 NVMe MZVLW128HEGR | |
|---|---|---|---|---|---|
| CrystalDiskMark 5.2 / 6 | 743% | 402% | -8% | 696% | |
| Write 4K (MB/s) | 11.87 | 121.5 924% | 105.4 788% | 13.87 17% | 127.9 978% |
| Read 4K (MB/s) | 11.45 | 24.92 118% | 34.45 201% | 12.23 7% | 42.82 274% |
| Write Seq (MB/s) | 106.1 | 345 225% | 458.4 332% | 101.7 -4% | 795 649% |
| Read Seq (MB/s) | 293.6 | 1313 347% | 489.4 67% | 165.1 -44% | 1056 260% |
| Write 4K Q32T1 (MB/s) | 15.22 | 346.1 2174% | 99.2 552% | 13.63 -10% | 176.8 1062% |
| Read 4K Q32T1 (MB/s) | 33.91 | 389.4 1048% | 273.5 707% | 36.23 7% | 322.4 851% |
| Write Seq Q32T1 (MB/s) | 110.3 | 334.7 203% | 512 364% | 94.8 -14% | 793 619% |
| Read Seq Q32T1 (MB/s) | 183 | 1840 905% | 551 201% | 147.5 -19% | 1782 874% |

| 3DMark | |
| 1280x720 Cloud Gate Standard Graphics | |
| Intel NUC5i3RYK | |
| Acer Spin 5 SP513-51 | |
| Lenovo Thinkpad 13-20J1001BUS | |
| Fujitsu Lifebook U574 | |
| Lenovo Ideapad 320-17AST-80XW0013GE | |
| HP 15-bw075ax | |
| Jumper EZbook 3 | |
| Chuwi Lapbook 12.3 | |
| Chuwi LapBook 14 inch 2017 | |
| Lenovo Yoga Book 2016 Windows 64GB LTE | |
| Lenovo Miix 3 10 | |
| 1280x720 offscreen Ice Storm Unlimited Graphics Score | |
| Lenovo Thinkpad 13-20J1001BUS | |
| Lenovo Ideapad 320-17AST-80XW0013GE | |
| HP 15-bw075ax | |
| Chuwi Lapbook 12.3 | |
| Jumper EZbook 3 | |
| Chuwi LapBook 14 inch 2017 | |
| 3DMark 11 Performance | 445 punti | |
| 3DMark Ice Storm Standard Score | 20937 punti | |
| 3DMark Cloud Gate Standard Score | 2152 punti | |
| 3DMark Fire Strike Score | 271 punti | |
Aiuto | ||
Rumorosità
| Idle |
| / / dB(A) |
| Sotto carico |
| / dB(A) |
 | ||
30 dB silenzioso 40 dB(A) udibile 50 dB(A) rumoroso |
||
min: | ||
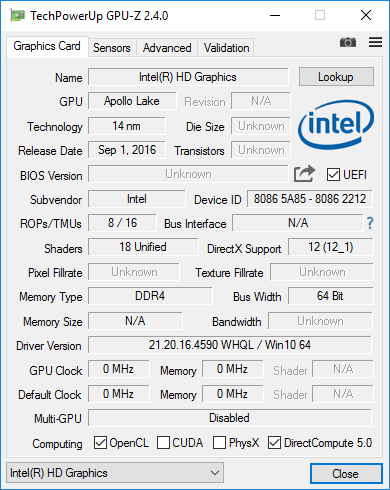
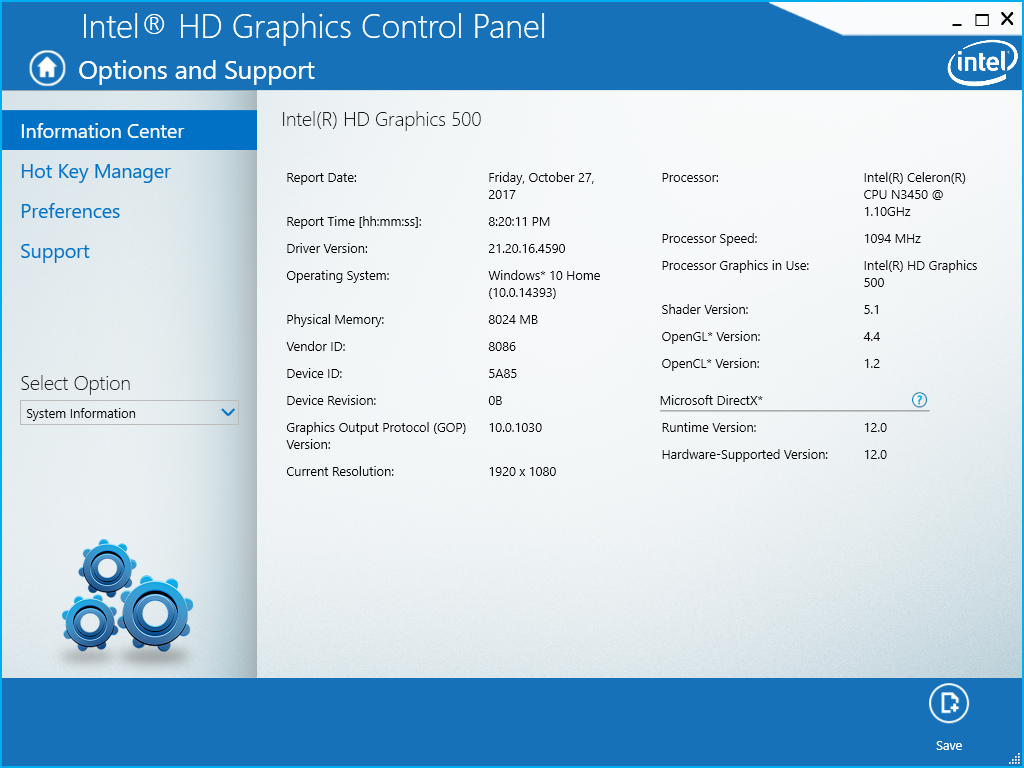
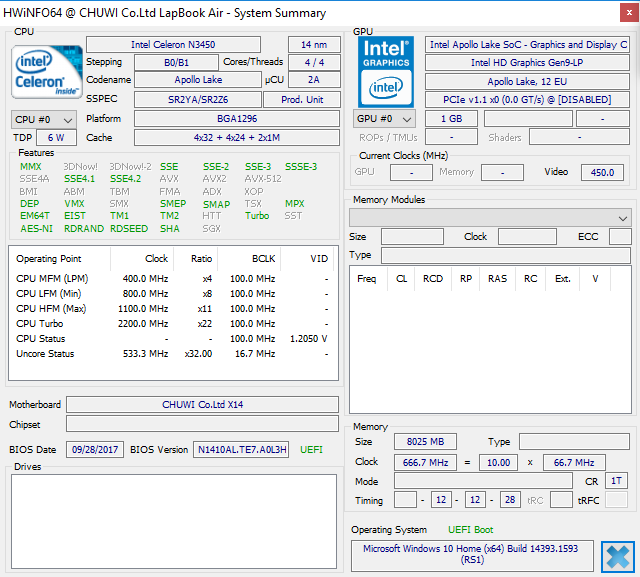
| Chuwi LapBook 14 inch 2017 HD Graphics 500, Celeron N3450, SanDisk DF4128 | Samsung Notebook 9 NP900X3N-K01US HD Graphics 620, i5-7200U, Samsung CM871a MZNTY256HDHP | Lenovo Ideapad 110S-11IBR HD Graphics 400 (Braswell), N3060, SanDisk DF4032 | Lenovo IdeaPad 320s-14IKB HD Graphics 610, Pentium 4415U, Samsung PM961 NVMe MZVLW128HEGR | Acer Swift 3 SF315-51G-57E5 GeForce MX150, i5-8250U, Hynix HFS128G39TND | Apple MacBook Air 13.3" 1.8 GHz (2017) HD Graphics 6000, 5350U, Apple SSD SM0128G | |
|---|---|---|---|---|---|---|
| Noise | ||||||
| off /ambiente * (dB) | 28.4 | 30.5 | ||||
| Idle Minimum * (dB) | 28.4 | 31.1 | 30.5 | |||
| Idle Average * (dB) | 28.4 | 31.1 | 30.5 | |||
| Idle Maximum * (dB) | 28.4 | 31.1 | 30.9 | |||
| Load Average * (dB) | 33.2 | 34.8 | 35.7 | |||
| Load Maximum * (dB) | 35.2 | 33.7 | 35.6 |
* ... Meglio usare valori piccoli
(±) La temperatura massima sul lato superiore è di 42.4 °C / 108 F, rispetto alla media di 35.9 °C / 97 F, che varia da 21.4 a 59 °C per questa classe Subnotebook.
(±) Il lato inferiore si riscalda fino ad un massimo di 45 °C / 113 F, rispetto alla media di 39.2 °C / 103 F
(+) In idle, la temperatura media del lato superiore è di 24.8 °C / 77 F, rispetto alla media deld ispositivo di 30.8 °C / 87 F.
(+) I poggiapolsi e il touchpad raggiungono la temperatura massima della pelle (35.2 °C / 95.4 F) e quindi non sono caldi.
(-) La temperatura media della zona del palmo della mano di dispositivi simili e'stata di 28.2 °C / 82.8 F (-7 °C / -12.6 F).
Chuwi LapBook 14 inch 2017 analisi audio
(-) | altoparlanti non molto potenti (59.1 dB)
Bassi 100 - 315 Hz
(-) | quasi nessun basso - in media 15.8% inferiori alla media
(±) | la linearità dei bassi è media (10.1% delta rispetto alla precedente frequenza)
Medi 400 - 2000 Hz
(±) | medi elevati - circa 5.9% superiore alla media
(±) | linearità dei medi adeguata (13.9% delta rispetto alla precedente frequenza)
Alti 2 - 16 kHz
(+) | Alti bilanciati - appena 4.9% dalla media
(±) | la linearità degli alti è media (12.8% delta rispetto alla precedente frequenza)
Nel complesso 100 - 16.000 Hz
(-) | suono nel complesso non lineare (37.5% di differenza rispetto alla media
Rispetto alla stessa classe
» 98% di tutti i dispositivi testati in questa classe è stato migliore, 1% simile, 1% peggiore
» Il migliore ha avuto un delta di 5%, medio di 18%, peggiore di 53%
Rispetto a tutti i dispositivi testati
» 94% di tutti i dispositivi testati in questa classe è stato migliore, 1% similare, 5% peggiore
» Il migliore ha avuto un delta di 4%, medio di 23%, peggiore di 134%
Apple MacBook 12 (Early 2016) 1.1 GHz analisi audio
(+) | gli altoparlanti sono relativamente potenti (83.6 dB)
Bassi 100 - 315 Hz
(±) | bassi ridotti - in media 11.3% inferiori alla media
(±) | la linearità dei bassi è media (14.2% delta rispetto alla precedente frequenza)
Medi 400 - 2000 Hz
(+) | medi bilanciati - solo only 2.4% rispetto alla media
(+) | medi lineari (5.5% delta rispetto alla precedente frequenza)
Alti 2 - 16 kHz
(+) | Alti bilanciati - appena 2% dalla media
(+) | alti lineari (4.5% delta rispetto alla precedente frequenza)
Nel complesso 100 - 16.000 Hz
(+) | suono nel complesso lineare (10.2% differenza dalla media)
Rispetto alla stessa classe
» 7% di tutti i dispositivi testati in questa classe è stato migliore, 2% simile, 90% peggiore
» Il migliore ha avuto un delta di 5%, medio di 18%, peggiore di 53%
Rispetto a tutti i dispositivi testati
» 5% di tutti i dispositivi testati in questa classe è stato migliore, 1% similare, 94% peggiore
» Il migliore ha avuto un delta di 4%, medio di 23%, peggiore di 134%
| Off / Standby | |
| Idle | |
| Sotto carico |
|
Leggenda:
min: | |
| Chuwi LapBook 14 inch 2017 Celeron N3450, HD Graphics 500, SanDisk DF4128, IPS, 1920x1080, 14.1" | Lenovo Ideapad 110S-11IBR N3060, HD Graphics 400 (Braswell), SanDisk DF4032, TN LED, 1366x768, 11.6" | Lenovo IdeaPad 320s-14IKB Pentium 4415U, HD Graphics 610, Samsung PM961 NVMe MZVLW128HEGR, IPS, 1920x1080, 14" | Apple MacBook Air 13.3" 1.8 GHz (2017) 5350U, HD Graphics 6000, Apple SSD SM0128G, TN LED, 1440x900, 13.3" | HP Pavilion 14-al103ng i5-7200U, HD Graphics 620, Western Digital Scorpio Blue WD5000LPCX-24C6HT0, IPS, 1920x1080, 14" | Asus VivoBook E200HA-FD0041TS Z8350, HD Graphics 400 (Braswell), Hynix HBG4a2 32 GB eMMC, TN LED, 1366x768, 11.6" | |
|---|---|---|---|---|---|---|
| Power Consumption | -27% | -24% | -68% | -69% | 5% | |
| Idle Minimum * (Watt) | 3.6 | 7 -94% | 3.4 6% | 3.4 6% | 5.5 -53% | 4.3 -19% |
| Idle Average * (Watt) | 6.2 | 8.2 -32% | 6.3 -2% | 6.3 -2% | 8.2 -32% | 6 3% |
| Idle Maximum * (Watt) | 6.5 | 8.5 -31% | 6.7 -3% | 7 -8% | 8.9 -37% | 6.3 3% |
| Load Average * (Watt) | 13.5 | 12.5 7% | 24.5 -81% | 34.5 -156% | 29.1 -116% | 11.4 16% |
| Load Maximum * (Watt) | 14.3 | 12.3 14% | 20.2 -41% | 40 -180% | 29.4 -106% | 10.8 24% |
* ... Meglio usare valori piccoli
| Chuwi LapBook 14 inch 2017 Celeron N3450, HD Graphics 500, 38 Wh | Samsung Notebook 9 NP900X3N-K01US i5-7200U, HD Graphics 620, 30 Wh | Lenovo Ideapad 110S-11IBR N3060, HD Graphics 400 (Braswell), 39.1 Wh | Lenovo IdeaPad 320s-14IKB Pentium 4415U, HD Graphics 610, 30 Wh | Apple MacBook Air 13.3" 1.8 GHz (2017) 5350U, HD Graphics 6000, 54 Wh | Lenovo Yoga Book 2016 Windows 64GB LTE Z8550, HD Graphics 400 (Braswell), 32 Wh | |
|---|---|---|---|---|---|---|
| Autonomia della batteria | -31% | 3% | 24% | 71% | 50% | |
| Reader / Idle (h) | 11.6 | 11.6 0% | 19.2 66% | |||
| WiFi v1.3 (h) | 6.2 | 4.7 -24% | 6.4 3% | 7.7 24% | 10.6 71% | 8.3 34% |
| Load (h) | 3.3 | 1 -70% |
Pro
Contro
Il LapBook Air è interessante considerando il prezzo di $400. Il display IPS da 1080p è definito, il dispositivo di archiviazione secondario è raro, e c'è anche una tastiera retroilluminata. Sfortunatamente, il produttore ha fatto dei tagli quasi ovunque per tenere basso il prezzo.
La qualità non è alla pari con altre alternative note. Il nostro dispositivo ha un leggero effetto bleeding del display, la retroilluminazione della tastiera è poco omogenea, il tasto Ctrl è rotto, una porta USB non funziona, ci sono molti crashes, e le estremità cedono. Raccomandiamo di provare ogni porta e tutti i tasti prima di comprarlo. Inolter il processore a raffreddamento passivo Celeron, l'SSD, e l'alimentatore sono molto lenti. Coloro che vogliono qualcosa di più potente si troveranno meglio con un più vecchio ULV Haswell con tastiera più salda e trackpads più preciso. Se dovete usarlo prevalentemente per riproduzione video, tuttavia, il LapBook Air non è male.
Il LapBook dovrebbe risultare utile se lo usate per web browsing, word processing, e riproduzione video.
Nota: si tratta di una recensione breve, con alcune sezioni non tradotte, per la versione integrale in inglese guardate qui.
Chuwi LapBook 14 inch 2017
- 10/31/2017 v6 (old)
Allen Ngo
Price comparison
