Recensione breve del Portatile Lenovo IdeaPad 320-17AST (E2-9000, HD+)
| SD Card Reader | |
| average JPG Copy Test (av. of 3 runs) | |
| Lenovo Ideapad 320-17AST-80XW0013GE (Toshiba Exceria Pro SDXC 64 GB UHS-II) | |
| HP 17-y044ng (Toshiba Exceria Pro SDXC 64 GB UHS-II) | |
| HP 17-x066ng (Toshiba Exceria Pro SDXC 64 GB UHS-II) | |
| maximum AS SSD Seq Read Test (1GB) | |
| HP 17-y044ng (Toshiba Exceria Pro SDXC 64 GB UHS-II) | |
| Lenovo Ideapad 320-17AST-80XW0013GE (Toshiba Exceria Pro SDXC 64 GB UHS-II) | |
| HP 17-x066ng (Toshiba Exceria Pro SDXC 64 GB UHS-II) | |
| Networking | |
| iperf3 transmit AX12 | |
| Lenovo Ideapad 320-17AST-80XW0013GE | |
| HP 17-x066ng | |
| HP 17-y044ng (jseb) | |
| iperf3 receive AX12 | |
| Lenovo Ideapad 320-17AST-80XW0013GE | |
| HP 17-x066ng | |
| HP 17-y044ng (jseb) | |
| |||||||||||||||||||||||||
Distribuzione della luminosità: 81 %
Al centro con la batteria: 232 cd/m²
Contrasto: 373:1 (Nero: 0.55 cd/m²)
ΔE ColorChecker Calman: 11.26 | ∀{0.5-29.43 Ø4.72}
ΔE Greyscale Calman: 13.85 | ∀{0.09-98 Ø4.97}
73% sRGB (Argyll 1.6.3 3D)
47% AdobeRGB 1998 (Argyll 1.6.3 3D)
52.1% AdobeRGB 1998 (Argyll 3D)
73.3% sRGB (Argyll 3D)
50.5% Display P3 (Argyll 3D)
Gamma: 2.48
CCT: 15307 K
| Lenovo Ideapad 320-17AST-80XW0013GE TN LED, 1600x900, 17.3" | HP 17-x066ng IPS, 1920x1080, 17.3" | HP 17-y044ng TN LED, 1600x900, 17.3" | Acer Aspire ES1-731-P4A6 TN LED, 1600x900, 17.3" | |
|---|---|---|---|---|
| Display | 22% | 1% | 10% | |
| Display P3 Coverage (%) | 50.5 | 63.6 26% | 50.9 1% | 55.4 10% |
| sRGB Coverage (%) | 73.3 | 86.5 18% | 73.8 1% | 80.1 9% |
| AdobeRGB 1998 Coverage (%) | 52.1 | 63.3 21% | 52.6 1% | 57.3 10% |
| Response Times | -13% | -12% | -21% | |
| Response Time Grey 50% / Grey 80% * (ms) | 40 ? | 38 ? 5% | 43 ? -8% | 41 ? -2% |
| Response Time Black / White * (ms) | 20 ? | 26 ? -30% | 23 ? -15% | 28 ? -40% |
| PWM Frequency (Hz) | 199 ? | |||
| Screen | 54% | 7% | 25% | |
| Brightness middle (cd/m²) | 205 | 331 61% | 264 29% | 219 7% |
| Brightness (cd/m²) | 209 | 310 48% | 232 11% | 224 7% |
| Brightness Distribution (%) | 81 | 87 7% | 80 -1% | 91 12% |
| Black Level * (cd/m²) | 0.55 | 0.33 40% | 0.59 -7% | 0.31 44% |
| Contrast (:1) | 373 | 1003 169% | 447 20% | 706 89% |
| Colorchecker dE 2000 * | 11.26 | 4.58 59% | 10.58 6% | 9.31 17% |
| Colorchecker dE 2000 max. * | 19.86 | 7.83 61% | 18.96 5% | 13.74 31% |
| Greyscale dE 2000 * | 13.85 | 6.18 55% | 13.13 5% | 10.87 22% |
| Gamma | 2.48 89% | 2.34 94% | 2.49 88% | 2.9 76% |
| CCT | 15307 42% | 6076 107% | 14044 46% | 11513 56% |
| Color Space (Percent of AdobeRGB 1998) (%) | 47 | 56 19% | 48 2% | 52 11% |
| Color Space (Percent of sRGB) (%) | 73 | 86 18% | 74 1% | 80 10% |
| Media totale (Programma / Settaggio) | 21% /
38% | -1% /
3% | 5% /
16% |
* ... Meglio usare valori piccoli
Sfarfallio dello schermo / PWM (Pulse-Width Modulation)
| flickering dello schermo / PWM non rilevato | ||
In confronto: 52 % di tutti i dispositivi testati non utilizza PWM per ridurre la luminosita' del display. Se è rilevato PWM, una media di 7781 (minimo: 5 - massimo: 343500) Hz è stata rilevata. | ||
Tempi di risposta del Display
| ↔ Tempi di risposta dal Nero al Bianco | ||
|---|---|---|
| 20 ms ... aumenta ↗ e diminuisce ↘ combinato | ↗ 16 ms Incremento | 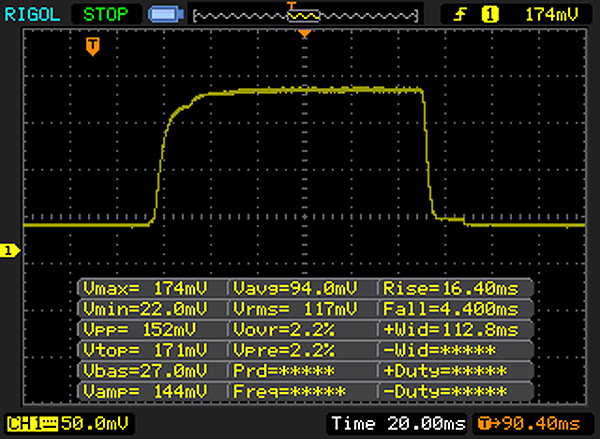 |
| ↘ 4 ms Calo | ||
| Lo schermo mostra buoni tempi di risposta durante i nostri tests, ma potrebbe essere troppo lento per i gamers competitivi. In confronto, tutti i dispositivi di test variano da 0.1 (minimo) a 240 (massimo) ms. » 44 % di tutti i dispositivi è migliore. Questo significa che i tempi di risposta rilevati sono simili alla media di tutti i dispositivi testati (19.8 ms). | ||
| ↔ Tempo di risposta dal 50% Grigio all'80% Grigio | ||
| 40 ms ... aumenta ↗ e diminuisce ↘ combinato | ↗ 22 ms Incremento | 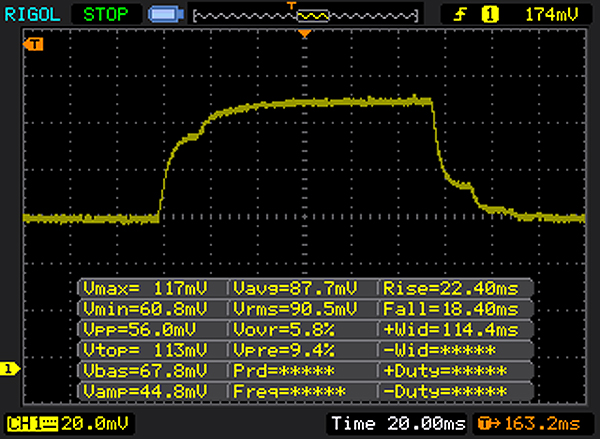 |
| ↘ 18 ms Calo | ||
| Lo schermo mostra tempi di risposta lenti nei nostri tests e sarà insoddisfacente per i gamers. In confronto, tutti i dispositivi di test variano da 0.165 (minimo) a 636 (massimo) ms. » 61 % di tutti i dispositivi è migliore. Questo significa che i tempi di risposta rilevati sono peggiori rispetto alla media di tutti i dispositivi testati (31 ms). | ||
| Geekbench 4.4 | |
| 64 Bit Multi-Core Score | |
| Asus VivoBook Flip 12 TP203NAH-BP049T | |
| Dell Latitude 3180 | |
| Lenovo Ideapad 320-17AST-80XW0013GE | |
| 64 Bit Single-Core Score | |
| Asus VivoBook Flip 12 TP203NAH-BP049T | |
| Lenovo Ideapad 320-17AST-80XW0013GE | |
| Dell Latitude 3180 | |
| PCMark 7 Score | 2185 punti | |
| PCMark 8 Home Score Accelerated v2 | 1844 punti | |
| PCMark 8 Creative Score Accelerated v2 | 2119 punti | |
| PCMark 8 Work Score Accelerated v2 | 3225 punti | |
| PCMark 10 Score | 1385 punti | |
Aiuto | ||
| PCMark 8 - Home Score Accelerated v2 | |
| HP 17-x066ng | |
| HP 17-y044ng | |
| Lenovo Ideapad 320-17AST-80XW0013GE | |
| Acer Aspire ES1-731G-P5UR | |

| Lenovo Ideapad 320-17AST-80XW0013GE Seagate Mobile HDD 1TB ST1000LM035 | HP 17-x066ng WDC WD10JPVX-08JC3T5 | HP 17-y044ng WDC Scorpio Blue WD10JPVX-75JC3T0 | Acer Aspire ES1-731G-P5UR Toshiba MQ01ABD100 | |
|---|---|---|---|---|
| CrystalDiskMark 3.0 | 86% | 83% | 74% | |
| Read Seq (MB/s) | 98.6 | 98.6 0% | 105.5 7% | 105 6% |
| Write Seq (MB/s) | 87 | 98.2 13% | 102 17% | 96 10% |
| Read 512 (MB/s) | 30.3 | 33.8 12% | 19.17 -37% | 32.89 9% |
| Write 512 (MB/s) | 92.2 | 45.98 -50% | 28.27 -69% | 25.77 -72% |
| Read 4k (MB/s) | 0.448 | 0.395 -12% | 0.328 -27% | 0.324 -28% |
| Write 4k (MB/s) | 0.316 | 0.96 204% | 1.013 221% | 0.755 139% |
| Read 4k QD32 (MB/s) | 1.088 | 1.039 -5% | 0.891 -18% | 0.892 -18% |
| Write 4k QD32 (MB/s) | 0.154 | 0.959 523% | 1.03 569% | 1 549% |
| 3DMark 05 Standard | 6853 punti | |
| 3DMark 06 Standard Score | 3809 punti | |
| 3DMark Vantage P Result | 2136 punti | |
| 3DMark 11 Performance | 788 punti | |
| 3DMark Ice Storm Standard Score | 26099 punti | |
| 3DMark Cloud Gate Standard Score | 2187 punti | |
| 3DMark Fire Strike Score | 477 punti | |
Aiuto | ||
| 3DMark 11 - 1280x720 Performance GPU | |
| Lenovo Ideapad 110-17IKB 80VK0001GE | |
| Lenovo V320-17IKB 81AH0002GE | |
| HP 17-y044ng | |
| Acer Aspire ES1-731G-P5UR | |
| HP 17-x066ng | |
| Dell Latitude 3180 | |
| Acer Aspire E5-722-662J | |
| Lenovo Ideapad 320-17AST-80XW0013GE | |
| Acer Aspire ES1-533-P7WA | |
| Acer Aspire E5-722-2611 | |
| Asus VivoBook Flip 12 TP203NAH-BP049T | |
| Lenovo G70-35 80Q5000BGE | |
| basso | medio | alto | ultra | |
|---|---|---|---|---|
| World of Warcraft (2005) | 65.2 | 33.2 | ||
| Dirt 3 (2011) | 55.7 | 28.1 | 22.1 | |
| Deus Ex Human Revolution (2011) | 41 | 20.3 | ||
| The Elder Scrolls V: Skyrim (2011) | 24.7 | 16.3 | 10.8 | |
| Anno 2070 (2011) | 48.8 | 22.3 | 13.9 | |
| Diablo III (2012) | 28.5 | 17.8 | 15.9 | |
| Counter-Strike: GO (2012) | 26.9 | 21.7 | 20 | |
| Dead Space 3 (2013) | 43.5 | 20.8 | 16.5 | |
| Tomb Raider (2013) | 35.7 | 15.7 | 11.1 | |
| BioShock Infinite (2013) | 36.8 | 18.1 | 14.2 | |
| GRID 2 (2013) | 39.5 | 20.7 | 12.6 | |
| GRID: Autosport (2014) | 46 | 16.9 | ||
| Sims 4 (2014) | 82.1 | 20.7 | ||
| F1 2014 (2014) | 28 | 18 | ||
| Metal Gear Solid V (2015) | 23.6 | 18.5 | ||
| Dota 2 Reborn (2015) | 28.7 | 18.4 | ||
| World of Warships (2015) | 25.5 | 20.3 | ||
| Overwatch (2016) | 17.5 | 15 | ||
| Farming Simulator 17 (2016) | 43.5 | 26.4 | ||
| Prey (2017) | 9.4 | |||
| Rocket League (2017) | 30.8 | |||
| Team Fortress 2 (2017) | 19.7 | 18.5 |
Rumorosità
| Idle |
| 31 / 31 / 31 dB(A) |
| HDD |
| 32.1 dB(A) |
| DVD |
| 34.8 / dB(A) |
| Sotto carico |
| 22.6 / 32.2 dB(A) |
 | ||
30 dB silenzioso 40 dB(A) udibile 50 dB(A) rumoroso |
||
min: | ||
(+) La temperatura massima sul lato superiore è di 29.6 °C / 85 F, rispetto alla media di 34.3 °C / 94 F, che varia da 21.2 a 62.5 °C per questa classe Office.
(+) Il lato inferiore si riscalda fino ad un massimo di 33.4 °C / 92 F, rispetto alla media di 36.8 °C / 98 F
(+) In idle, la temperatura media del lato superiore è di 25.4 °C / 78 F, rispetto alla media deld ispositivo di 29.5 °C / 85 F.
(+) I poggiapolsi e il touchpad sono piu' freddi della temperatura della pelle con un massimo di 27.9 °C / 82.2 F e sono quindi freddi al tatto.
(±) La temperatura media della zona del palmo della mano di dispositivi simili e'stata di 27.5 °C / 81.5 F (-0.4 °C / -0.7 F).
Lenovo Ideapad 320-17AST-80XW0013GE analisi audio
(-) | altoparlanti non molto potenti (68.9 dB)
Bassi 100 - 315 Hz
(-) | quasi nessun basso - in media 21.4% inferiori alla media
(±) | la linearità dei bassi è media (14.7% delta rispetto alla precedente frequenza)
Medi 400 - 2000 Hz
(+) | medi bilanciati - solo only 2.1% rispetto alla media
(±) | linearità dei medi adeguata (8.6% delta rispetto alla precedente frequenza)
Alti 2 - 16 kHz
(+) | Alti bilanciati - appena 4.8% dalla media
(±) | la linearità degli alti è media (8% delta rispetto alla precedente frequenza)
Nel complesso 100 - 16.000 Hz
(±) | la linearità complessiva del suono è media (20.8% di differenza rispetto alla media
Rispetto alla stessa classe
» 48% di tutti i dispositivi testati in questa classe è stato migliore, 9% simile, 42% peggiore
» Il migliore ha avuto un delta di 7%, medio di 21%, peggiore di 53%
Rispetto a tutti i dispositivi testati
» 56% di tutti i dispositivi testati in questa classe è stato migliore, 8% similare, 36% peggiore
» Il migliore ha avuto un delta di 4%, medio di 24%, peggiore di 134%
Apple MacBook 12 (Early 2016) 1.1 GHz analisi audio
(+) | gli altoparlanti sono relativamente potenti (83.6 dB)
Bassi 100 - 315 Hz
(±) | bassi ridotti - in media 11.3% inferiori alla media
(±) | la linearità dei bassi è media (14.2% delta rispetto alla precedente frequenza)
Medi 400 - 2000 Hz
(+) | medi bilanciati - solo only 2.4% rispetto alla media
(+) | medi lineari (5.5% delta rispetto alla precedente frequenza)
Alti 2 - 16 kHz
(+) | Alti bilanciati - appena 2% dalla media
(+) | alti lineari (4.5% delta rispetto alla precedente frequenza)
Nel complesso 100 - 16.000 Hz
(+) | suono nel complesso lineare (10.2% differenza dalla media)
Rispetto alla stessa classe
» 7% di tutti i dispositivi testati in questa classe è stato migliore, 2% simile, 91% peggiore
» Il migliore ha avuto un delta di 5%, medio di 18%, peggiore di 53%
Rispetto a tutti i dispositivi testati
» 5% di tutti i dispositivi testati in questa classe è stato migliore, 1% similare, 94% peggiore
» Il migliore ha avuto un delta di 4%, medio di 24%, peggiore di 134%
| Off / Standby | |
| Idle | |
| Sotto carico |
|
Leggenda:
min: | |
| Battery Runtime - WiFi Websurfing | |
| HP 17-x066ng | |
| Lenovo V320-17IKB 81AH0002GE | |
| Acer Aspire ES1-731G-P5UR | |
| HP 17-y044ng | |
| Lenovo Ideapad 320-17AST-80XW0013GE | |
Pro
Contro
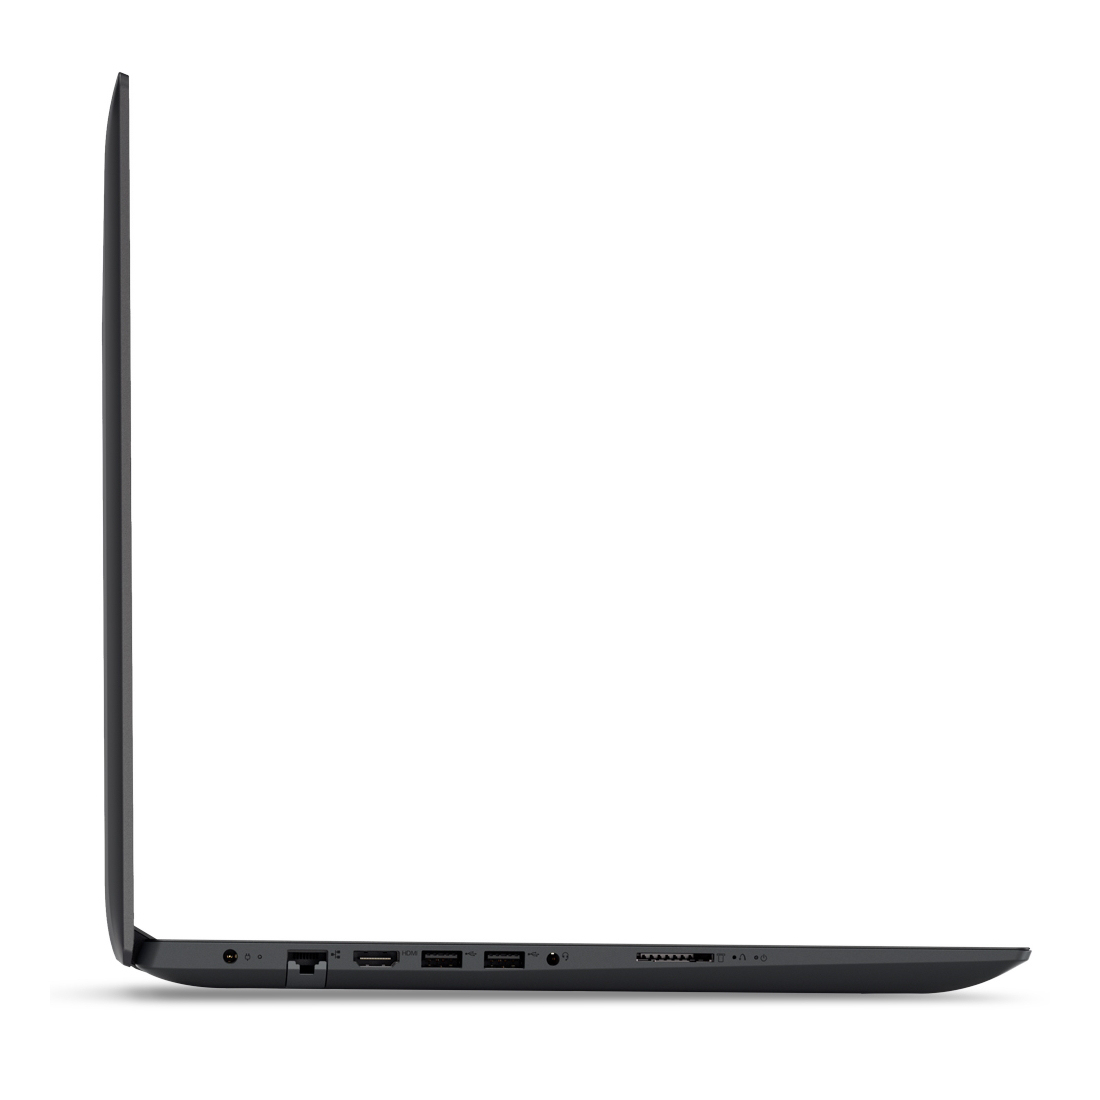
Il Lenovo IdeaPad 320-17AST è un portatile da ufficio da 17.3" per la vostra scrivania. L'APU è adatta ad applicazioni semplici per ufficio ed internet. I potenziali clienti devono sapere che l'APU raggiunge il limite facilmente. Per esempio, quando si aprono molti siti web insieme nel browser.
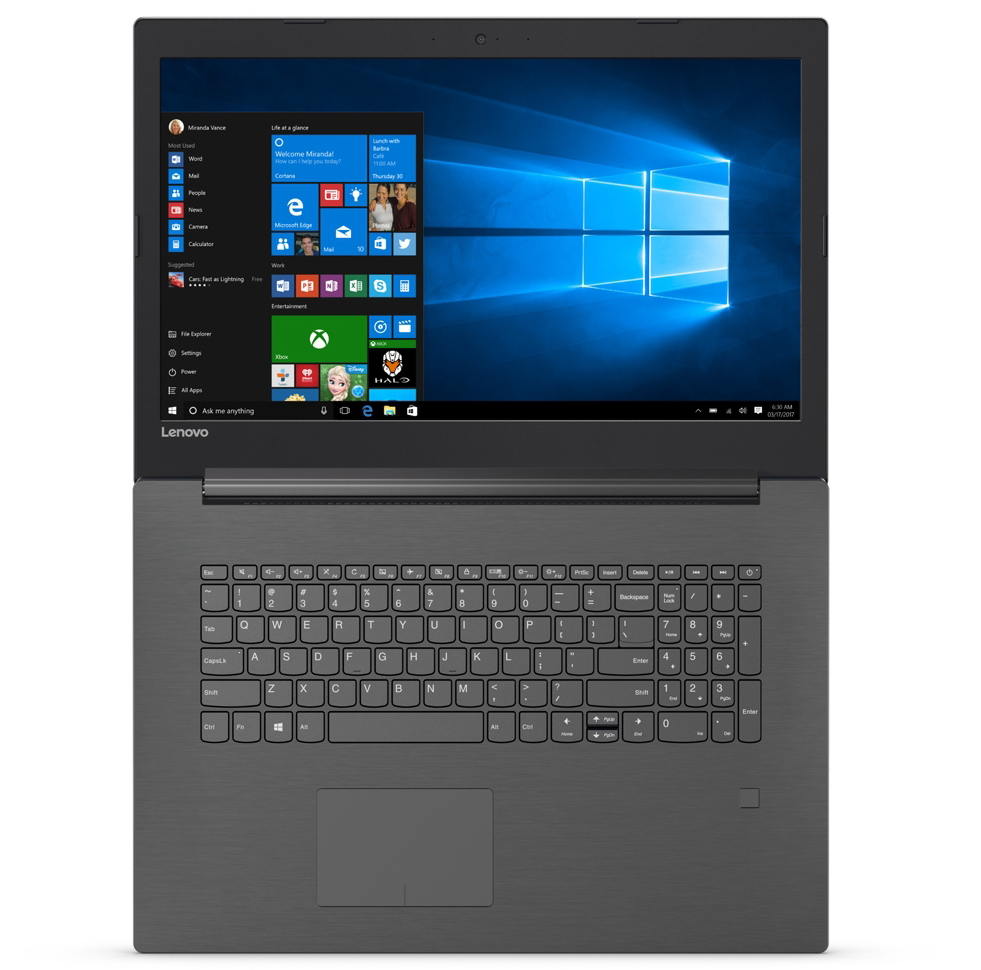
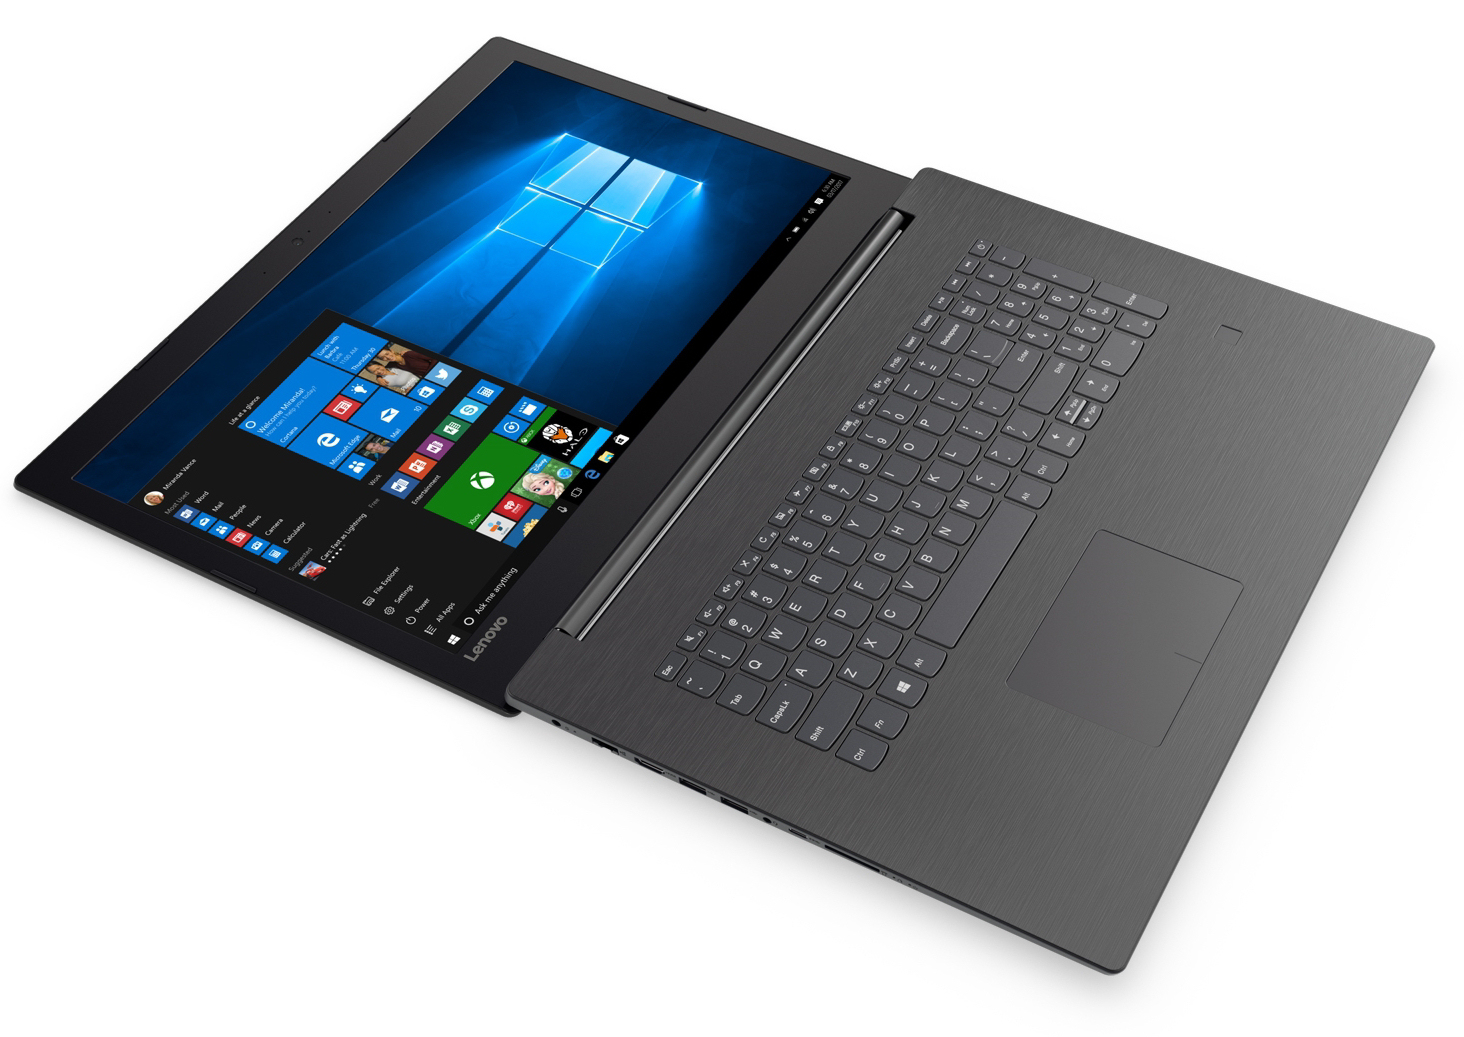
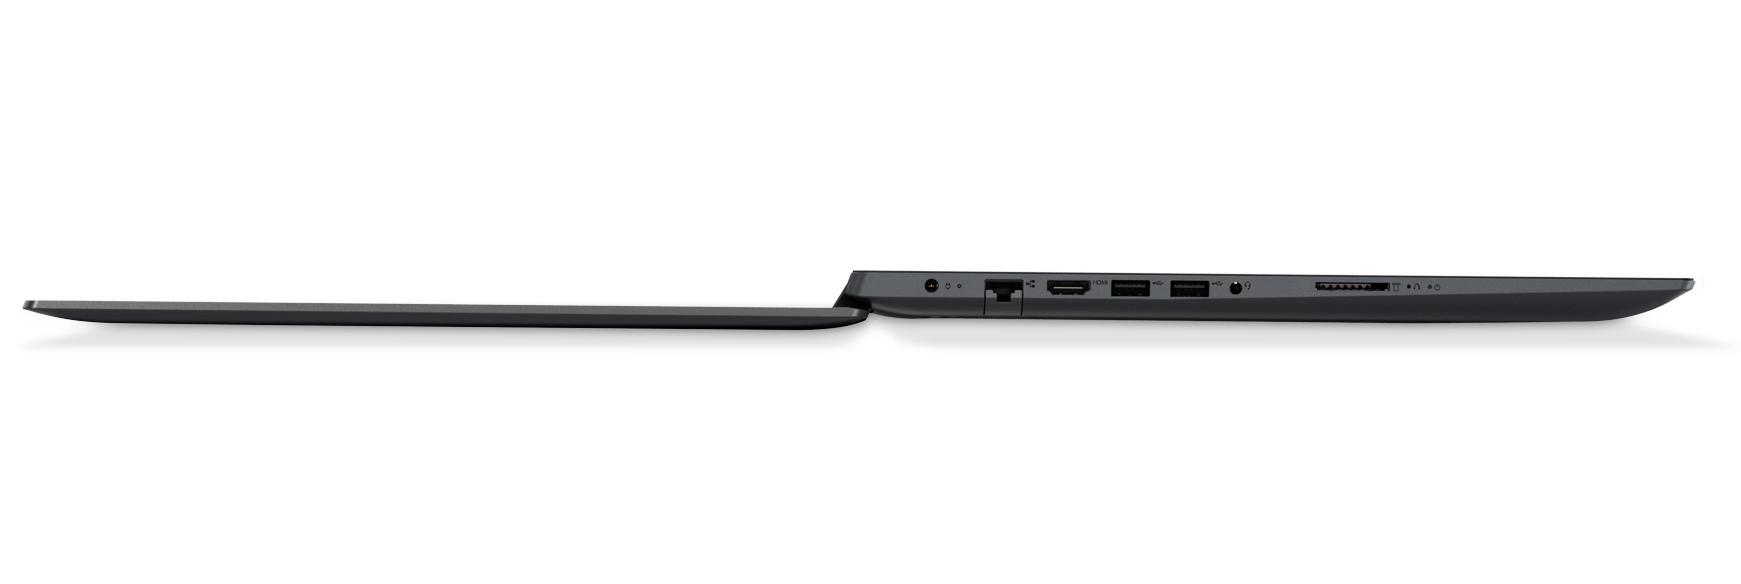
Il portatile si scalda poco ed è silenzioso anche sotto carico. Non manca spazio con un hard drive da 1-TB, che può anche essere sostituito da un SSD. Per fare questo, tuttavia, dovrete aprire il dispositivo, in quanto mancano covers di manutenzione. La tastiera è decente ed adatta a chi scrive spesso. Il display matto da 17.3" non ci convince: è scuro, con contrasto basso e angoli di visuale limitati.
Il principale problema dell'IdeaPad 320-17AST è il prezzo.
In Europa, il dispositivo costa circa 460 Euro (~$543) - troppo per un dispositivo così poco potente. Se siete interessati ad un IdeaPad, raccomandiamo di provare un altro modello.
Il modello 80XW0018GE potrebbe essere una buona opzione, ad esempio, in quanto monta una APU più potente A9-9420. E costa circa 460 Euro (~$543), ma senza sistema operativo Windows. Tuttavia, licenze Windows 7 o Windows 8.1 possono essere comprate per 5 - $10, tramite le quali poi potete passare a Windows 10.
Nota: si tratta di una recensione breve, con alcune sezioni non tradotte, per la versione integrale in inglese guardate qui.
Lenovo Ideapad 320-17AST-80XW0013GE
- 10/10/2017 v6 (old)
Sascha Mölck