Recensione breve del Portatile Lenovo IdeaPad 320-15IKB (7200U, 940MX, FHD)
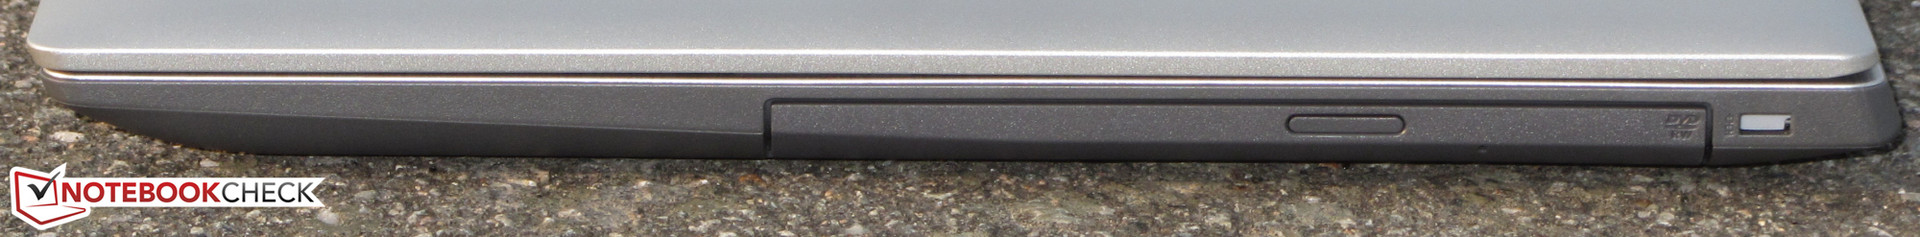
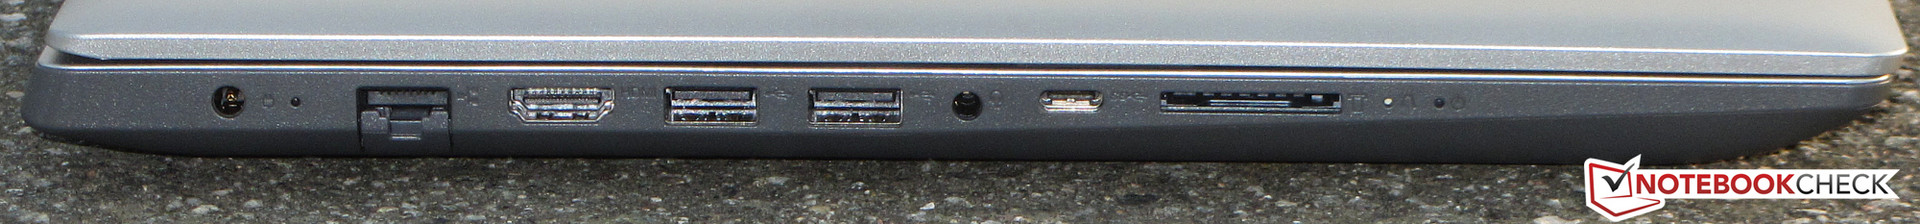
I/O
| SD Card Reader | |
| average JPG Copy Test (av. of 3 runs) | |
| HP ProBook 450 G4 Y8B60EA | |
| Acer Aspire 5 A515-51G-51RL (Toshiba Exceria Pro SDXC 64 GB UHS-II) | |
| Lenovo IdeaPad 320-15IKB 80XL01NEGE (Toshiba Exceria Pro SDXC 64 GB UHS-II) | |
| Dell Inspiron 15 5000 5567-1753 (Toshiba Exceria Pro SDXC 64 GB UHS-II) | |
| maximum AS SSD Seq Read Test (1GB) | |
| HP ProBook 450 G4 Y8B60EA | |
| Acer Aspire 5 A515-51G-51RL (Toshiba Exceria Pro SDXC 64 GB UHS-II) | |
| Lenovo IdeaPad 320-15IKB 80XL01NEGE (Toshiba Exceria Pro SDXC 64 GB UHS-II) | |
| Dell Inspiron 15 5000 5567-1753 (Toshiba Exceria Pro SDXC 64 GB UHS-II) | |
| Networking | |
| iperf3 transmit AX12 | |
| Lenovo IdeaPad 320-15IKB 80XL01NEGE | |
| Acer Aspire 5 A515-51G-51RL | |
| Dell Inspiron 15 5000 5567-1753 | |
| iperf3 receive AX12 | |
| Dell Inspiron 15 5000 5567-1753 | |
| Acer Aspire 5 A515-51G-51RL | |
| Lenovo IdeaPad 320-15IKB 80XL01NEGE | |
| |||||||||||||||||||||||||
Distribuzione della luminosità: 81 %
Al centro con la batteria: 236 cd/m²
Contrasto: 516:1 (Nero: 0.44 cd/m²)
ΔE ColorChecker Calman: 11.52 | ∀{0.5-29.43 Ø4.72}
ΔE Greyscale Calman: 12.01 | ∀{0.09-98 Ø4.97}
59% sRGB (Argyll 1.6.3 3D)
38% AdobeRGB 1998 (Argyll 1.6.3 3D)
40.81% AdobeRGB 1998 (Argyll 3D)
59% sRGB (Argyll 3D)
39.47% Display P3 (Argyll 3D)
Gamma: 2.23
CCT: 13330 K
| Lenovo IdeaPad 320-15IKB 80XL01NEGE TN LED, 1920x1080, 15.6" | Acer Aspire 5 A515-51G-51RL IPS, 1920x1080, 15.6" | Dell Inspiron 15 5000 5567-1753 TN LED, 1920x1080, 15.6" | HP ProBook 450 G4 Y8B60EA TN LED, 1920x1080, 15.6" | |
|---|---|---|---|---|
| Display | -3% | -8% | 1% | |
| Display P3 Coverage (%) | 39.47 | 38.3 -3% | 36.24 -8% | 39.89 1% |
| sRGB Coverage (%) | 59 | 57.6 -2% | 54.6 -7% | 59.5 1% |
| AdobeRGB 1998 Coverage (%) | 40.81 | 39.57 -3% | 37.44 -8% | 41.24 1% |
| Response Times | -42% | -1% | -68% | |
| Response Time Grey 50% / Grey 80% * (ms) | 42 ? | 41 ? 2% | 43 ? -2% | 51 ? -21% |
| Response Time Black / White * (ms) | 14 ? | 26 ? -86% | 14 ? -0% | 30 ? -114% |
| PWM Frequency (Hz) | 25000 ? | 50 ? | ||
| Screen | 43% | -9% | 1% | |
| Brightness middle (cd/m²) | 227 | 235 4% | 145 -36% | 214 -6% |
| Brightness (cd/m²) | 207 | 236 14% | 144 -30% | 201 -3% |
| Brightness Distribution (%) | 81 | 80 -1% | 90 11% | 77 -5% |
| Black Level * (cd/m²) | 0.44 | 0.17 61% | 0.49 -11% | 0.43 2% |
| Contrast (:1) | 516 | 1382 168% | 296 -43% | 498 -3% |
| Colorchecker dE 2000 * | 11.52 | 4.69 59% | 9.27 20% | 10.68 7% |
| Colorchecker dE 2000 max. * | 19.97 | 7.9 60% | 16.9 15% | 18.07 10% |
| Greyscale dE 2000 * | 12.01 | 3.34 72% | 12.28 -2% | 11.32 6% |
| Gamma | 2.23 99% | 2.63 84% | 2.03 108% | 2.26 97% |
| CCT | 13330 49% | 6801 96% | 10732 61% | 12204 53% |
| Color Space (Percent of AdobeRGB 1998) (%) | 38 | 36 -5% | 35 -8% | 38 0% |
| Color Space (Percent of sRGB) (%) | 59 | 57 -3% | 55 -7% | 59 0% |
| Media totale (Programma / Settaggio) | -1% /
22% | -6% /
-8% | -22% /
-8% |
* ... Meglio usare valori piccoli
Sfarfallio dello schermo / PWM (Pulse-Width Modulation)
| flickering dello schermo / PWM rilevato | 25000 Hz | ≤ 70 % settaggio luminosita' | 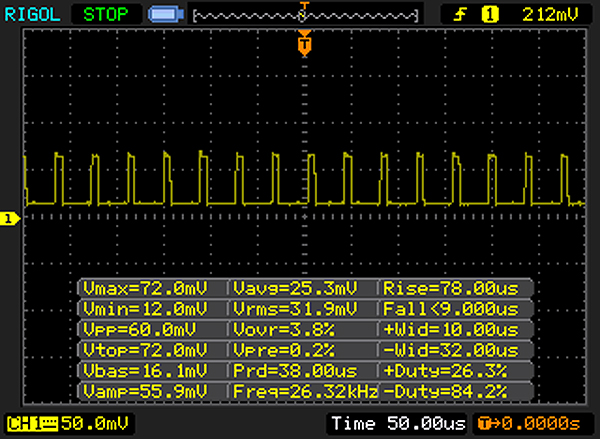 |
Il display sfarfalla a 25000 Hz (Probabilmente a causa dell'uso di PWM) Flickering rilevato ad una luminosita' di 70 % o inferiore. Non dovrebbe verificarsi flickering o PWM sopra questo valore di luminosita'. La frequenza di 25000 Hz è abbastanza alta, quindi la maggioranza degli utenti sensibili al PWM non dovrebbero notare alcun flickering. In confronto: 52 % di tutti i dispositivi testati non utilizza PWM per ridurre la luminosita' del display. Se è rilevato PWM, una media di 7769 (minimo: 5 - massimo: 343500) Hz è stata rilevata. | |||
Tempi di risposta del Display
| ↔ Tempi di risposta dal Nero al Bianco | ||
|---|---|---|
| 14 ms ... aumenta ↗ e diminuisce ↘ combinato | ↗ 10 ms Incremento | 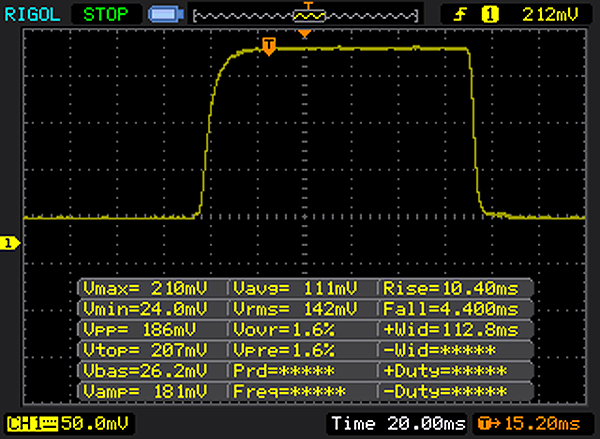 |
| ↘ 4 ms Calo | ||
| Lo schermo mostra buoni tempi di risposta durante i nostri tests, ma potrebbe essere troppo lento per i gamers competitivi. In confronto, tutti i dispositivi di test variano da 0.1 (minimo) a 240 (massimo) ms. » 34 % di tutti i dispositivi è migliore. Questo significa che i tempi di risposta rilevati sono migliori rispettto alla media di tutti i dispositivi testati (19.8 ms). | ||
| ↔ Tempo di risposta dal 50% Grigio all'80% Grigio | ||
| 42 ms ... aumenta ↗ e diminuisce ↘ combinato | ↗ 24 ms Incremento | 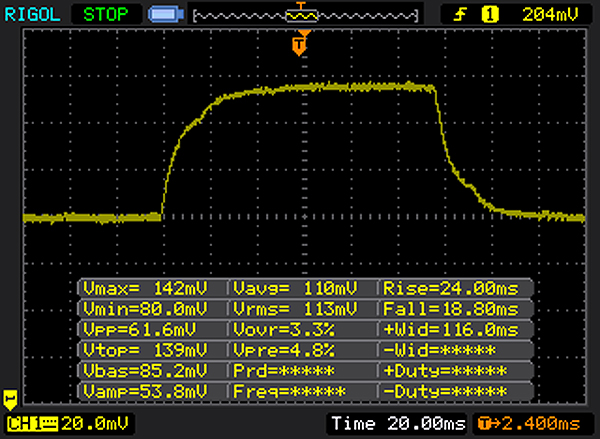 |
| ↘ 18 ms Calo | ||
| Lo schermo mostra tempi di risposta lenti nei nostri tests e sarà insoddisfacente per i gamers. In confronto, tutti i dispositivi di test variano da 0.165 (minimo) a 636 (massimo) ms. » 67 % di tutti i dispositivi è migliore. Questo significa che i tempi di risposta rilevati sono peggiori rispetto alla media di tutti i dispositivi testati (31 ms). | ||
| Cinebench R10 | |
| Rendering Single 32Bit | |
| Dell Inspiron 15 5000 5567-1753 | |
| Acer Aspire 5 A515-51G-51RL | |
| Lenovo IdeaPad 320-15IKB 80XL01NEGE | |
| Rendering Multiple CPUs 32Bit | |
| Dell Inspiron 15 5000 5567-1753 | |
| Lenovo IdeaPad 320-15IKB 80XL01NEGE | |
| Acer Aspire 5 A515-51G-51RL | |
| Geekbench 3 | |
| 32 Bit Multi-Core Score | |
| Acer Aspire 5 A515-51G-51RL | |
| Lenovo IdeaPad 320-15IKB 80XL01NEGE | |
| 32 Bit Single-Core Score | |
| Lenovo IdeaPad 320-15IKB 80XL01NEGE | |
| Acer Aspire 5 A515-51G-51RL | |
| Geekbench 4.0 | |
| 64 Bit Multi-Core Score | |
| Lenovo IdeaPad 320-15IKB 80XL01NEGE | |
| Acer Aspire 5 A515-51G-51RL | |
| 64 Bit Single-Core Score | |
| Lenovo IdeaPad 320-15IKB 80XL01NEGE | |
| Acer Aspire 5 A515-51G-51RL | |
| Geekbench 4.4 | |
| 64 Bit Multi-Core Score | |
| Lenovo IdeaPad 320-15IKB 80XL01NEGE | |
| Acer Aspire 5 A515-51G-51RL | |
| 64 Bit Single-Core Score | |
| Lenovo IdeaPad 320-15IKB 80XL01NEGE | |
| Acer Aspire 5 A515-51G-51RL | |
| JetStream 1.1 - 1.1 Total | |
| HP ProBook 450 G4 Y8B60EA | |
| Dell Inspiron 15 5000 5567-1753 | |
| Lenovo IdeaPad 320-15IKB 80XL01NEGE | |
| Acer Aspire 5 A515-51G-51RL | |
| PCMark 8 Home Score Accelerated v2 | 3677 punti | |
| PCMark 8 Creative Score Accelerated v2 | 4418 punti | |
| PCMark 8 Work Score Accelerated v2 | 4623 punti | |
| PCMark 10 Score | 2918 punti | |
Aiuto | ||
| PCMark 8 - Home Score Accelerated v2 | |
| Dell Inspiron 15 5000 5567-1753 | |
| Lenovo IdeaPad 320-15IKB 80XL01NEGE | |
| Acer Aspire 5 A515-51G-51RL | |
| HP ProBook 450 G4 Y8B60EA | |

| Lenovo IdeaPad 320-15IKB 80XL01NEGE SK Hynix HFS256G3BTND | Acer Aspire 5 A515-51G-51RL Kingston RBUSNS8180DS3128GH | Dell Inspiron 15 5000 5567-1753 SanDisk X400 SED 256GB, SATA (SD8TB8U-256G) | |
|---|---|---|---|
| CrystalDiskMark 3.0 | -24% | 12% | |
| Read Seq (MB/s) | 466.4 | 407.5 -13% | 502 8% |
| Write Seq (MB/s) | 259.3 | 283.5 9% | 458.1 77% |
| Read 512 (MB/s) | 314.5 | 282.4 -10% | 382.8 22% |
| Write 512 (MB/s) | 259.4 | 72.7 -72% | 385.7 49% |
| Read 4k (MB/s) | 31.47 | 26.81 -15% | 29.25 -7% |
| Write 4k (MB/s) | 78.3 | 73.7 -6% | 55.9 -29% |
| Read 4k QD32 (MB/s) | 346.1 | 294.8 -15% | 285.2 -18% |
| Write 4k QD32 (MB/s) | 260.4 | 89.6 -66% | 239.6 -8% |
| 3DMark 11 Performance | 3050 punti | |
| 3DMark Ice Storm Standard Score | 51684 punti | |
| 3DMark Cloud Gate Standard Score | 8042 punti | |
| 3DMark Fire Strike Score | 2136 punti | |
Aiuto | ||
| Geekbench 4.0 - Compute OpenCL Score | |
| Acer Aspire 5 A515-51G-51RL | |
| Lenovo IdeaPad 320-15IKB 80XL01NEGE | |
| Asus AsusPro P4540UQ-FY0056R | |
| HP 15-ba077ng | |
| Lenovo Ideapad 110-15ACL 80TJ00H0GE | |
| Geekbench 4.4 - Compute OpenCL Score | |
| Acer Aspire 5 A515-51G-51RL | |
| Lenovo IdeaPad 320-15IKB 80XL01NEGE | |
| basso | medio | alto | ultra | |
|---|---|---|---|---|
| BioShock Infinite (2013) | 122.1 | 68.4 | 59.7 | 22.8 |
| Warhammer 40.000: Dawn of War III (2017) | 52.3 | 18.2 | 16.7 | 14.4 |
| Prey (2017) | 73.2 | 28.2 | 22.2 | 18.7 |
| Rocket League (2017) | 112.5 | 45.8 | 32 | |
| Dirt 4 (2017) | 87.6 | 31.7 | 16.3 | 9.9 |
| Team Fortress 2 (2017) | 88 | 82.3 | 71 | 59.7 |
| Playerunknown's Battlegrounds (PUBG) (2017) | 44.9 | 16.9 | 15.3 | 10.1 |
| F1 2017 (2017) | 51 | 25 | 20 | 13 |
| Ark Survival Evolved (2017) | 33.2 | 9 | 6.2 | 3.1 |
| FIFA 18 (2017) | 115.2 | 70.3 | 58.5 | 56.3 |
Rumorosità
| Idle |
| 30.5 / 30.5 / 30.5 dB(A) |
| DVD |
| 0 / dB(A) |
| Sotto carico |
| 35.1 / 35.4 dB(A) |
 | ||
30 dB silenzioso 40 dB(A) udibile 50 dB(A) rumoroso |
||
min: | ||
(±) La temperatura massima sul lato superiore è di 43.8 °C / 111 F, rispetto alla media di 36.8 °C / 98 F, che varia da 21 a 71 °C per questa classe Multimedia.
(±) Il lato inferiore si riscalda fino ad un massimo di 43.7 °C / 111 F, rispetto alla media di 39.1 °C / 102 F
(+) In idle, la temperatura media del lato superiore è di 25 °C / 77 F, rispetto alla media deld ispositivo di 31.3 °C / 88 F.
(±) I poggiapolsi e il touchpad possono diventare molto caldi al tatto con un massimo di 38.4 °C / 101.1 F.
(-) La temperatura media della zona del palmo della mano di dispositivi simili e'stata di 28.7 °C / 83.7 F (-9.7 °C / -17.4 F).
Lenovo IdeaPad 320-15IKB 80XL01NEGE analisi audio
(-) | altoparlanti non molto potenti (68.1 dB)
Bassi 100 - 315 Hz
(-) | quasi nessun basso - in media 21.7% inferiori alla media
(±) | la linearità dei bassi è media (13.7% delta rispetto alla precedente frequenza)
Medi 400 - 2000 Hz
(+) | medi bilanciati - solo only 3.4% rispetto alla media
(±) | linearità dei medi adeguata (7% delta rispetto alla precedente frequenza)
Alti 2 - 16 kHz
(±) | alti elevati - circa 5.3% superiori alla media
(±) | la linearità degli alti è media (8.8% delta rispetto alla precedente frequenza)
Nel complesso 100 - 16.000 Hz
(±) | la linearità complessiva del suono è media (24.4% di differenza rispetto alla media
Rispetto alla stessa classe
» 86% di tutti i dispositivi testati in questa classe è stato migliore, 5% simile, 9% peggiore
» Il migliore ha avuto un delta di 5%, medio di 17%, peggiore di 45%
Rispetto a tutti i dispositivi testati
» 74% di tutti i dispositivi testati in questa classe è stato migliore, 6% similare, 20% peggiore
» Il migliore ha avuto un delta di 4%, medio di 24%, peggiore di 134%
Apple MacBook 12 (Early 2016) 1.1 GHz analisi audio
(+) | gli altoparlanti sono relativamente potenti (83.6 dB)
Bassi 100 - 315 Hz
(±) | bassi ridotti - in media 11.3% inferiori alla media
(±) | la linearità dei bassi è media (14.2% delta rispetto alla precedente frequenza)
Medi 400 - 2000 Hz
(+) | medi bilanciati - solo only 2.4% rispetto alla media
(+) | medi lineari (5.5% delta rispetto alla precedente frequenza)
Alti 2 - 16 kHz
(+) | Alti bilanciati - appena 2% dalla media
(+) | alti lineari (4.5% delta rispetto alla precedente frequenza)
Nel complesso 100 - 16.000 Hz
(+) | suono nel complesso lineare (10.2% differenza dalla media)
Rispetto alla stessa classe
» 7% di tutti i dispositivi testati in questa classe è stato migliore, 2% simile, 91% peggiore
» Il migliore ha avuto un delta di 5%, medio di 18%, peggiore di 53%
Rispetto a tutti i dispositivi testati
» 5% di tutti i dispositivi testati in questa classe è stato migliore, 1% similare, 94% peggiore
» Il migliore ha avuto un delta di 4%, medio di 24%, peggiore di 134%
| Off / Standby | |
| Idle | |
| Sotto carico |
|
Leggenda:
min: | |
| Battery Runtime - WiFi Websurfing | |
| Acer Aspire 5 A515-51G-51RL | |
| HP ProBook 450 G4 Y8B60EA | |
| Dell Inspiron 15 5000 5567-1753 | |
| Lenovo IdeaPad 320-15IKB 80XL01NEGE | |
Pro
Contro
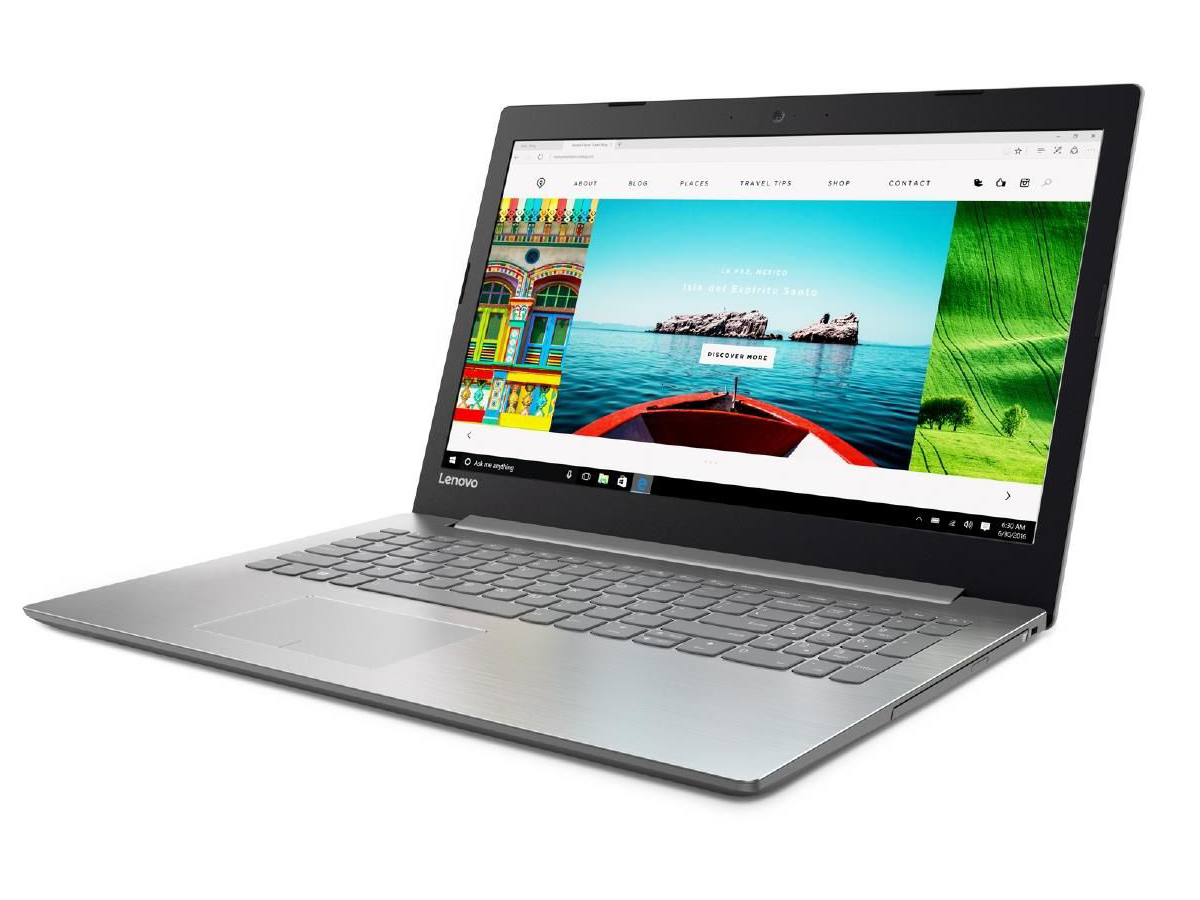
Con l'IdeaPad 320-15IKB, Lenovo realizza un tuttofare da 15.6". Il processore Kaby Lake fornisce tutta la potenza necessaria. Il chip grafico dedicato rende possibile gestire molti giochi. Tuttavia, bisogna accettare qualche limitazione dei settaggi grafici e di risoluzione per avere frame rates adeguati. Il dispositivo non si scalda molto e resta abbastanza silenzioso per la maggior parte del tempo. Un SSD consente di avere un sistema molto reattivo.
L'IdeaPad 320-15IKB è un tuttofare adatto all'uso domestico.
La tastiera del portatile lascia un'impressione positiva e si adatta al lavoro da ufficio. Tuttavia, manca l'illuminazione. Dovrebbe essere una feature standard con un prezzo di 800-Euro (~$940).
La qualità dello schermo non rispecchia il prezzo del dispositivo. Lenovo usa un pannello con luminosità e contrasto scarsi, ed angoli di visuale limitati, cosa accettabile solo sui portatili economici. L'autonomia non è nulla di speciale. Poiché Lenovo ha puntato su una batteria con una capacità limitata (30 Wh), il portatile riesce a raggiungere un'autonomia di appena 4 ore e 39 minuti nel test Wi-Fi. Pertanto non possiamo dire che questo portatile sia adatto all'uso mobile.
Nota: si tratta di una recensione breve, con alcune sezioni non tradotte, per la versione integrale in inglese guardate qui.
Lenovo IdeaPad 320-15IKB 80XL01NEGE
- 10/19/2017 v6 (old)
Sascha Mölck