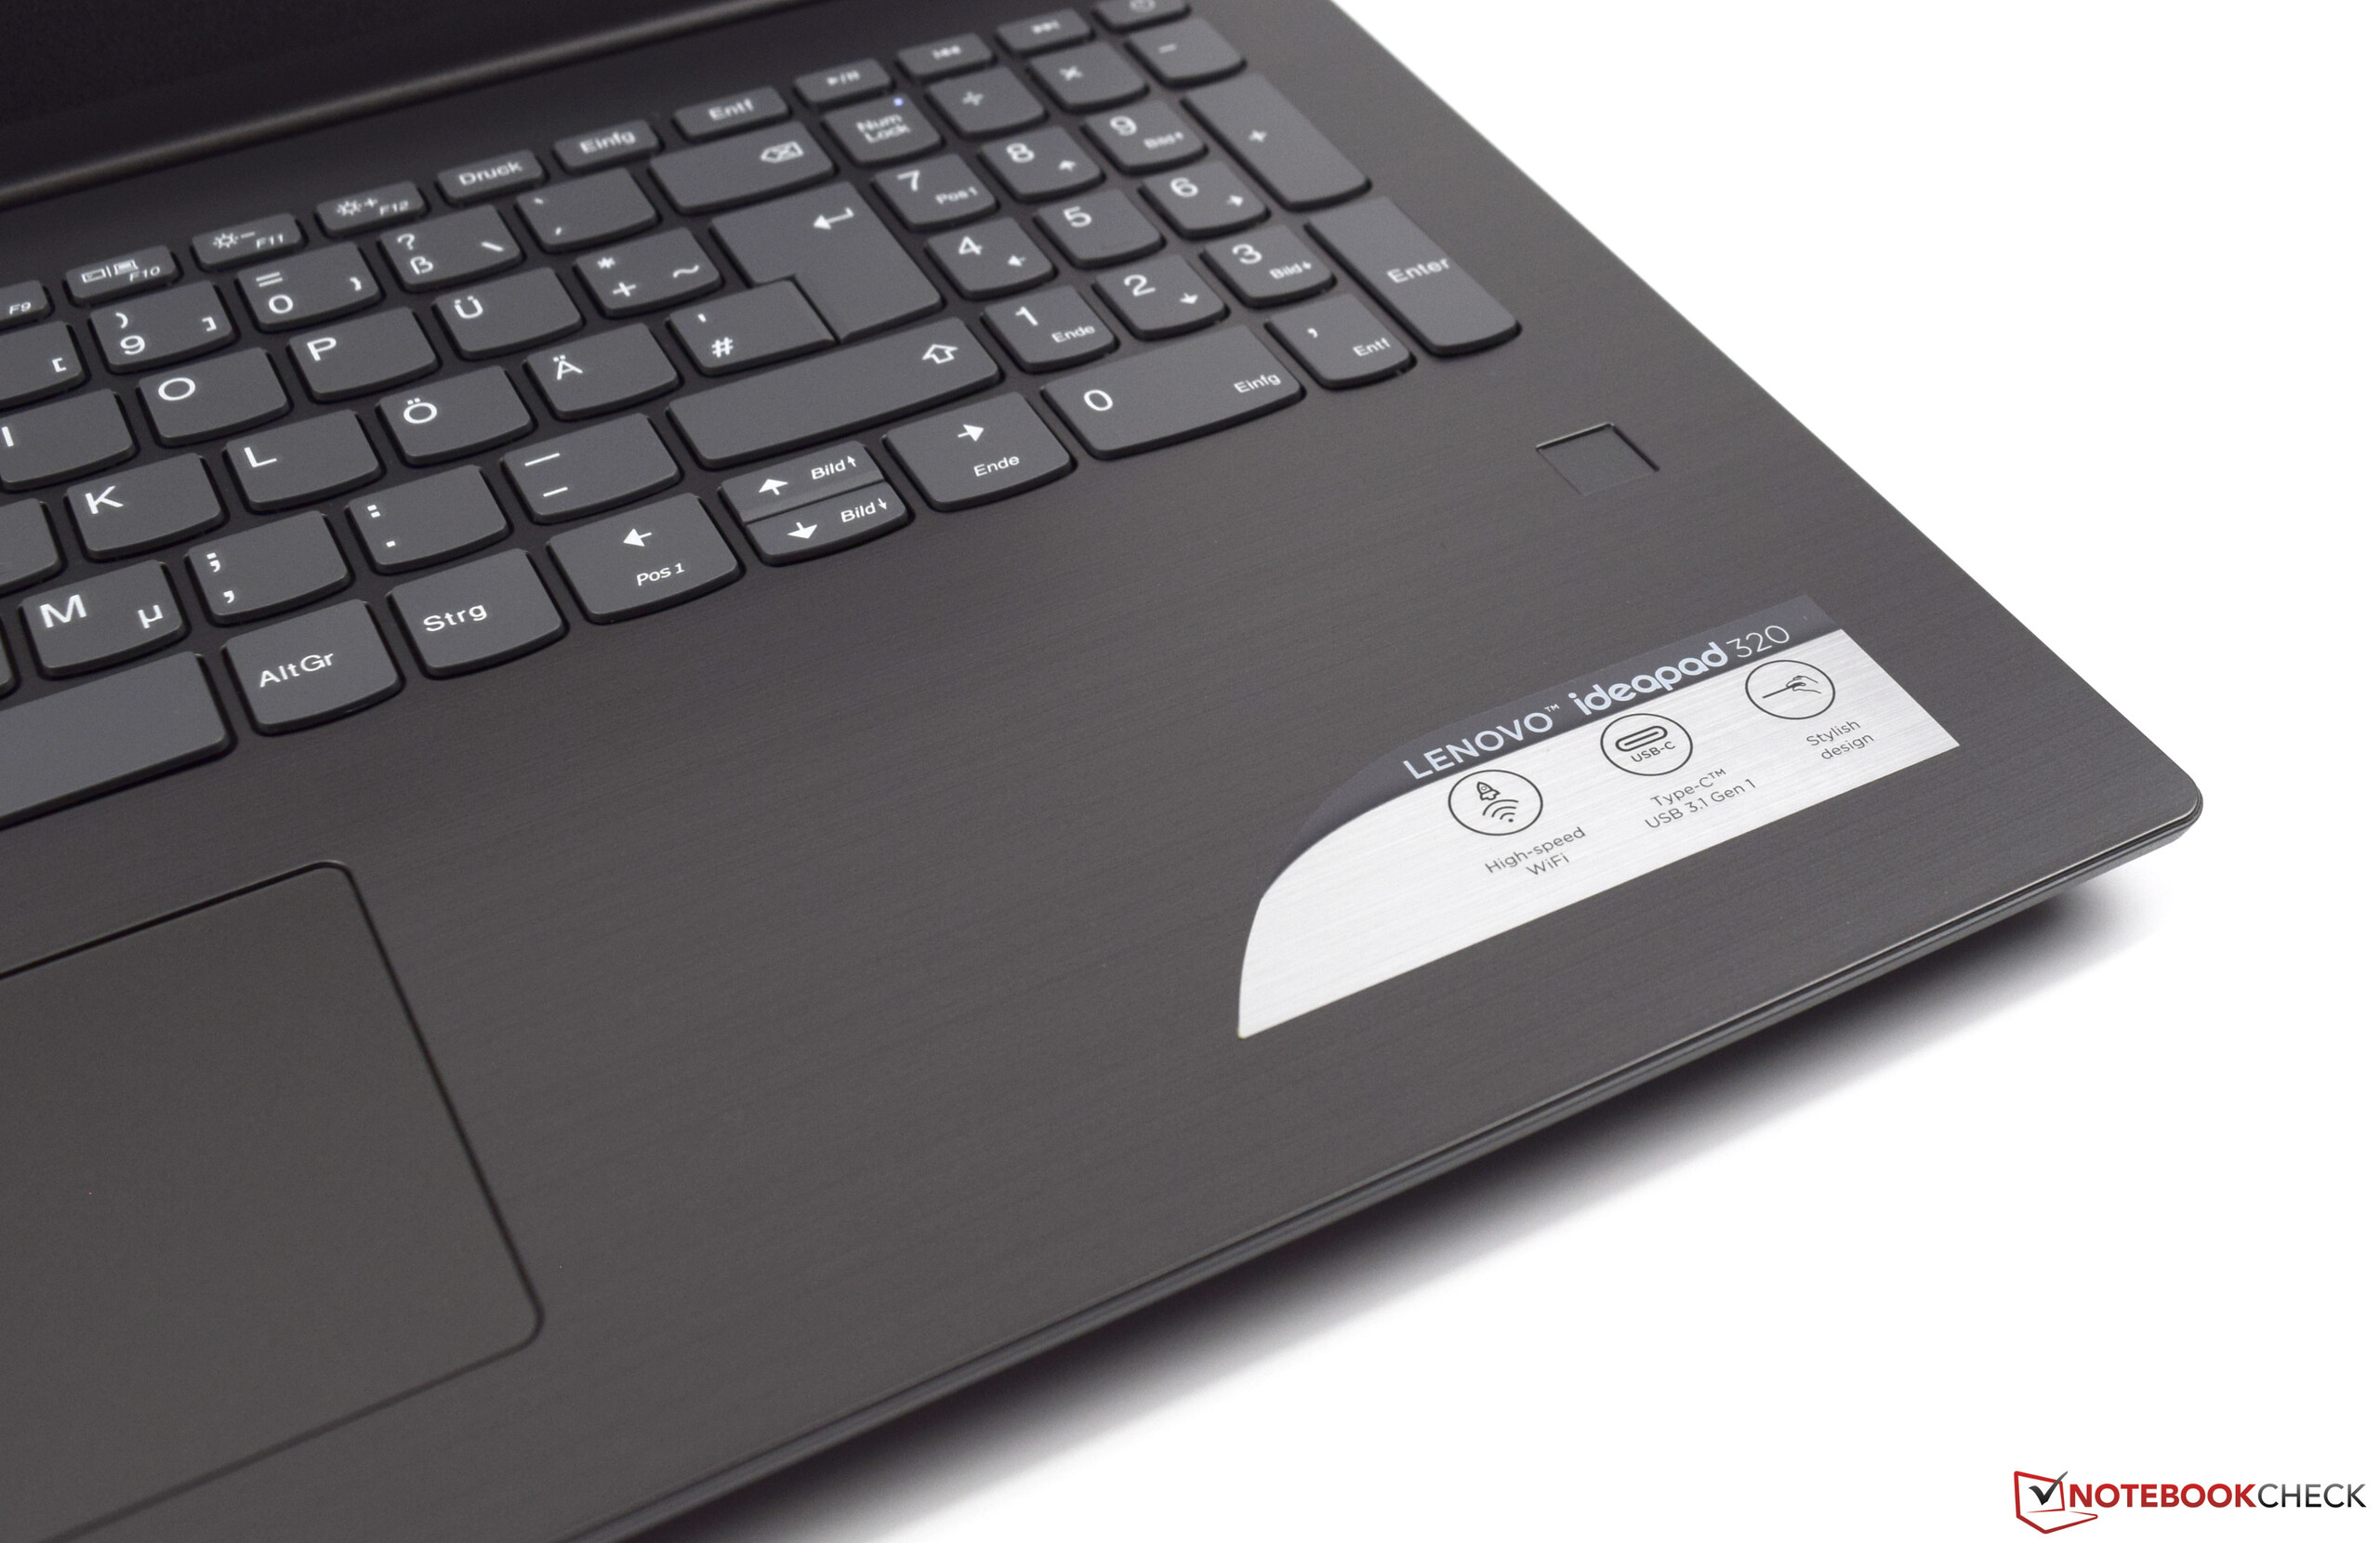
Recensione breve del Portatile Lenovo IdeaPad 320-15IKBRN (8250U, MX150, FHD)

| SD Card Reader | |
| average JPG Copy Test (av. of 3 runs) | |
| HP Pavilion 15-cc107ng (Toshiba Exceria Pro SDXC 64 GB UHS-II) | |
| Acer Aspire 7 A715-71G-53TU (Toshiba Exceria Pro SDXC 64 GB UHS-II) | |
| Asus VivoBook 15 X510UQ-BQ534T (Toshiba Exceria Pro SDXC 64 GB UHS-II) | |
| Acer Swift 3 SF315-41-R4W1 | |
| Lenovo IdeaPad 320-15IKBRN 81BG001KGE (Toshiba Exceria Pro SDXC 64 GB UHS-II) | |
| Lenovo IdeaPad 320-15IKB 80XL01NEGE (Toshiba Exceria Pro SDXC 64 GB UHS-II) | |
| Asus ZenBook UX530UX-FY070T (Toshiba Exceria Pro SDXC 64 GB UHS-II) | |
| maximum AS SSD Seq Read Test (1GB) | |
| HP Pavilion 15-cc107ng (Toshiba Exceria Pro SDXC 64 GB UHS-II) | |
| Acer Aspire 7 A715-71G-53TU (Toshiba Exceria Pro SDXC 64 GB UHS-II) | |
| Asus VivoBook 15 X510UQ-BQ534T (Toshiba Exceria Pro SDXC 64 GB UHS-II) | |
| Acer Swift 3 SF315-41-R4W1 | |
| Lenovo IdeaPad 320-15IKBRN 81BG001KGE (Toshiba Exceria Pro SDXC 64 GB UHS-II) | |
| Lenovo IdeaPad 320-15IKB 80XL01NEGE (Toshiba Exceria Pro SDXC 64 GB UHS-II) | |
| Asus ZenBook UX530UX-FY070T (Toshiba Exceria Pro SDXC 64 GB UHS-II) | |
| |||||||||||||||||||||||||
Distribuzione della luminosità: 84 %
Al centro con la batteria: 220 cd/m²
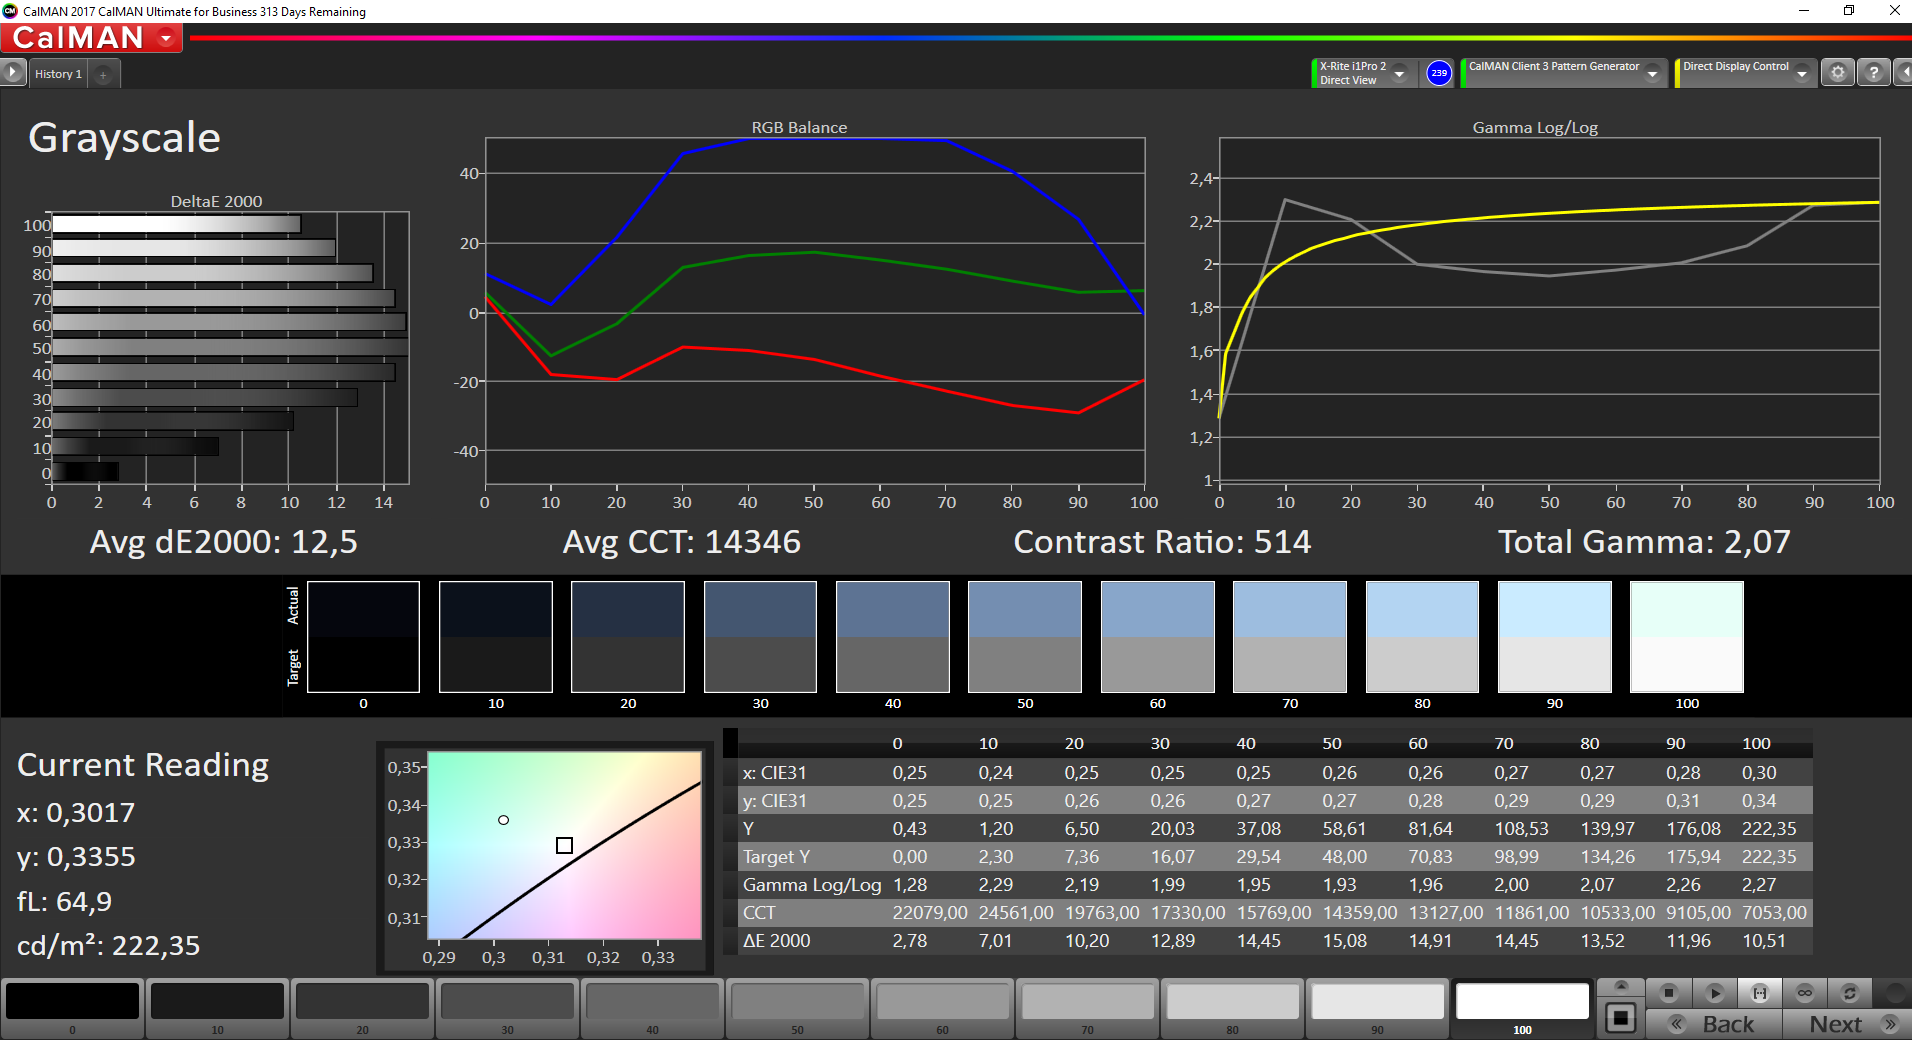
Contrasto: 512:1 (Nero: 0.43 cd/m²)
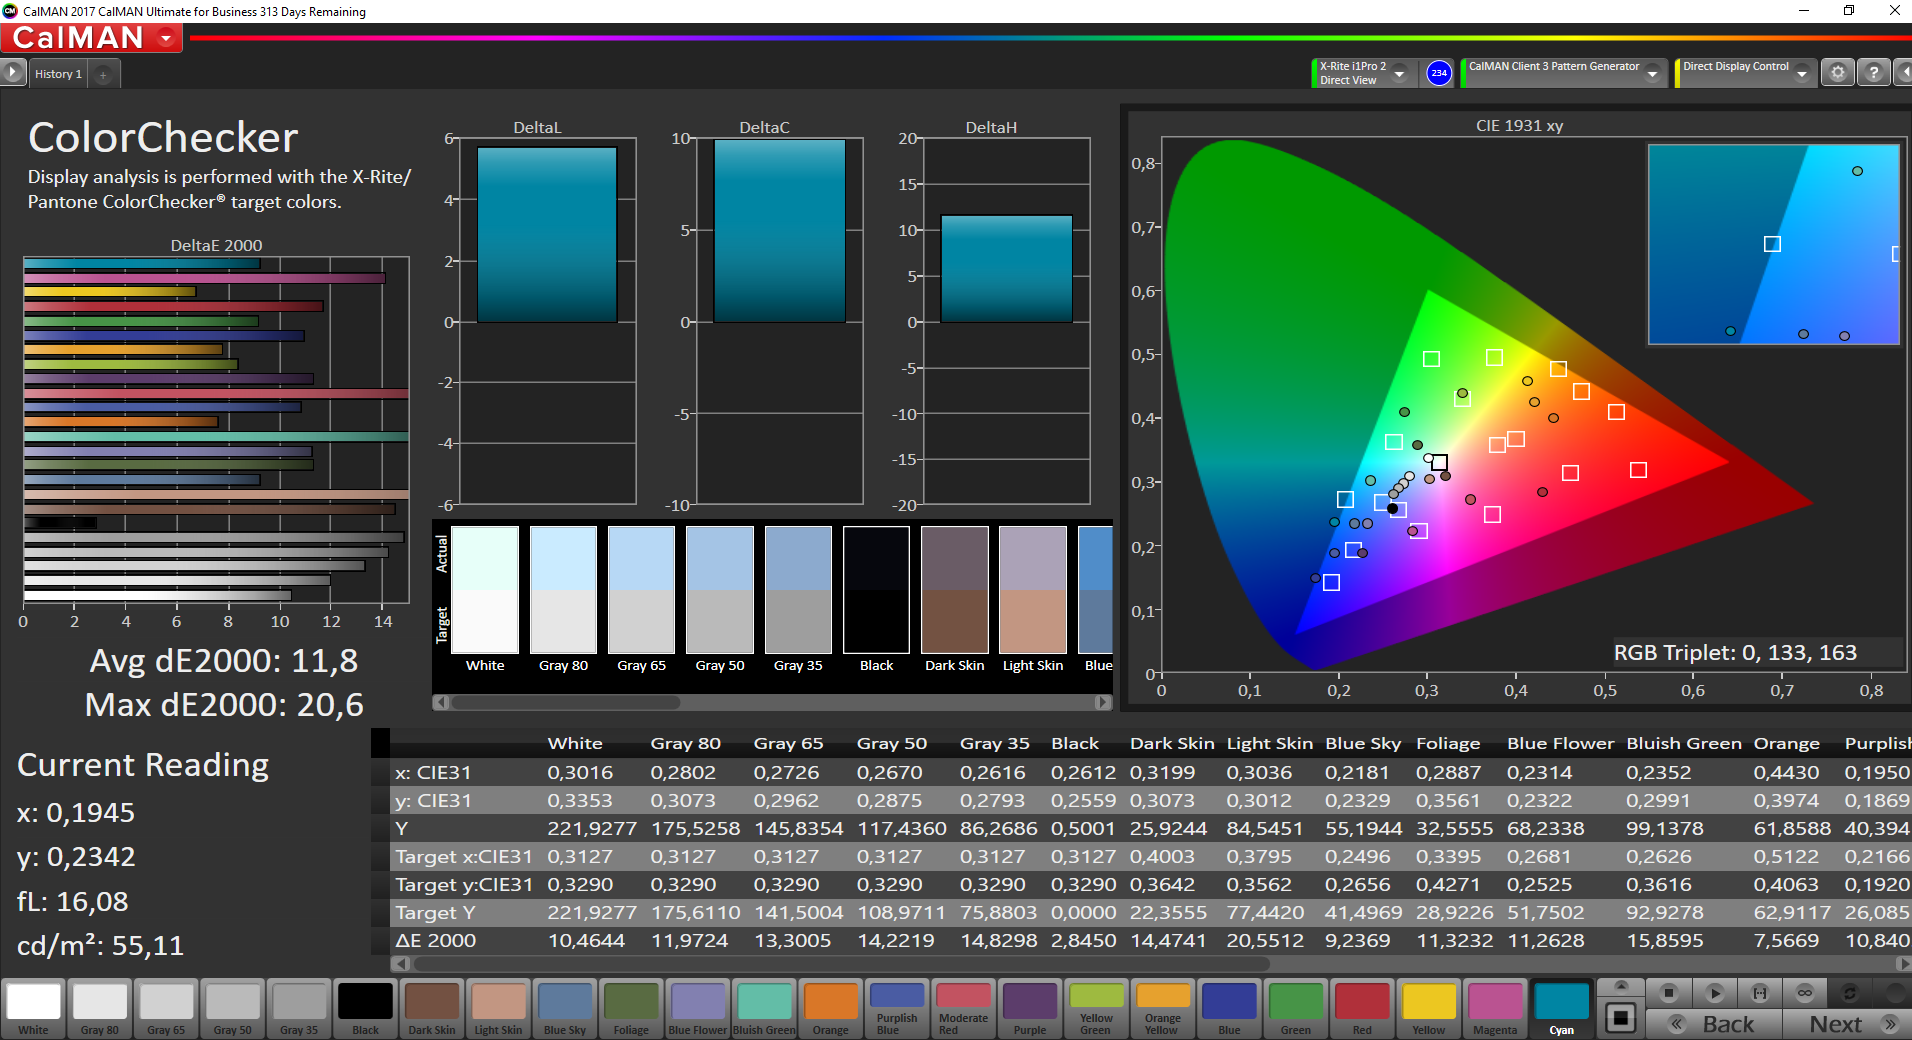
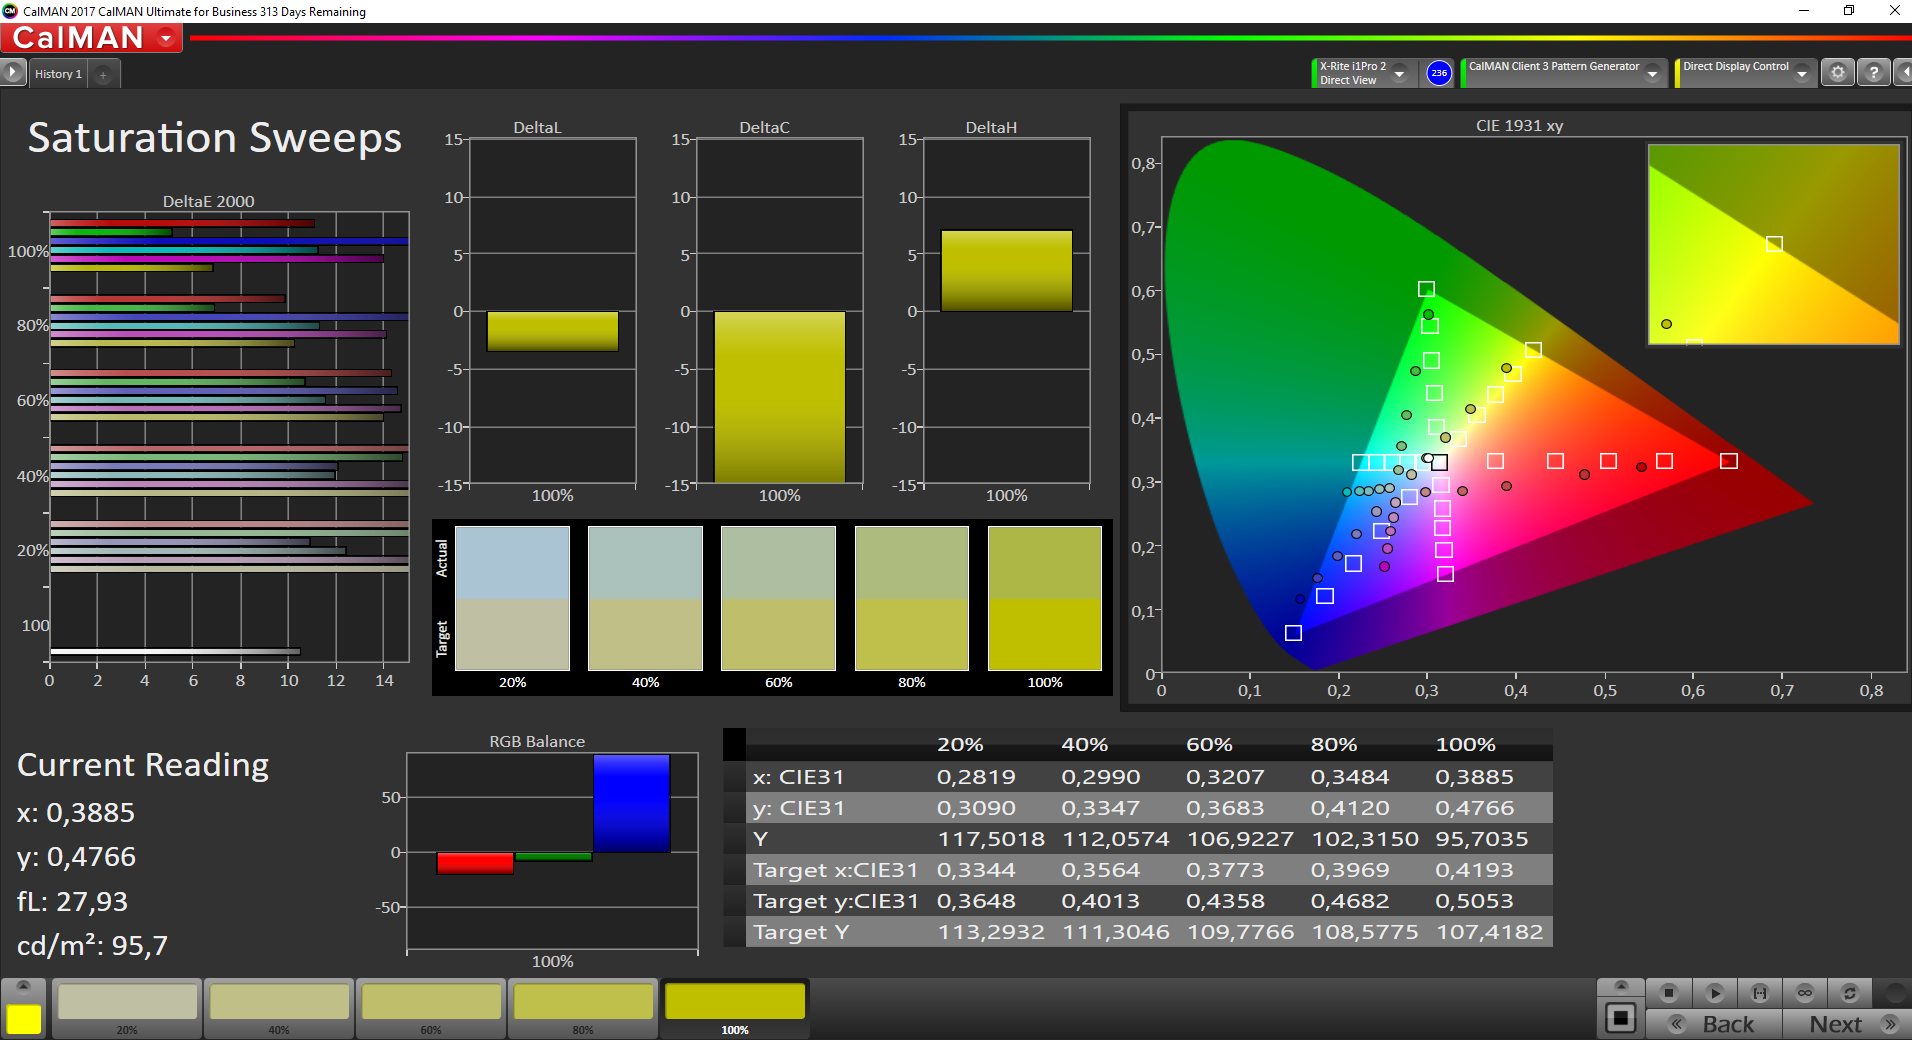
ΔE ColorChecker Calman: 11.8 | ∀{0.5-29.43 Ø4.73}
ΔE Greyscale Calman: 12.5 | ∀{0.09-98 Ø4.97}
62.7% sRGB (Argyll 1.6.3 3D)
40.1% AdobeRGB 1998 (Argyll 1.6.3 3D)
43.44% AdobeRGB 1998 (Argyll 3D)
62.8% sRGB (Argyll 3D)
42.04% Display P3 (Argyll 3D)
Gamma: 2.07
CCT: 14346 K
| Lenovo IdeaPad 320-15IKBRN 81BG001KGE Chi Mei CMN15D5, N156HGA-EAB, 1920x1080, 15.6" | Lenovo IdeaPad 320-15IKB 80XL01NEGE Chi Mei N156HGA-EAB, 1920x1080, 15.6" | Asus ZenBook UX530UX-FY070T Chi Mei CMN15E8, 1920x1080, 15.6" | Asus VivoBook 15 X510UQ-BQ534T LG Philips LP156WF9-SPK2, 1920x1080, 15.6" | Acer Swift 3 SF315-41-R4W1 BOE CQ NV156FHM-N48, 1920x1080, 15.6" | HP Pavilion 15-cc107ng AU Optronics, 1920x1080, 15.6" | Acer Aspire 7 A715-71G-53TU BOE NV156FHM-N42 , 1920x1080, 15.6" | |
|---|---|---|---|---|---|---|---|
| Display | -6% | 49% | -7% | -6% | -11% | -4% | |
| Display P3 Coverage (%) | 42.04 | 39.47 -6% | 64.3 53% | 39.22 -7% | 39.59 -6% | 37.28 -11% | 40.53 -4% |
| sRGB Coverage (%) | 62.8 | 59 -6% | 90.6 44% | 59 -6% | 58.5 -7% | 56.1 -11% | 59.9 -5% |
| AdobeRGB 1998 Coverage (%) | 43.44 | 40.81 -6% | 65.2 50% | 40.55 -7% | 40.9 -6% | 38.51 -11% | 41.87 -4% |
| Response Times | 10% | -32% | 19% | -63% | 10% | -66% | |
| Response Time Grey 50% / Grey 80% * (ms) | 45.6 ? | 42 ? 8% | 40 ? 12% | 43 ? 6% | 46 ? -1% | 45 ? 1% | 49 ? -7% |
| Response Time Black / White * (ms) | 16 ? | 14 ? 12% | 28 ? -75% | 11 ? 31% | 36 ? -125% | 13 ? 19% | 36 ? -125% |
| PWM Frequency (Hz) | 25770 ? | 25000 ? | 25000 ? | 21000 ? | 20000 ? | ||
| Screen | 0% | 56% | 38% | 40% | 3% | 33% | |
| Brightness middle (cd/m²) | 220 | 227 3% | 309 40% | 267 21% | 237 8% | 234 6% | 267 21% |
| Brightness (cd/m²) | 194 | 207 7% | 296 53% | 250 29% | 229 18% | 230 19% | 250 29% |
| Brightness Distribution (%) | 84 | 81 -4% | 80 -5% | 83 -1% | 88 5% | 76 -10% | 82 -2% |
| Black Level * (cd/m²) | 0.43 | 0.44 -2% | 0.24 44% | 0.22 49% | 0.19 56% | 0.34 21% | 0.31 28% |
| Contrast (:1) | 512 | 516 1% | 1288 152% | 1214 137% | 1247 144% | 688 34% | 861 68% |
| Colorchecker dE 2000 * | 11.8 | 11.52 2% | 4.09 65% | 5.31 55% | 4.85 59% | 12.19 -3% | 4.65 61% |
| Colorchecker dE 2000 max. * | 20.6 | 19.97 3% | 7.44 64% | 9.28 55% | 8.34 60% | 20.81 -1% | 8.2 60% |
| Greyscale dE 2000 * | 12.5 | 12.01 4% | 4.75 62% | 6.24 50% | 3.84 69% | 13.99 -12% | 2.65 79% |
| Gamma | 2.07 106% | 2.23 99% | 2.39 92% | 2.7 81% | 2.42 91% | 2.32 95% | 2.44 90% |
| CCT | 14346 45% | 13330 49% | 7034 92% | 7619 85% | 6790 96% | 15863 41% | 6820 95% |
| Color Space (Percent of AdobeRGB 1998) (%) | 40.1 | 38 -5% | 58 45% | 37 -8% | 37 -8% | 36 -10% | 38 -5% |
| Color Space (Percent of sRGB) (%) | 62.7 | 59 -6% | 90 44% | 59 -6% | 58 -7% | 56 -11% | 59 -6% |
| Media totale (Programma / Settaggio) | 1% /
0% | 24% /
43% | 17% /
27% | -10% /
17% | 1% /
1% | -12% /
13% |
* ... Meglio usare valori piccoli

Tempi di risposta del Display
| ↔ Tempi di risposta dal Nero al Bianco | ||
|---|---|---|
| 16 ms ... aumenta ↗ e diminuisce ↘ combinato | ↗ 11.6 ms Incremento | 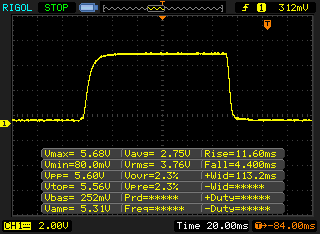 |
| ↘ 4.4 ms Calo | ||
| Lo schermo mostra buoni tempi di risposta durante i nostri tests, ma potrebbe essere troppo lento per i gamers competitivi. In confronto, tutti i dispositivi di test variano da 0.1 (minimo) a 240 (massimo) ms. » 37 % di tutti i dispositivi è migliore. Questo significa che i tempi di risposta rilevati sono migliori rispettto alla media di tutti i dispositivi testati (19.9 ms). | ||
| ↔ Tempo di risposta dal 50% Grigio all'80% Grigio | ||
| 45.6 ms ... aumenta ↗ e diminuisce ↘ combinato | ↗ 24.4 ms Incremento | 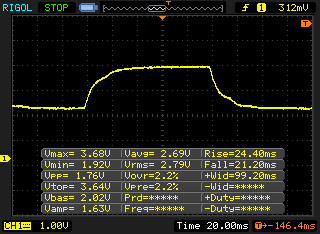 |
| ↘ 21.2 ms Calo | ||
| Lo schermo mostra tempi di risposta lenti nei nostri tests e sarà insoddisfacente per i gamers. In confronto, tutti i dispositivi di test variano da 0.165 (minimo) a 636 (massimo) ms. » 78 % di tutti i dispositivi è migliore. Questo significa che i tempi di risposta rilevati sono peggiori rispetto alla media di tutti i dispositivi testati (31.1 ms). | ||
Sfarfallio dello schermo / PWM (Pulse-Width Modulation)
| flickering dello schermo / PWM rilevato | 25770 Hz | ≤ 60 % settaggio luminosita' | 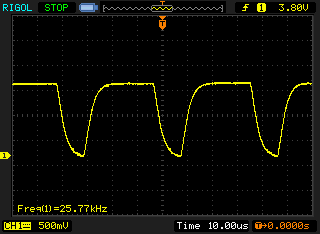 |
Il display sfarfalla a 25770 Hz (Probabilmente a causa dell'uso di PWM) Flickering rilevato ad una luminosita' di 60 % o inferiore. Non dovrebbe verificarsi flickering o PWM sopra questo valore di luminosita'. La frequenza di 25770 Hz è abbastanza alta, quindi la maggioranza degli utenti sensibili al PWM non dovrebbero notare alcun flickering. In confronto: 52 % di tutti i dispositivi testati non utilizza PWM per ridurre la luminosita' del display. Se è rilevato PWM, una media di 7784 (minimo: 5 - massimo: 343500) Hz è stata rilevata. | |||
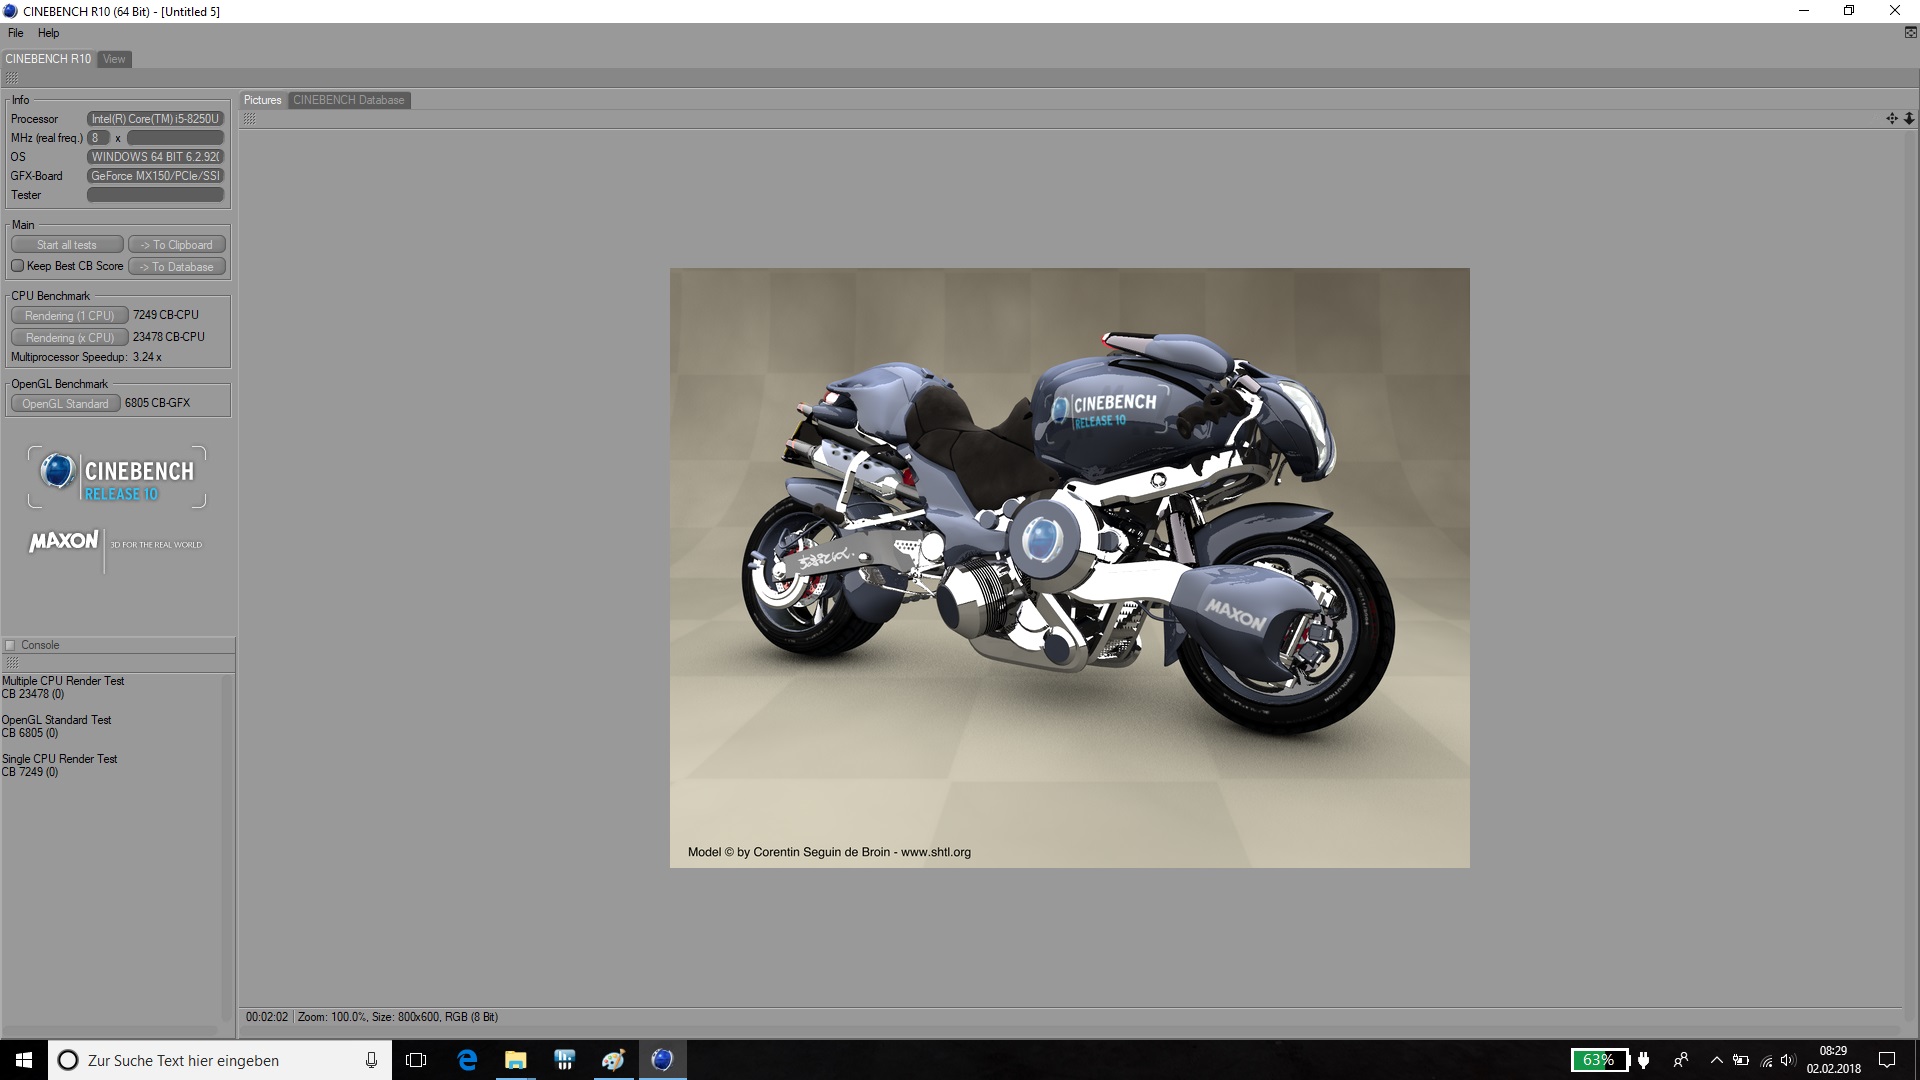
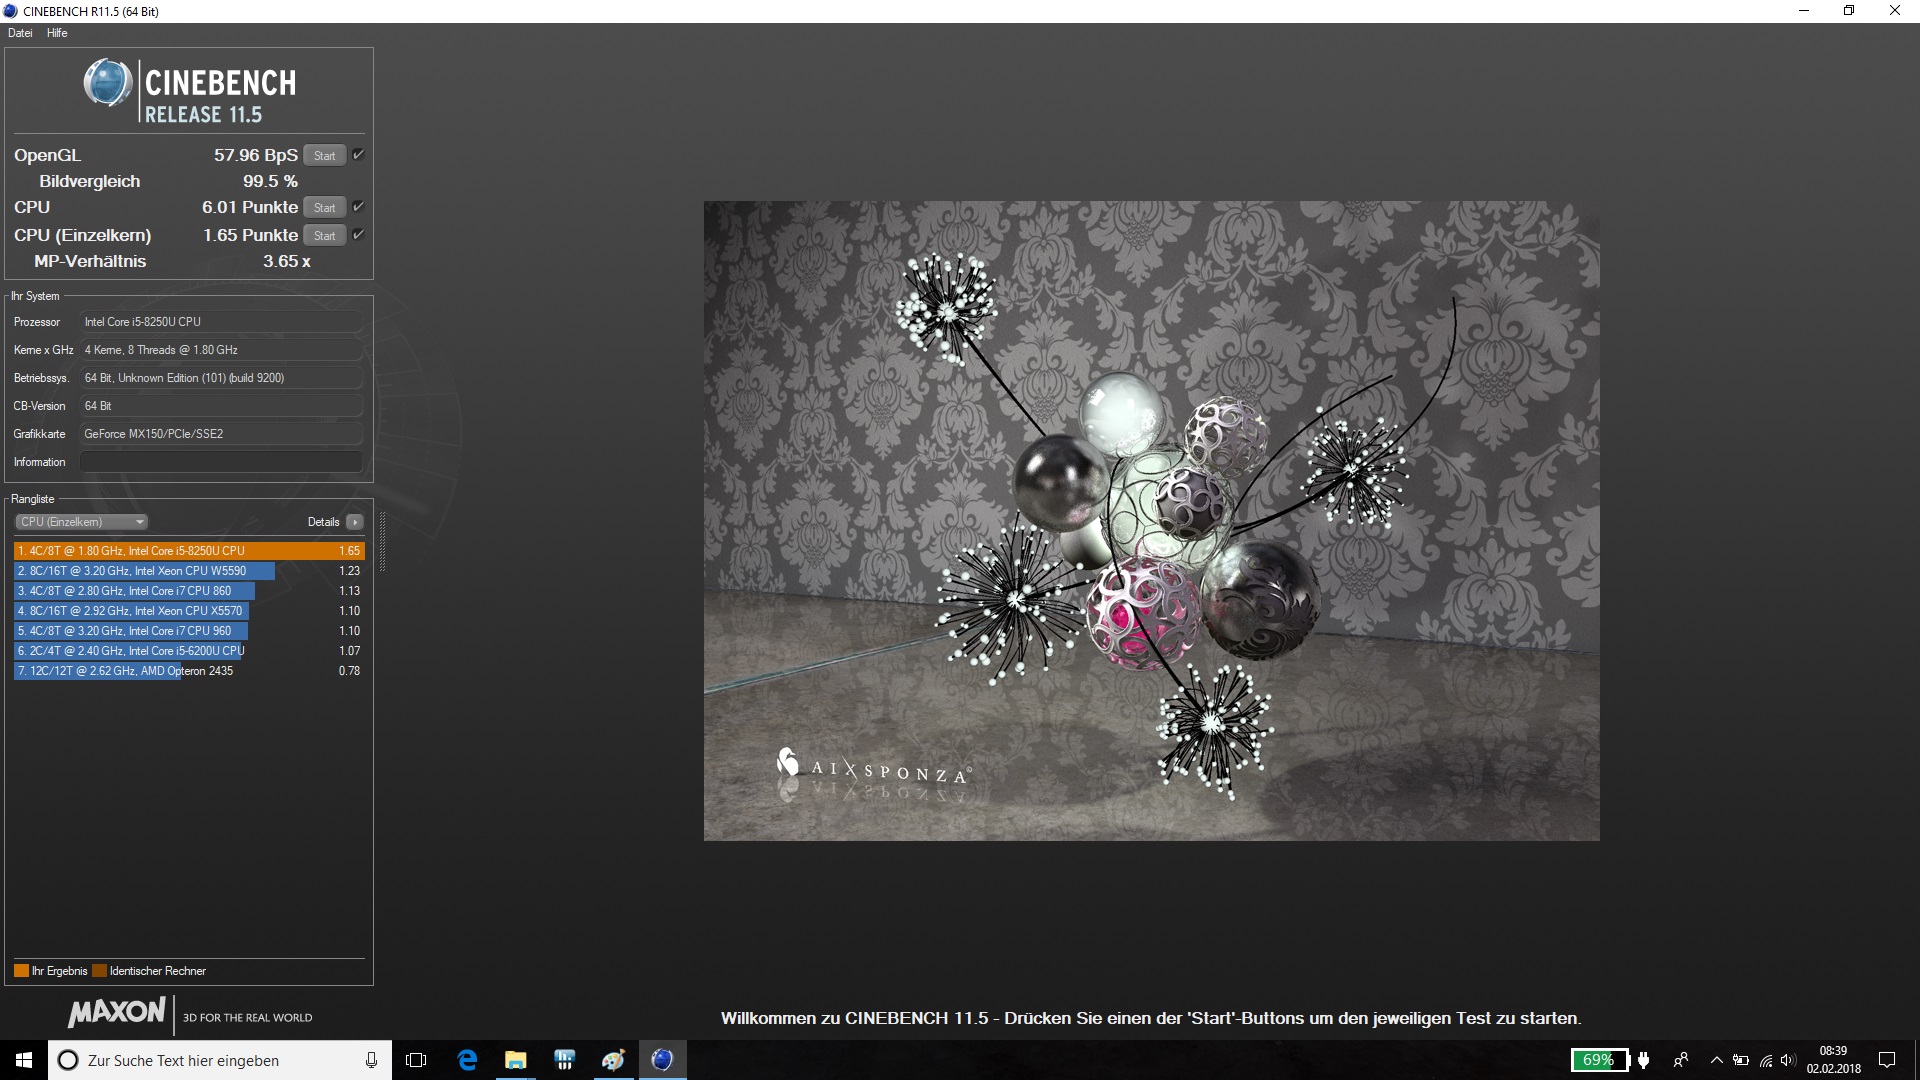
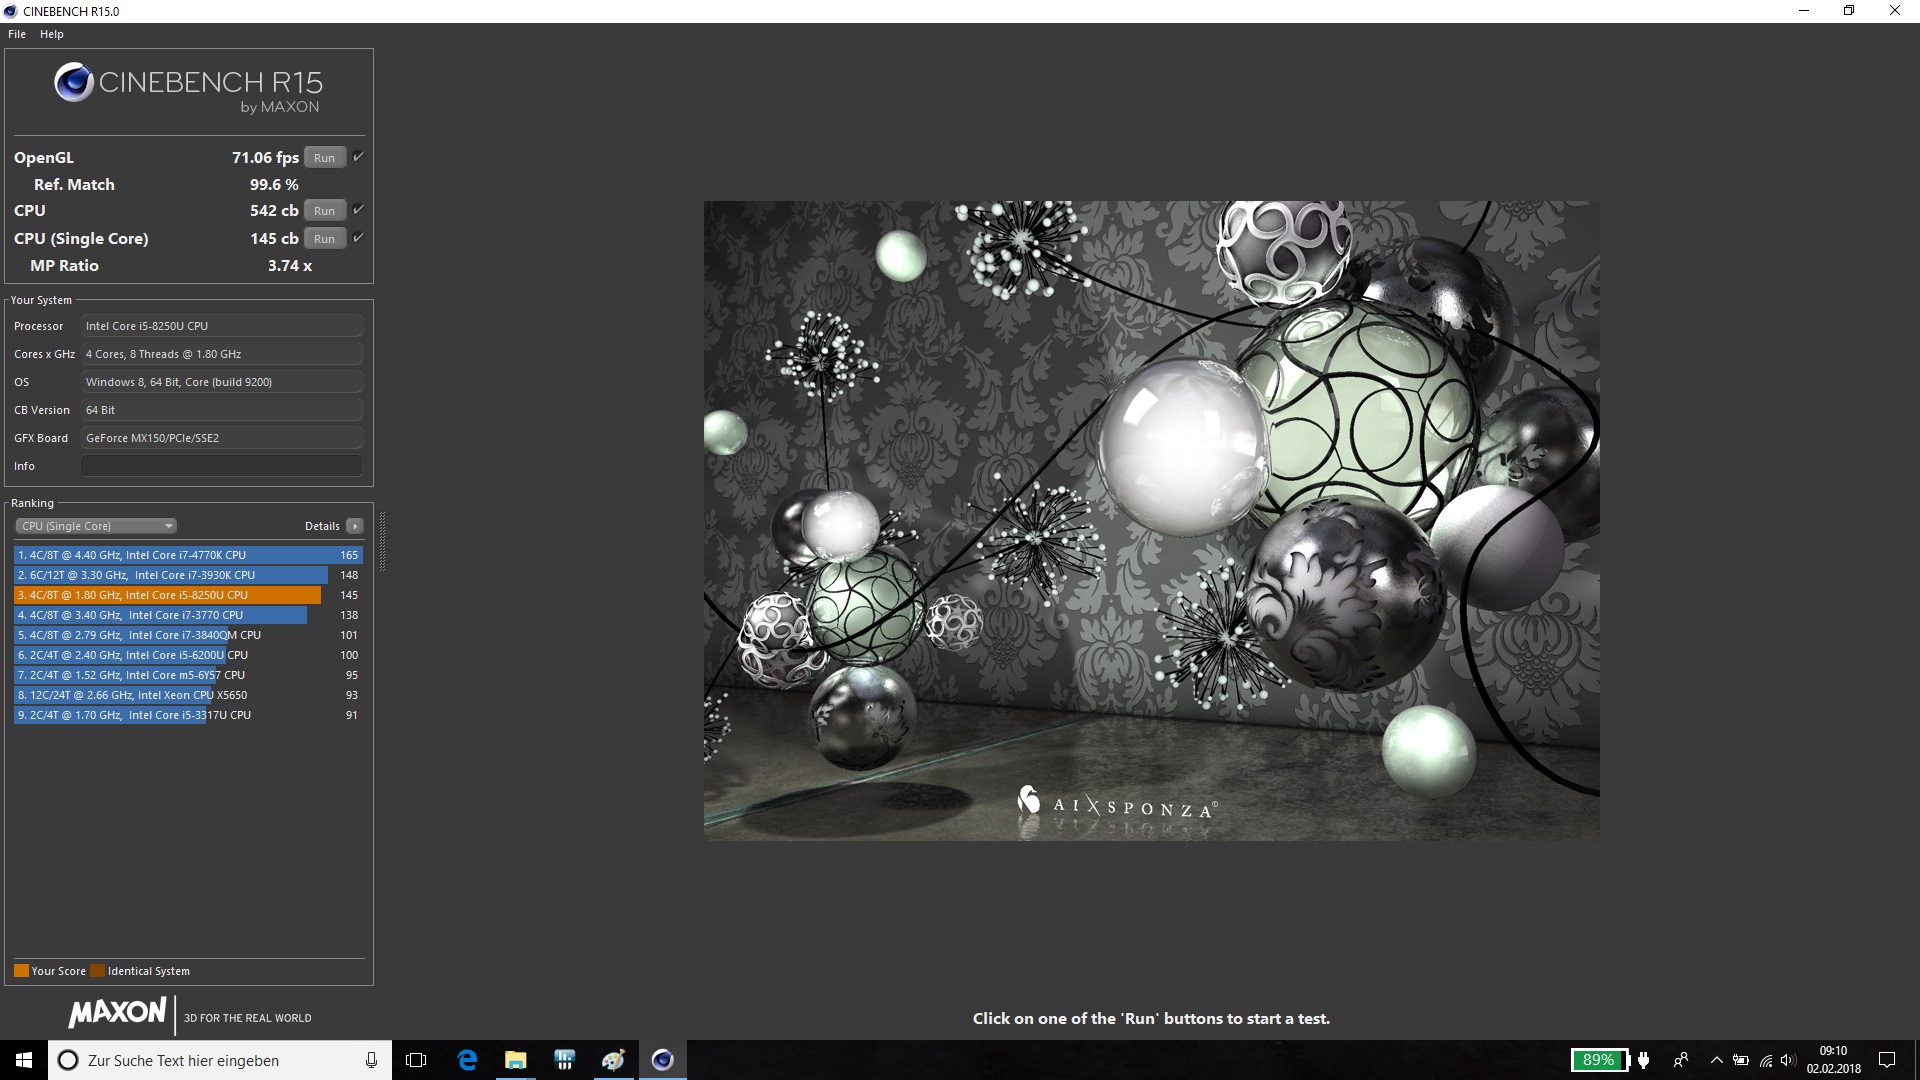
| Cinebench R11.5 | |
| CPU Single 64Bit | |
| Acer Aspire 7 A715-71G-53TU | |
| Lenovo IdeaPad 320-15IKBRN 81BG001KGE | |
| Acer Swift 3 SF315-41-R4W1 | |
| CPU Multi 64Bit | |
| Lenovo IdeaPad 320-15IKBRN 81BG001KGE | |
| Acer Aspire 7 A715-71G-53TU | |
| Acer Swift 3 SF315-41-R4W1 | |
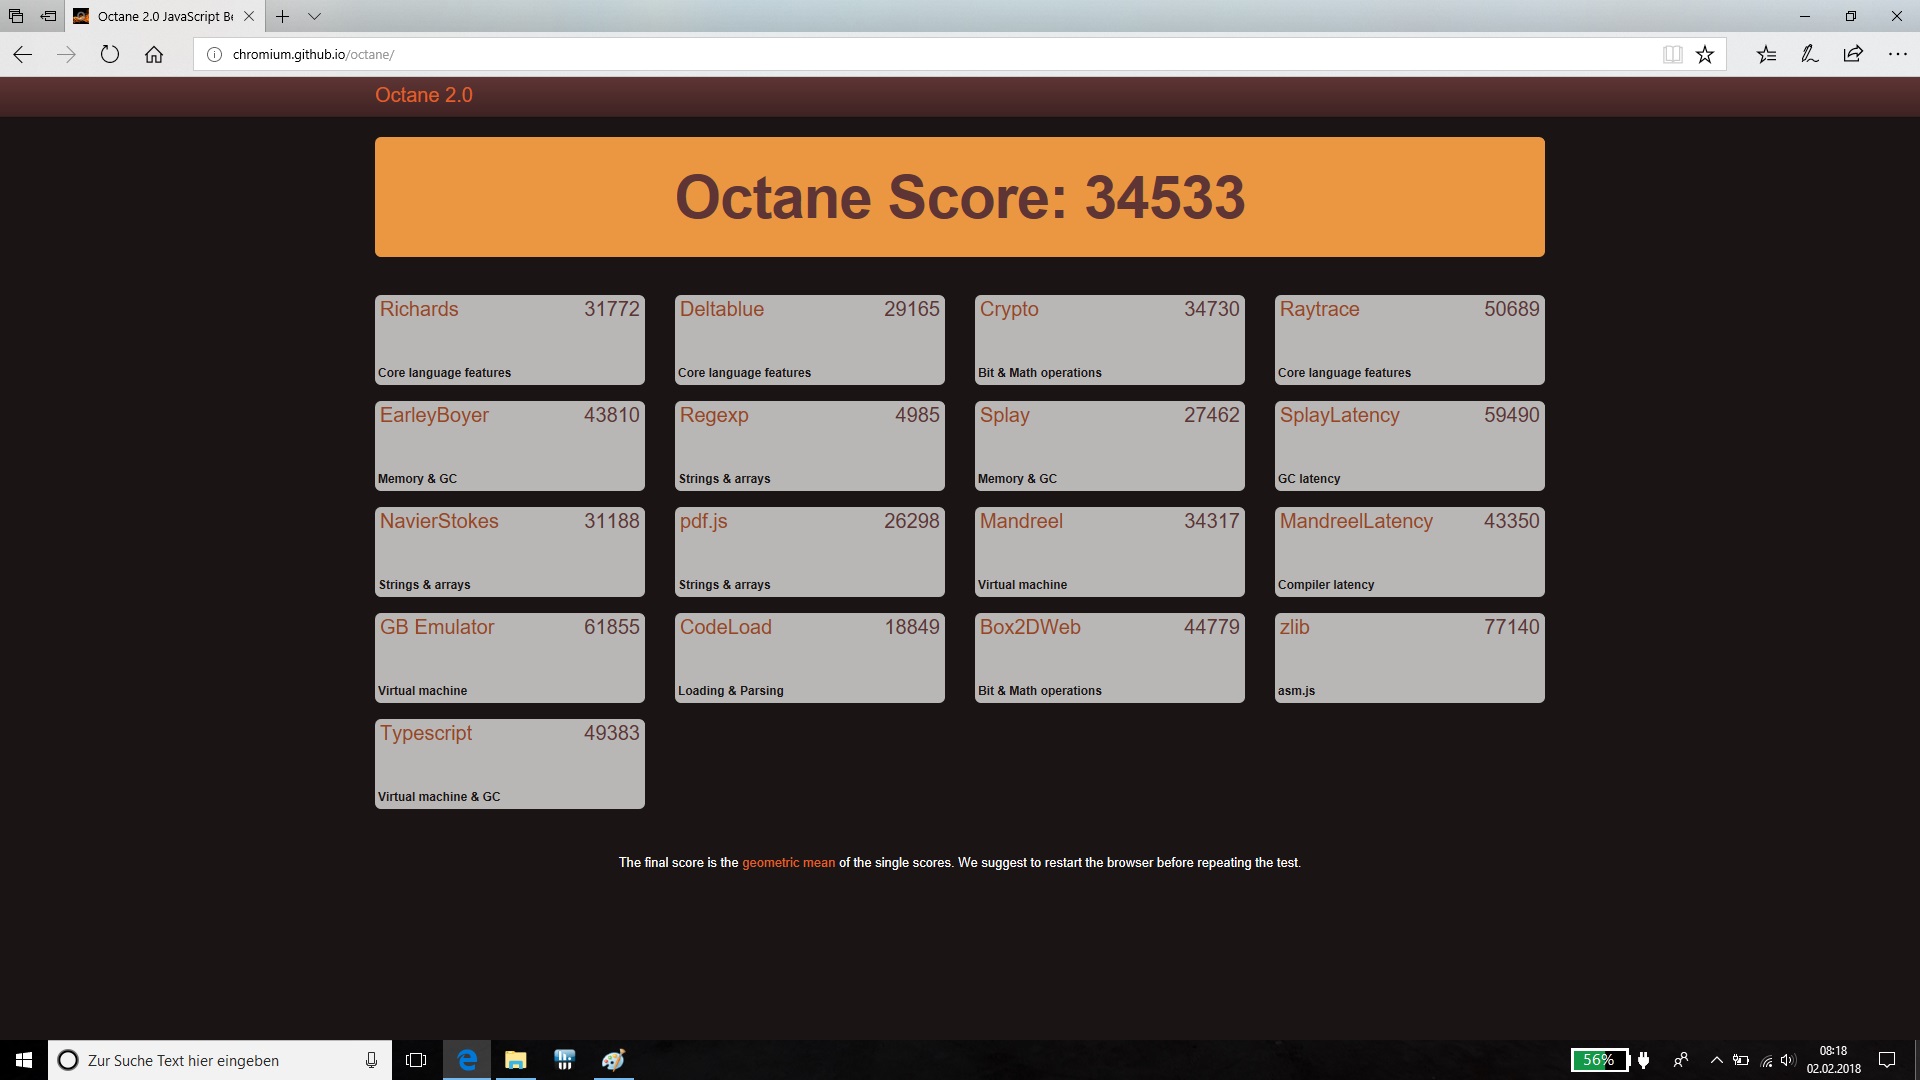
| Octane V2 - Total Score | |
| Acer Aspire 7 A715-71G-53TU | |
| Lenovo IdeaPad 320-15IKBRN 81BG001KGE | |
| Acer Swift 3 SF315-41-R4W1 | |
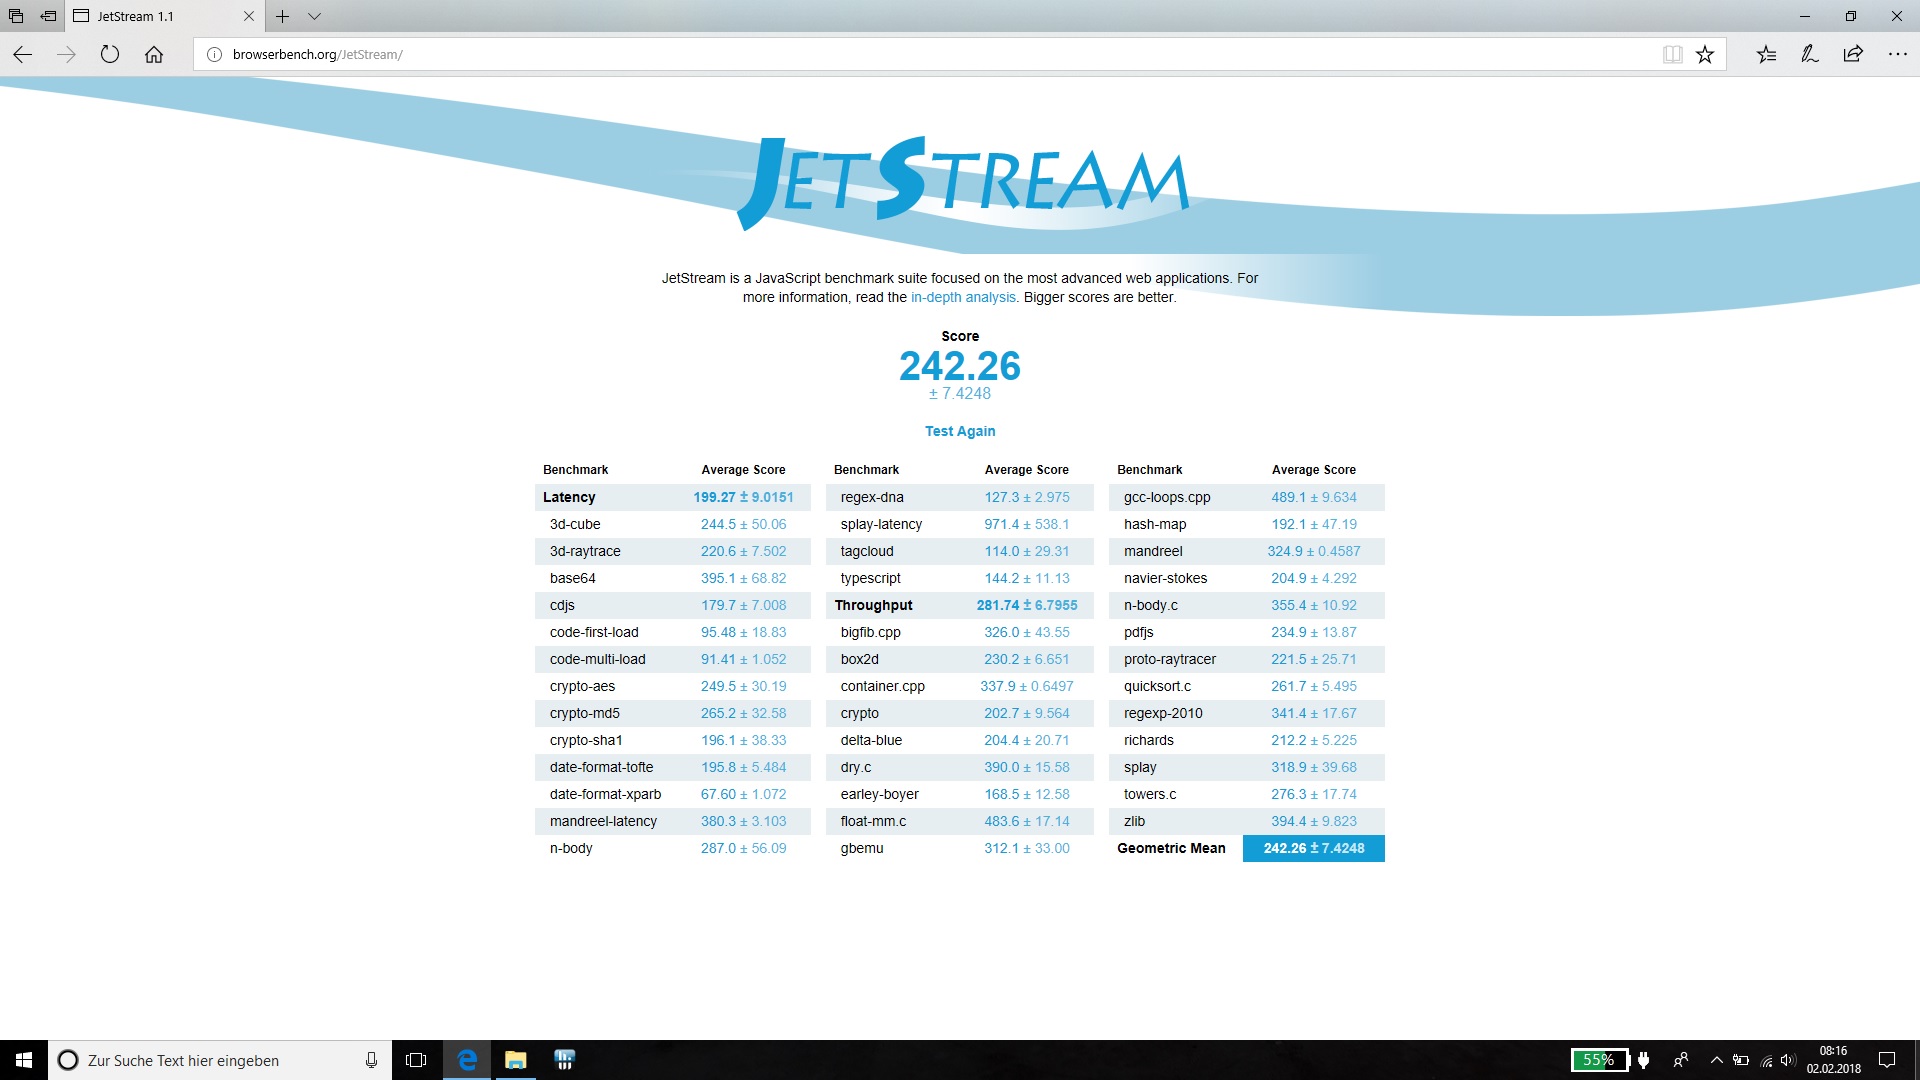
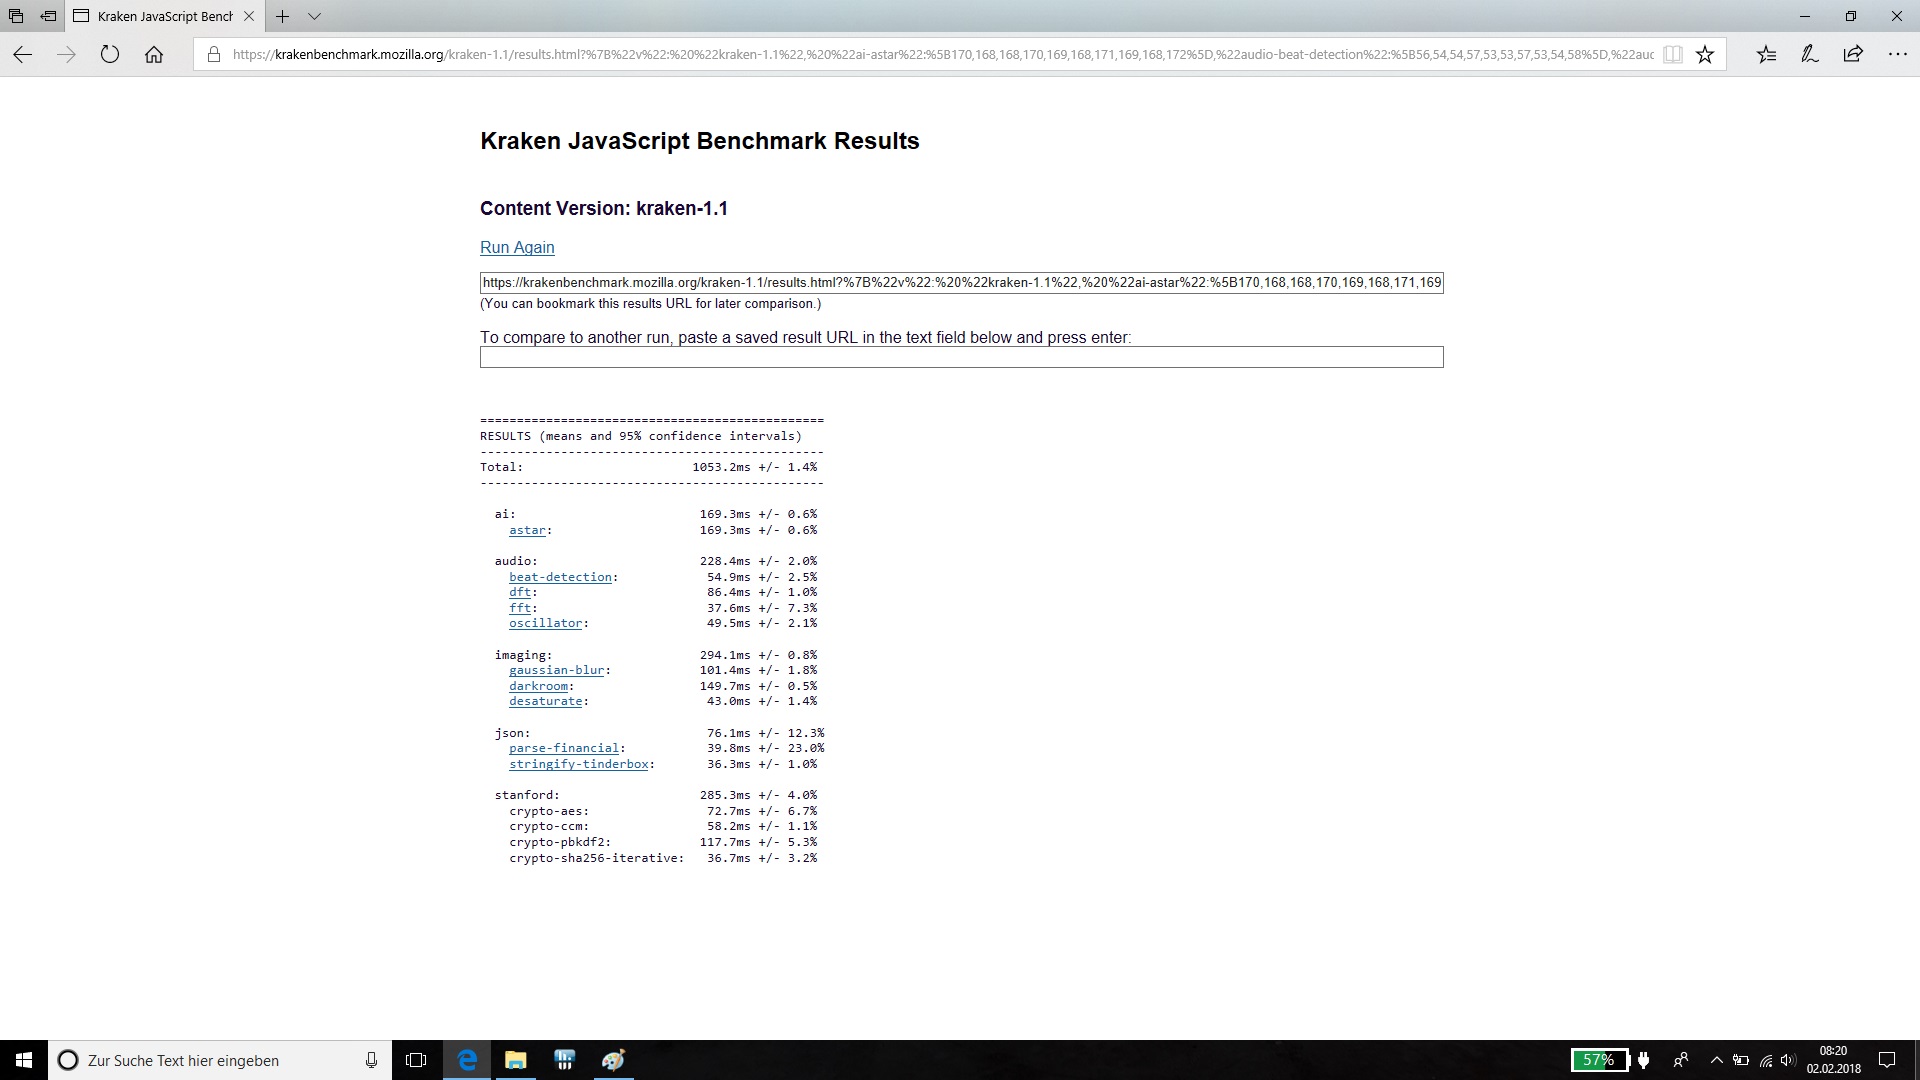
| Mozilla Kraken 1.1 - Total | |
| Lenovo IdeaPad 320-15IKBRN 81BG001KGE | |
| Acer Aspire 7 A715-71G-53TU | |
* ... Meglio usare valori piccoli
| PCMark 8 Home Score Accelerated v2 | 3274 punti | |
| PCMark 8 Creative Score Accelerated v2 | 3357 punti | |
| PCMark 8 Work Score Accelerated v2 | 4760 punti | |
| PCMark 10 Score | 3007 punti | |
Aiuto | ||
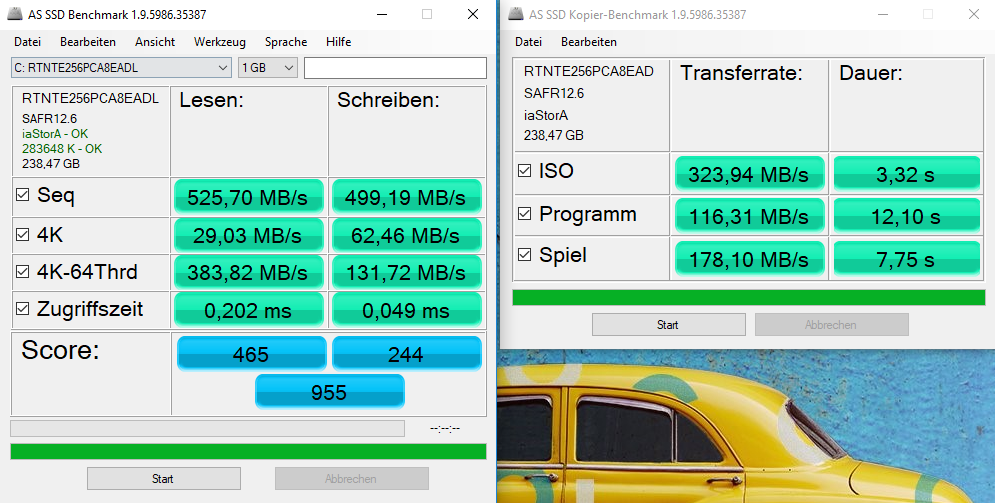
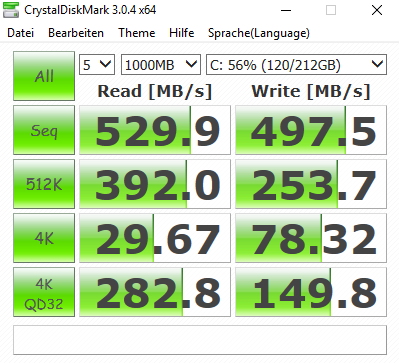
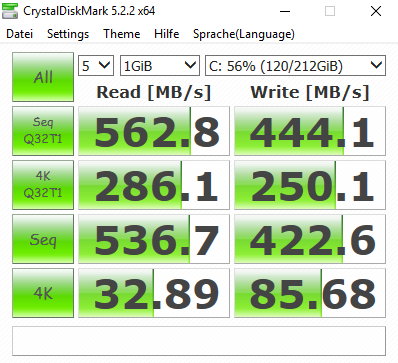
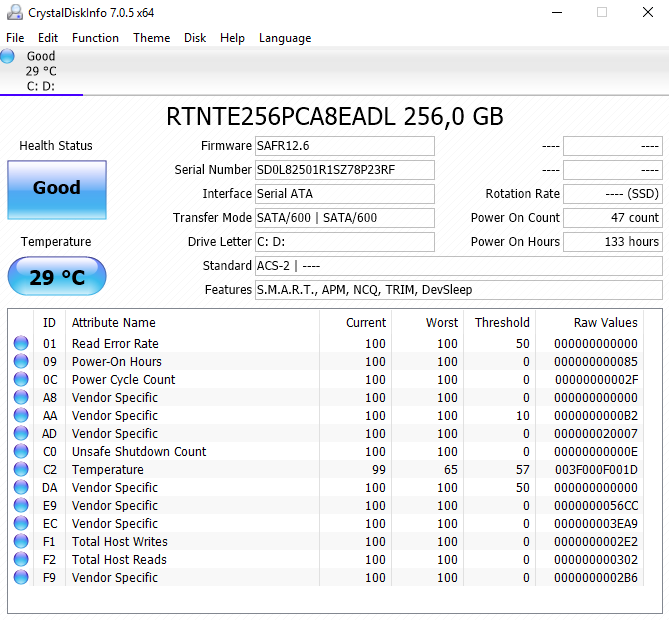
| Lenovo IdeaPad 320-15IKBRN 81BG001KGE Ramaxel RTNTE256PCA8EADL | Lenovo IdeaPad 320-15IKB 80XL01NEGE SK Hynix HFS256G3BTND | Asus ZenBook UX530UX-FY070T SK Hynix HFS256G39TND-N210A | Asus VivoBook 15 X510UQ-BQ534T | Acer Swift 3 SF315-41-R4W1 Intel SSD 600p SSDPEKKW256G7 | HP Pavilion 15-cc107ng SanDisk SD8SN8U256G1006 | Acer Aspire 7 A715-71G-53TU Kingston RBUSNS8180DS3128GH | |
|---|---|---|---|---|---|---|---|
| CrystalDiskMark 3.0 | 3% | -41% | -86% | 43% | -5% | -15% | |
| Read Seq (MB/s) | 530 | 466.4 -12% | 282.2 -47% | 139.2 -74% | 1130 113% | 475.4 -10% | 456 -14% |
| Write Seq (MB/s) | 497.5 | 259.3 -48% | 184.5 -63% | 126 -75% | 601 21% | 453.5 -9% | 245 -51% |
| Read 512 (MB/s) | 392 | 314.5 -20% | 233.5 -40% | 42.35 -89% | 837 114% | 345.2 -12% | 328.4 -16% |
| Write 512 (MB/s) | 253.7 | 259.4 2% | 140.1 -45% | 111.2 -56% | 606 139% | 299.1 18% | 146.3 -42% |
| Read 4k (MB/s) | 29.67 | 31.47 6% | 24.42 -18% | 0.207 -99% | 20.46 -31% | 27.8 -6% | 31.72 7% |
| Write 4k (MB/s) | 78.3 | 78.3 0% | 48.98 -37% | 4.059 -95% | 81.7 4% | 54.2 -31% | 69.3 -11% |
| Read 4k QD32 (MB/s) | 282.8 | 346.1 22% | 170 -40% | 0.738 -100% | 235.5 -17% | 250.9 -11% | 263.7 -7% |
| Write 4k QD32 (MB/s) | 149.8 | 260.4 74% | 98.5 -34% | 4.468 -97% | 155 3% | 181.8 21% | 165.7 11% |

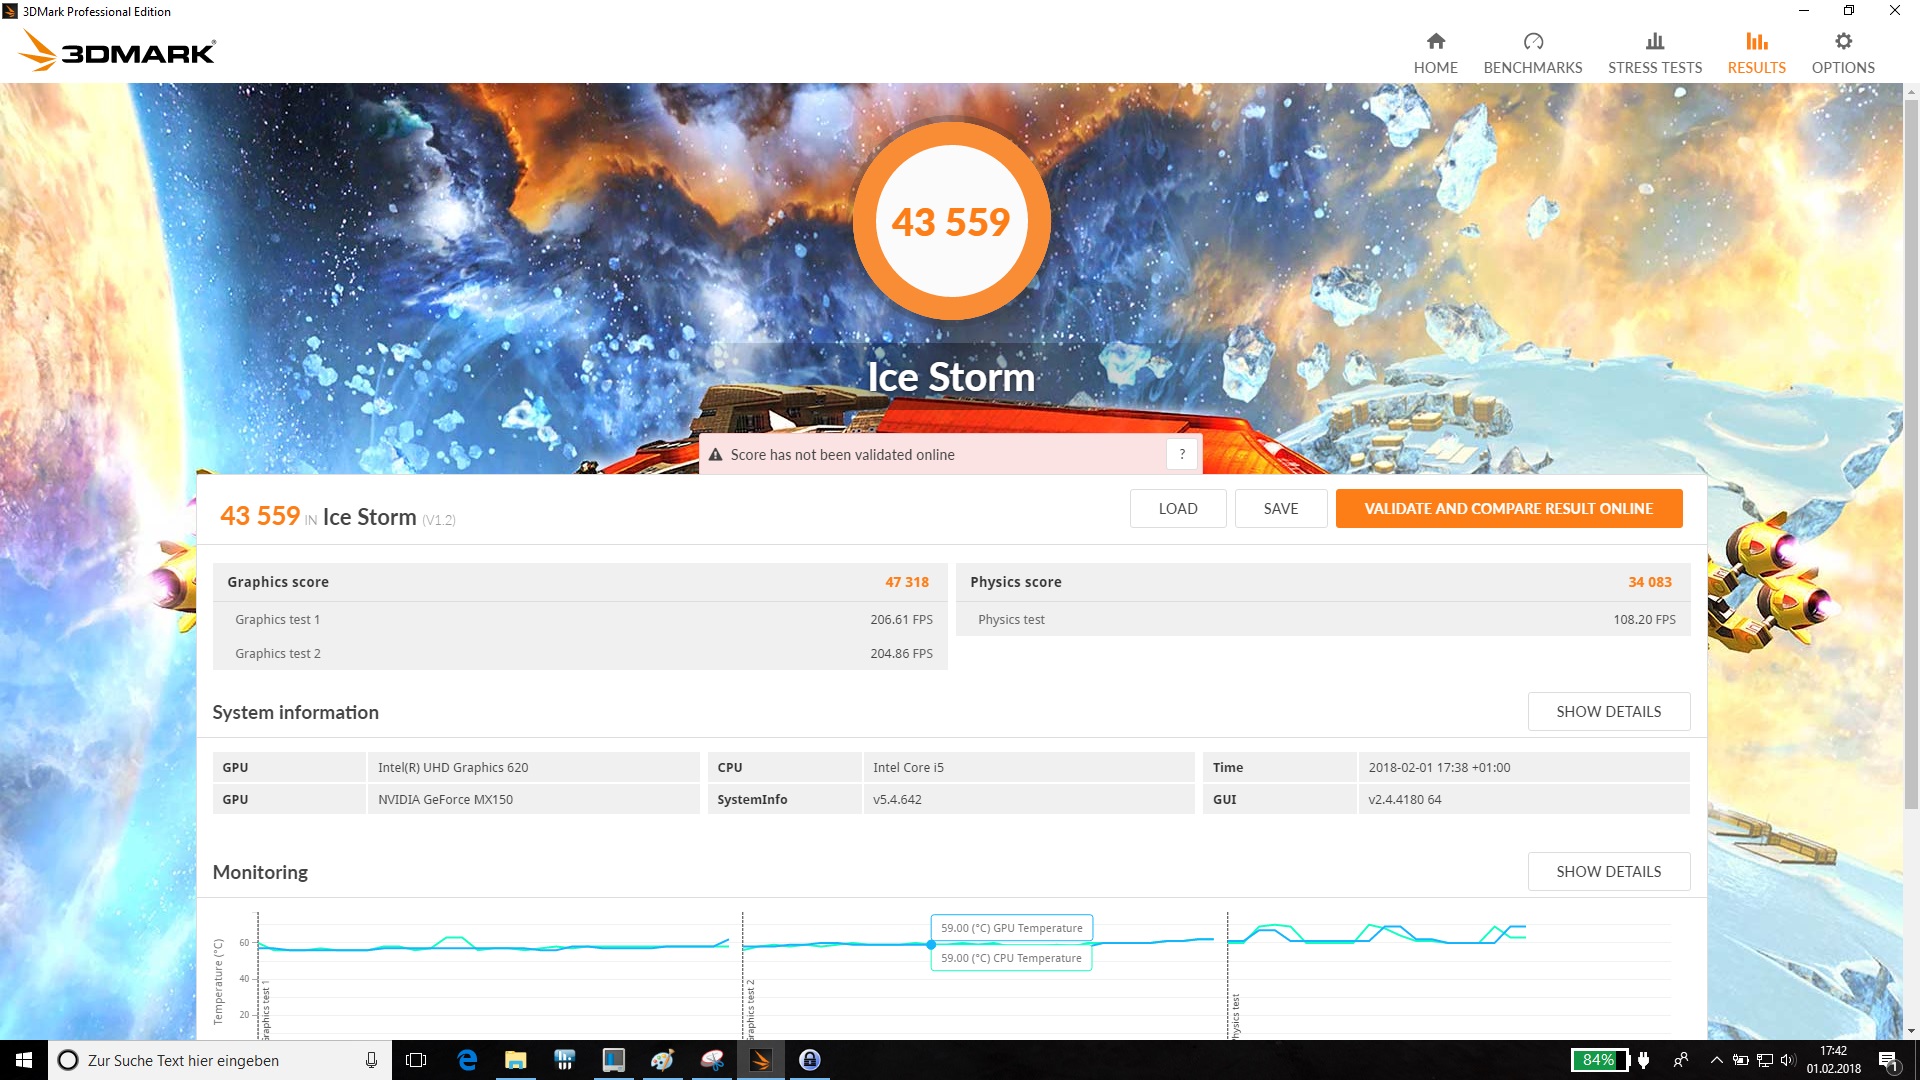
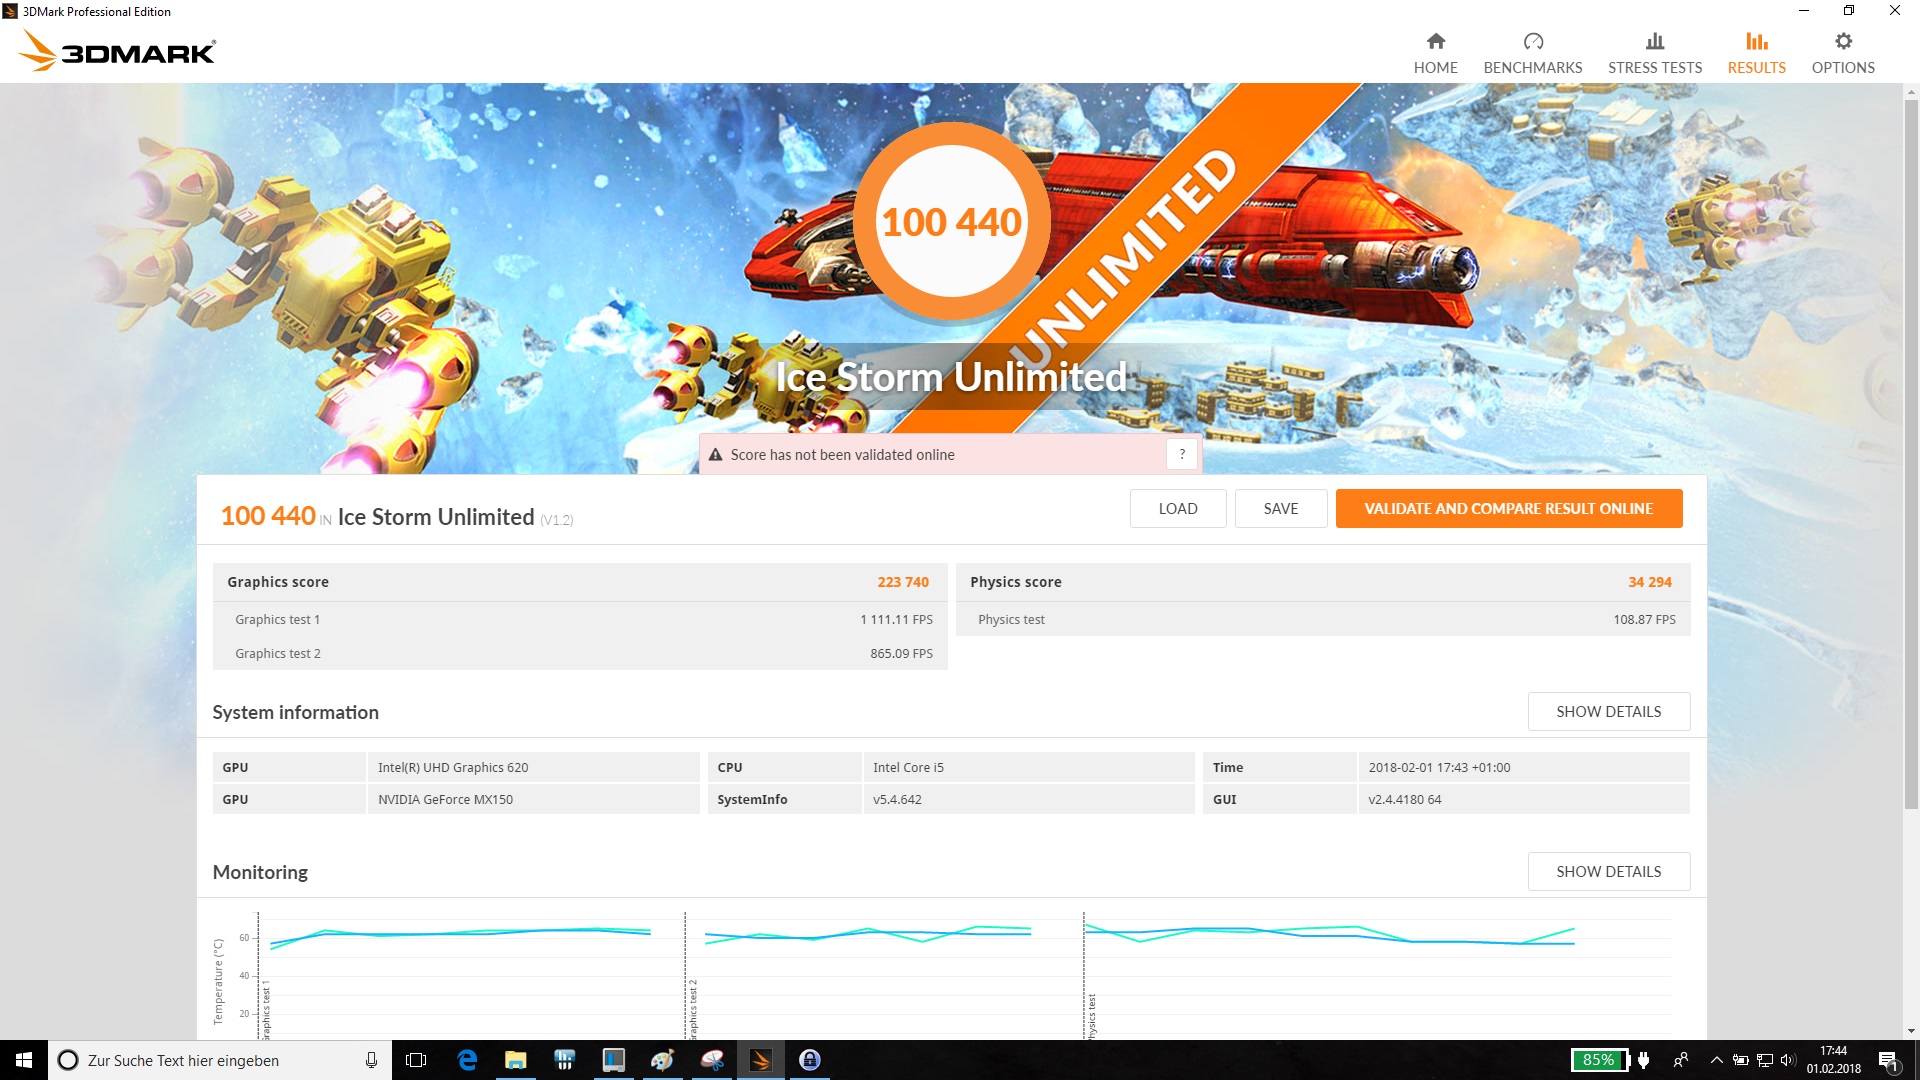
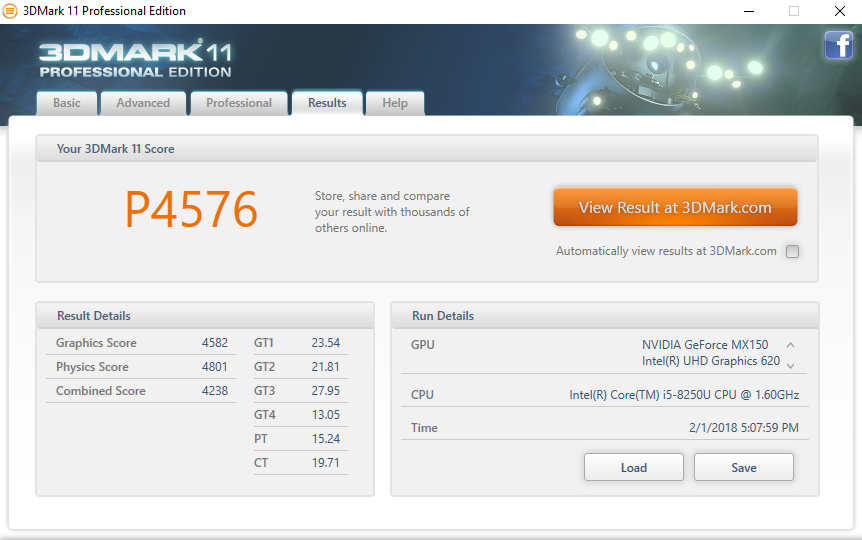
| 3DMark 11 Performance | 4576 punti | |
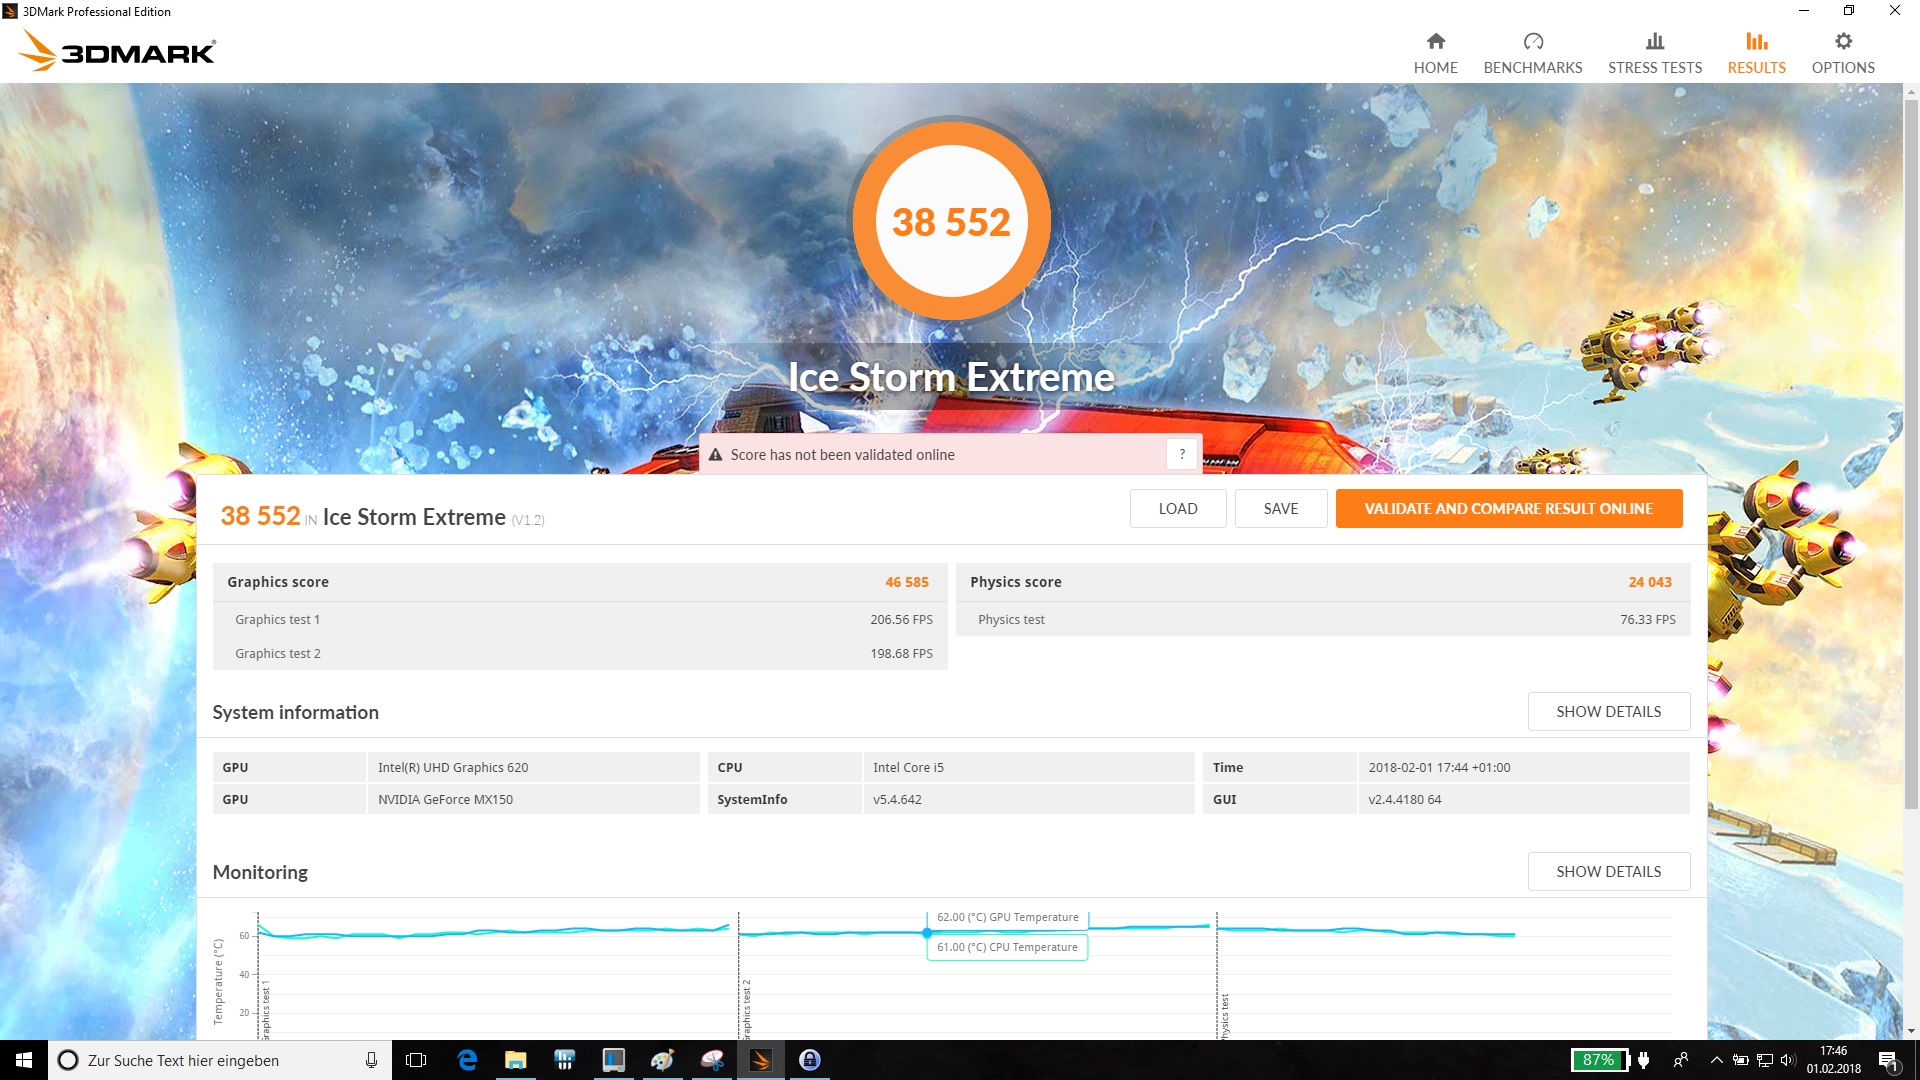
| 3DMark Ice Storm Standard Score | 43559 punti | |
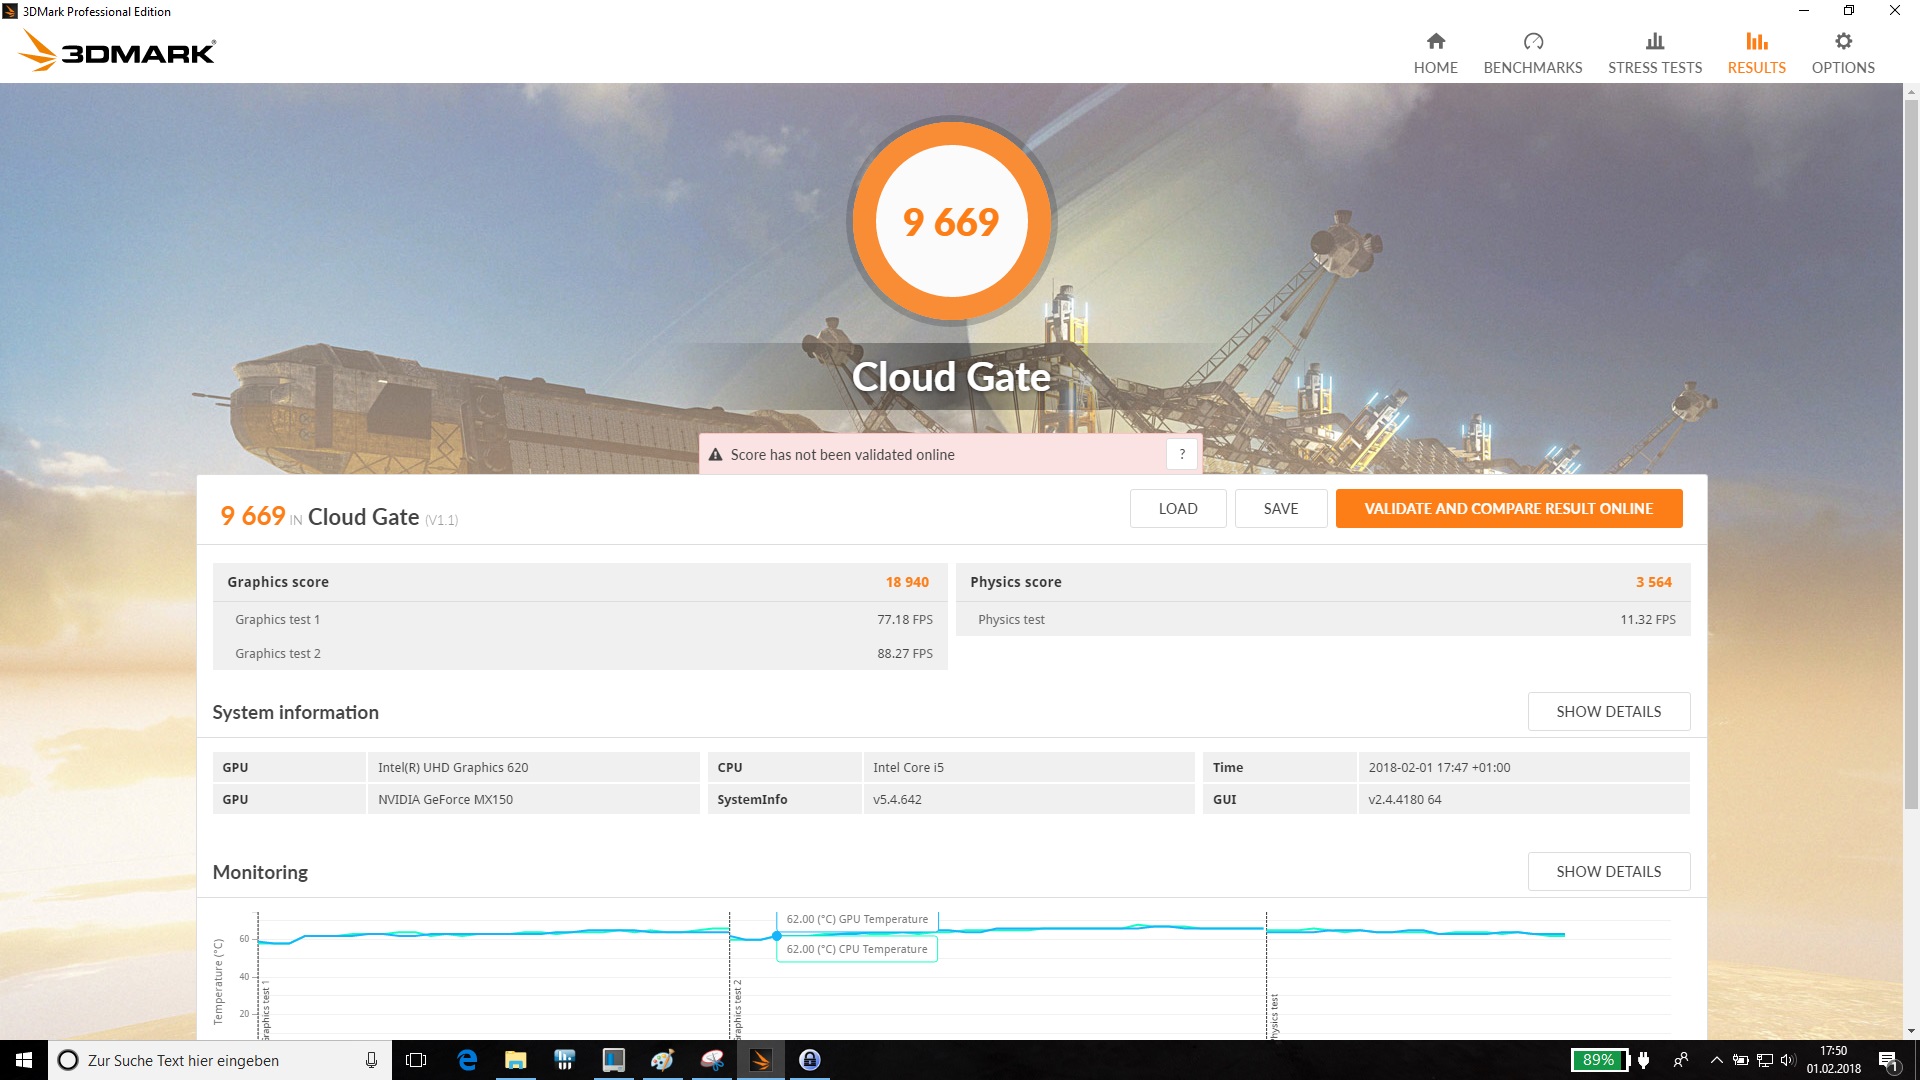
| 3DMark Cloud Gate Standard Score | 9669 punti | |
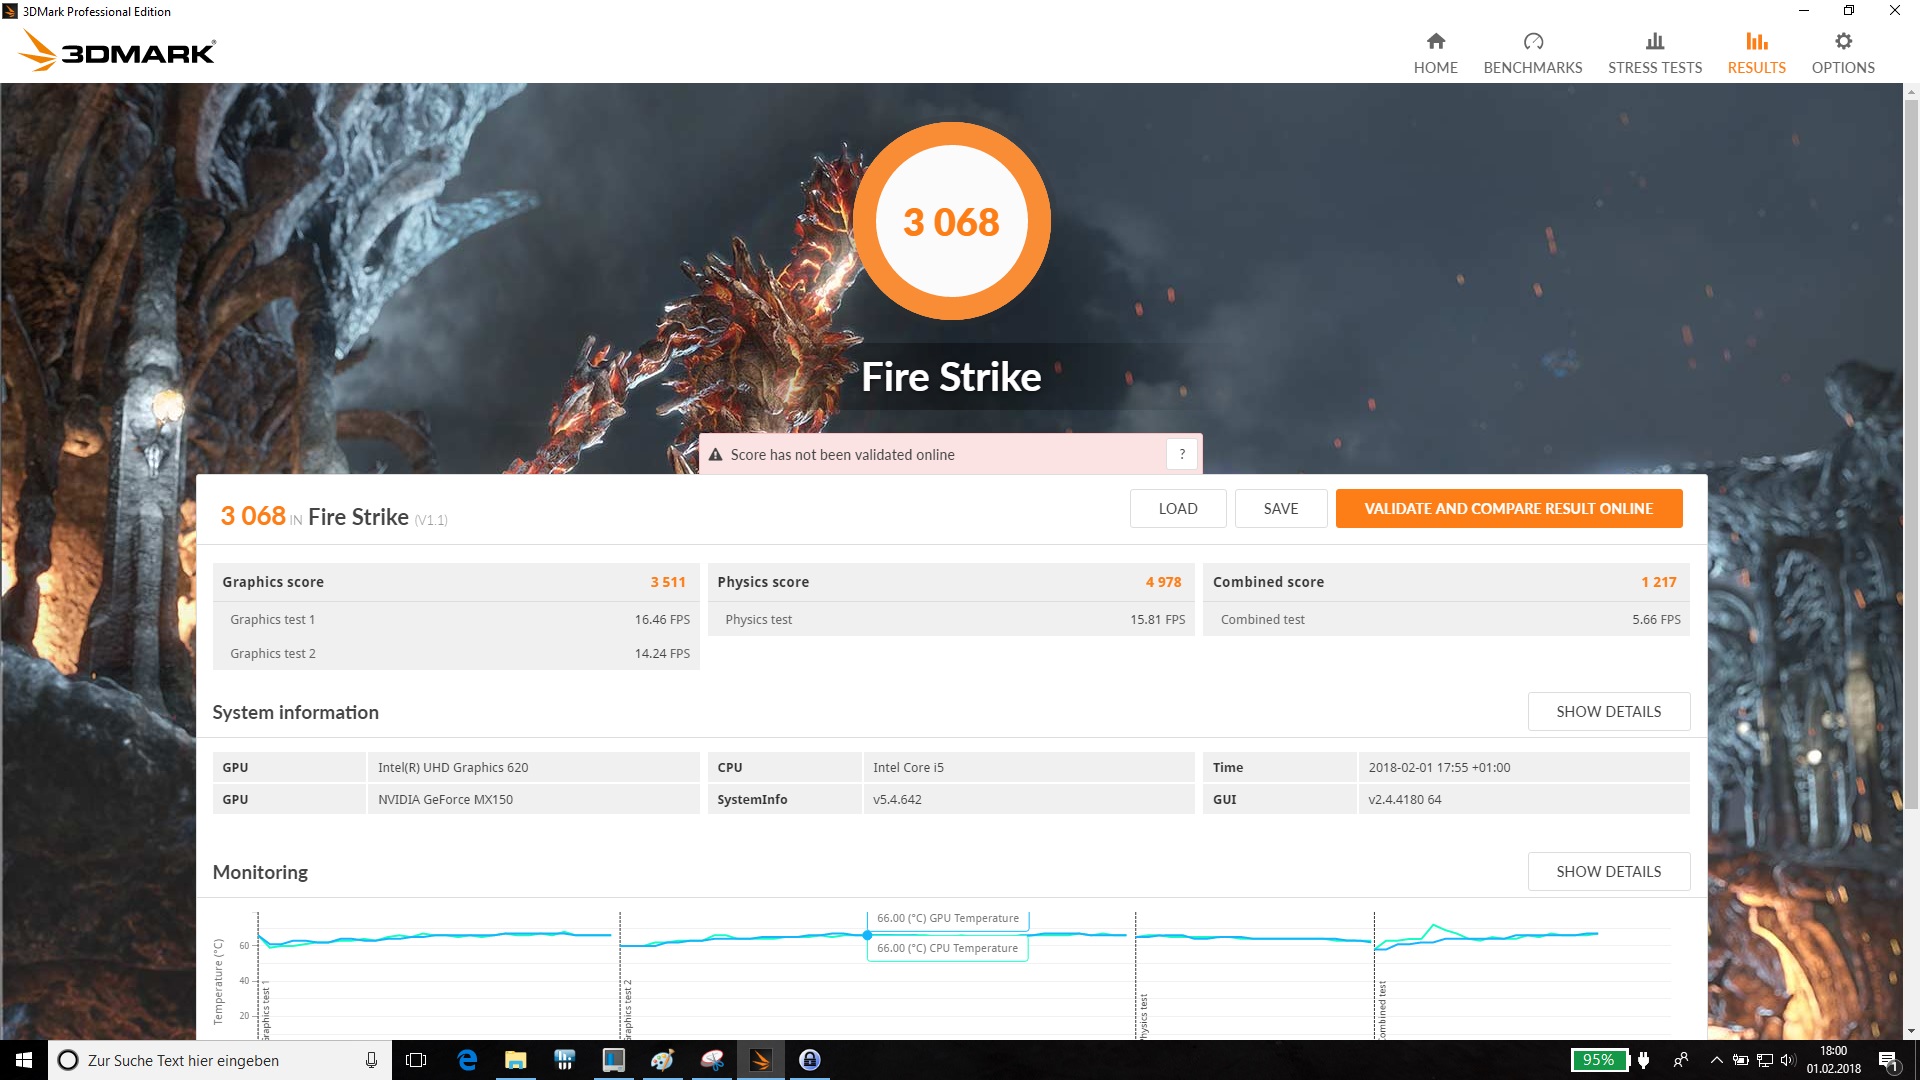
| 3DMark Fire Strike Score | 3068 punti | |
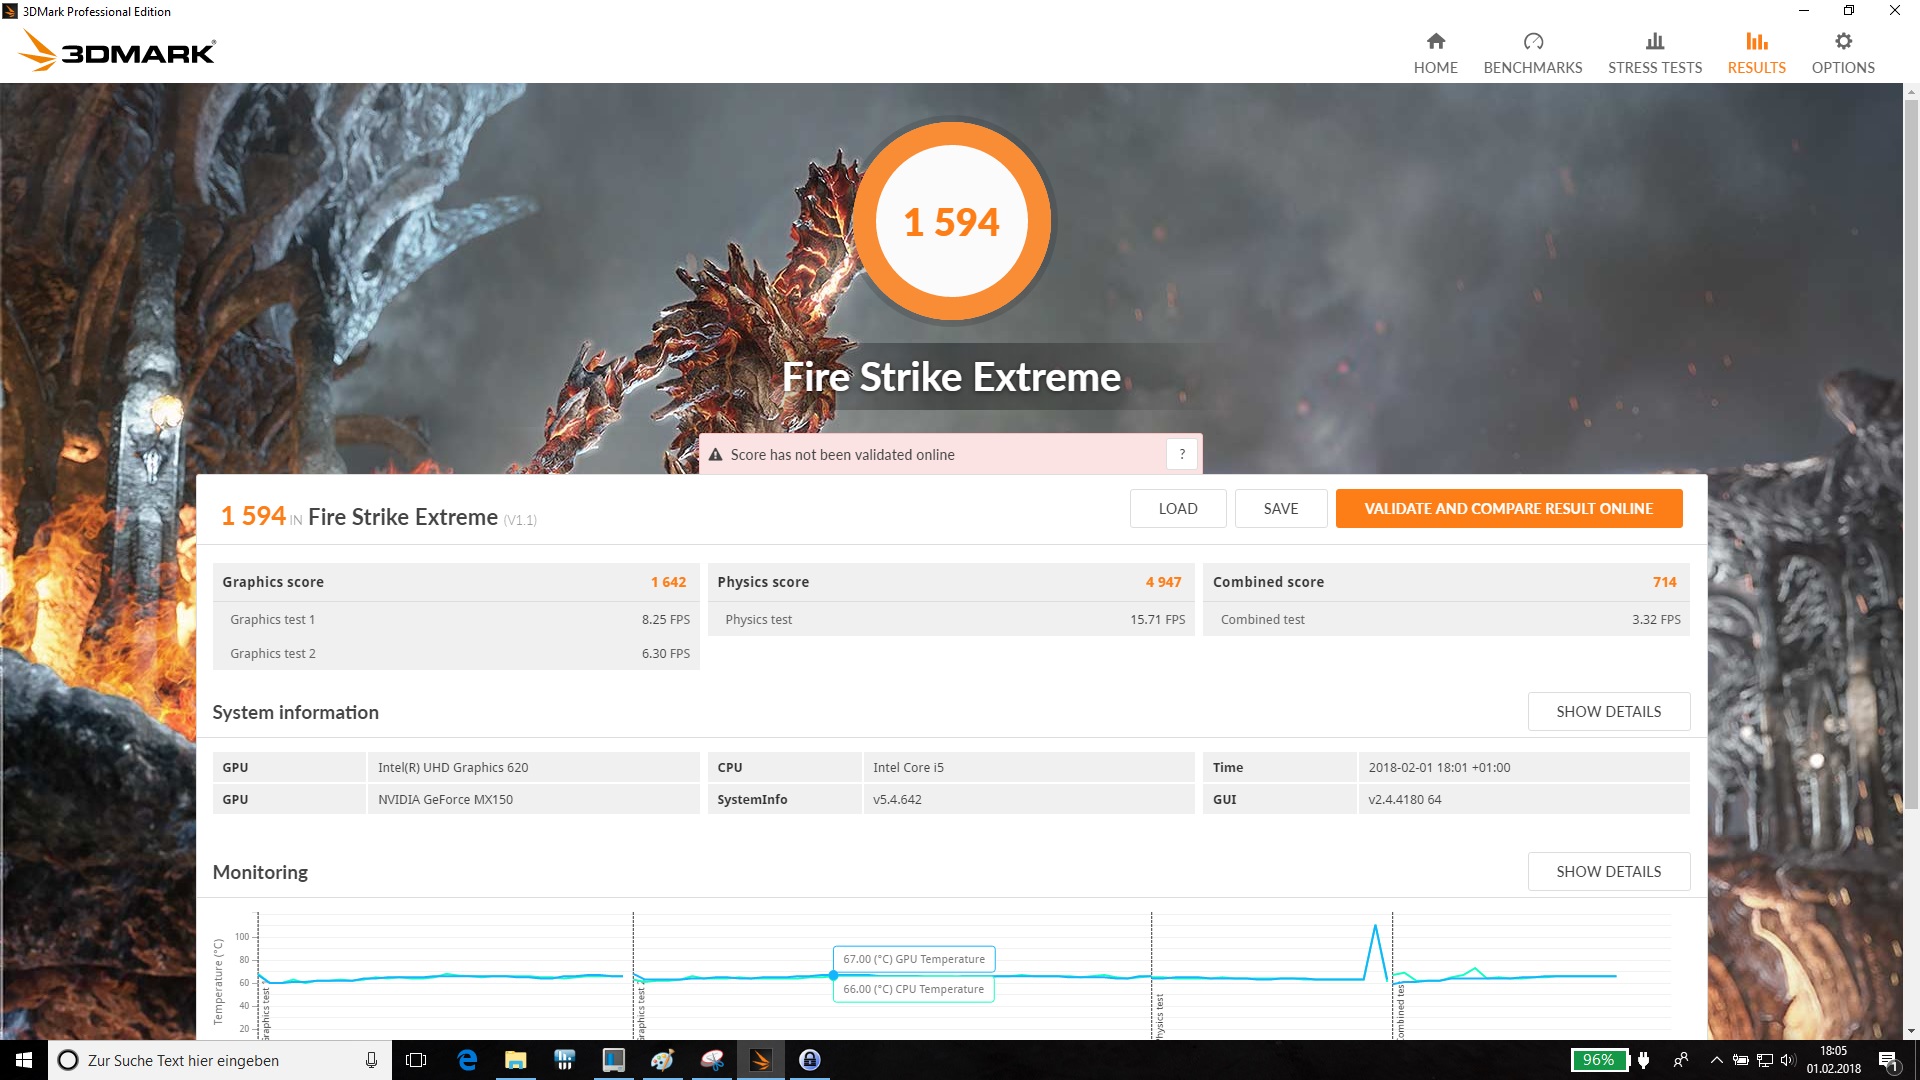
| 3DMark Fire Strike Extreme Score | 1594 punti | |
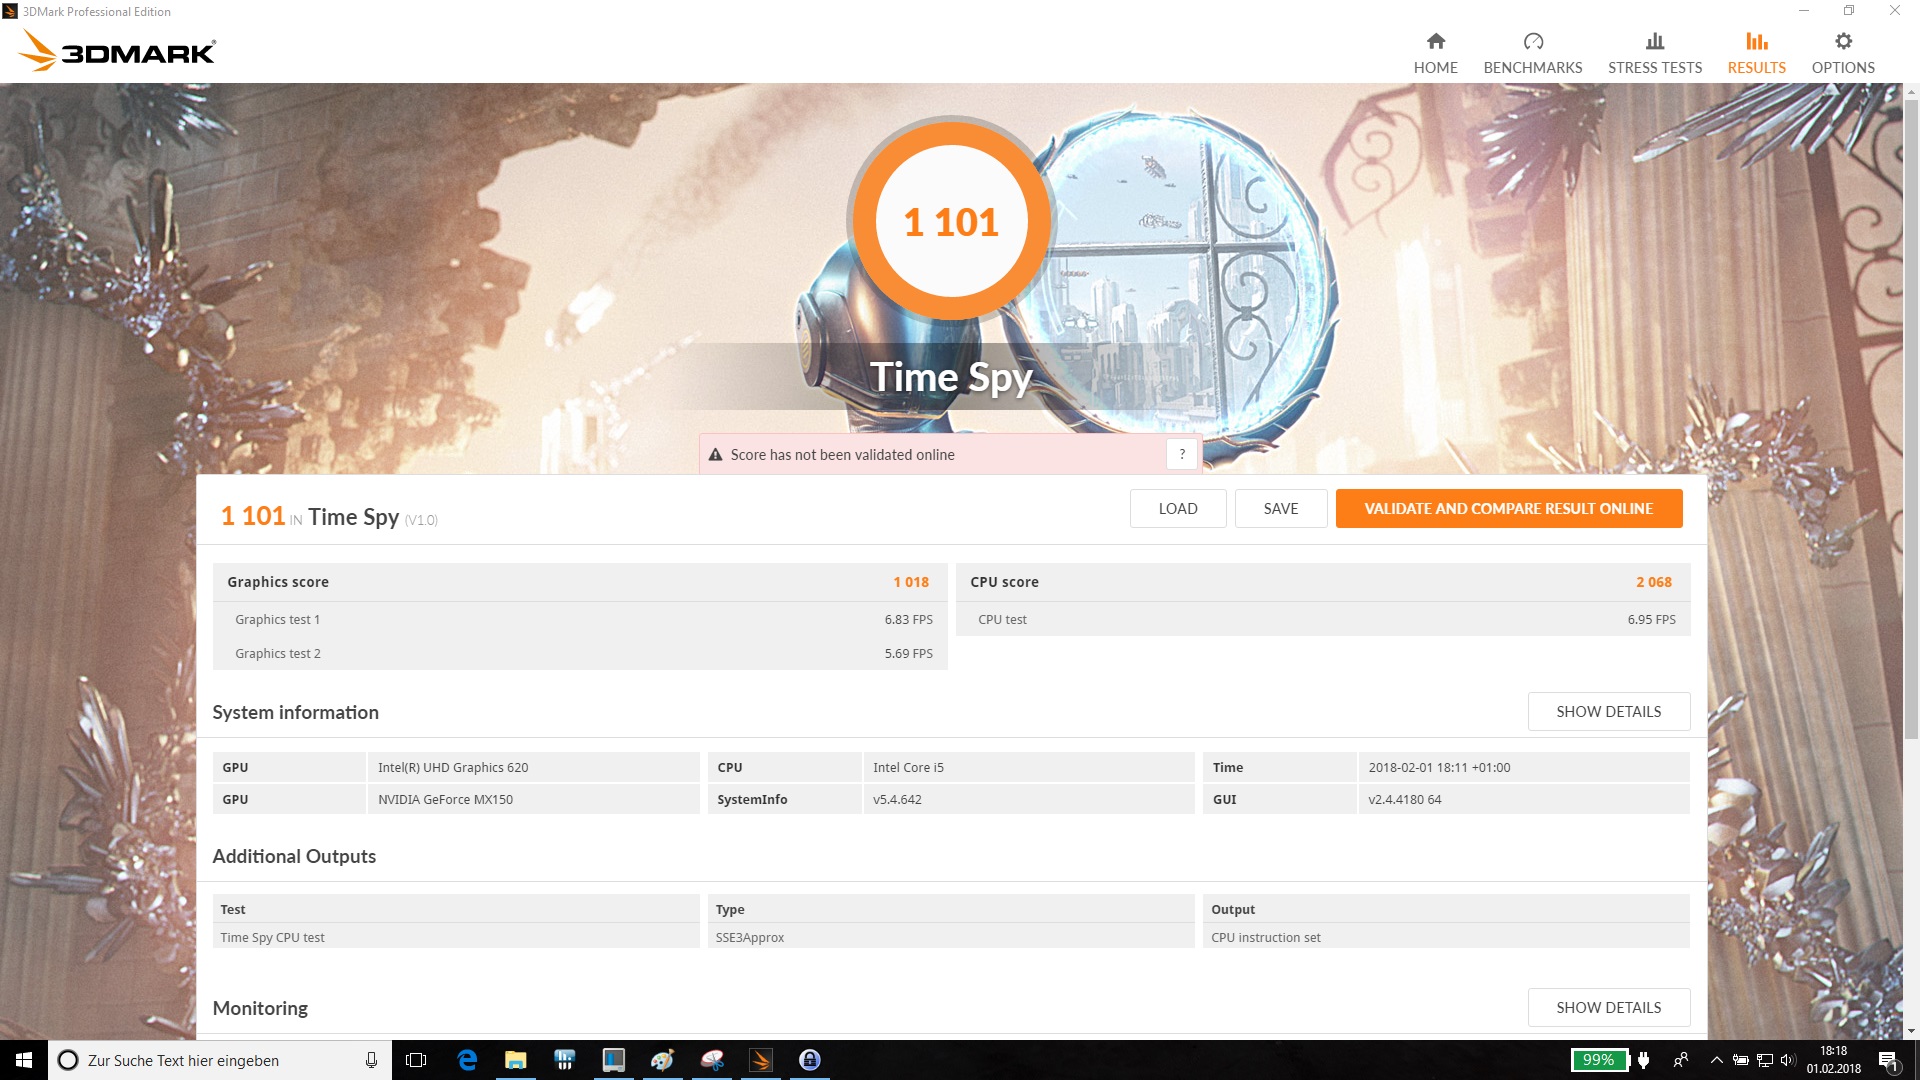
| 3DMark Time Spy Score | 1101 punti | |
Aiuto | ||
| basso | medio | alto | ultra | |
|---|---|---|---|---|
| BioShock Infinite (2013) | 149.7 | 97 | 81.8 | 32.5 |
| The Witcher 3 (2015) | 62.1 | 36.2 | 16.8 | 11.8 |
| Rise of the Tomb Raider (2016) | 67 | 38.3 | 21.8 | 17.5 |
Rumorosità
| Idle |
| 29.9 / 29.9 / 32.2 dB(A) |
| Sotto carico |
| 34.6 / 40.2 dB(A) |
 | ||
30 dB silenzioso 40 dB(A) udibile 50 dB(A) rumoroso |
||
min: | ||
| Lenovo IdeaPad 320-15IKBRN 81BG001KGE GeForce MX150, i5-8250U, Ramaxel RTNTE256PCA8EADL | Lenovo IdeaPad 320-15IKB 80XL01NEGE GeForce 940MX, i5-7200U, SK Hynix HFS256G3BTND | Asus ZenBook UX530UX-FY070T GeForce GTX 950M, i7-7500U, SK Hynix HFS256G39TND-N210A | Asus VivoBook 15 X510UQ-BQ534T GeForce 940MX, i5-8250U | Acer Swift 3 SF315-41-R4W1 Vega 8, R5 2500U, Intel SSD 600p SSDPEKKW256G7 | HP Pavilion 15-cc107ng GeForce 940MX, i5-8250U, SanDisk SD8SN8U256G1006 | Acer Aspire 7 A715-71G-53TU GeForce GTX 1050 Mobile, i5-7300HQ, Kingston RBUSNS8180DS3128GH | |
|---|---|---|---|---|---|---|---|
| Noise | 2% | 1% | -9% | -0% | -1% | -1% | |
| off /ambiente * (dB) | 29.9 | 30.5 -2% | 30.2 -1% | 31 -4% | 31.8 -6% | 30.5 -2% | 30.4 -2% |
| Idle Minimum * (dB) | 29.9 | 30.5 -2% | 30.2 -1% | 32.3 -8% | 31.8 -6% | 30.9 -3% | 30.4 -2% |
| Idle Average * (dB) | 29.9 | 30.5 -2% | 30.2 -1% | 32.3 -8% | 32.1 -7% | 30.9 -3% | 30.8 -3% |
| Idle Maximum * (dB) | 32.2 | 30.5 5% | 31.6 2% | 32.3 -0% | 32.1 -0% | 31 4% | 30.8 4% |
| Load Average * (dB) | 34.6 | 35.1 -1% | 36 -4% | 43.2 -25% | 33 5% | 37.2 -8% | 33.6 3% |
| Witcher 3 ultra * (dB) | 40.2 | ||||||
| Load Maximum * (dB) | 40.2 | 35.4 12% | 36.6 9% | 43.2 -7% | 34.8 13% | 36.8 8% | 43.4 -8% |
* ... Meglio usare valori piccoli
(±) La temperatura massima sul lato superiore è di 43 °C / 109 F, rispetto alla media di 36.8 °C / 98 F, che varia da 21 a 71 °C per questa classe Multimedia.
(-) Il lato inferiore si riscalda fino ad un massimo di 49.7 °C / 121 F, rispetto alla media di 39.1 °C / 102 F
(+) In idle, la temperatura media del lato superiore è di 23 °C / 73 F, rispetto alla media deld ispositivo di 31.3 °C / 88 F.
(±) Riproducendo The Witcher 3, la temperatura media per il lato superiore e' di 33 °C / 91 F, rispetto alla media del dispositivo di 31.3 °C / 88 F.
(+) I poggiapolsi e il touchpad raggiungono la temperatura massima della pelle (34.5 °C / 94.1 F) e quindi non sono caldi.
(-) La temperatura media della zona del palmo della mano di dispositivi simili e'stata di 28.7 °C / 83.7 F (-5.8 °C / -10.4 F).
| Lenovo IdeaPad 320-15IKBRN 81BG001KGE GeForce MX150, i5-8250U, Ramaxel RTNTE256PCA8EADL | Lenovo IdeaPad 320-15IKB 80XL01NEGE GeForce 940MX, i5-7200U, SK Hynix HFS256G3BTND | Asus ZenBook UX530UX-FY070T GeForce GTX 950M, i7-7500U, SK Hynix HFS256G39TND-N210A | Asus VivoBook 15 X510UQ-BQ534T GeForce 940MX, i5-8250U | Acer Swift 3 SF315-41-R4W1 Vega 8, R5 2500U, Intel SSD 600p SSDPEKKW256G7 | HP Pavilion 15-cc107ng GeForce 940MX, i5-8250U, SanDisk SD8SN8U256G1006 | Acer Aspire 7 A715-71G-53TU GeForce GTX 1050 Mobile, i5-7300HQ, Kingston RBUSNS8180DS3128GH | |
|---|---|---|---|---|---|---|---|
| Heat | -5% | -3% | -9% | -8% | 4% | -8% | |
| Maximum Upper Side * (°C) | 43 | 43.8 -2% | 48.2 -12% | 40 7% | 41 5% | 42.3 2% | 41.6 3% |
| Maximum Bottom * (°C) | 49.7 | 43.7 12% | 45.8 8% | 44 11% | 41.1 17% | 40 20% | 42.5 14% |
| Idle Upper Side * (°C) | 24 | 26.5 -10% | 25 -4% | 31 -29% | 29.9 -25% | 25.5 -6% | 29.7 -24% |
| Idle Bottom * (°C) | 23.7 | 28.4 -20% | 24.9 -5% | 29.4 -24% | 30.9 -30% | 23.6 -0% | 29.4 -24% |
* ... Meglio usare valori piccoli
Lenovo IdeaPad 320-15IKBRN 81BG001KGE analisi audio
(±) | potenza degli altiparlanti media ma buona (77.1 dB)
Bassi 100 - 315 Hz
(-) | quasi nessun basso - in media 18.8% inferiori alla media
(-) | bassi non lineari (15.2% delta rispetto alla precedente frequenza)
Medi 400 - 2000 Hz
(+) | medi bilanciati - solo only 4.3% rispetto alla media
(±) | linearità dei medi adeguata (7.2% delta rispetto alla precedente frequenza)
Alti 2 - 16 kHz
(±) | alti elevati - circa 7.1% superiori alla media
(+) | alti lineari (6% delta rispetto alla precedente frequenza)
Nel complesso 100 - 16.000 Hz
(±) | la linearità complessiva del suono è media (24% di differenza rispetto alla media
Rispetto alla stessa classe
» 85% di tutti i dispositivi testati in questa classe è stato migliore, 6% simile, 10% peggiore
» Il migliore ha avuto un delta di 5%, medio di 17%, peggiore di 45%
Rispetto a tutti i dispositivi testati
» 72% di tutti i dispositivi testati in questa classe è stato migliore, 6% similare, 22% peggiore
» Il migliore ha avuto un delta di 4%, medio di 24%, peggiore di 134%
Asus ZenBook UX530UX-FY070T analisi audio
(-) | altoparlanti non molto potenti (67.1 dB)
Bassi 100 - 315 Hz
(-) | quasi nessun basso - in media 15.8% inferiori alla media
(±) | la linearità dei bassi è media (7.6% delta rispetto alla precedente frequenza)
Medi 400 - 2000 Hz
(+) | medi bilanciati - solo only 3.9% rispetto alla media
(+) | medi lineari (5.4% delta rispetto alla precedente frequenza)
Alti 2 - 16 kHz
(±) | alti elevati - circa 5.9% superiori alla media
(±) | la linearità degli alti è media (9.7% delta rispetto alla precedente frequenza)
Nel complesso 100 - 16.000 Hz
(±) | la linearità complessiva del suono è media (23.8% di differenza rispetto alla media
Rispetto alla stessa classe
» 84% di tutti i dispositivi testati in questa classe è stato migliore, 6% simile, 10% peggiore
» Il migliore ha avuto un delta di 5%, medio di 17%, peggiore di 45%
Rispetto a tutti i dispositivi testati
» 71% di tutti i dispositivi testati in questa classe è stato migliore, 6% similare, 22% peggiore
» Il migliore ha avuto un delta di 4%, medio di 24%, peggiore di 134%
| Off / Standby | |
| Idle | |
| Sotto carico |
|
Leggenda:
min: | |
| Lenovo IdeaPad 320-15IKBRN 81BG001KGE i5-8250U, GeForce MX150, Ramaxel RTNTE256PCA8EADL, TN LED, 1920x1080, 15.6" | Lenovo IdeaPad 320-15IKB 80XL01NEGE i5-7200U, GeForce 940MX, SK Hynix HFS256G3BTND, TN LED, 1920x1080, 15.6" | Asus ZenBook UX530UX-FY070T i7-7500U, GeForce GTX 950M, SK Hynix HFS256G39TND-N210A, IPS, 1920x1080, 15.6" | Asus VivoBook 15 X510UQ-BQ534T i5-8250U, GeForce 940MX, , , 1920x1080, 15.6" | Acer Swift 3 SF315-41-R4W1 R5 2500U, Vega 8, Intel SSD 600p SSDPEKKW256G7, IPS, 1920x1080, 15.6" | HP Pavilion 15-cc107ng i5-8250U, GeForce 940MX, SanDisk SD8SN8U256G1006, TN LED, 1920x1080, 15.6" | Acer Aspire 7 A715-71G-53TU i5-7300HQ, GeForce GTX 1050 Mobile, Kingston RBUSNS8180DS3128GH, a-Si TFT-LCD, IPS, 1920x1080, 15.6" | |
|---|---|---|---|---|---|---|---|
| Power Consumption | 17% | -7% | -29% | -30% | 5% | -39% | |
| Idle Minimum * (Watt) | 4.03 | 2.9 28% | 3.5 13% | 5.6 -39% | 7.3 -81% | 2.8 31% | 4 1% |
| Idle Average * (Watt) | 6.81 | 5.9 13% | 5.3 22% | 9.2 -35% | 9.7 -42% | 5.8 15% | 6.9 -1% |
| Idle Maximum * (Watt) | 8.34 | 7.3 12% | 9.1 -9% | 9.7 -16% | 13 -56% | 7.5 10% | 9.4 -13% |
| Load Average * (Watt) | 37.3 | 39.5 -6% | 60 -61% | 58 -55% | 40.4 -8% | 54 -45% | 72.6 -95% |
| Witcher 3 ultra * (Watt) | 52 | ||||||
| Load Maximum * (Watt) | 65.5 | 42 36% | 65 1% | 64.2 2% | 42.2 36% | 56 15% | 122 -86% |
* ... Meglio usare valori piccoli

| Lenovo IdeaPad 320-15IKBRN 81BG001KGE i5-8250U, GeForce MX150, 30 Wh | Lenovo IdeaPad 320-15IKB 80XL01NEGE i5-7200U, GeForce 940MX, 30 Wh | Asus ZenBook UX530UX-FY070T i7-7500U, GeForce GTX 950M, 50 Wh | Asus VivoBook 15 X510UQ-BQ534T i5-8250U, GeForce 940MX, 42 Wh | Acer Swift 3 SF315-41-R4W1 R5 2500U, Vega 8, 48 Wh | HP Pavilion 15-cc107ng i5-8250U, GeForce 940MX, 41.7 Wh | Acer Aspire 7 A715-71G-53TU i5-7300HQ, GeForce GTX 1050 Mobile, 48 Wh | |
|---|---|---|---|---|---|---|---|
| Autonomia della batteria | 4% | 16% | -13% | 3% | 47% | 2% | |
| Reader / Idle (h) | 10.5 | 8.8 -16% | 12.2 16% | 9.9 -6% | |||
| H.264 (h) | 5 | 7 40% | 5.1 2% | ||||
| WiFi v1.3 (h) | 4.5 | 4.7 4% | 6.2 38% | 3.9 -13% | 5.2 16% | 6.6 47% | 5.6 24% |
| Load (h) | 1.8 | 1.8 0% | 1.4 -22% | 1.6 -11% |
Pro
Contro
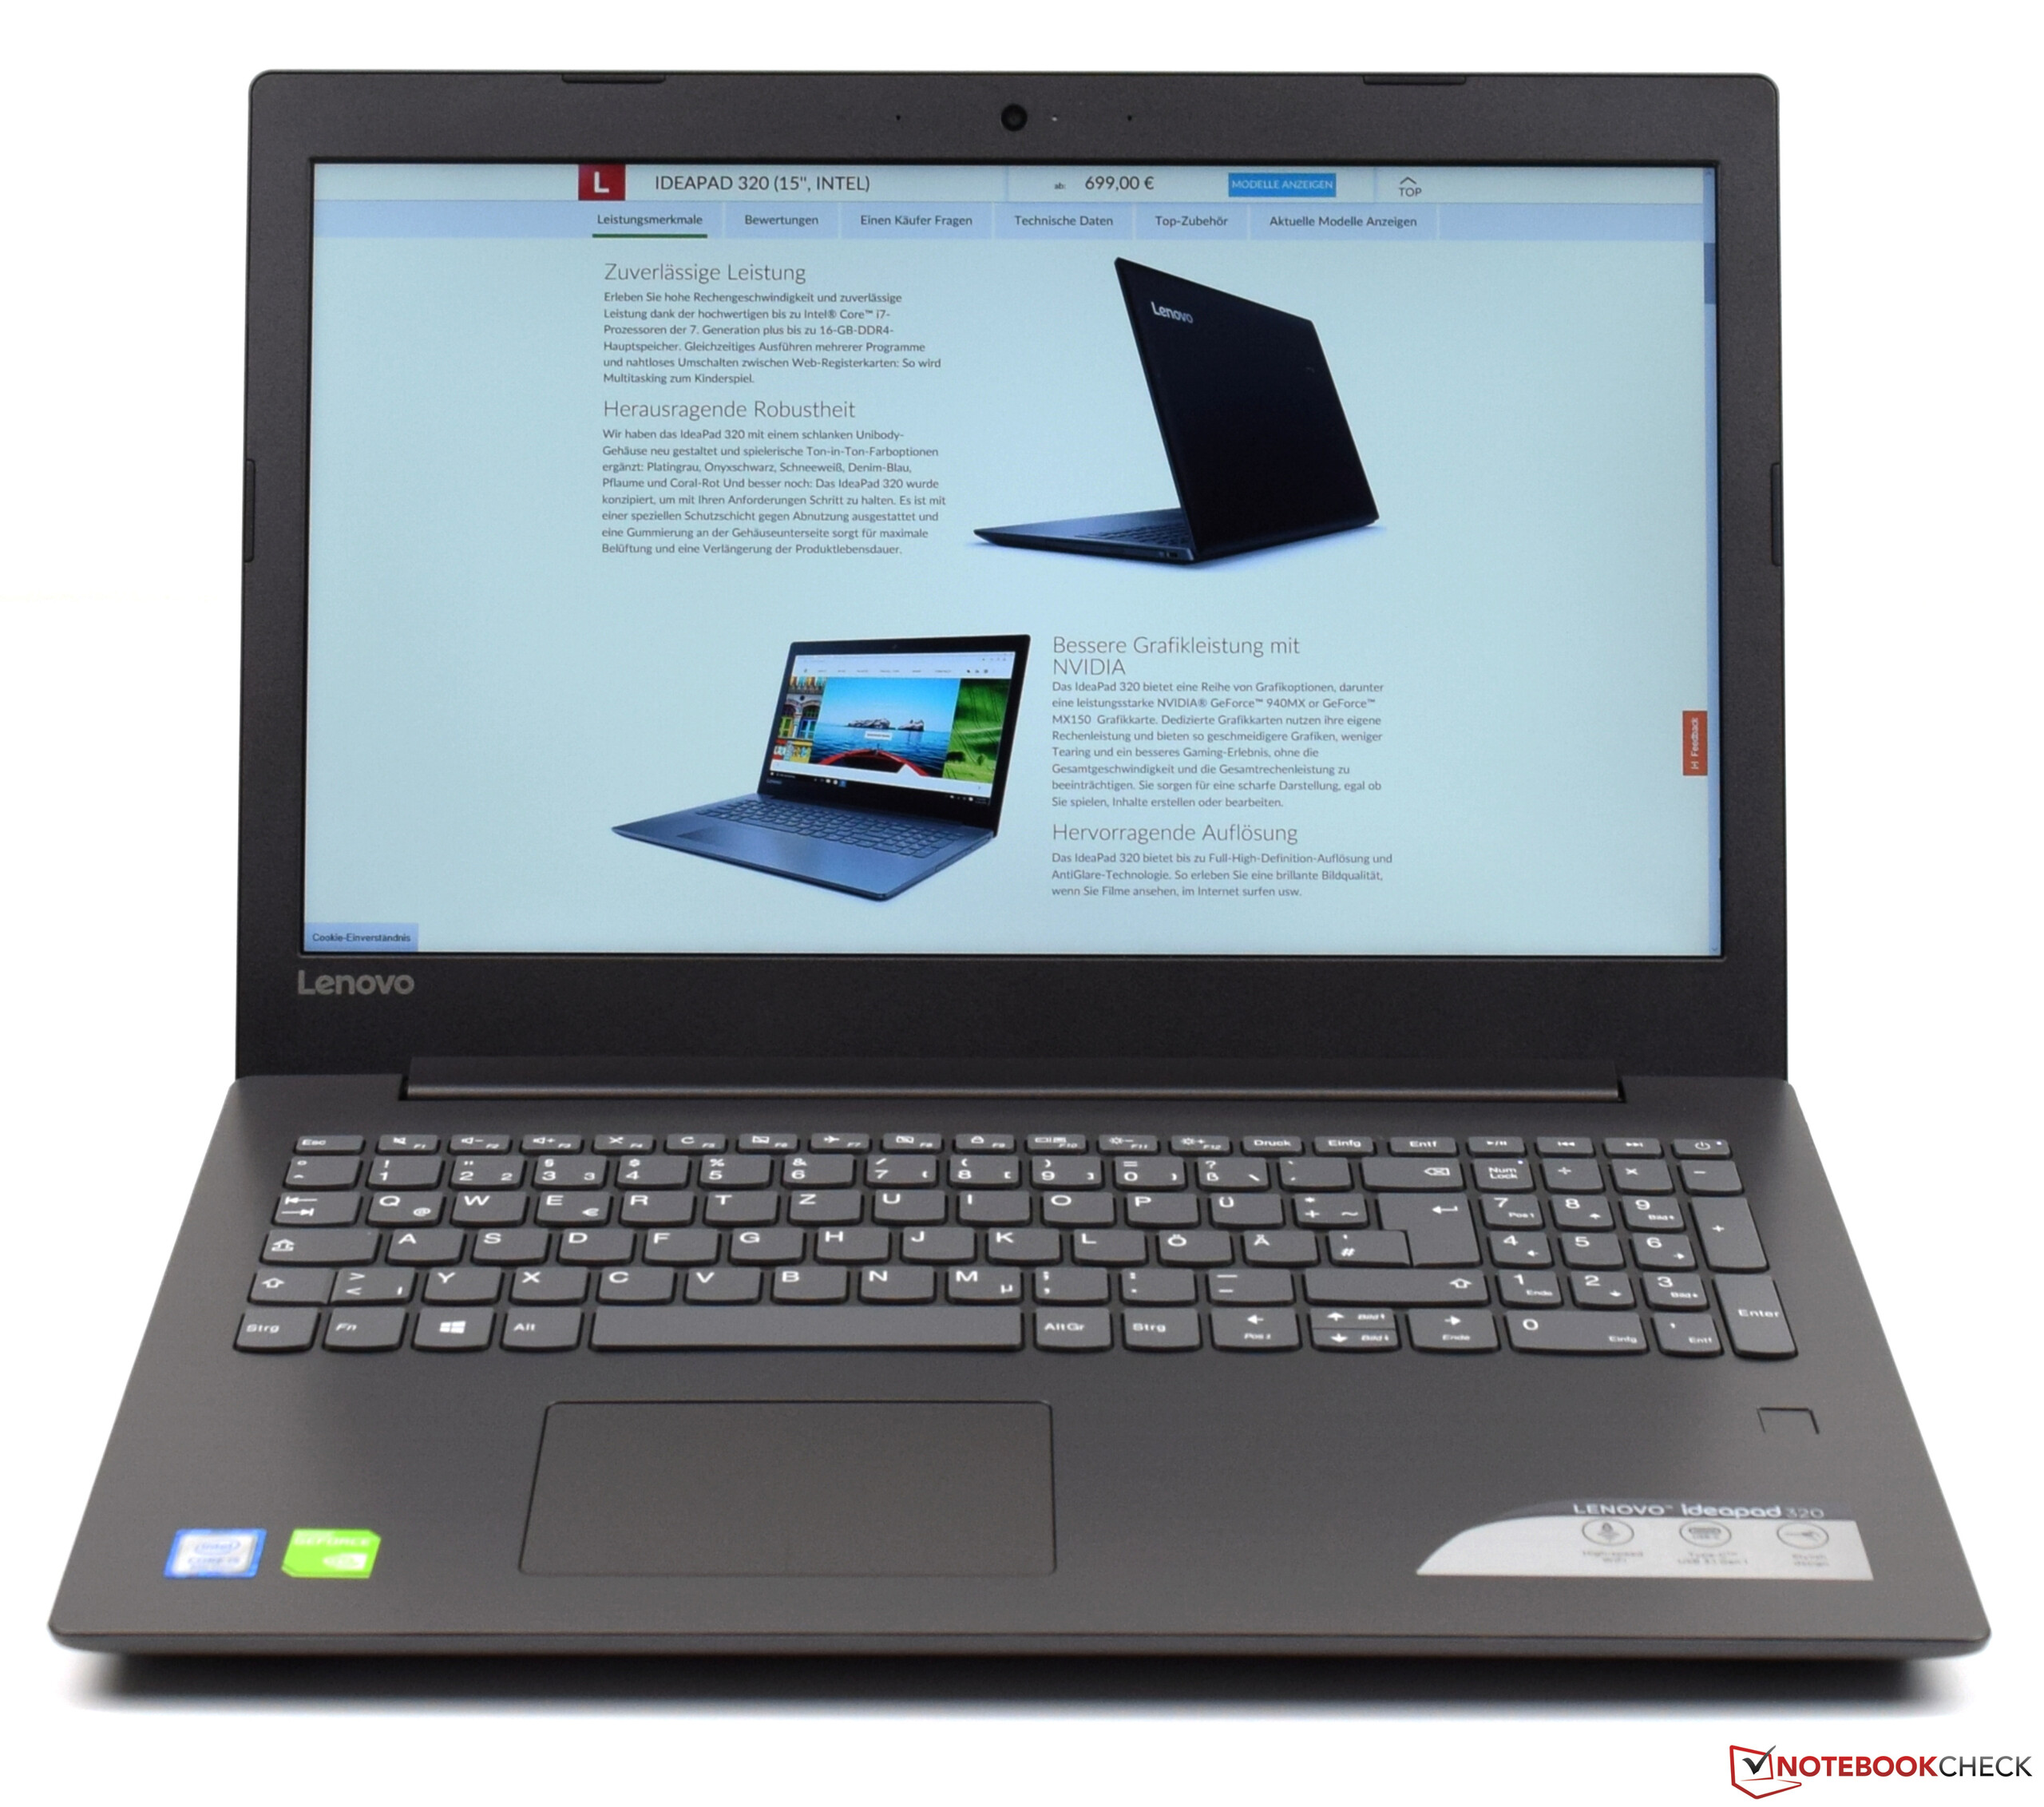
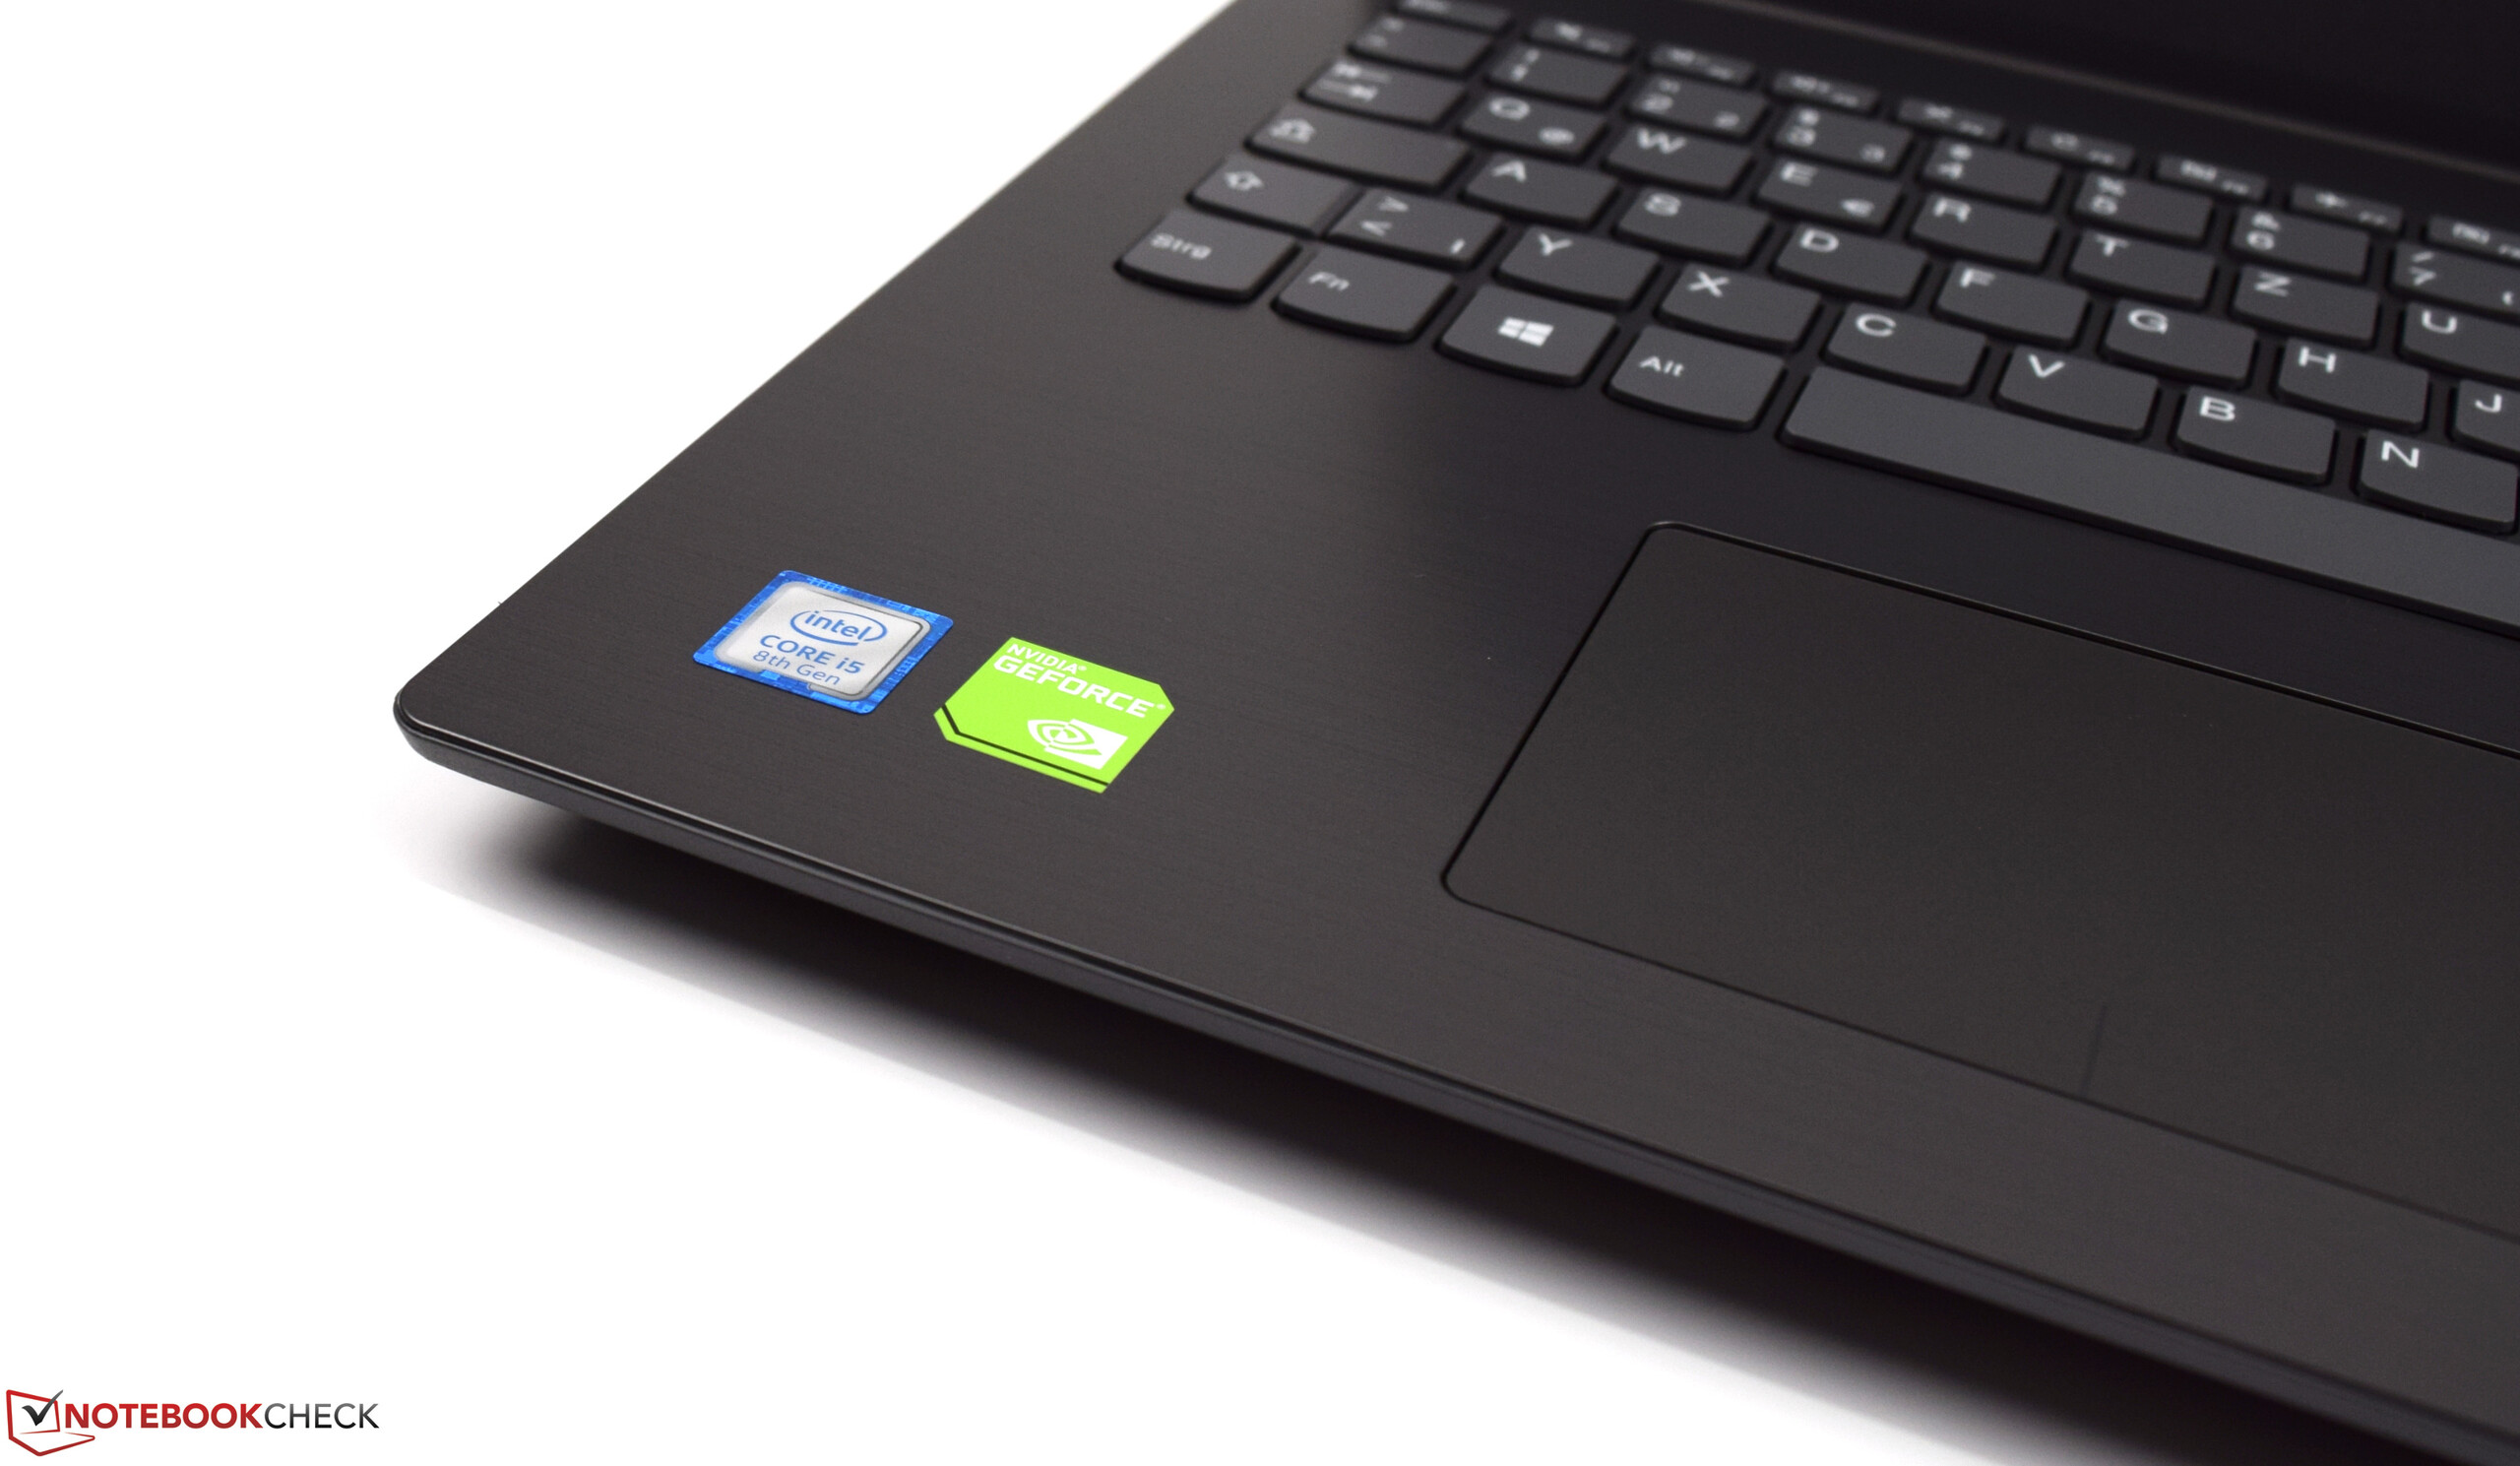
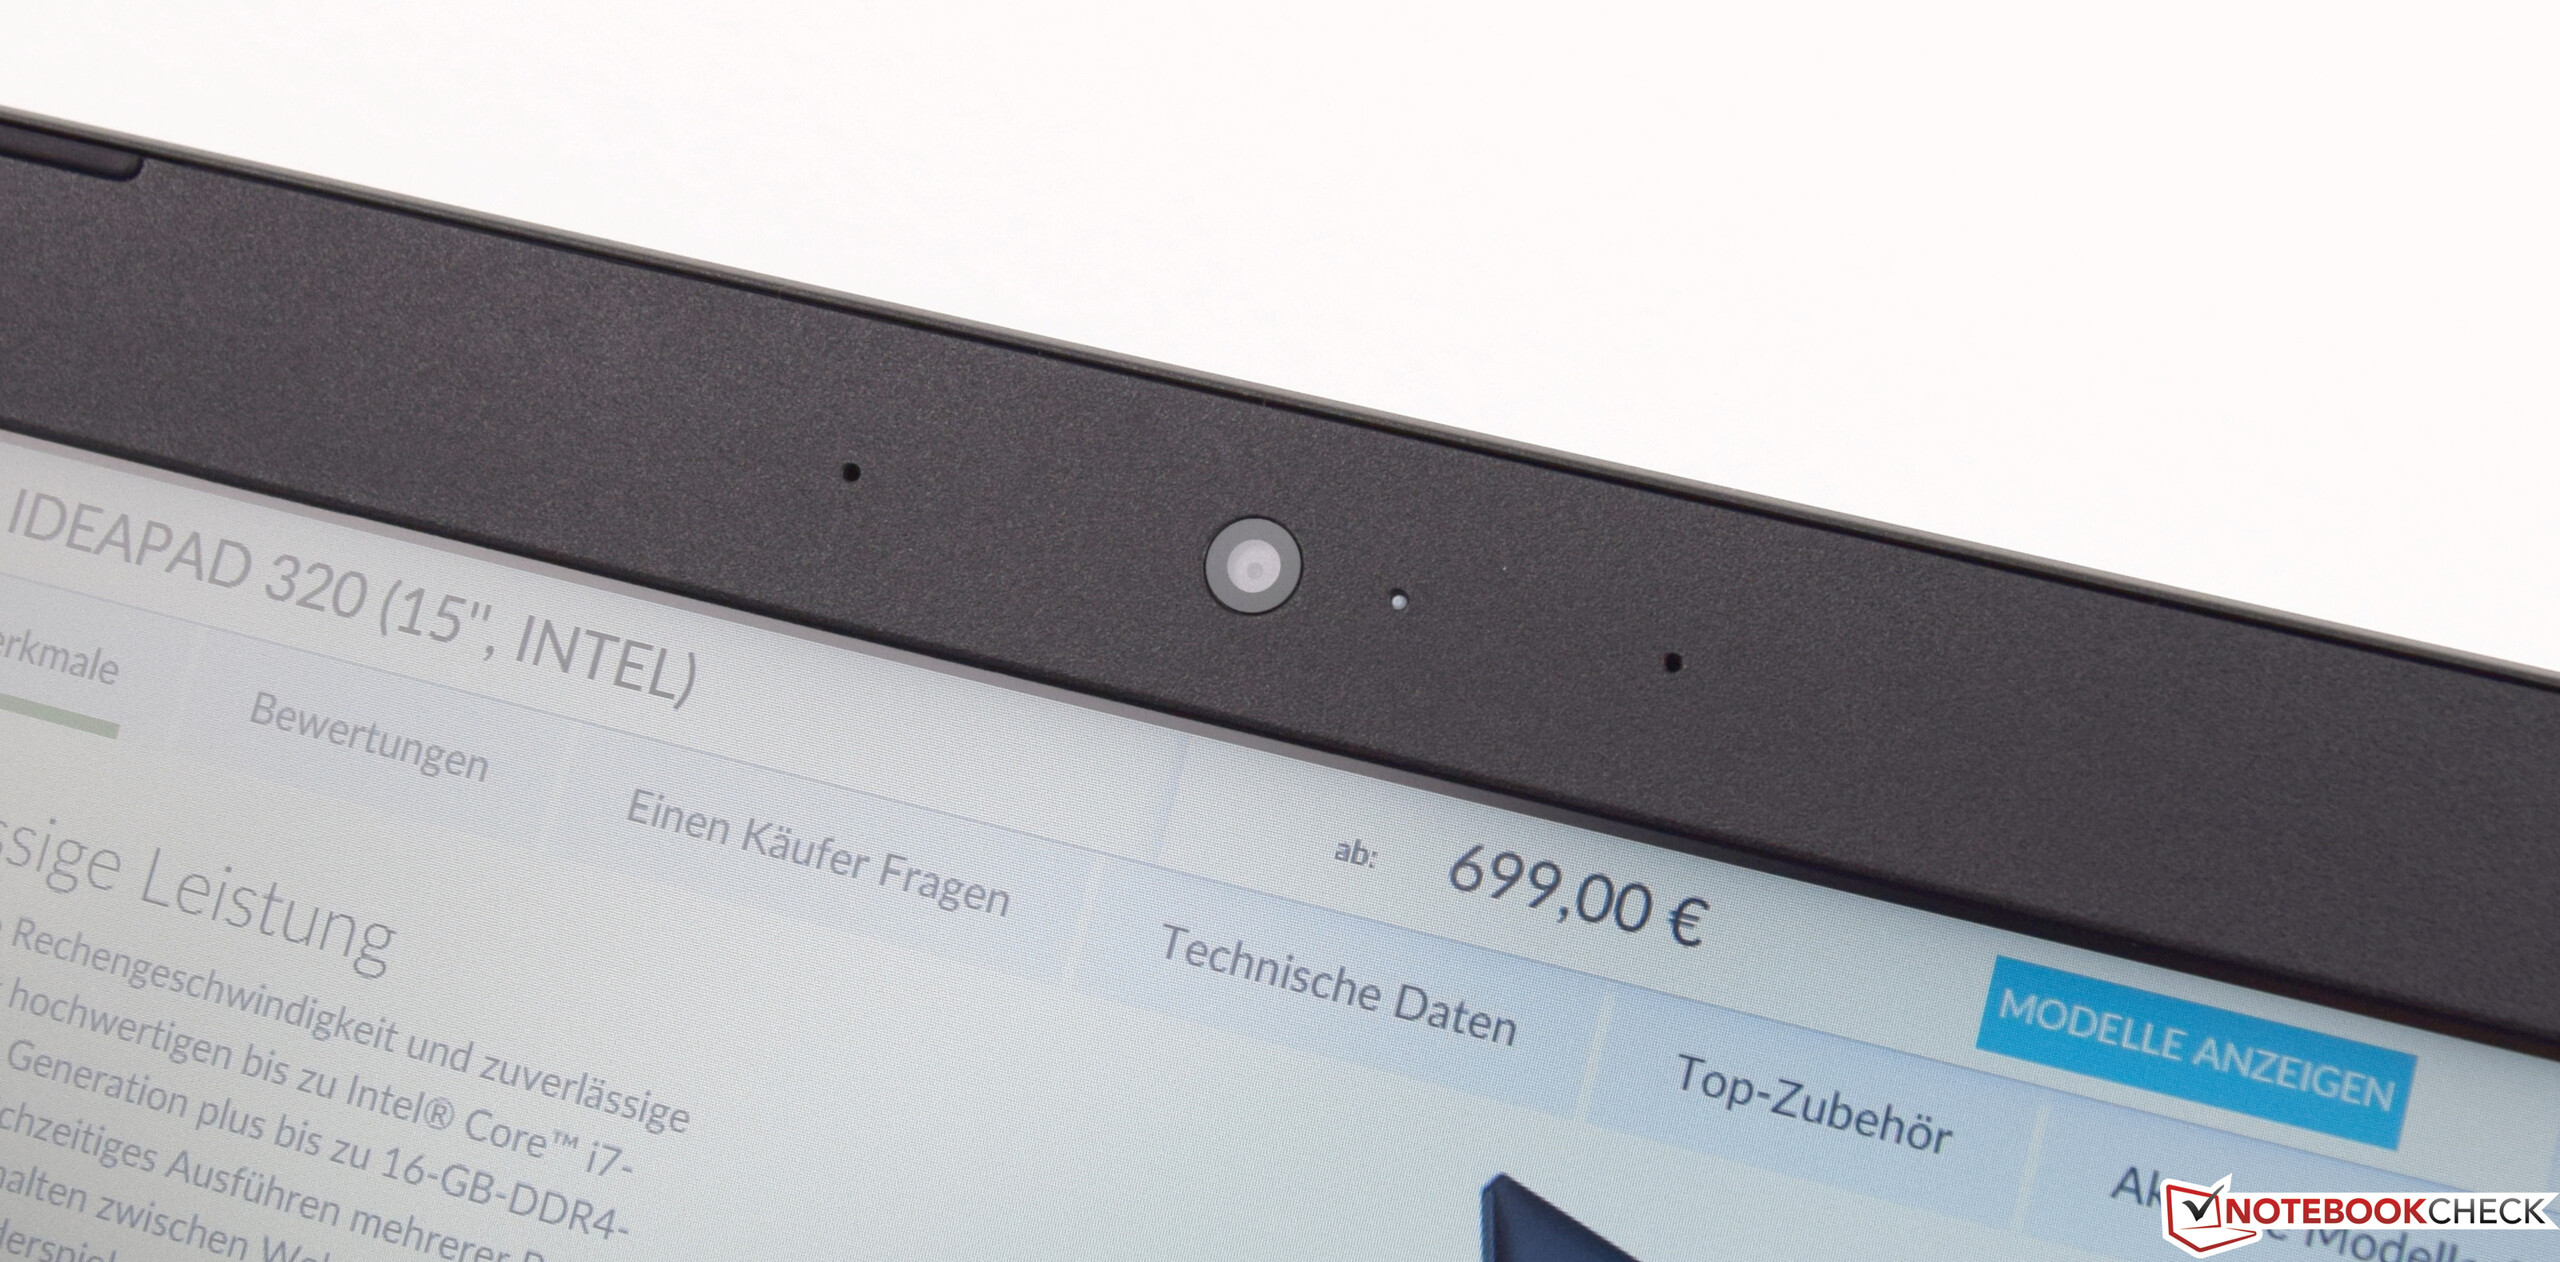
Il Lenovo IdeaPad 320-15IKB è un portatiel multimedia da 15.6". Sfortunatamente Lenovo, non ha agito rispetto alle nostre critiche verso il modello precedente, che sono rimaste invariate, sebbene siano migliorate le prestazioni. Ovviamente, l'attuale Intel Core i5-8250U offre buone prestazioni ed il Lenovo IdeaPad 320-15IKB può essere usato anche per il gaming grazie alla GeForce MX150. Nel complesso, riceverete un buon tuttofare con un display sotto la media per un prezzo di circa 739 Euro (~$922).
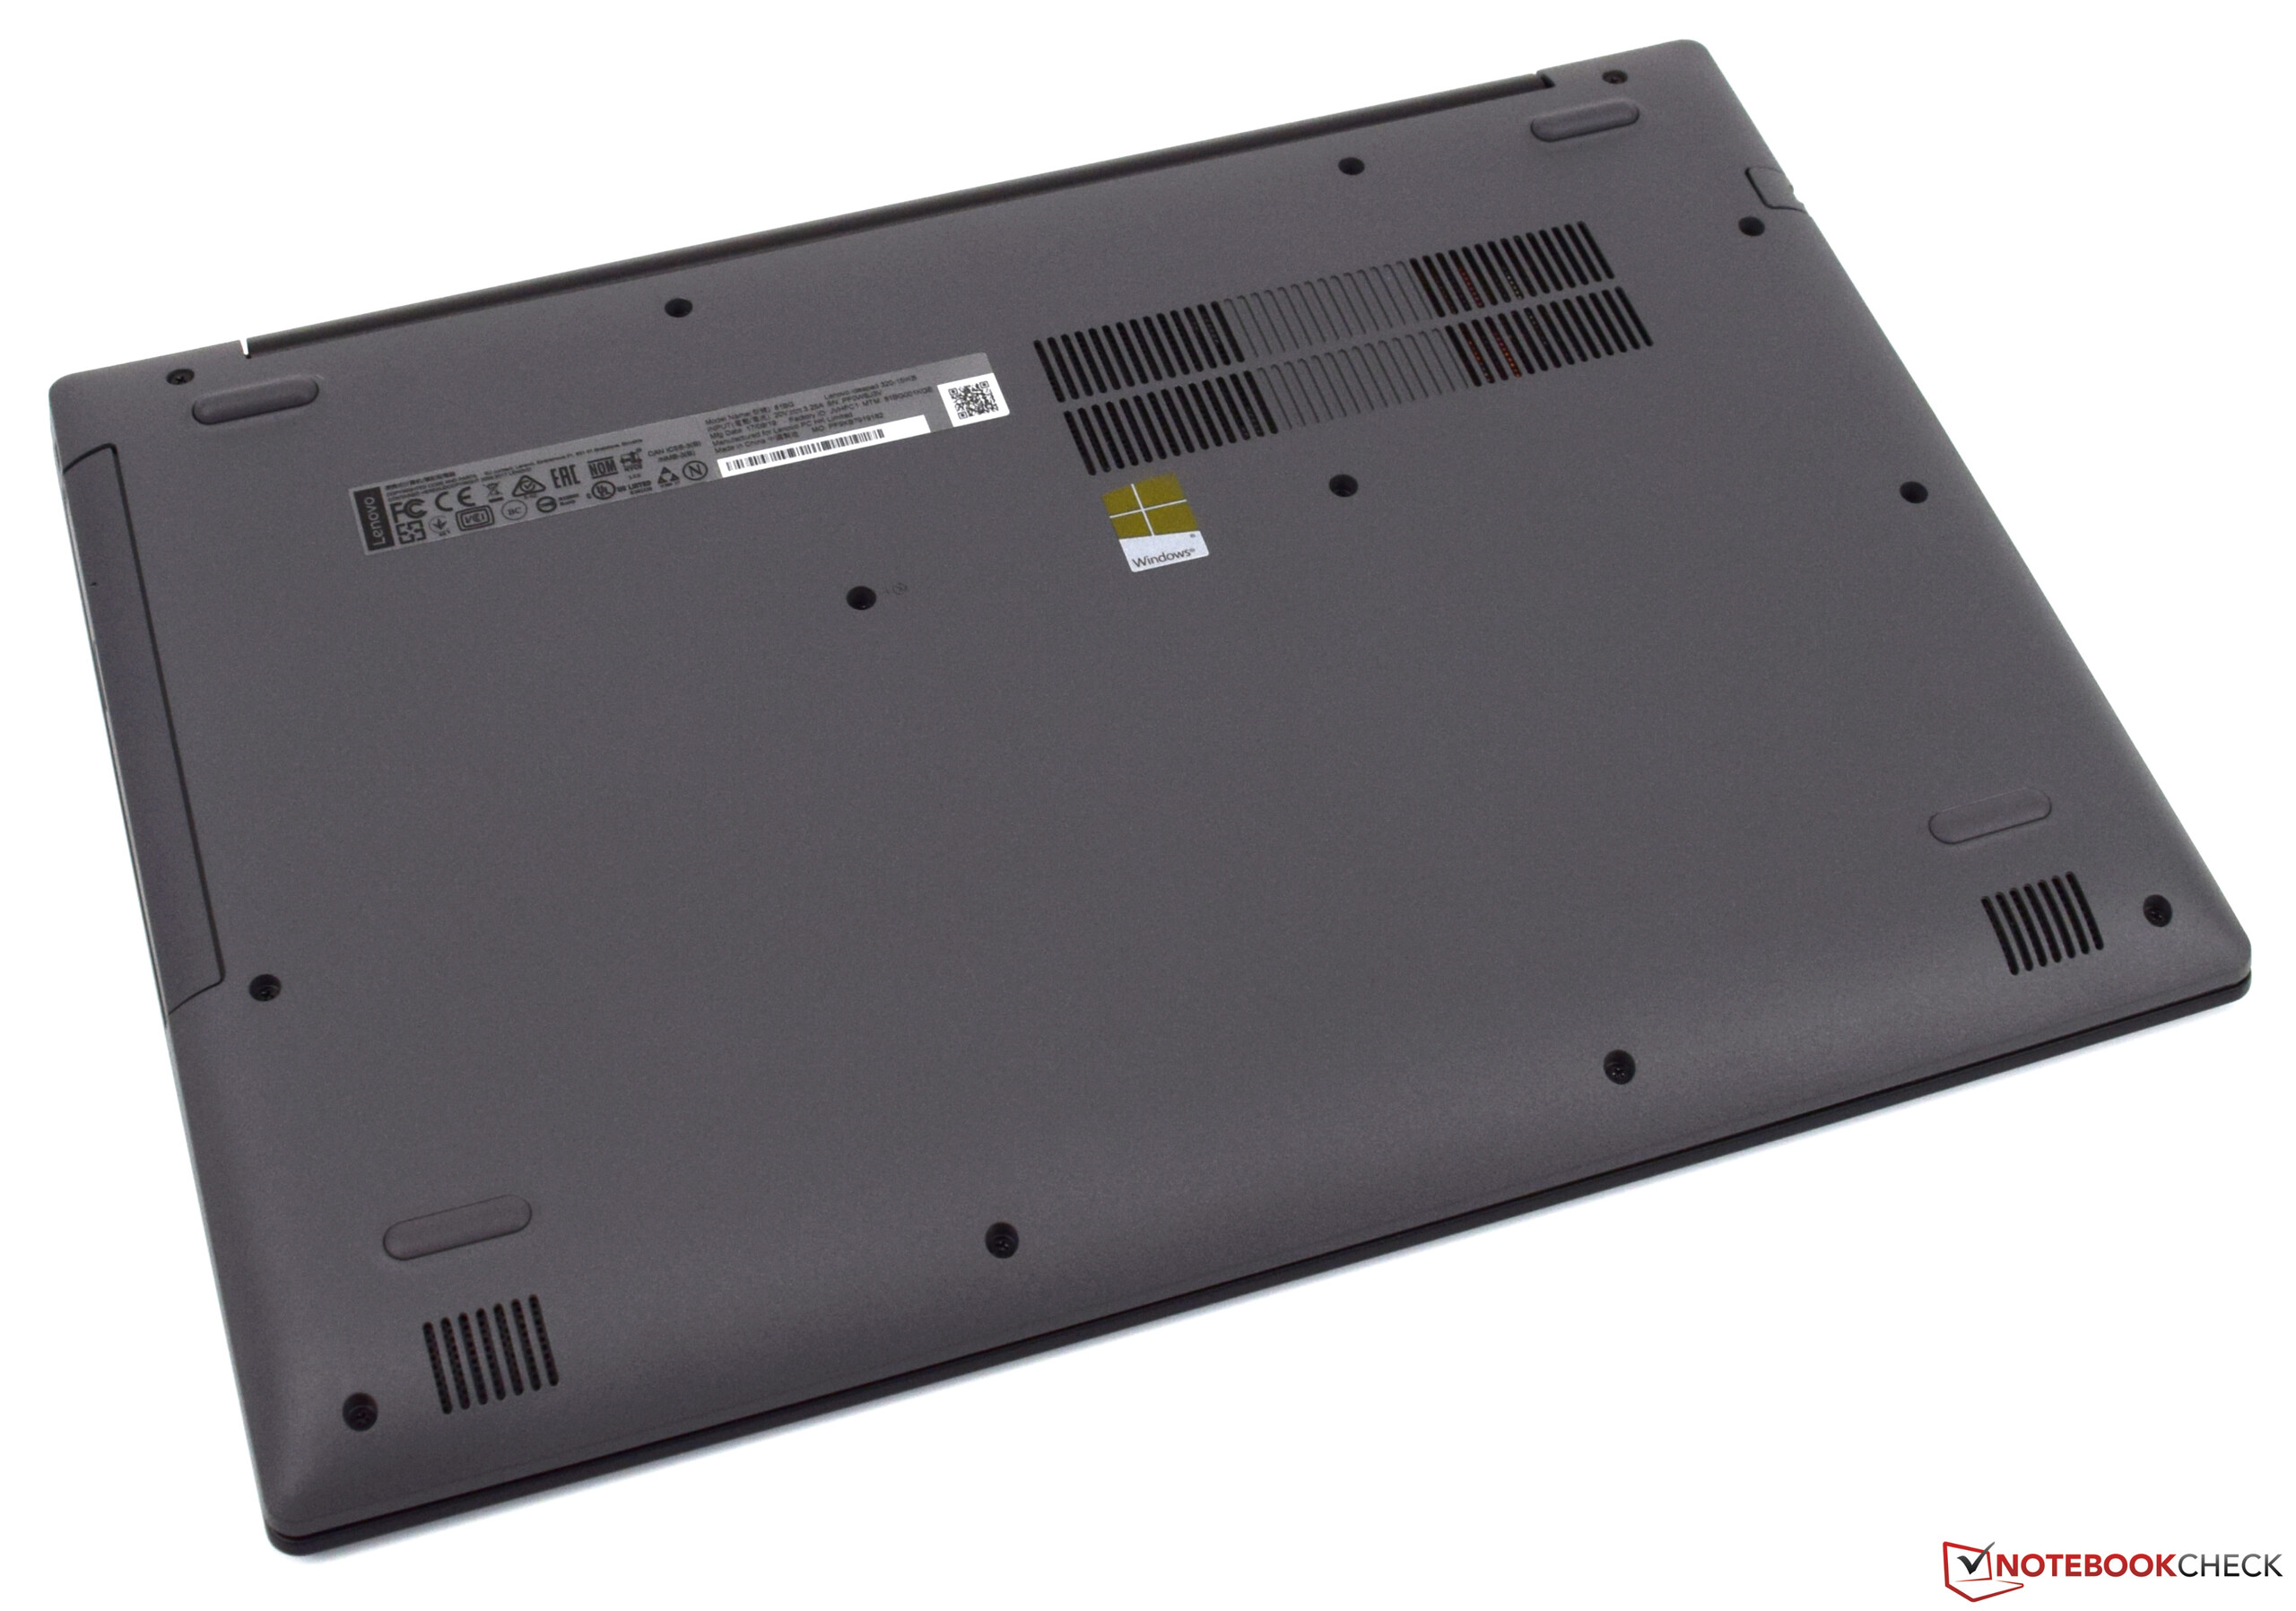
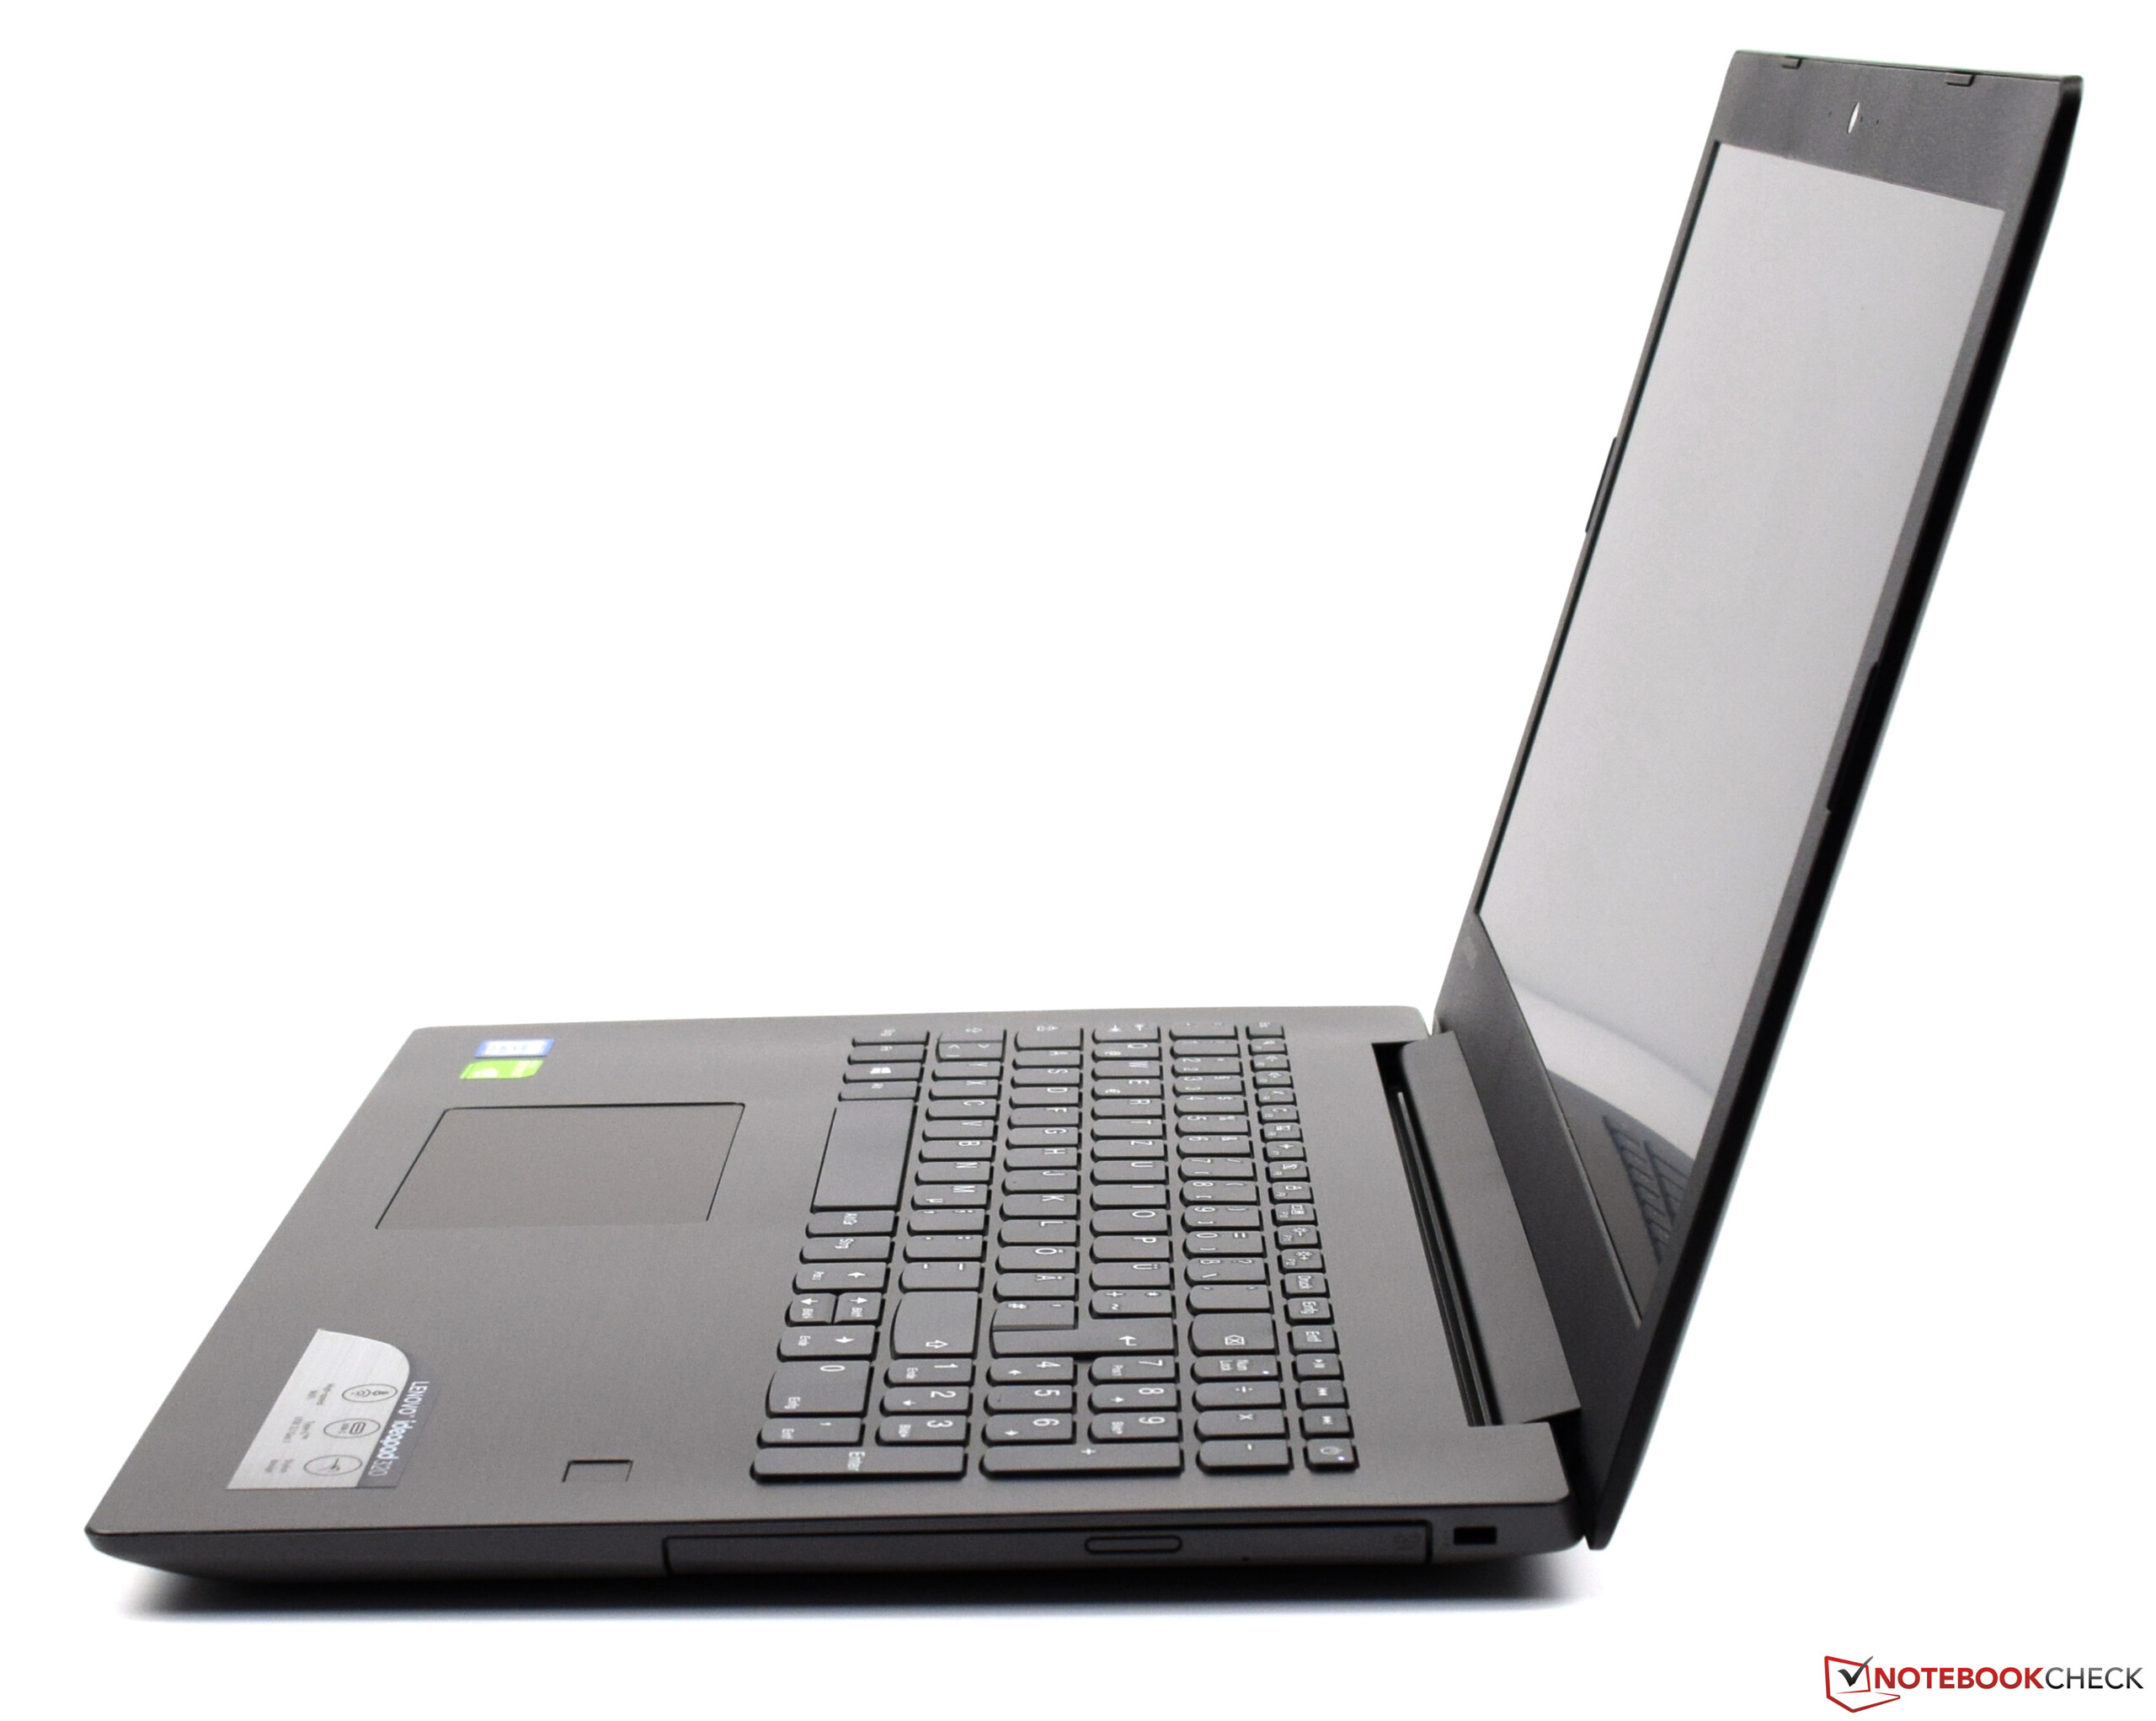
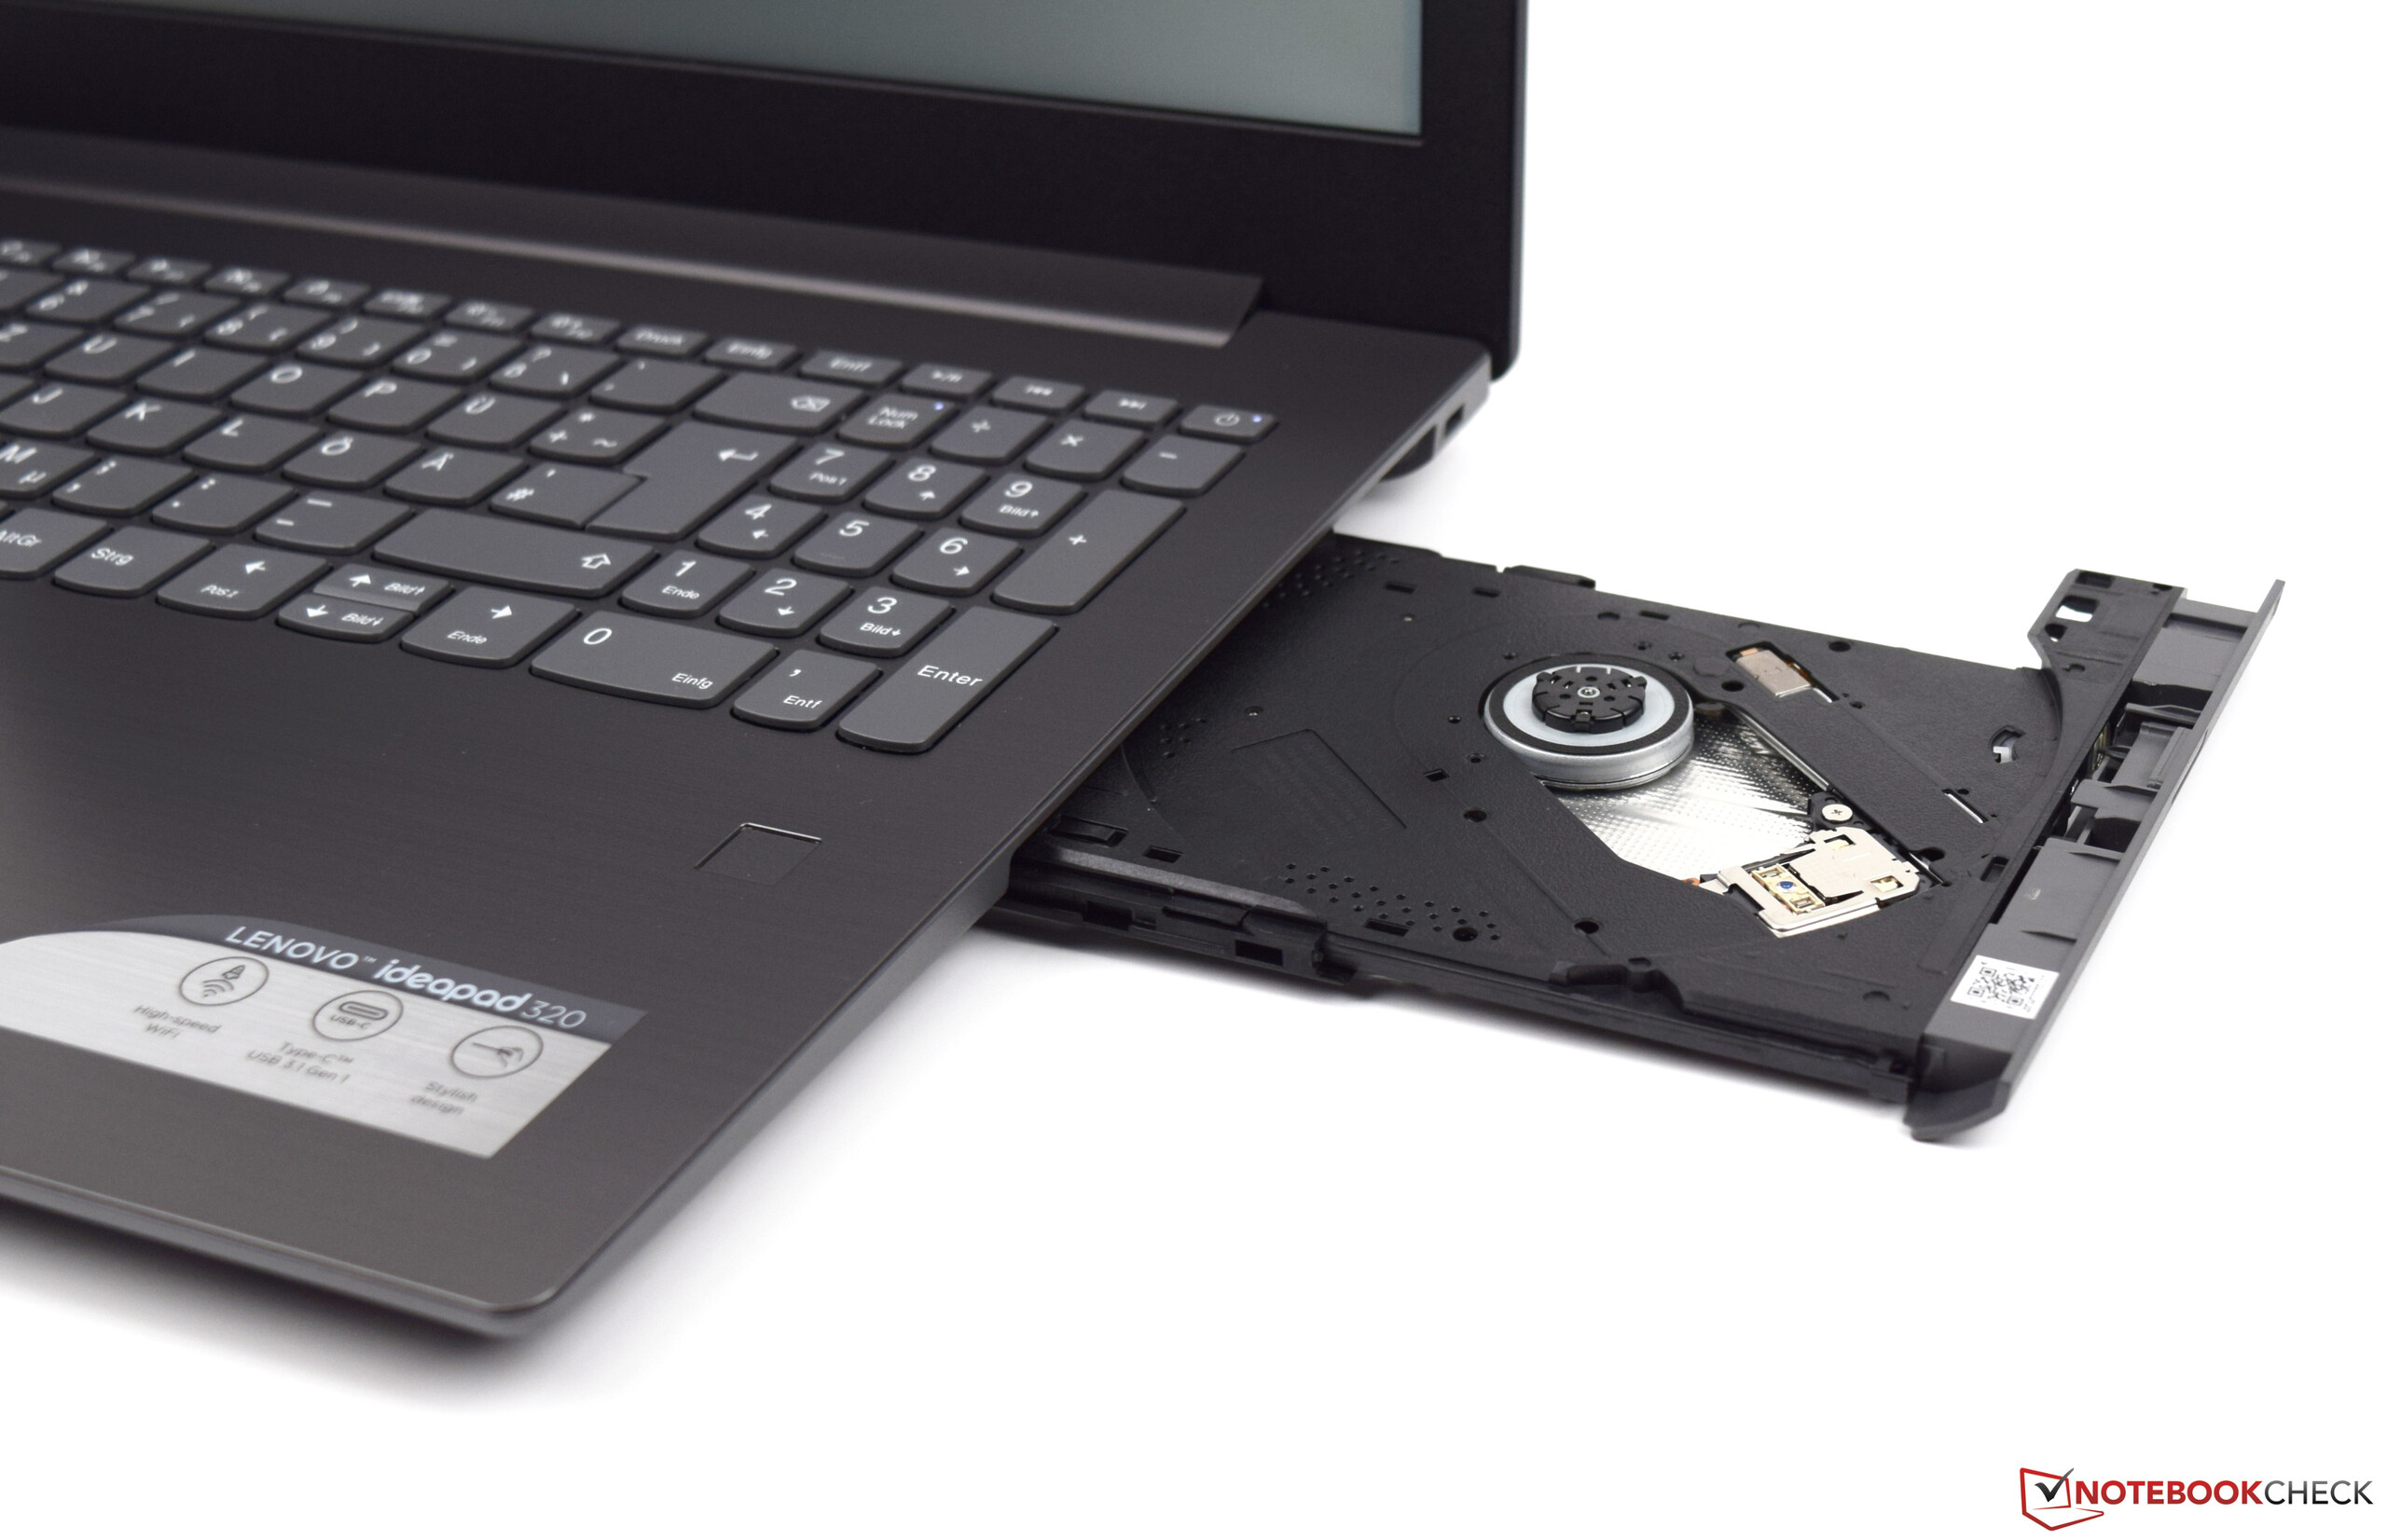
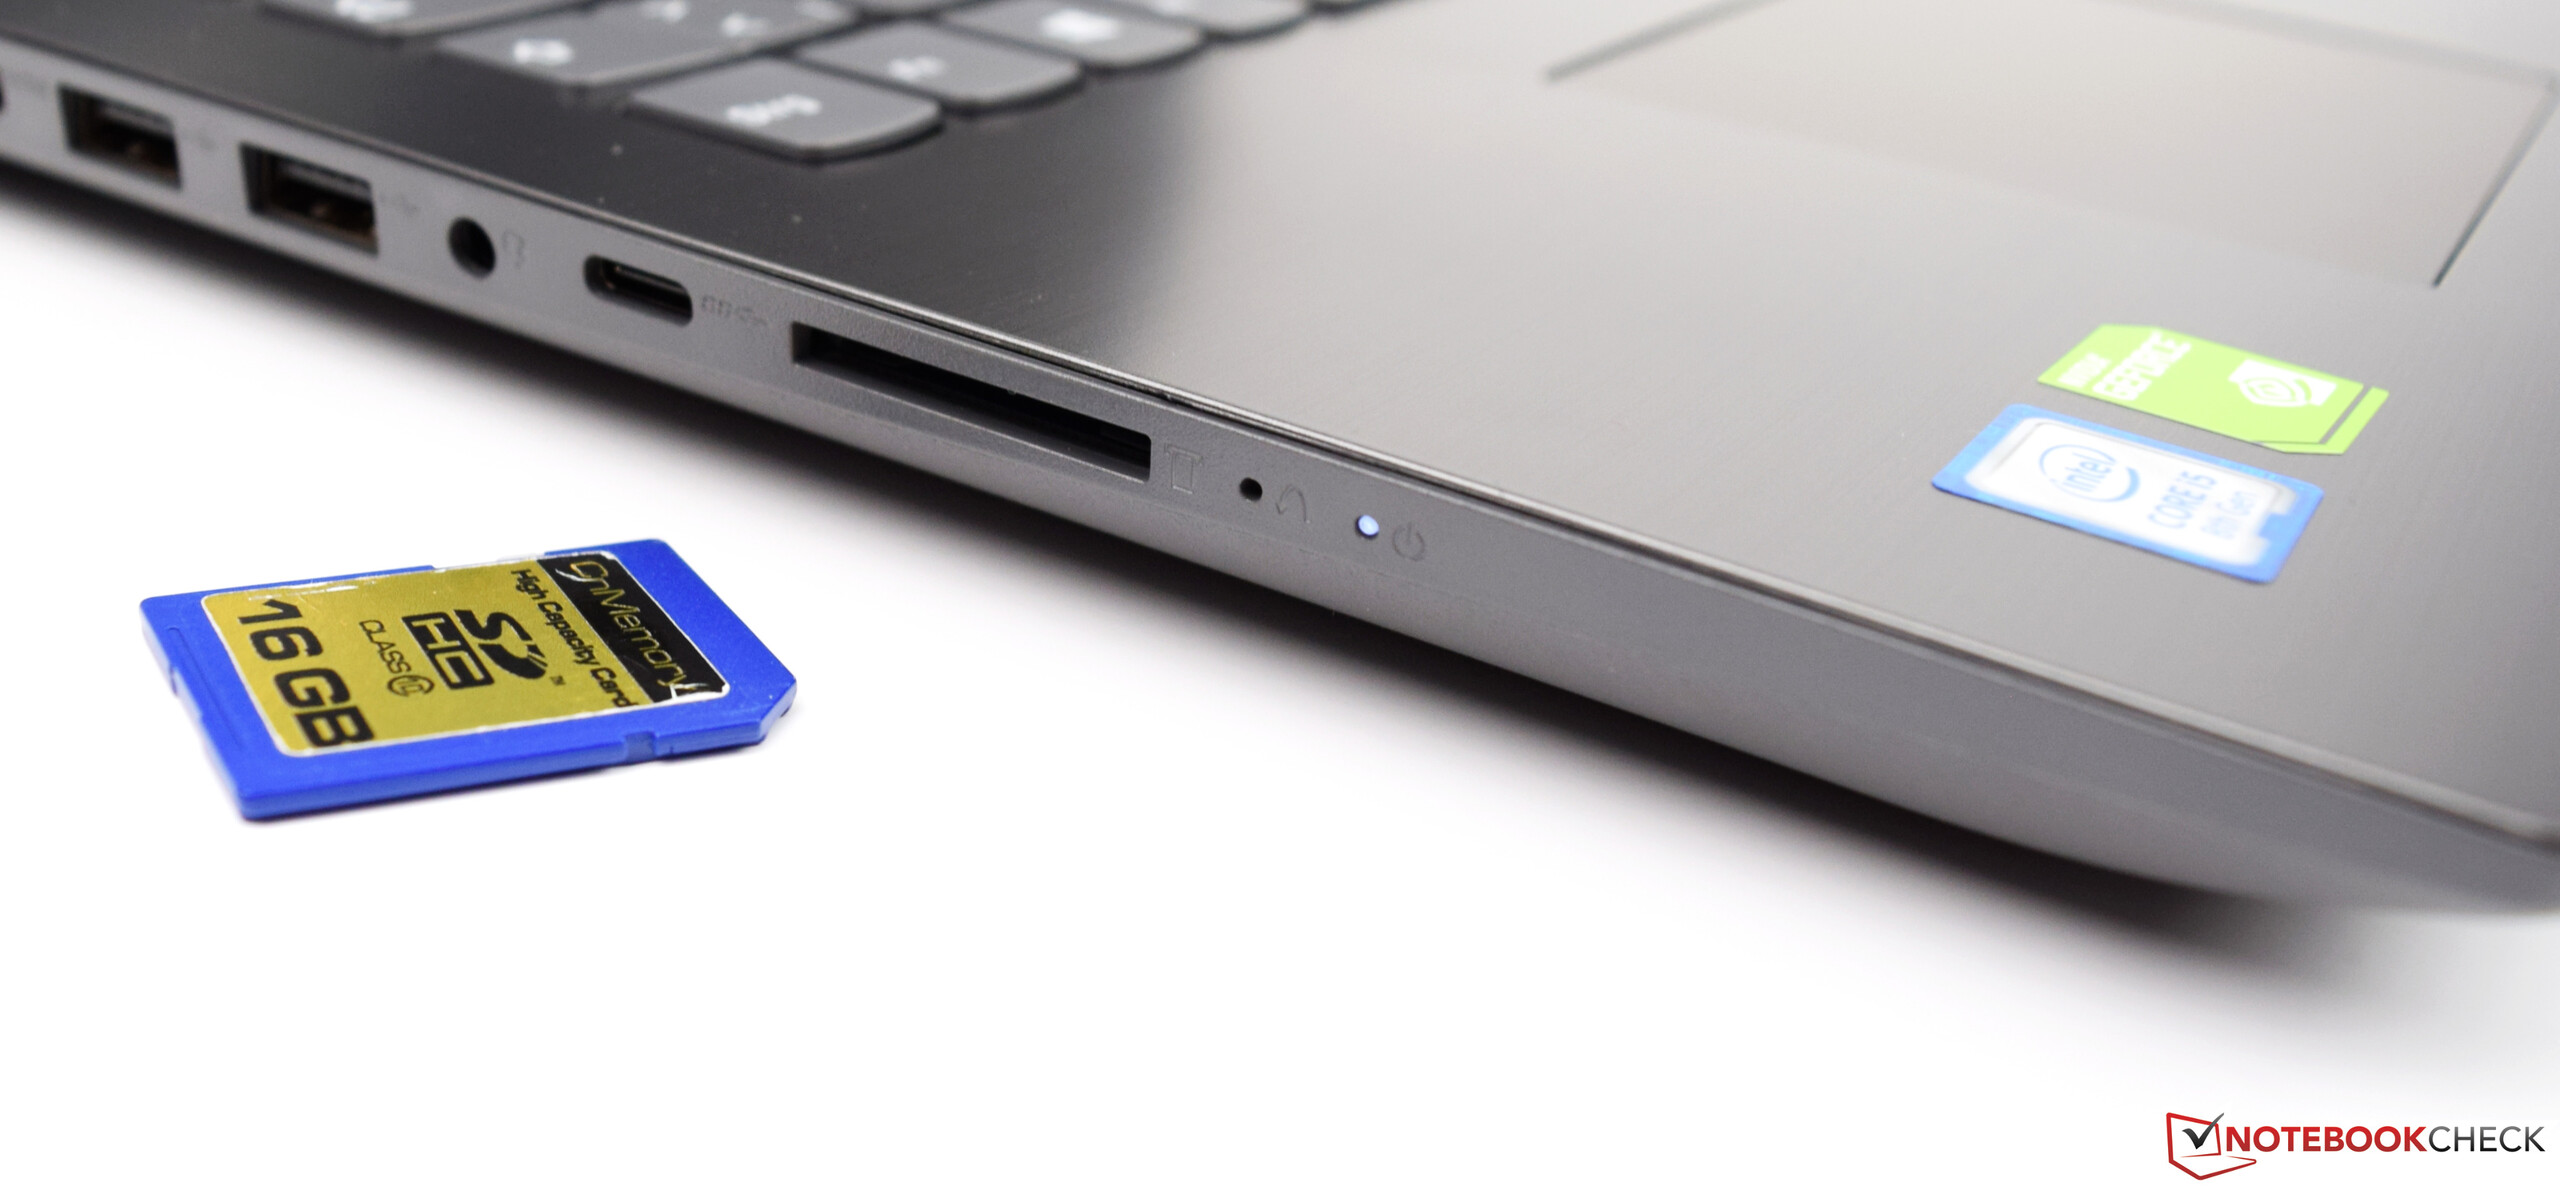
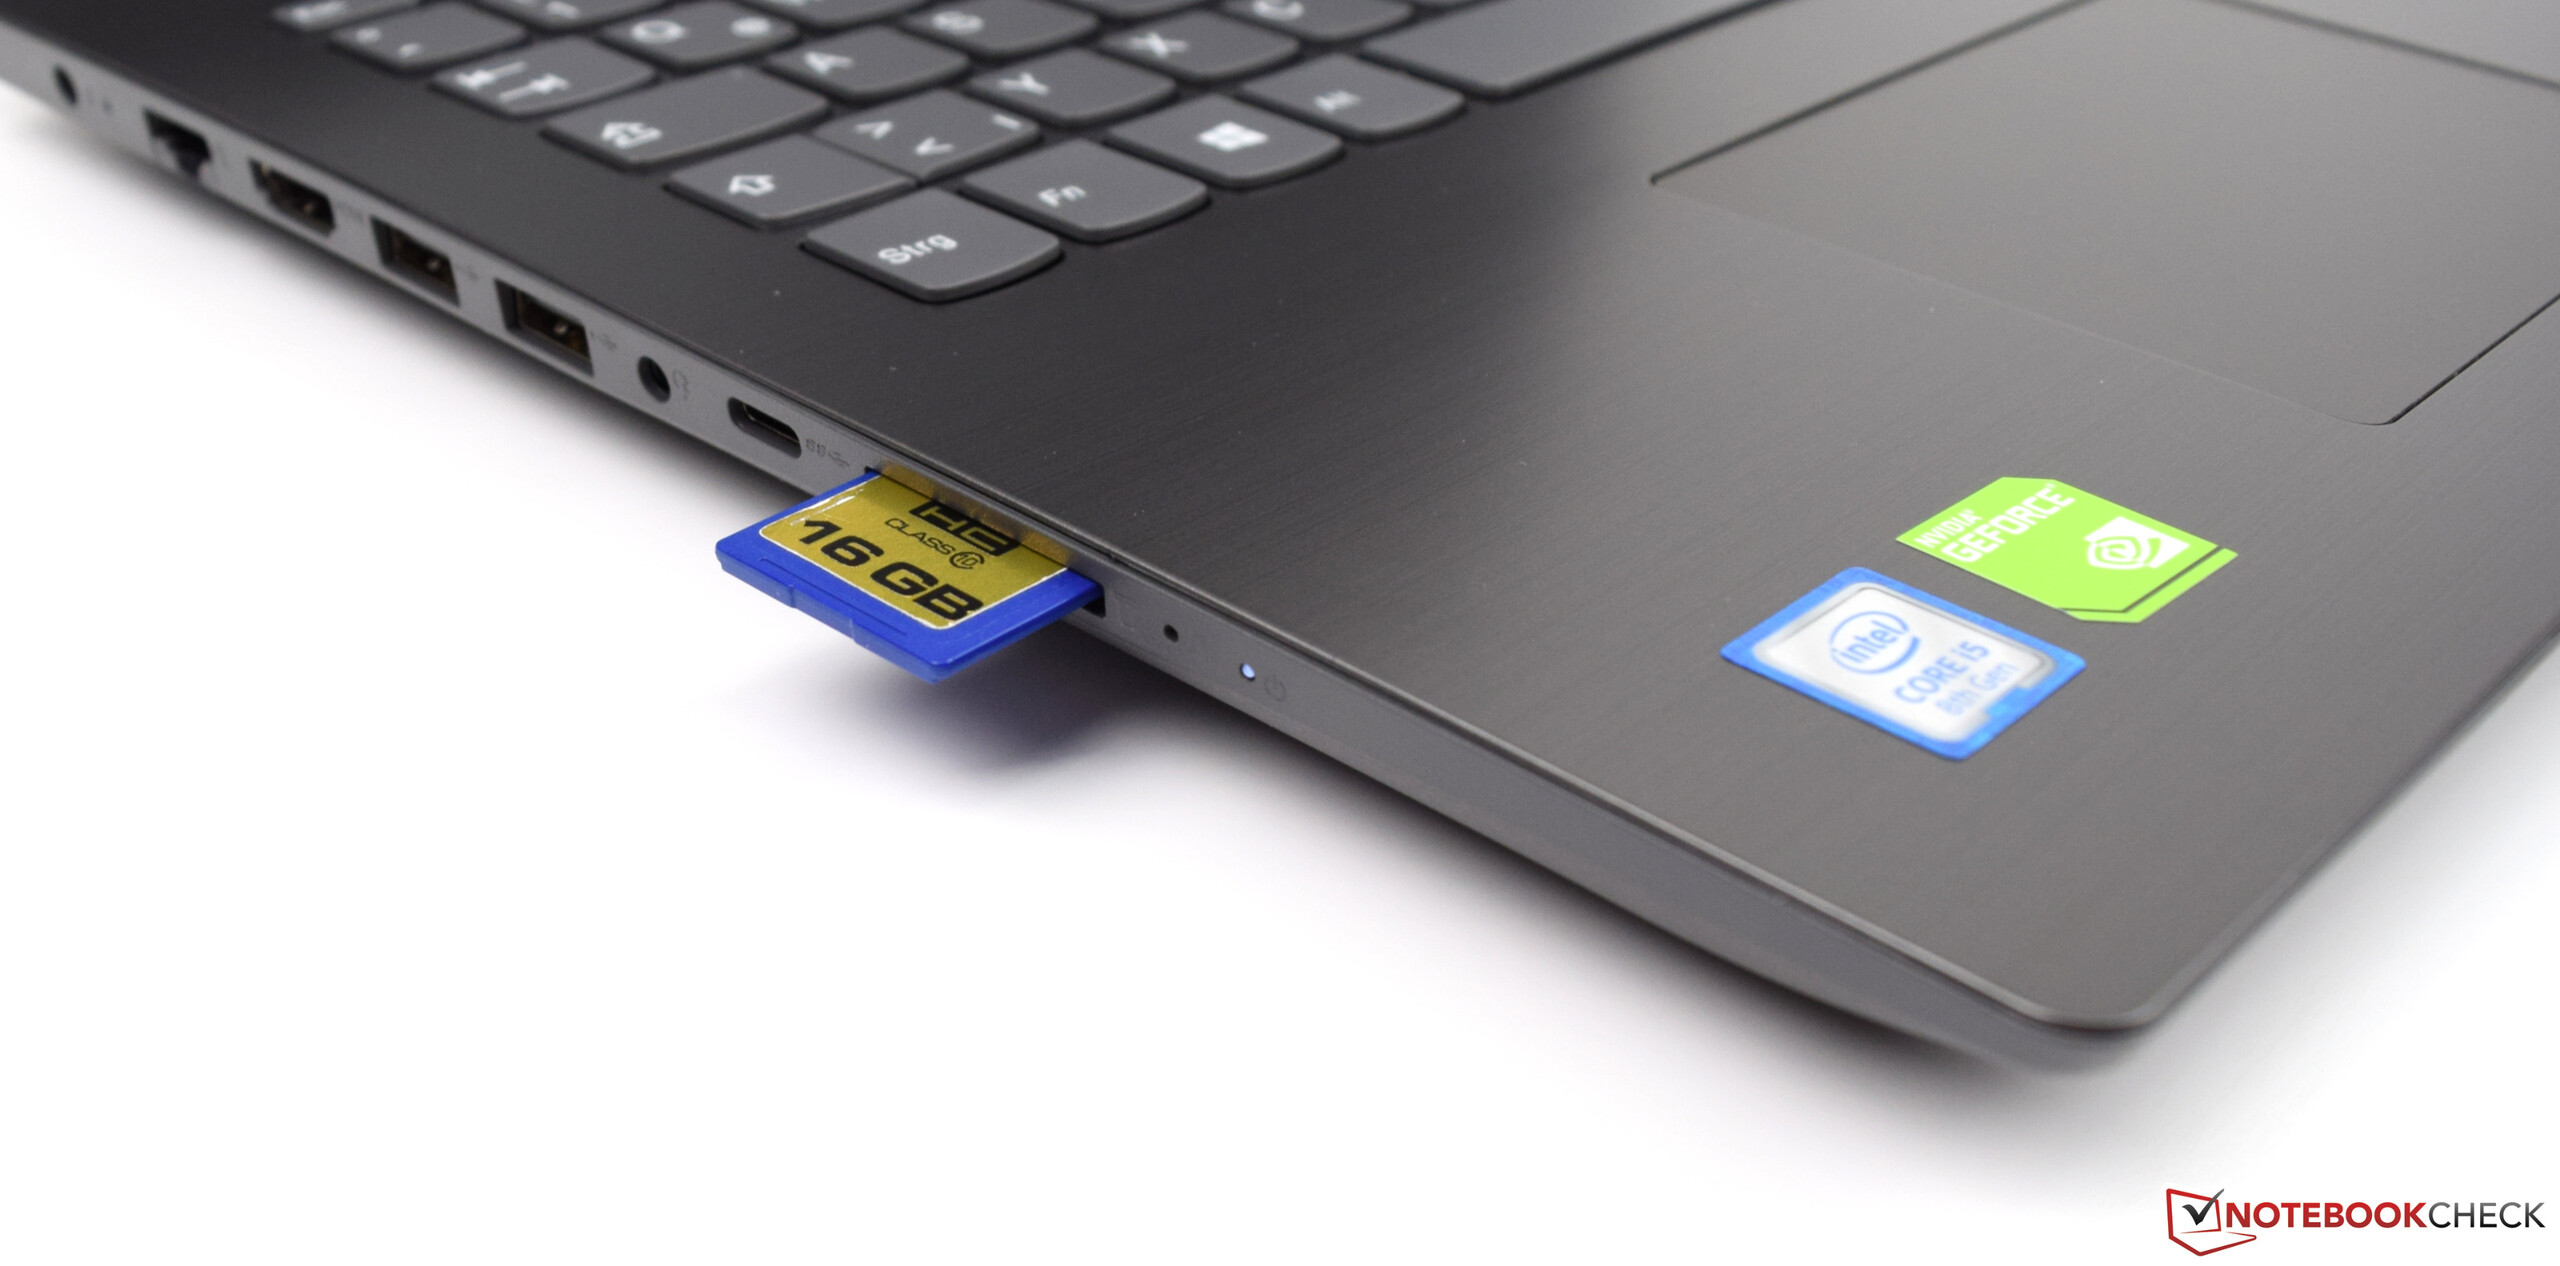
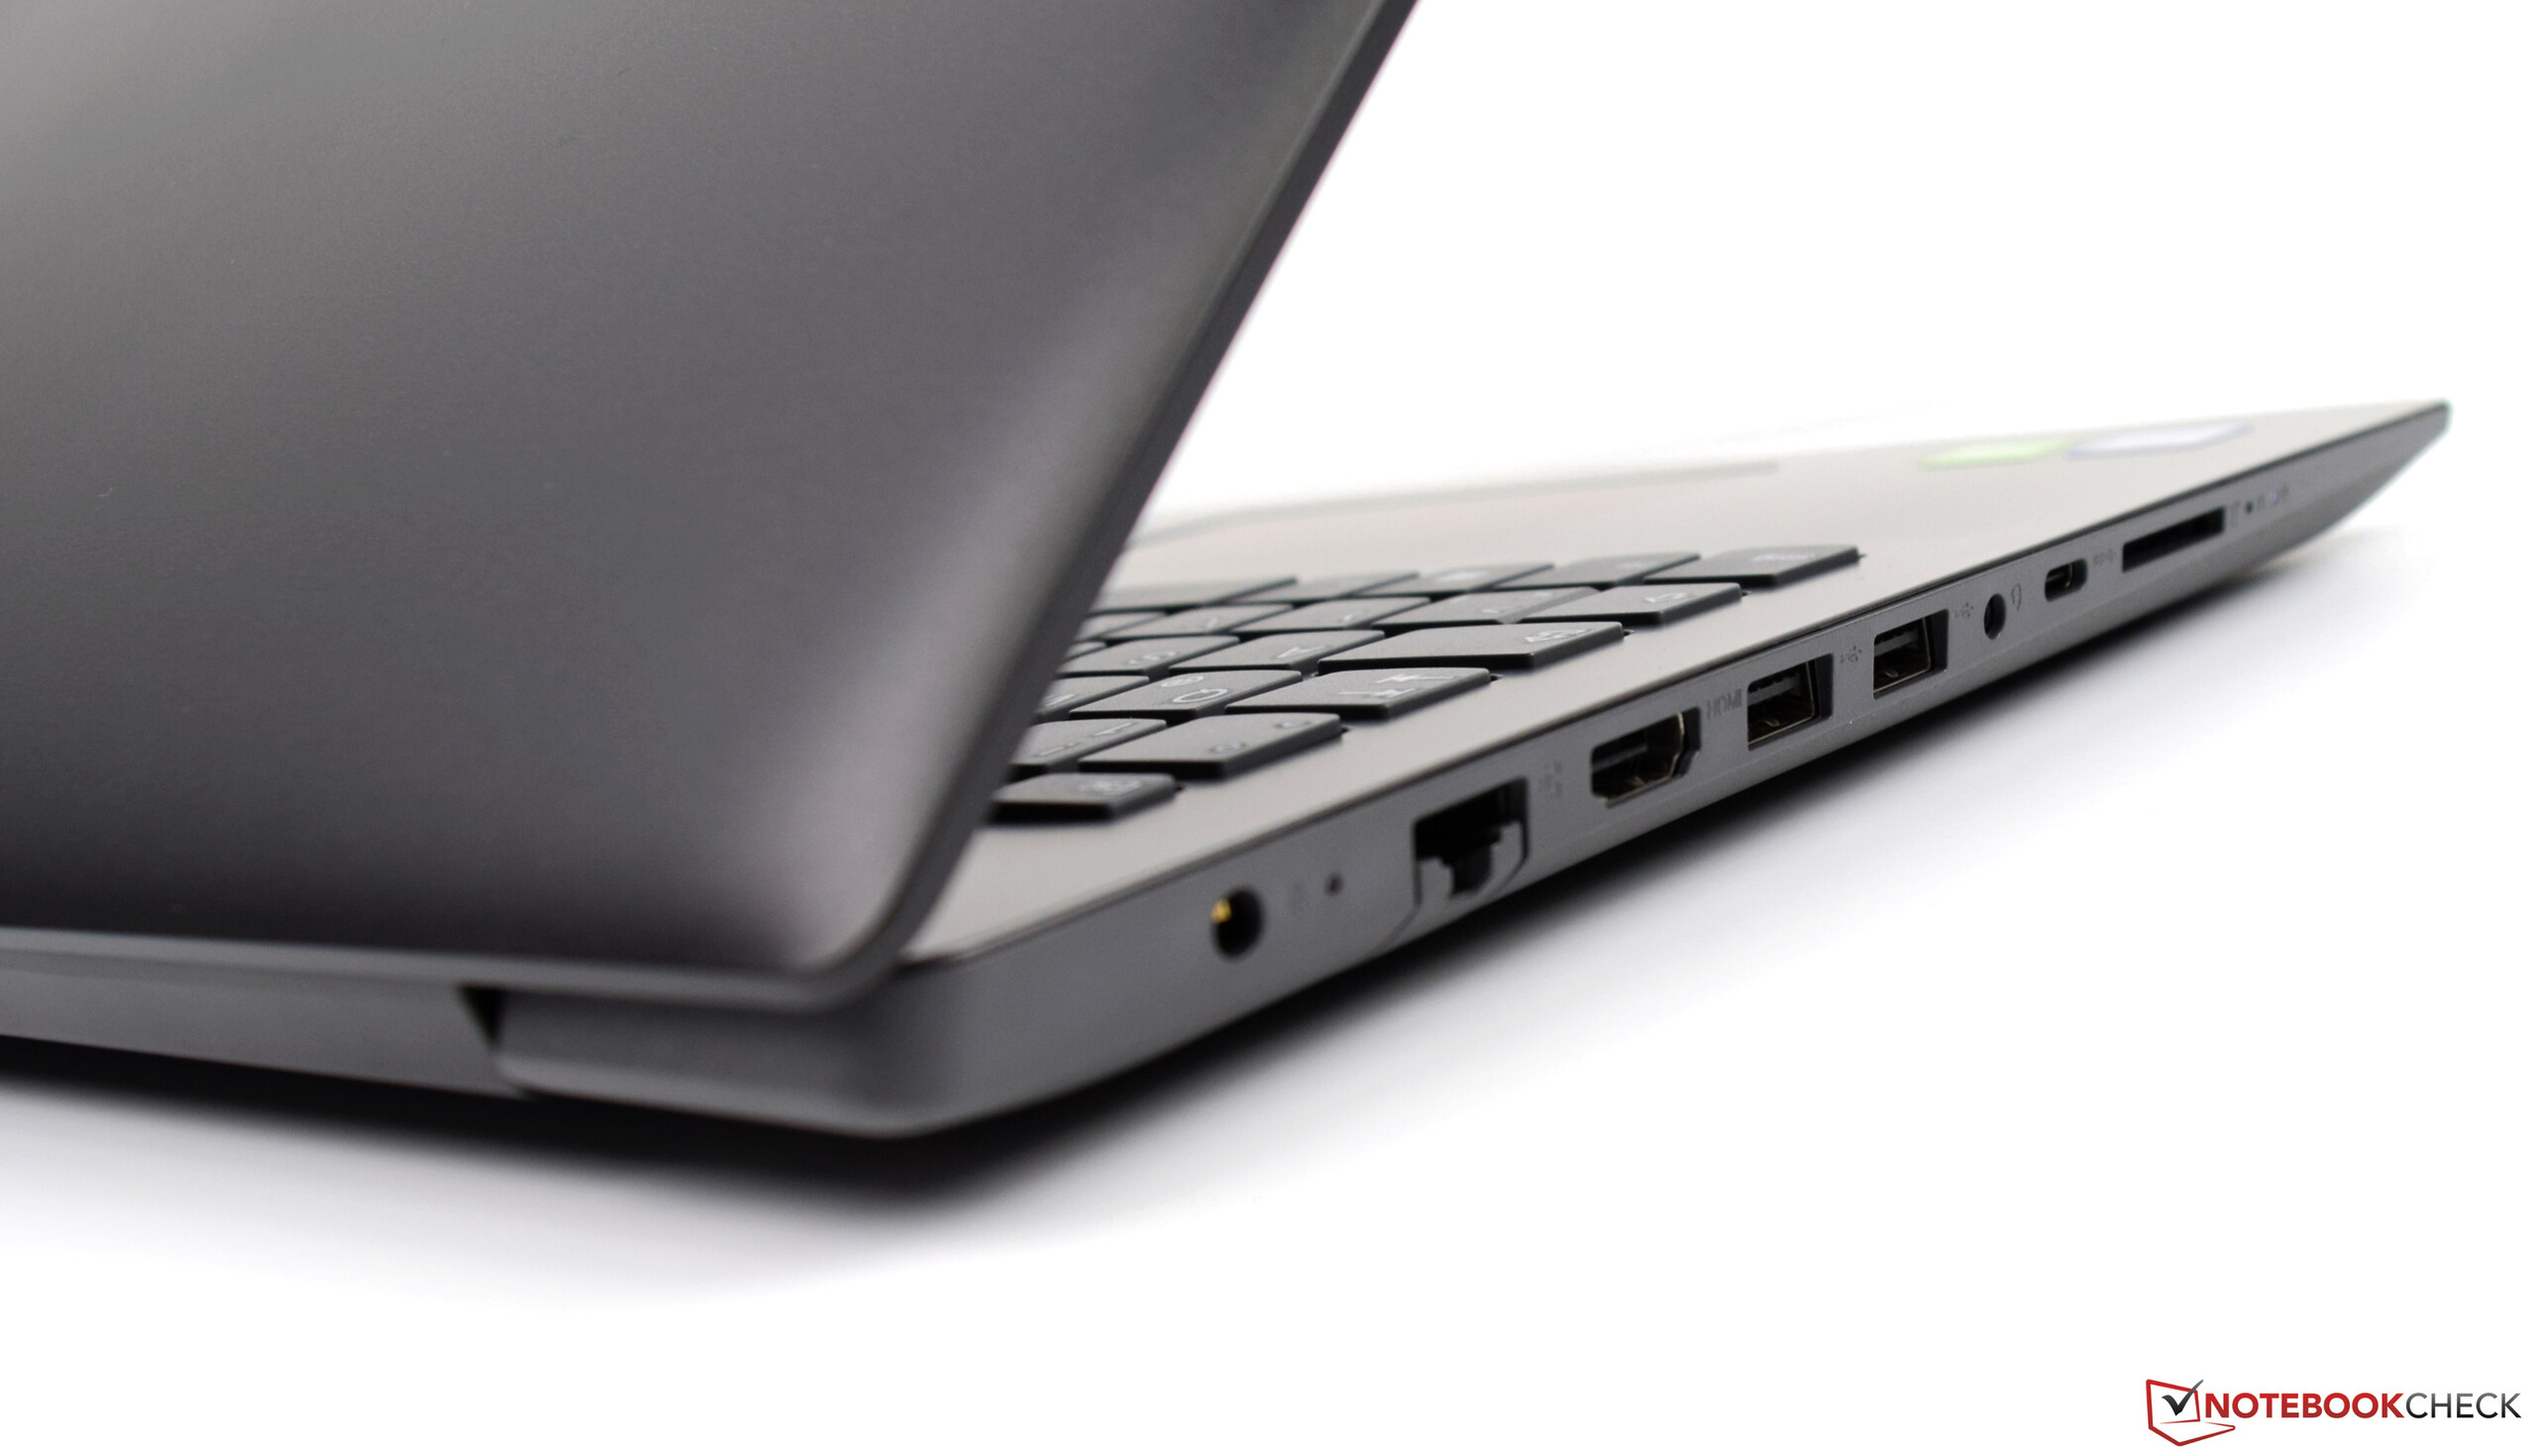
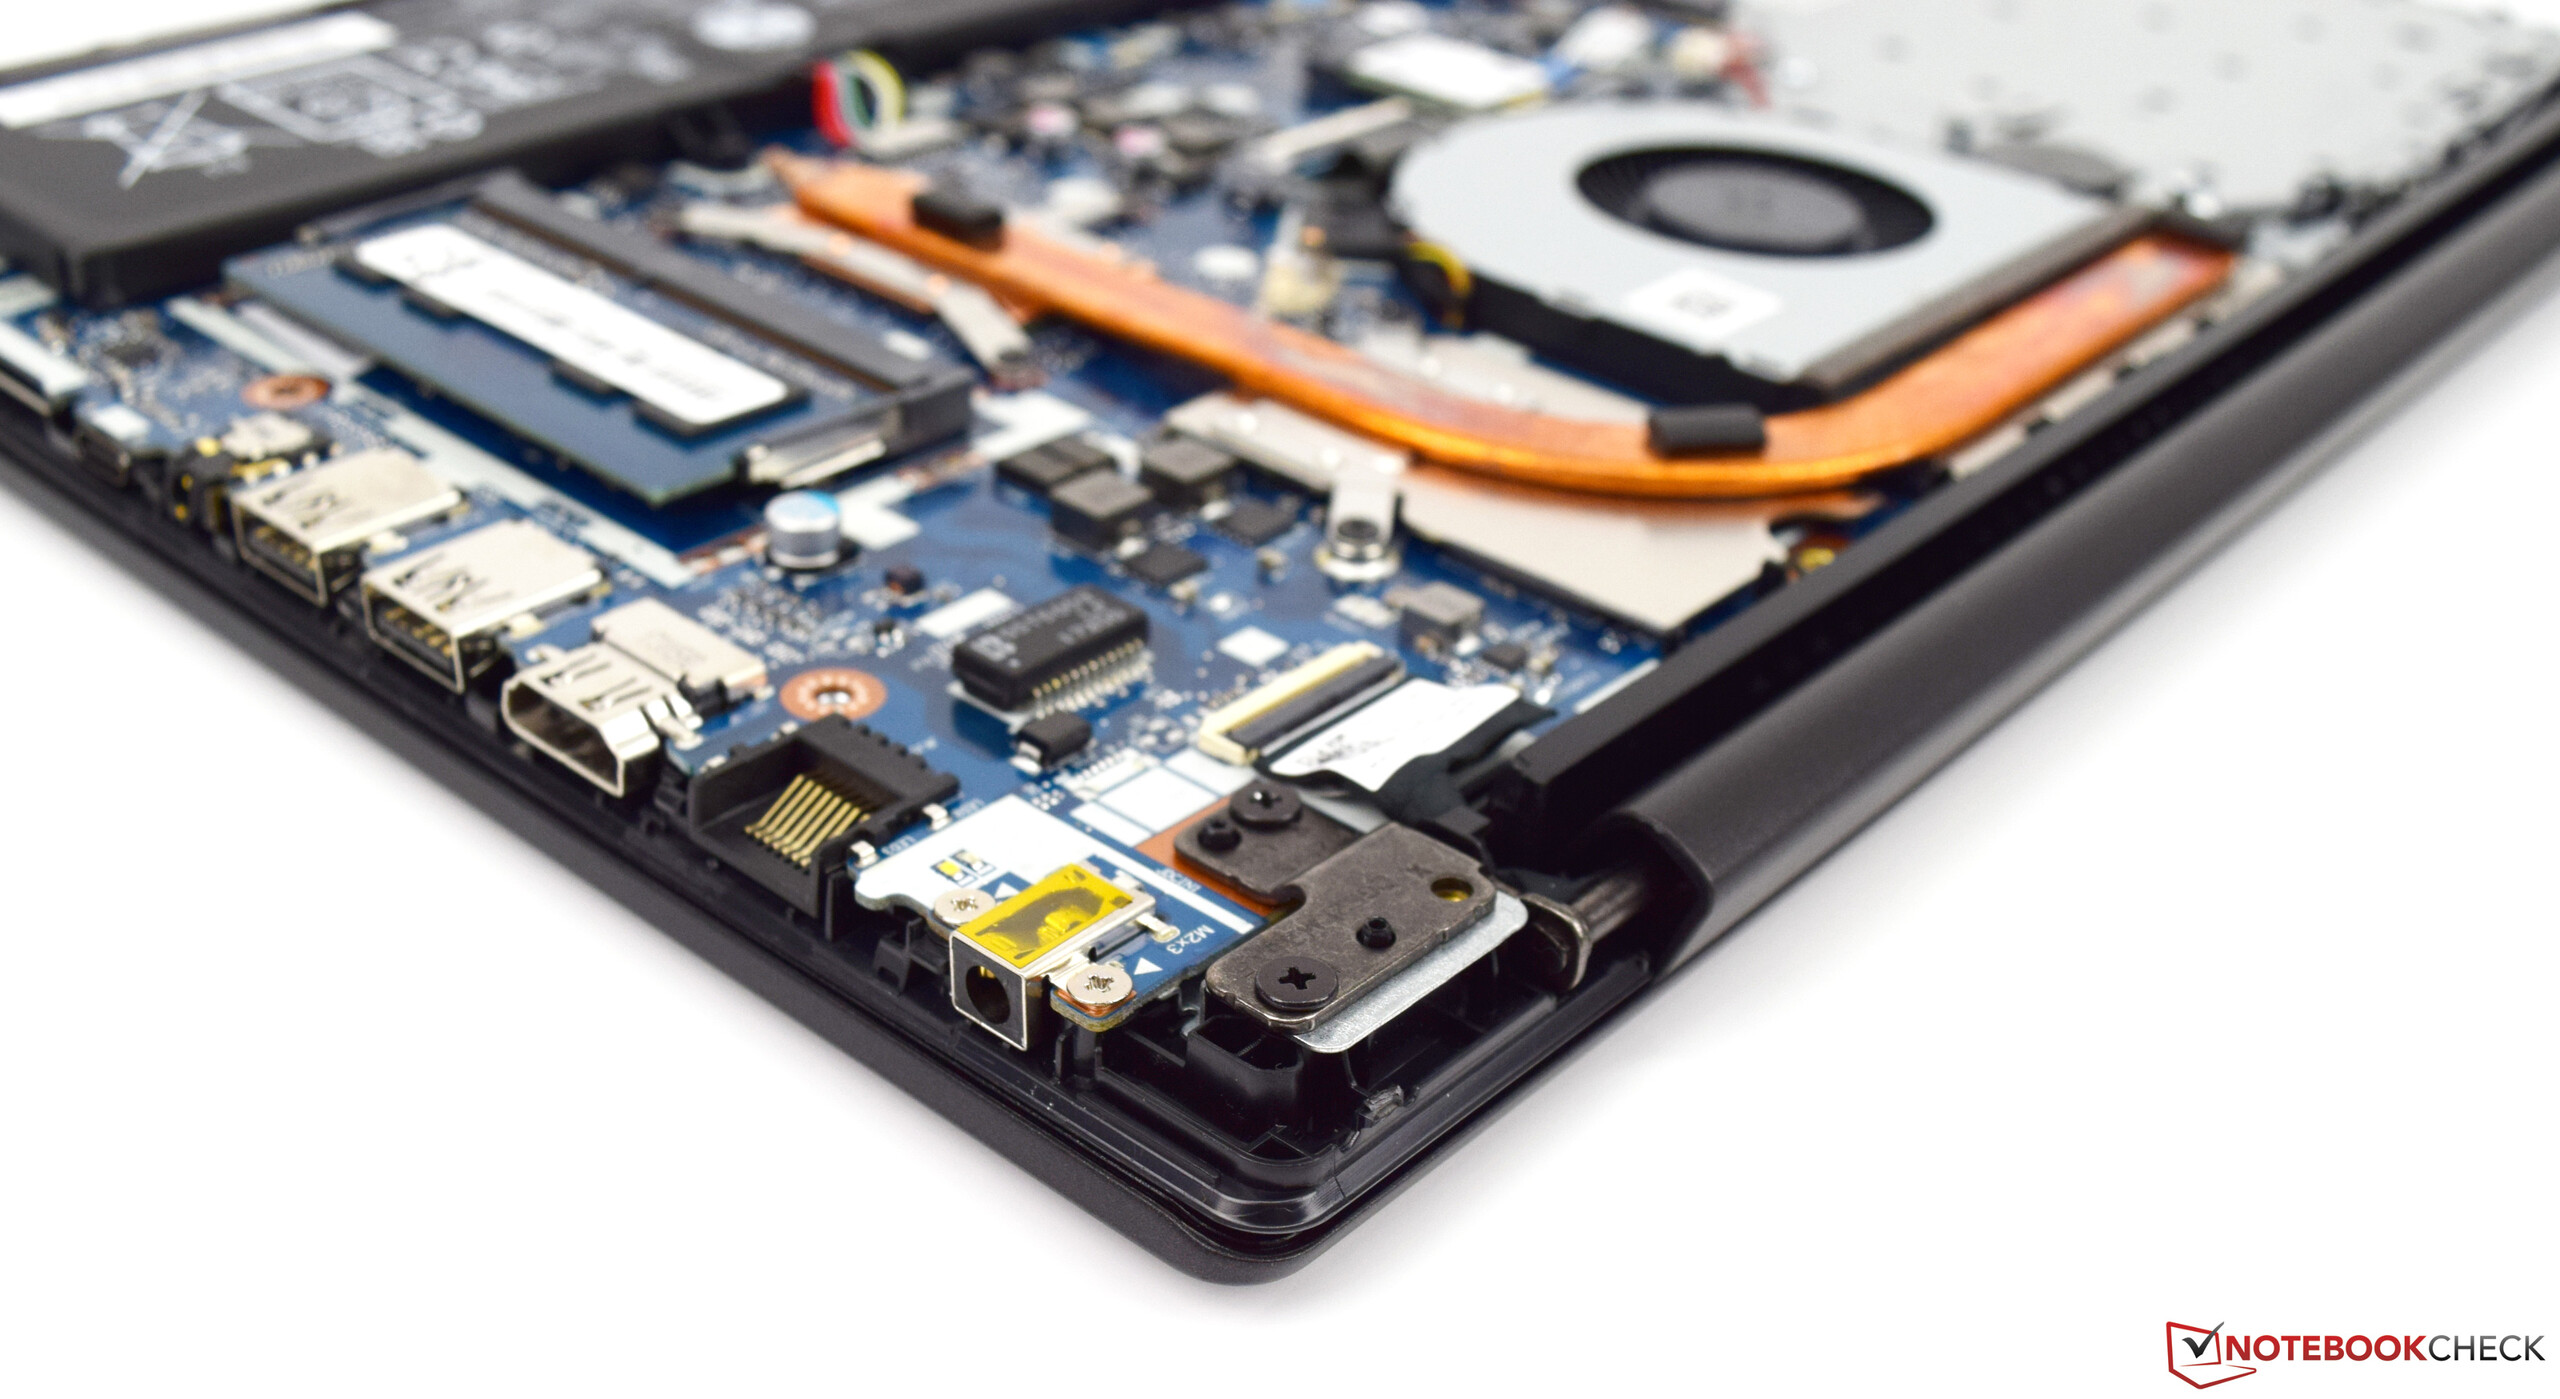
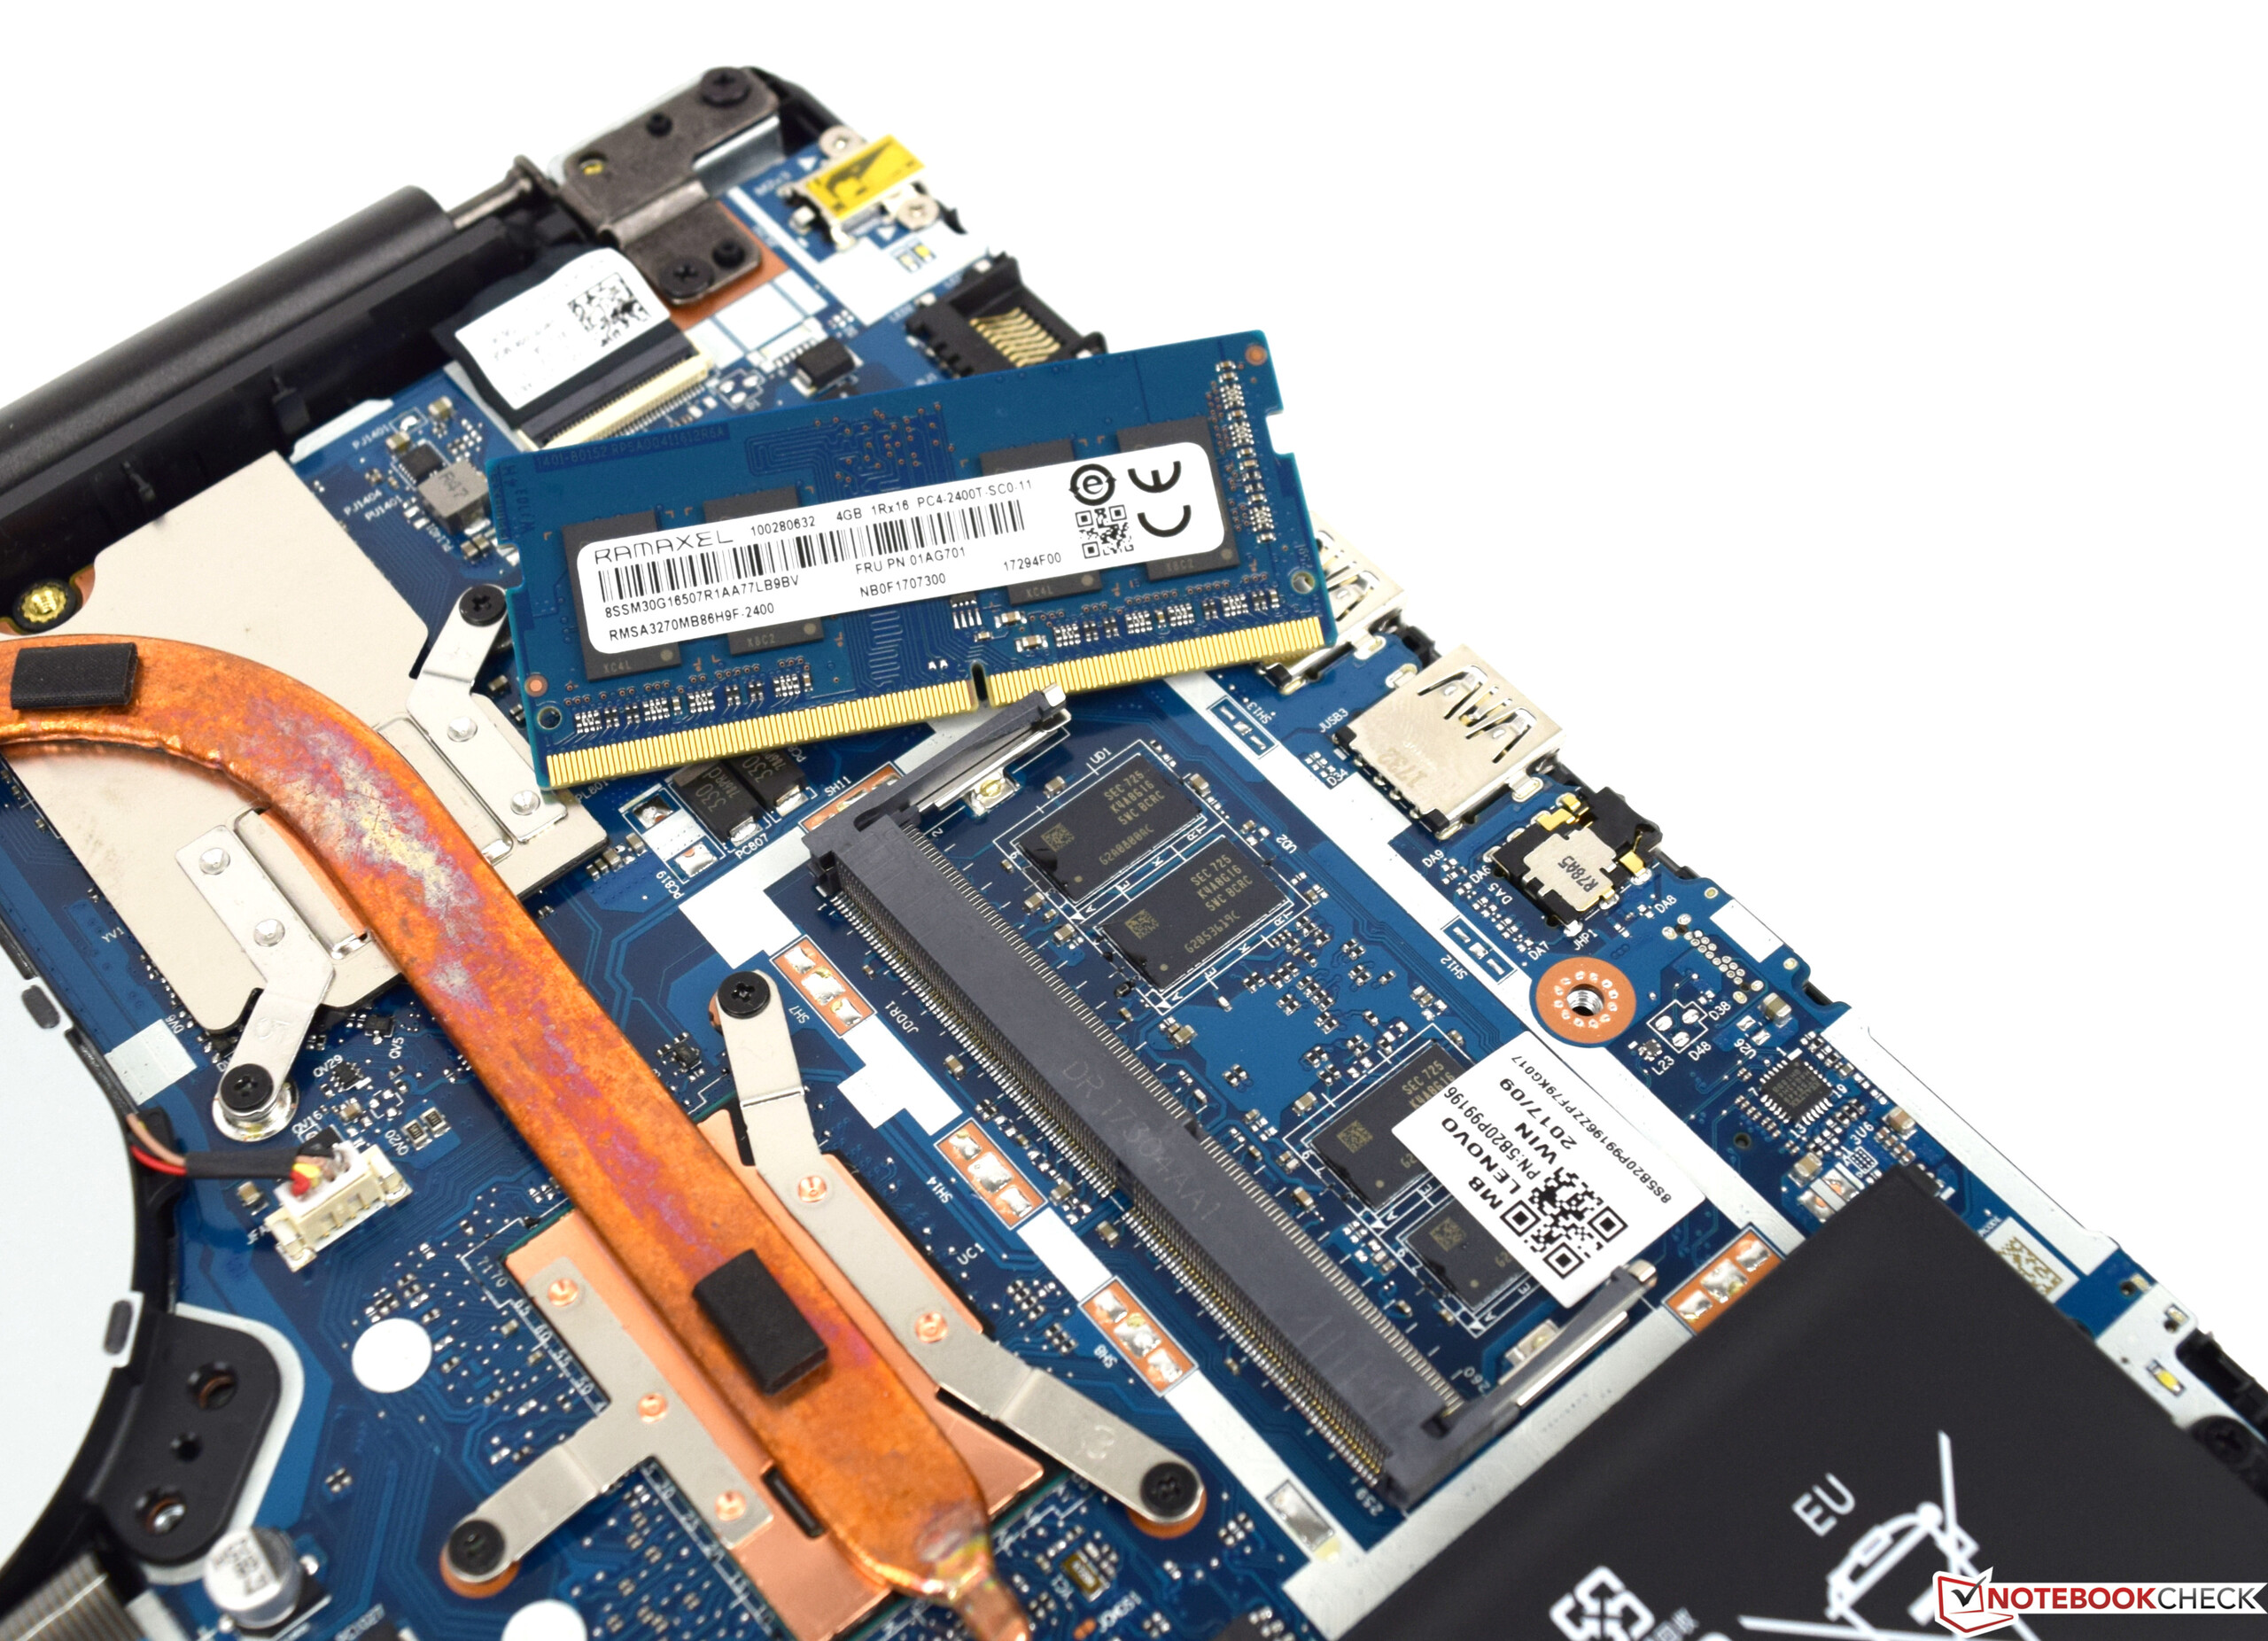
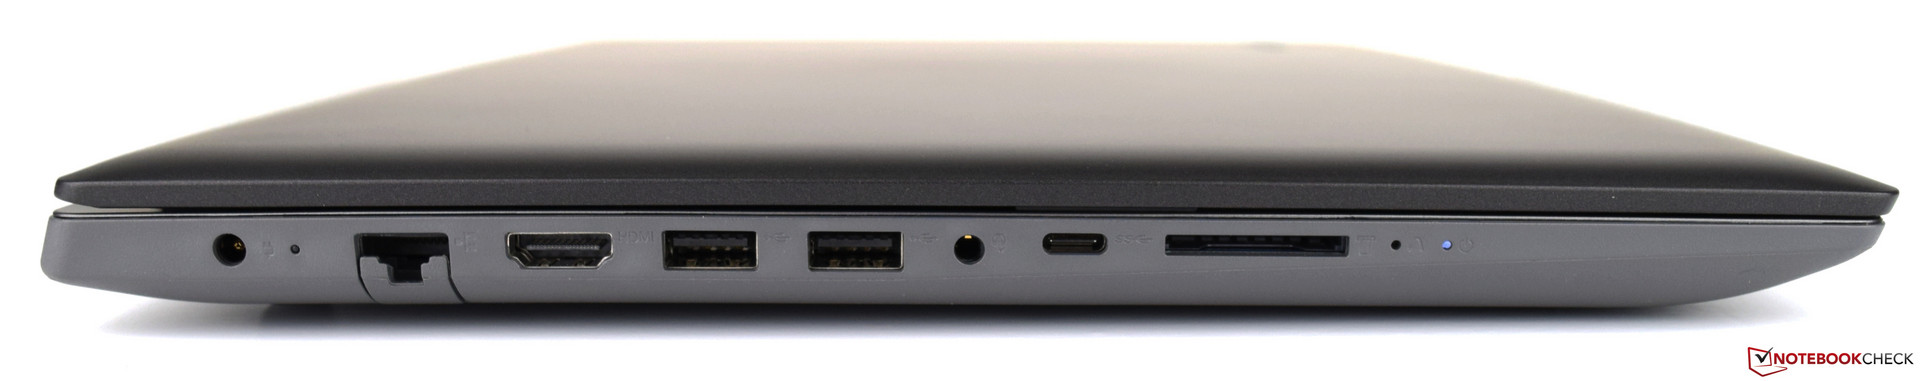
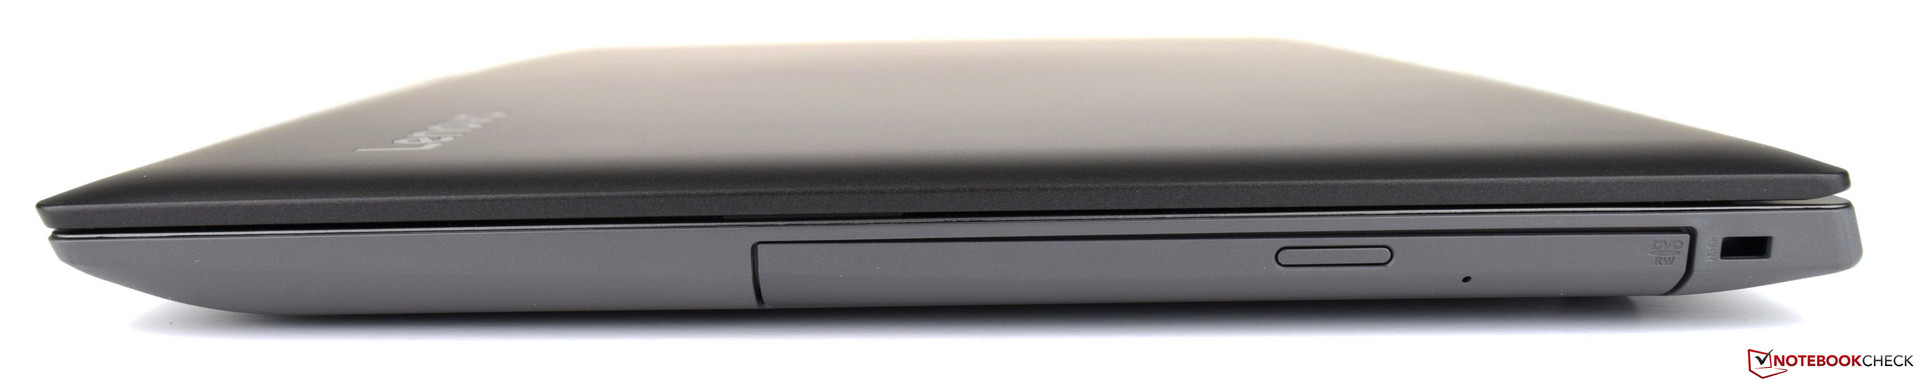
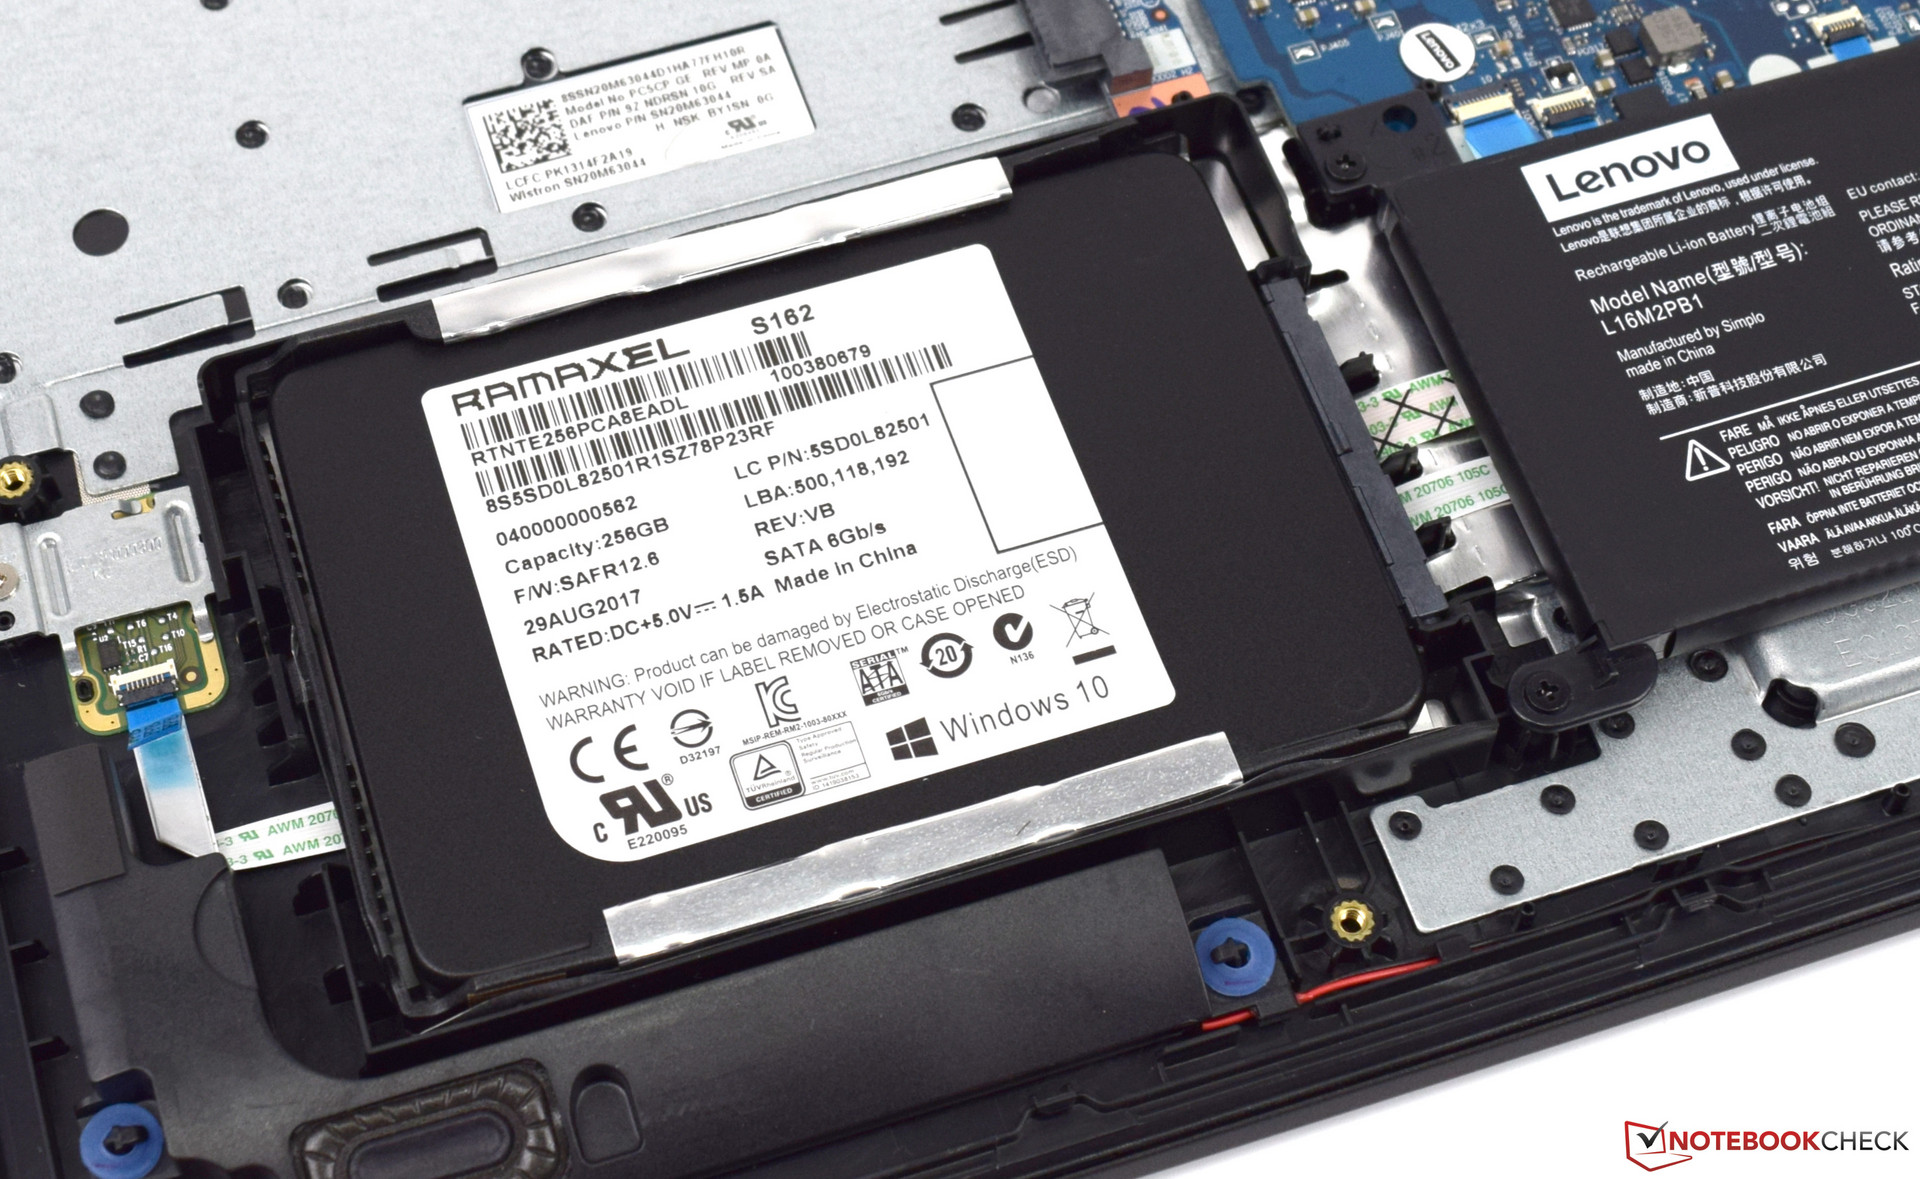
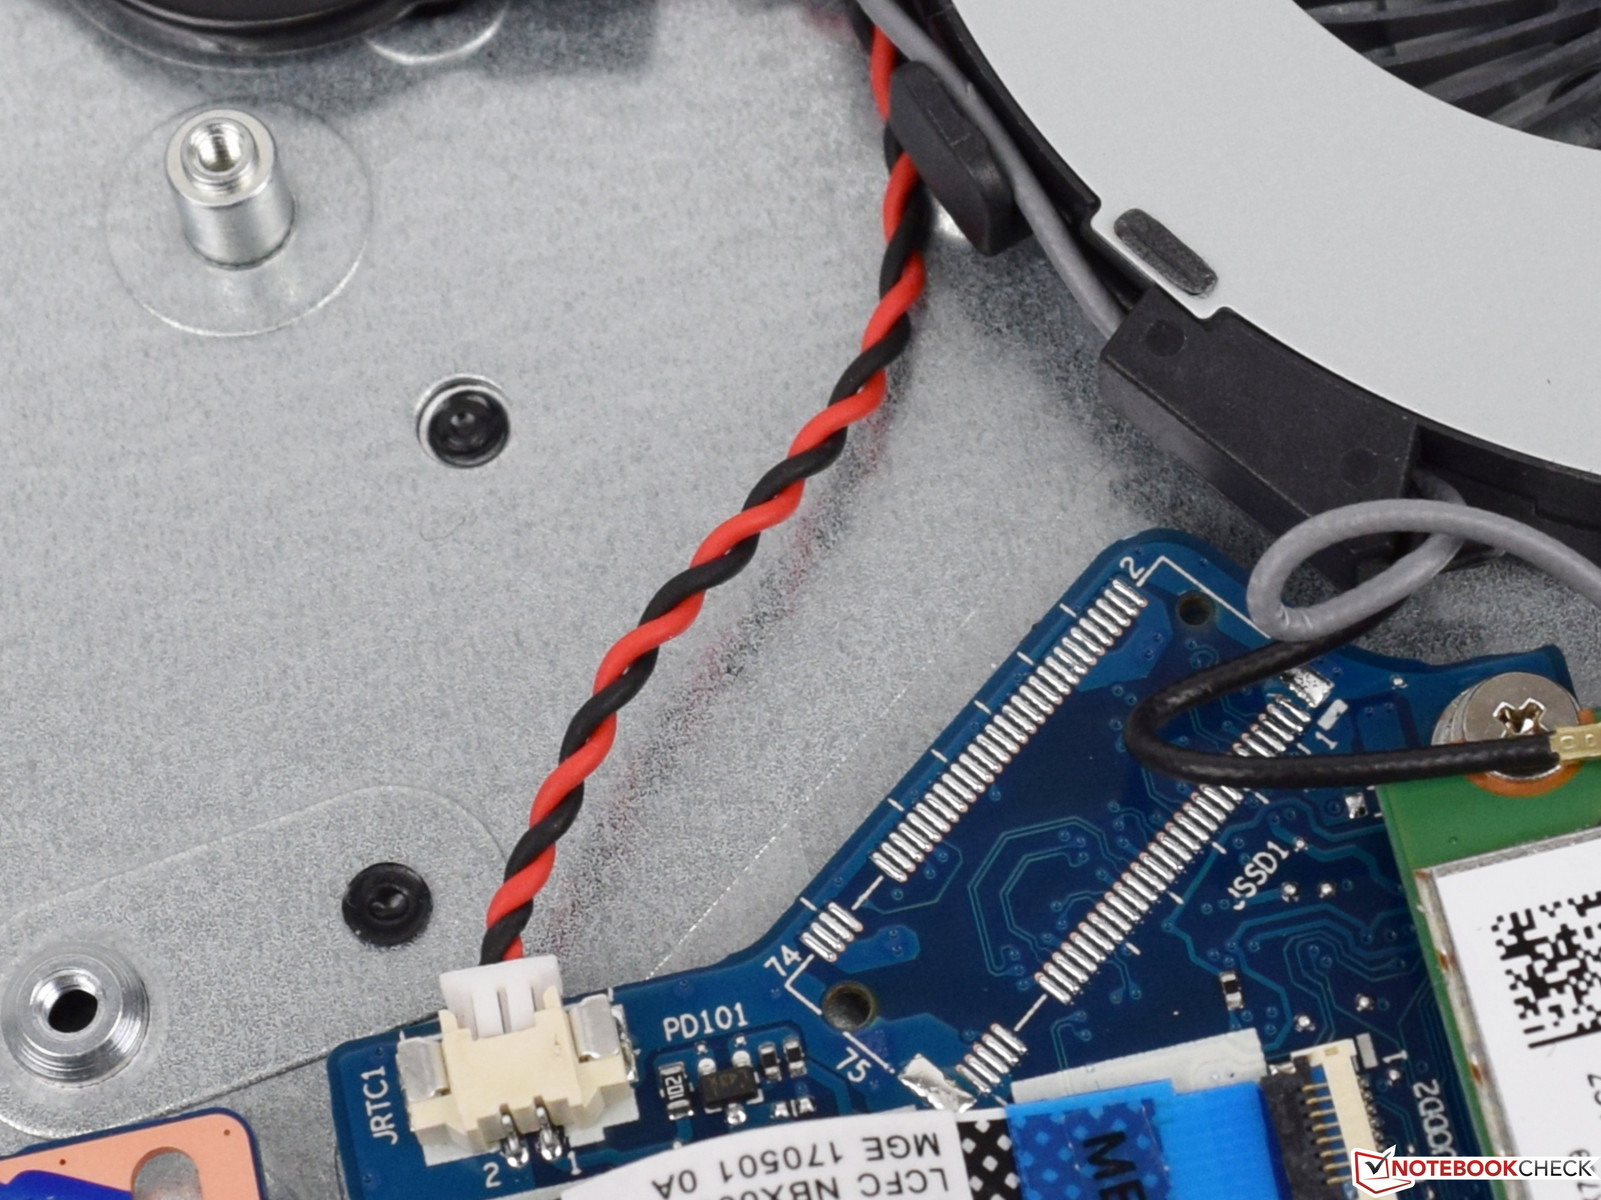
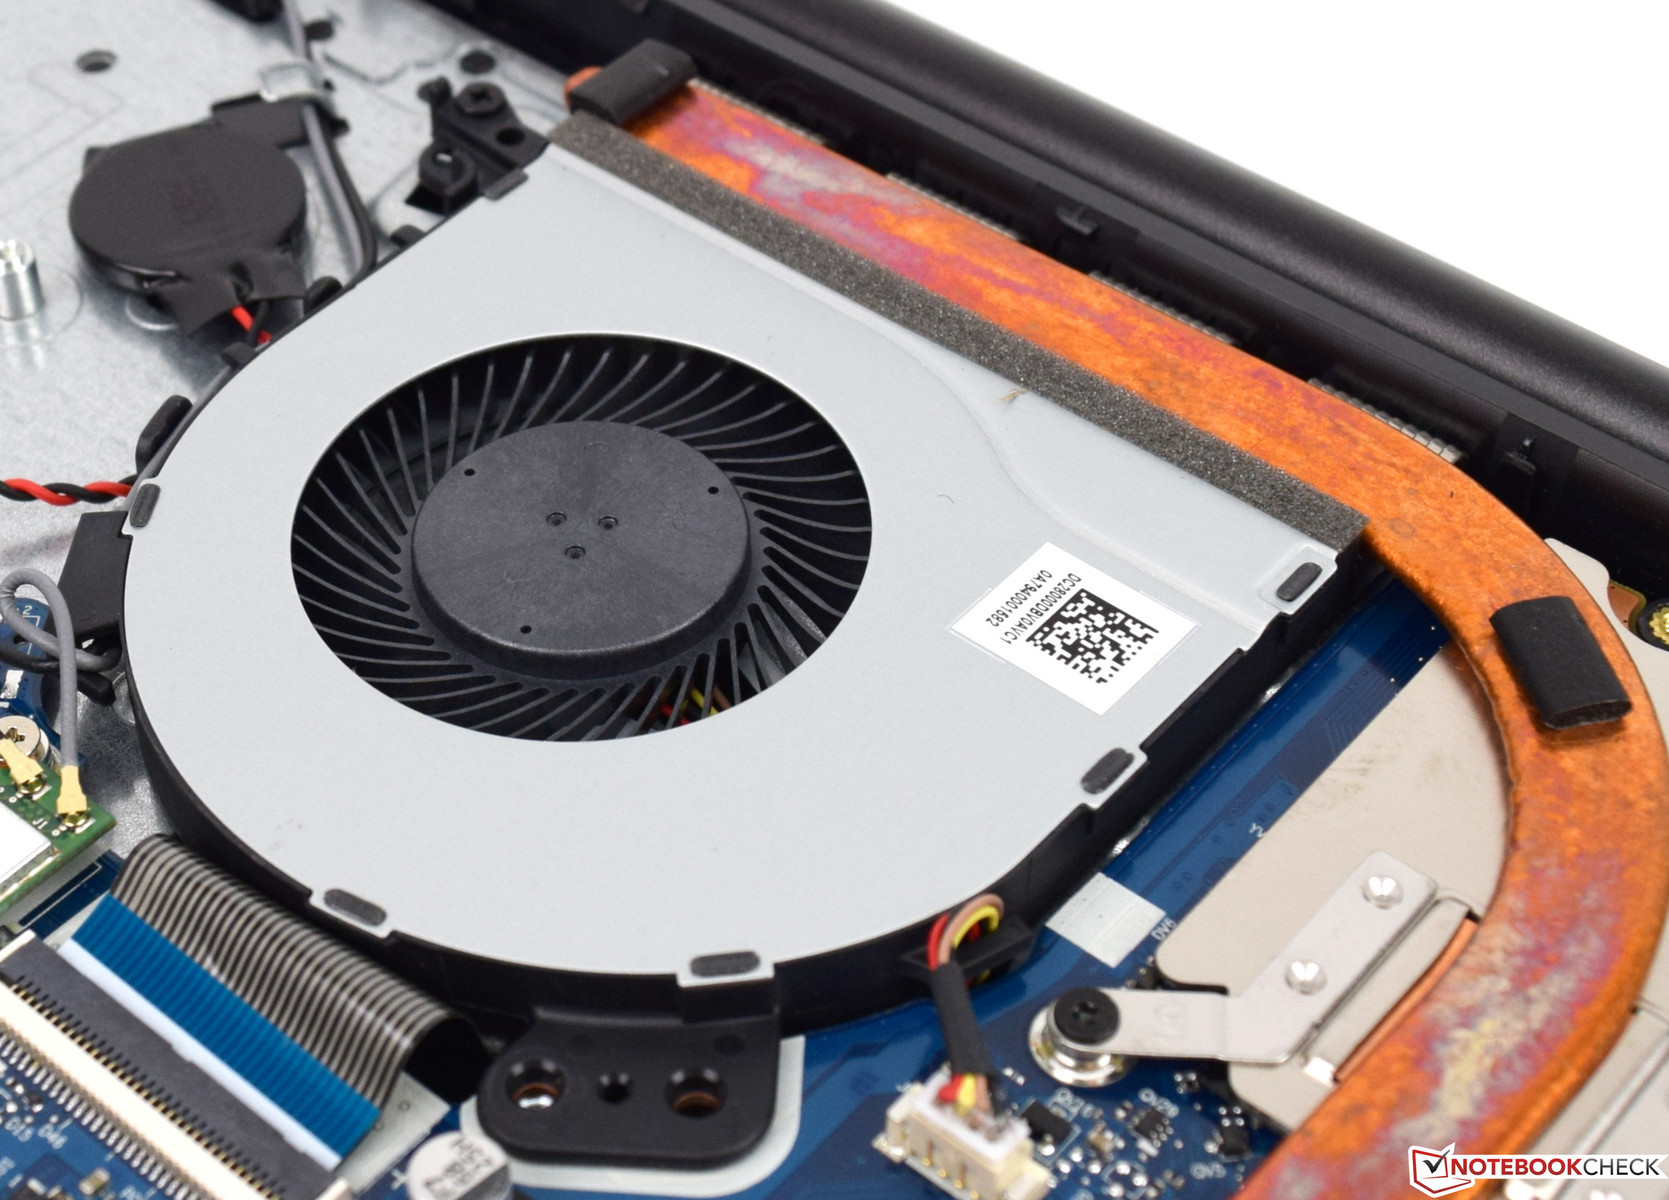
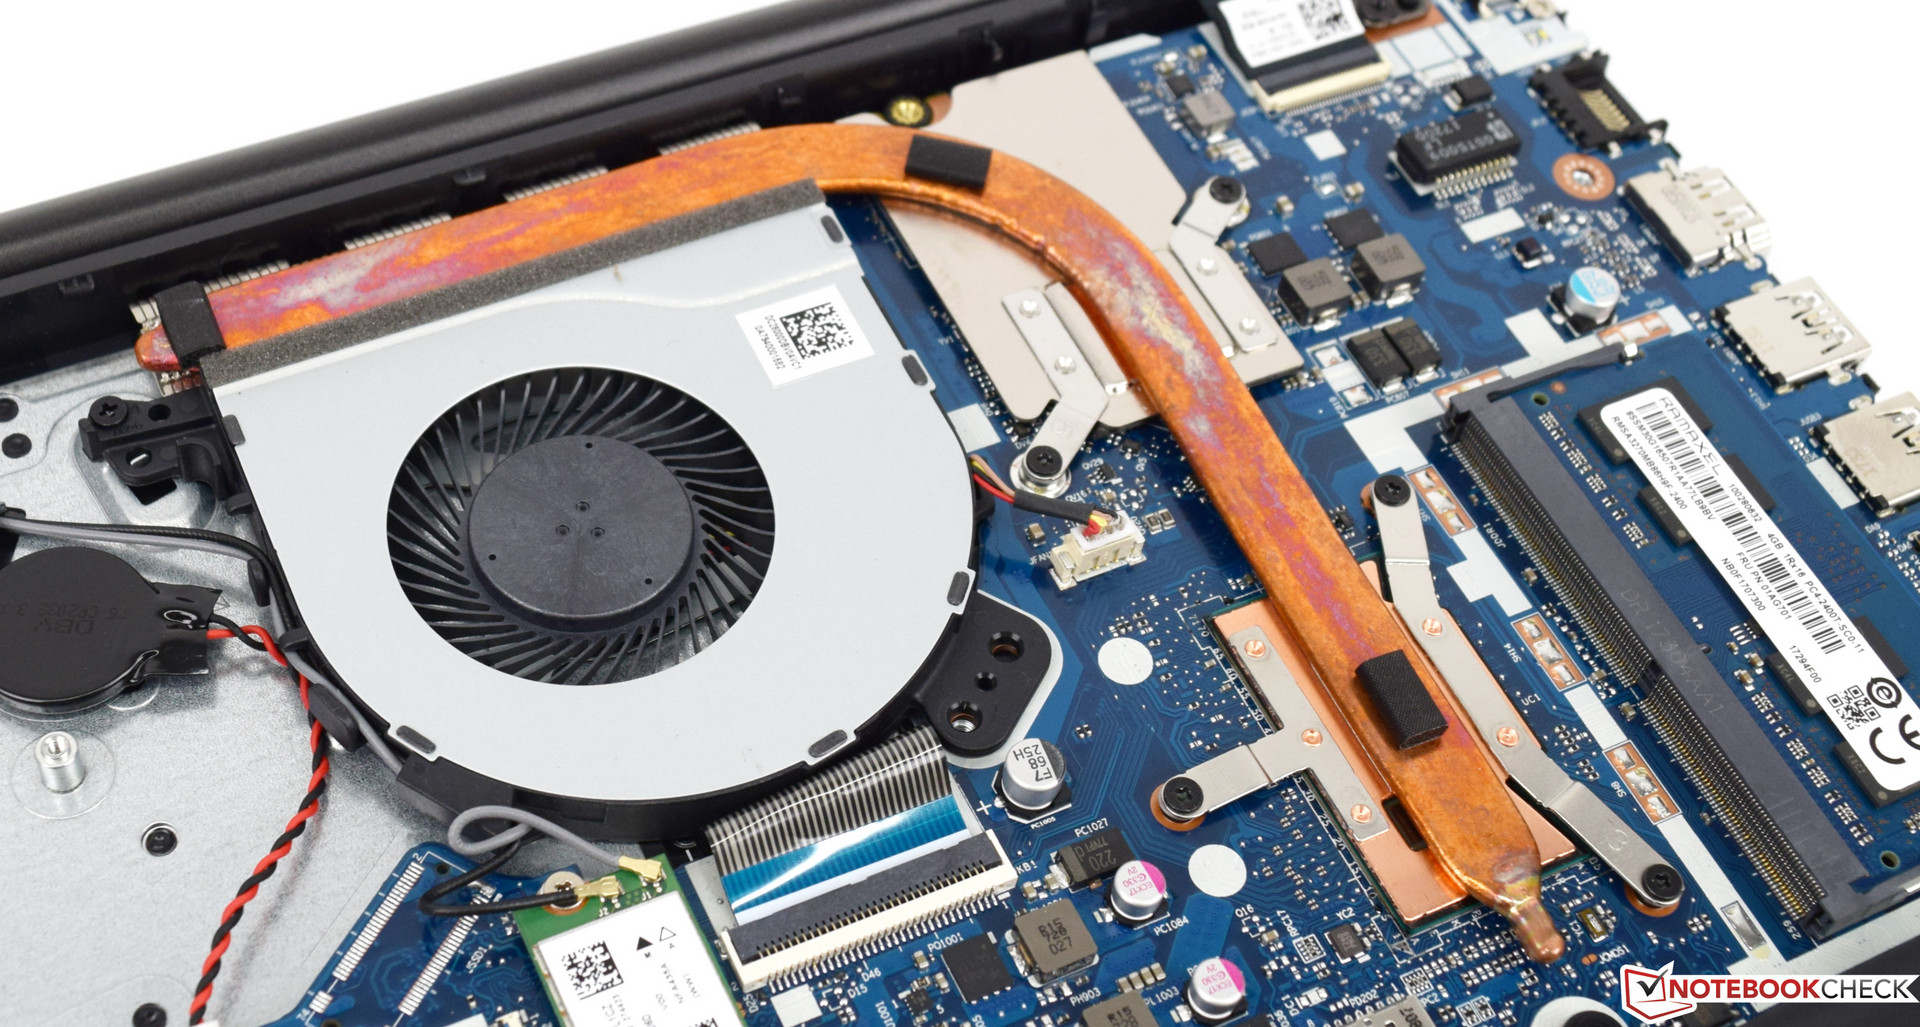
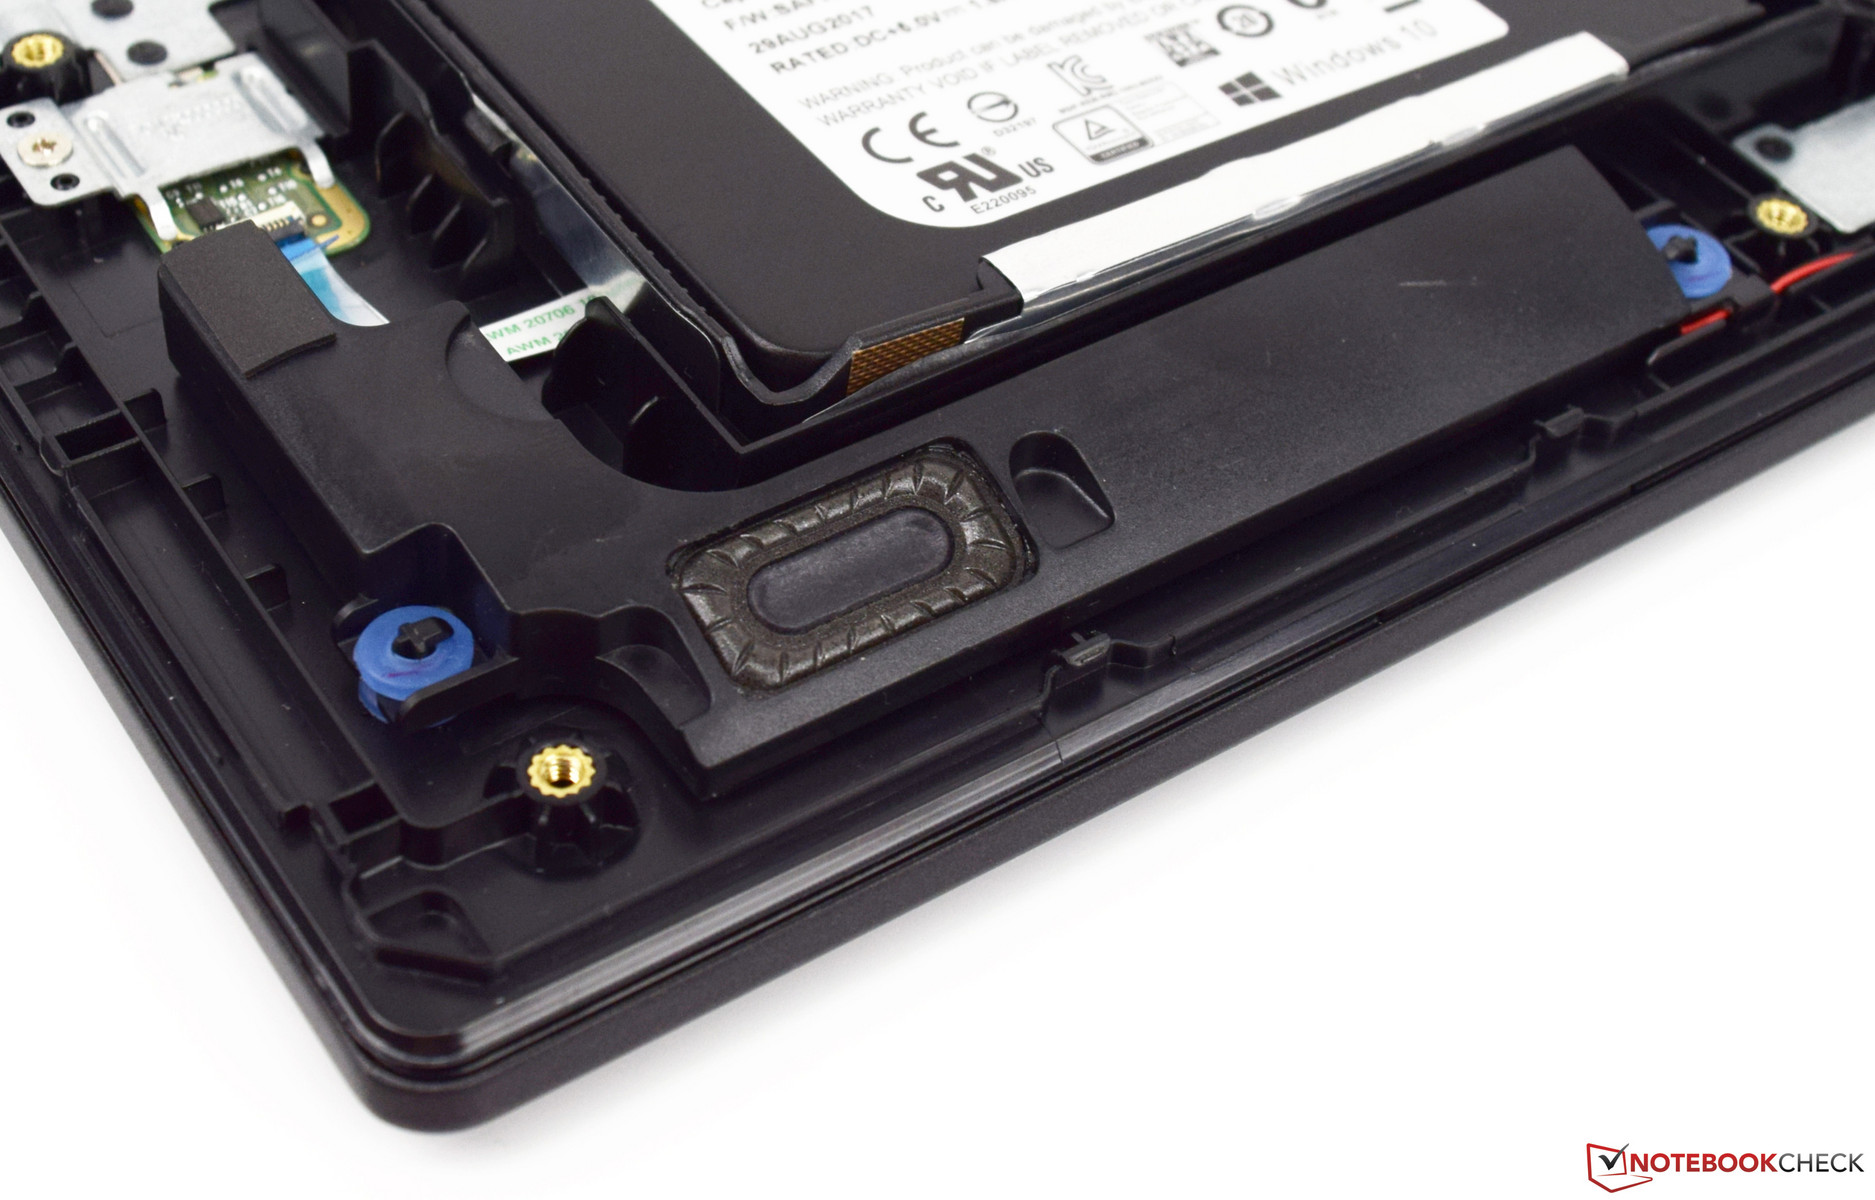
L'SSD è una buona aggiunta al sistema. Tuttavia se non fate attenzione non sarete in grado di montare un secondo drive. Se volete prendere la configurazione con SSD ed HDD, sarete premiati dalla presenza di un ulteriore slot M.2. Cosa che manca nel nostro modello. Il processore si comporta bene ed offre un netto miglioramento rispetto alla versione precedente. Lo stesso possiamo dirlo per la GeForce MX150, che è paragonabile alla GeForce GTX 950M. Il produttore avrebbe dovuto riconsiderare la scelta delle porte - avremmo preferito una ulteriore porta USB ed una porta USB Type-C con supporto Thunderbolt 3. Questo avrebbe migliorato molto la situazione ed ampliato l'area di utilizzo di questo dispositivo.
A primo impatto, il Lenovo IdeaPad 320-15IKB sembra un buon tuttofare. Tuttavia, il display richiede un evidente compromesso.
Nota: si tratta di una recensione breve, con alcune sezioni non tradotte, per la versione integrale in inglese guardate qui.
Lenovo IdeaPad 320-15IKBRN 81BG001KGE
- 02/08/2018 v6 (old)
Sebastian Bade
Price comparison
