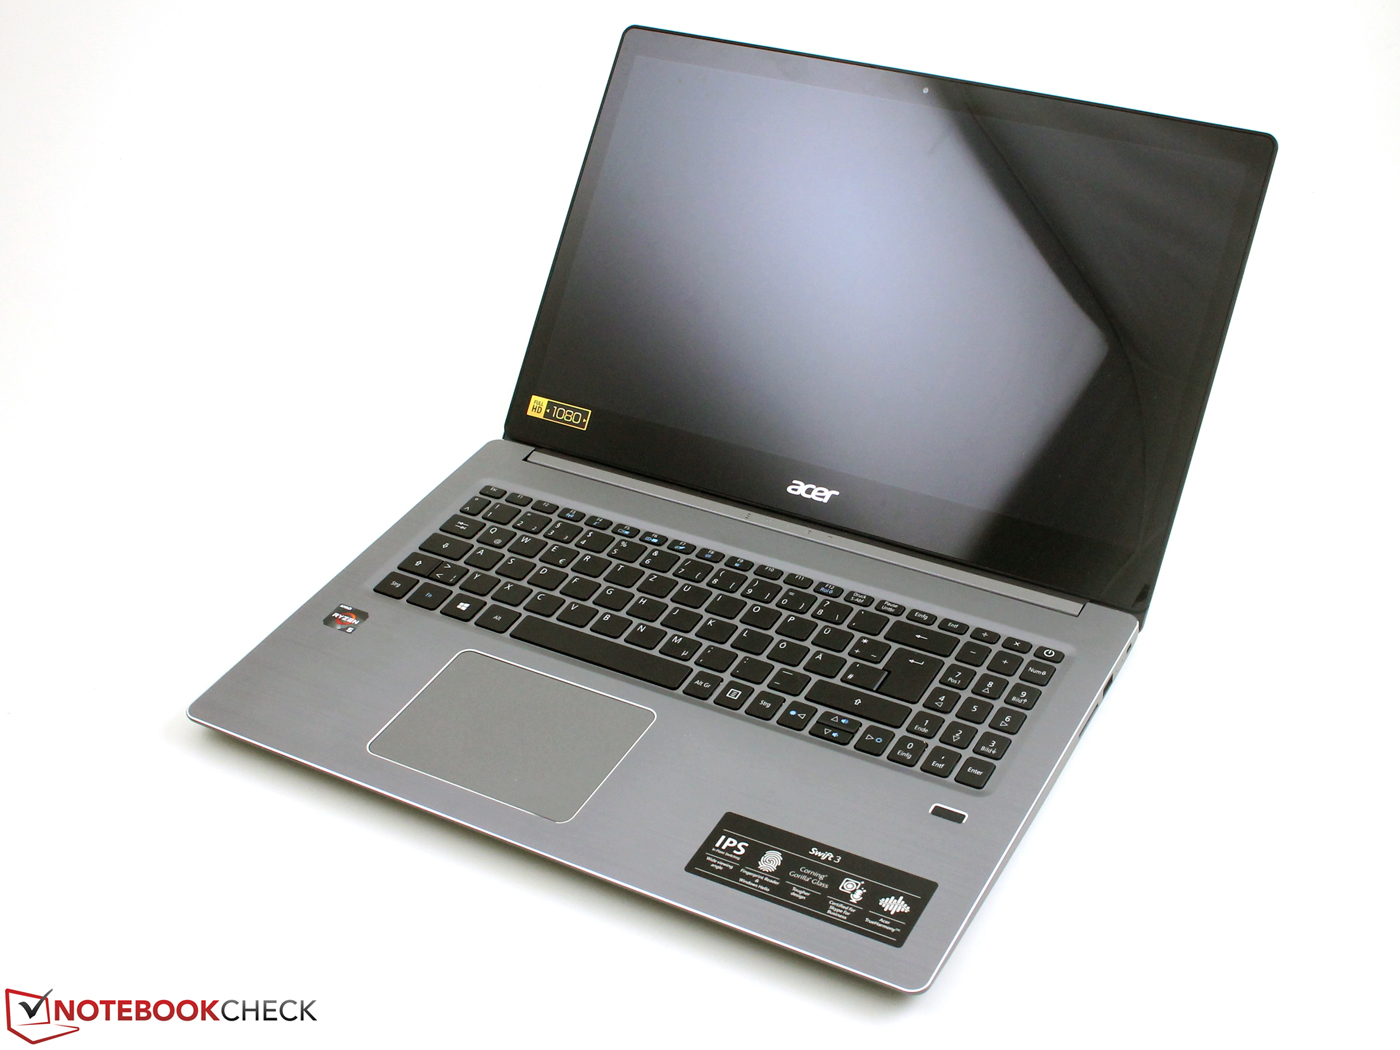
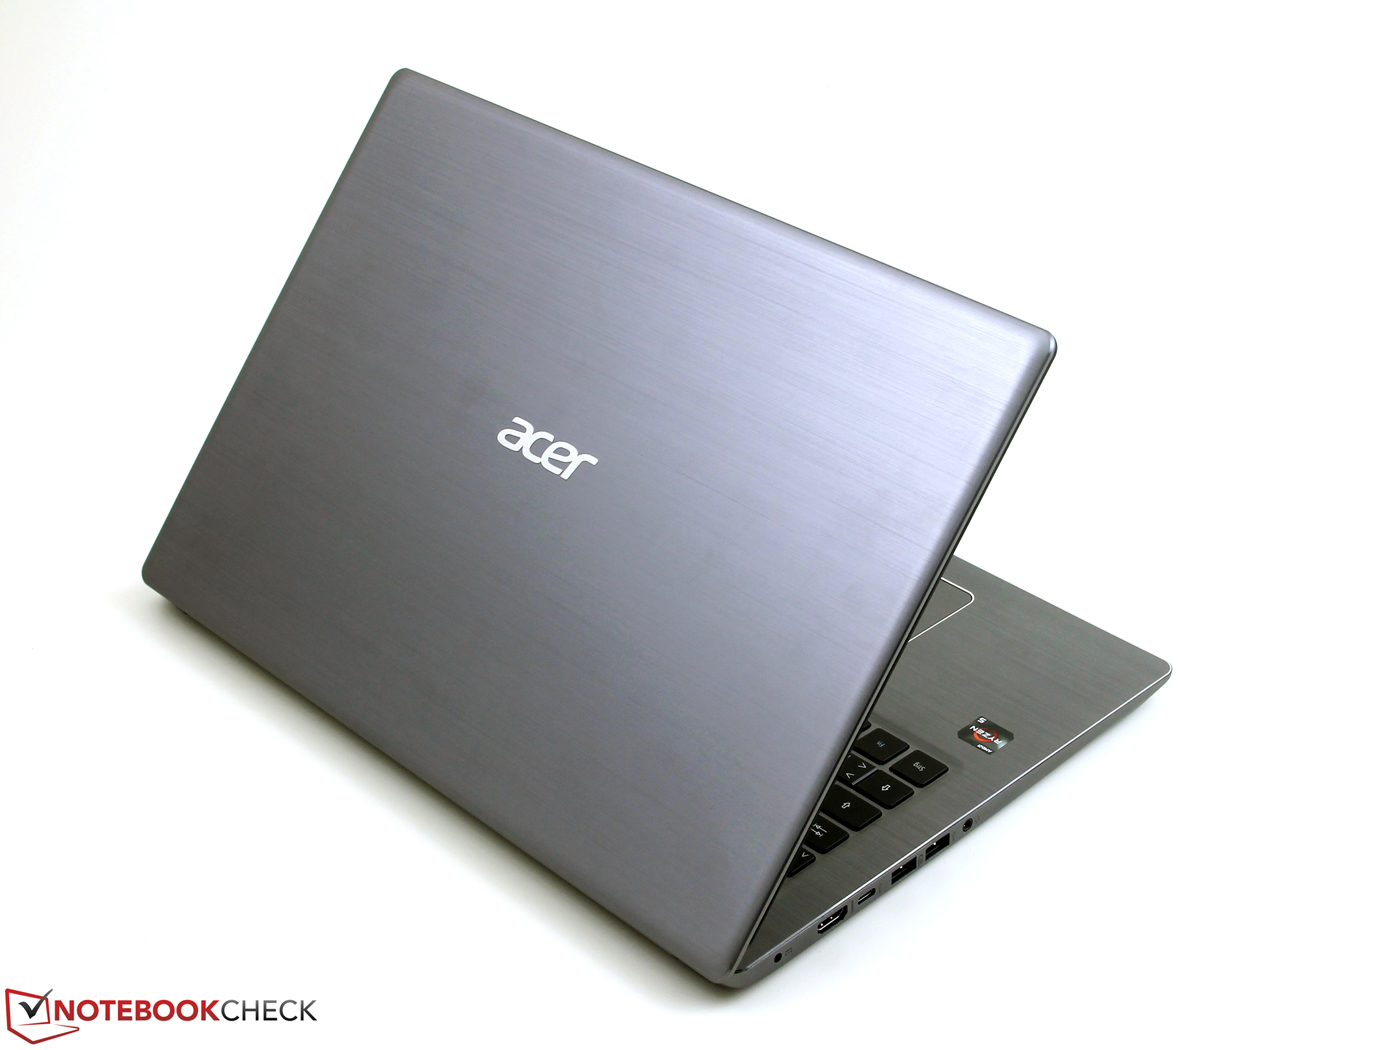
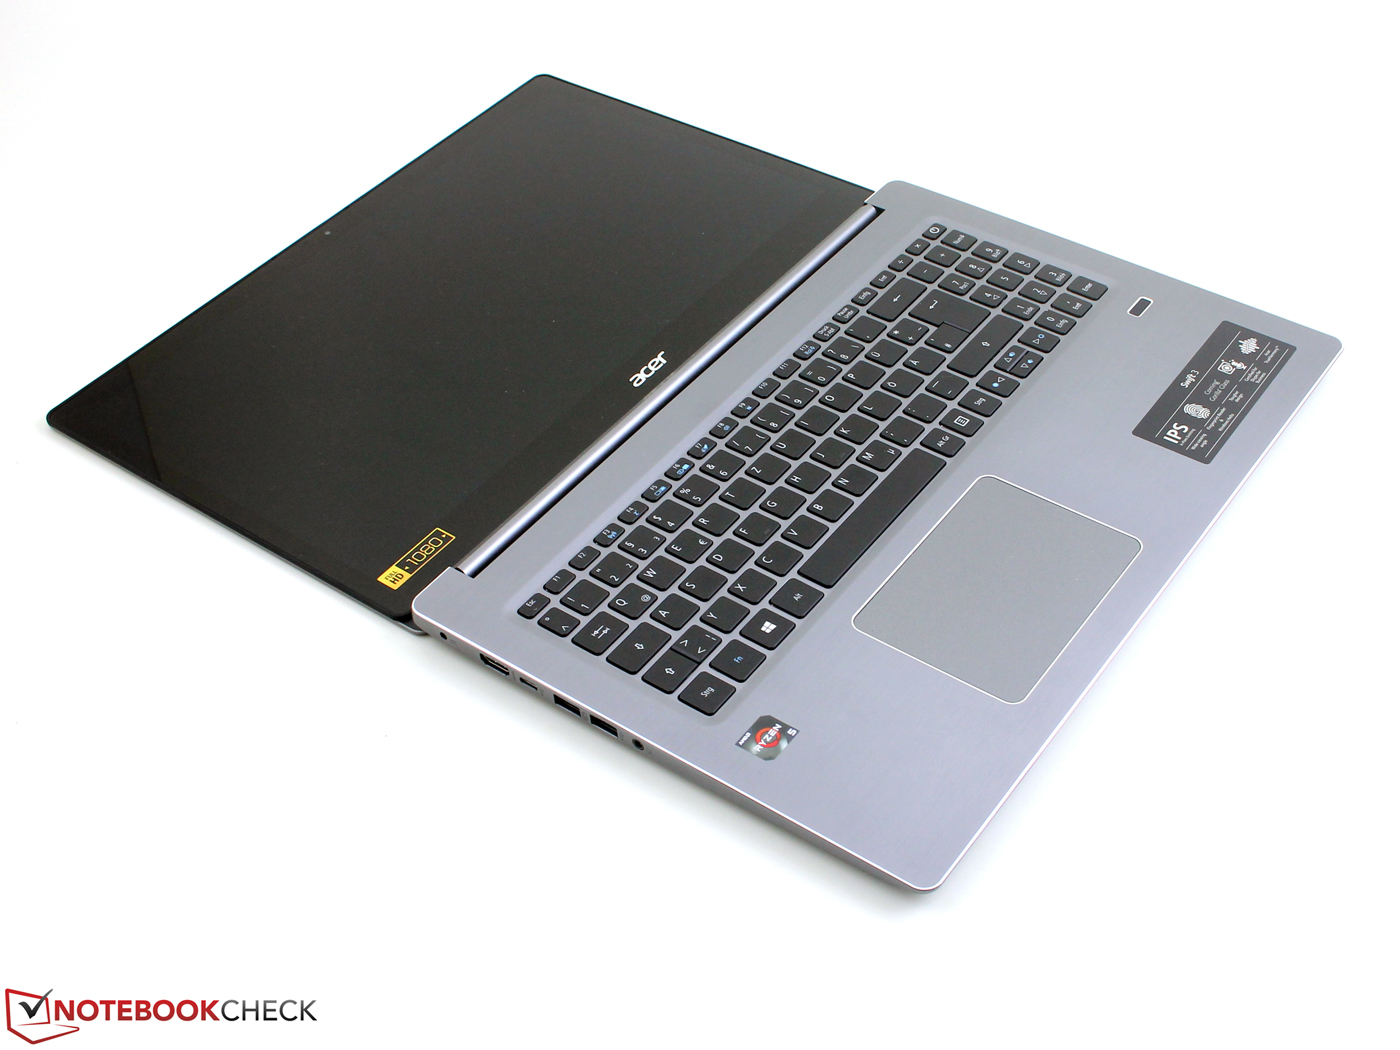
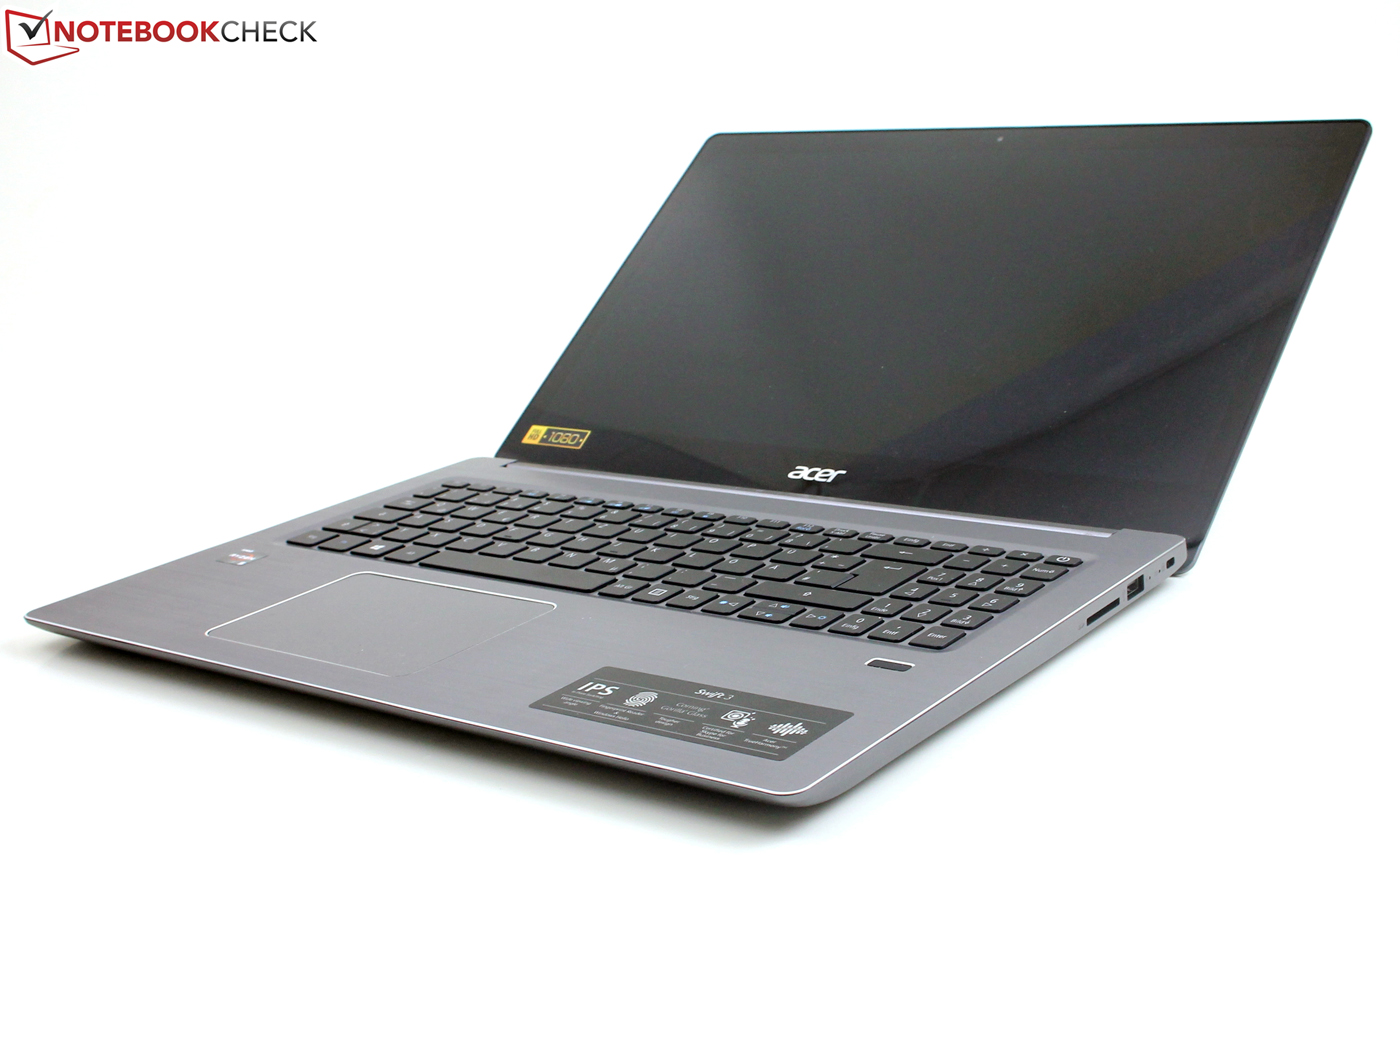
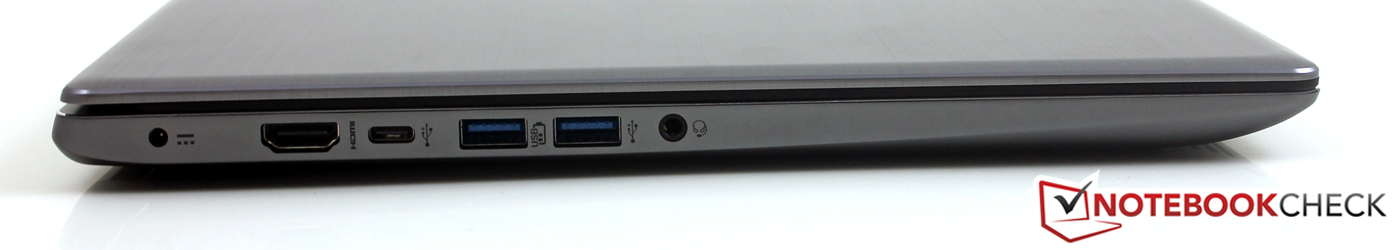
Recensione breve del laptop Acer Swift 3 SF315 (Ryzen 5 2500U, Vega 8, 256 GB, FHD)
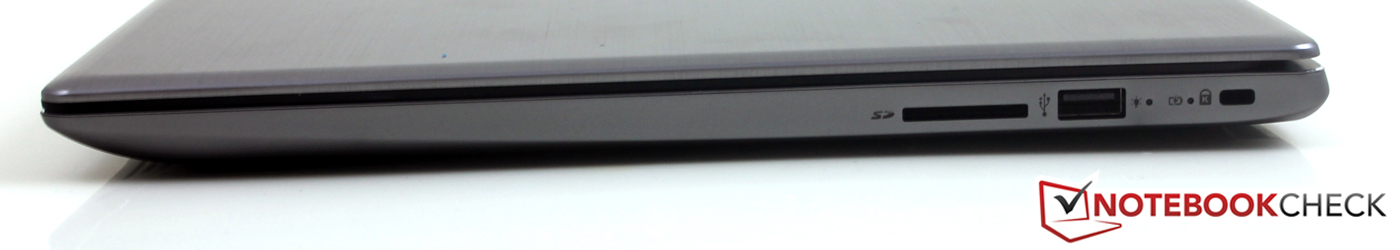
| SD Card Reader | |
| average JPG Copy Test (av. of 3 runs) | |
| HP Spectre x360 15t-bl100 (Toshiba Exceria Pro SDXC 64 GB UHS-II) | |
| HP Pavilion 15-cc107ng (Toshiba Exceria Pro SDXC 64 GB UHS-II) | |
| Acer Aspire 5 A515-51G-51RL (Toshiba Exceria Pro SDXC 64 GB UHS-II) | |
| Acer Swift 3 SF315-41-R4W1 | |
| Dell Inspiron 15 7570 (Toshiba Exceria Pro SDXC 64 GB UHS-II) | |
| Acer Swift 3 SF315-51G-57E5 (Toshiba Exceria Pro SDXC 64 GB UHS-II) | |
| maximum AS SSD Seq Read Test (1GB) | |
| HP Spectre x360 15t-bl100 (Toshiba Exceria Pro SDXC 64 GB UHS-II) | |
| HP Pavilion 15-cc107ng (Toshiba Exceria Pro SDXC 64 GB UHS-II) | |
| Acer Aspire 5 A515-51G-51RL (Toshiba Exceria Pro SDXC 64 GB UHS-II) | |
| Acer Swift 3 SF315-41-R4W1 | |
| Dell Inspiron 15 7570 (Toshiba Exceria Pro SDXC 64 GB UHS-II) | |
| Acer Swift 3 SF315-51G-57E5 (Toshiba Exceria Pro SDXC 64 GB UHS-II) | |
| |||||||||||||||||||||||||
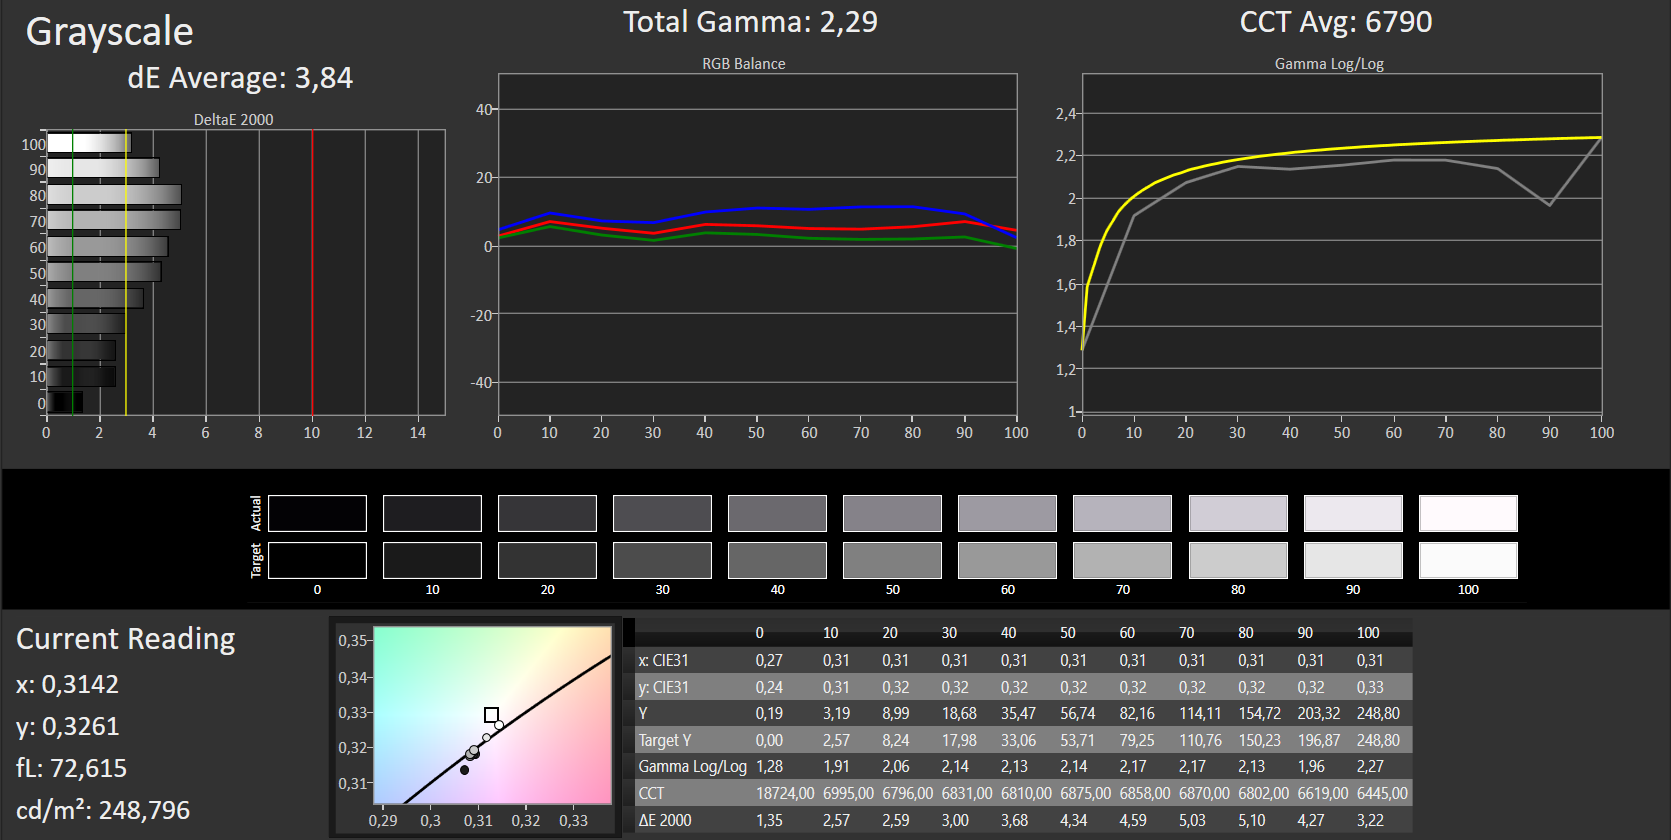
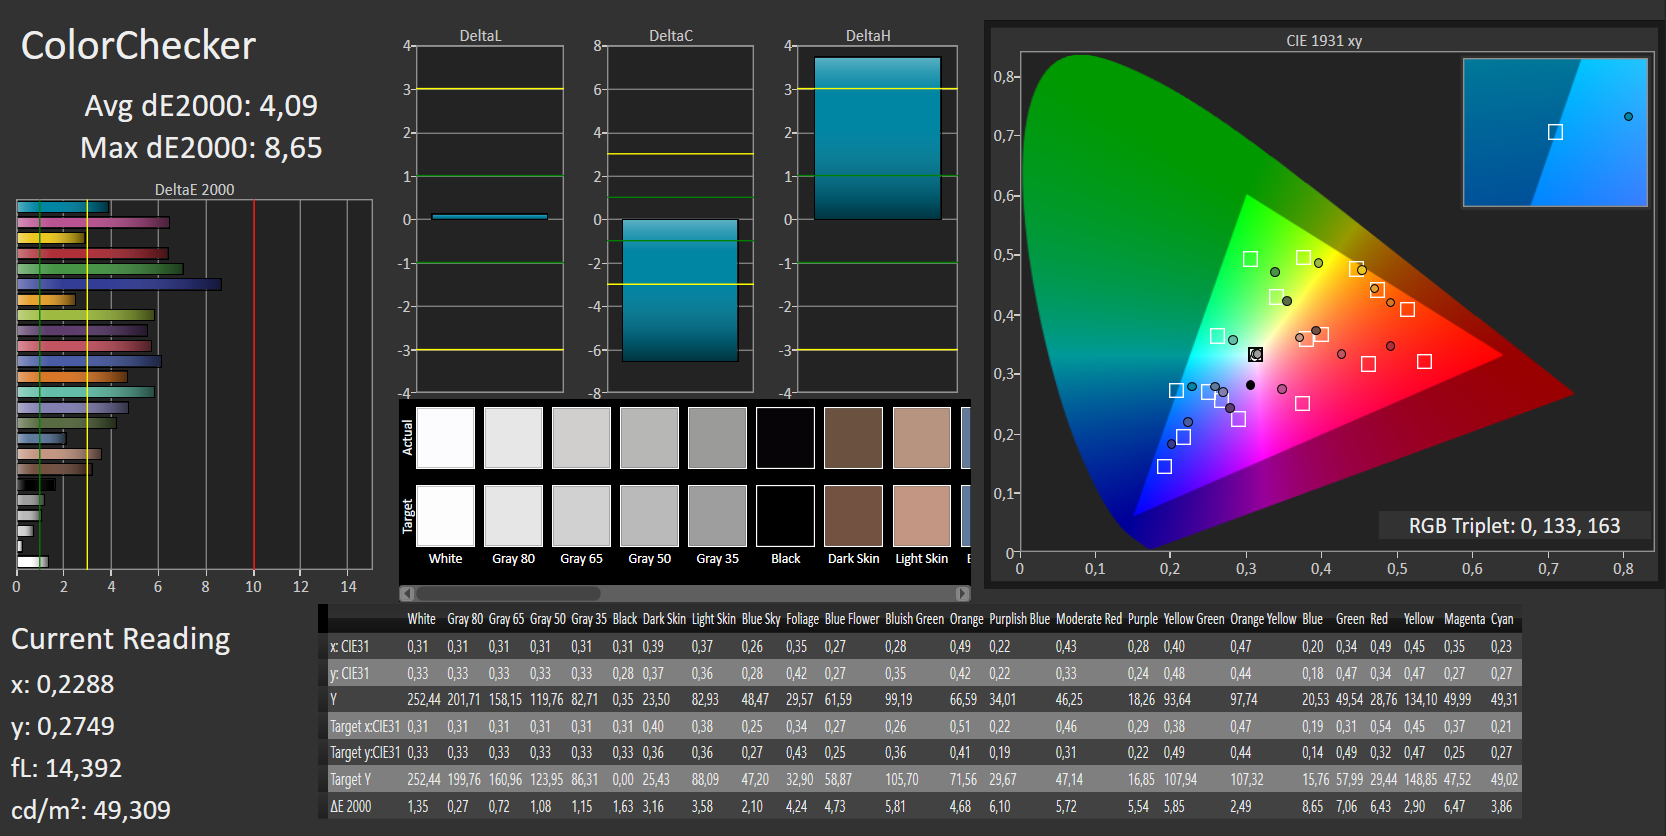
Distribuzione della luminosità: 88 %
Al centro con la batteria: 237 cd/m²
Contrasto: 1247:1 (Nero: 0.19 cd/m²)
ΔE ColorChecker Calman: 4.85 | ∀{0.5-29.43 Ø4.71}
ΔE Greyscale Calman: 3.84 | ∀{0.09-98 Ø4.96}
58% sRGB (Argyll 1.6.3 3D)
37% AdobeRGB 1998 (Argyll 1.6.3 3D)
40.9% AdobeRGB 1998 (Argyll 3D)
58.5% sRGB (Argyll 3D)
39.59% Display P3 (Argyll 3D)
Gamma: 2.42
CCT: 6790 K
| Acer Swift 3 SF315-41-R4W1 BOE CQ NV156FHM-N48, , 1920x1080, 15.6" | HP Spectre x360 15t-bl100 BOE06C3, , 3840x2160, 15.6" | Acer Aspire 5 A515-51G-51RL AU Optronics B156HAN06.1, , 1920x1080, 15.6" | HP Pavilion 15-cc107ng AU Optronics, , 1920x1080, 15.6" | Dell Inspiron 15 7570 BOE06B4, , 1920x1080, 15.6" | Acer Swift 3 SF315-51G-57E5 BOE NV156FHM-N48, , 1920x1080, 15.6" | |
|---|---|---|---|---|---|---|
| Display | 57% | -3% | -5% | 2% | 1% | |
| Display P3 Coverage (%) | 39.59 | 66.6 68% | 38.3 -3% | 37.28 -6% | 40.43 2% | 39.86 1% |
| sRGB Coverage (%) | 58.5 | 86.9 49% | 57.6 -2% | 56.1 -4% | 60 3% | 58.7 0% |
| AdobeRGB 1998 Coverage (%) | 40.9 | 63.5 55% | 39.57 -3% | 38.51 -6% | 41.77 2% | 41.18 1% |
| Response Times | 14% | 20% | 33% | 5% | 10% | |
| Response Time Grey 50% / Grey 80% * (ms) | 46 ? | 41.2 ? 10% | 41 ? 11% | 45 ? 2% | 45 ? 2% | 42 ? 9% |
| Response Time Black / White * (ms) | 36 ? | 29.6 ? 18% | 26 ? 28% | 13 ? 64% | 33 ? 8% | 32 ? 11% |
| PWM Frequency (Hz) | 21000 ? | 1000 | 996 ? | 21000 ? | ||
| Screen | 11% | 3% | -71% | 9% | -3% | |
| Brightness middle (cd/m²) | 237 | 338.7 43% | 235 -1% | 234 -1% | 255 8% | 248 5% |
| Brightness (cd/m²) | 229 | 325 42% | 236 3% | 230 0% | 240 5% | 237 3% |
| Brightness Distribution (%) | 88 | 91 3% | 80 -9% | 76 -14% | 91 3% | 79 -10% |
| Black Level * (cd/m²) | 0.19 | 0.28 -47% | 0.17 11% | 0.34 -79% | 0.16 16% | 0.21 -11% |
| Contrast (:1) | 1247 | 1210 -3% | 1382 11% | 688 -45% | 1594 28% | 1181 -5% |
| Colorchecker dE 2000 * | 4.85 | 4.9 -1% | 4.69 3% | 12.19 -151% | 4.74 2% | 4.98 -3% |
| Colorchecker dE 2000 max. * | 8.34 | 8.7 -4% | 7.9 5% | 20.81 -150% | 7.68 8% | 8.41 -1% |
| Greyscale dE 2000 * | 3.84 | 5.5 -43% | 3.34 13% | 13.99 -264% | 3.44 10% | 4.26 -11% |
| Gamma | 2.42 91% | 2.08 106% | 2.63 84% | 2.32 95% | 2.43 91% | 2.37 93% |
| CCT | 6790 96% | 7498 87% | 6801 96% | 15863 41% | 7064 92% | 7149 91% |
| Color Space (Percent of AdobeRGB 1998) (%) | 37 | 63.5 72% | 36 -3% | 36 -3% | 38 3% | 38 3% |
| Color Space (Percent of sRGB) (%) | 58 | 86.92 50% | 57 -2% | 56 -3% | 60 3% | 58 0% |
| Media totale (Programma / Settaggio) | 27% /
21% | 7% /
4% | -14% /
-44% | 5% /
7% | 3% /
-1% |
* ... Meglio usare valori piccoli

Tempi di risposta del Display
| ↔ Tempi di risposta dal Nero al Bianco | ||
|---|---|---|
| 36 ms ... aumenta ↗ e diminuisce ↘ combinato | ↗ 20 ms Incremento | 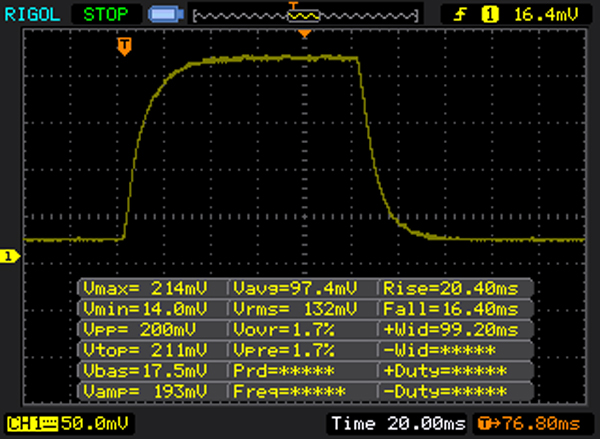 |
| ↘ 16 ms Calo | ||
| Lo schermo mostra tempi di risposta lenti nei nostri tests e sarà insoddisfacente per i gamers. In confronto, tutti i dispositivi di test variano da 0.1 (minimo) a 240 (massimo) ms. » 94 % di tutti i dispositivi è migliore. Questo significa che i tempi di risposta rilevati sono peggiori rispetto alla media di tutti i dispositivi testati (19.8 ms). | ||
| ↔ Tempo di risposta dal 50% Grigio all'80% Grigio | ||
| 46 ms ... aumenta ↗ e diminuisce ↘ combinato | ↗ 25 ms Incremento | 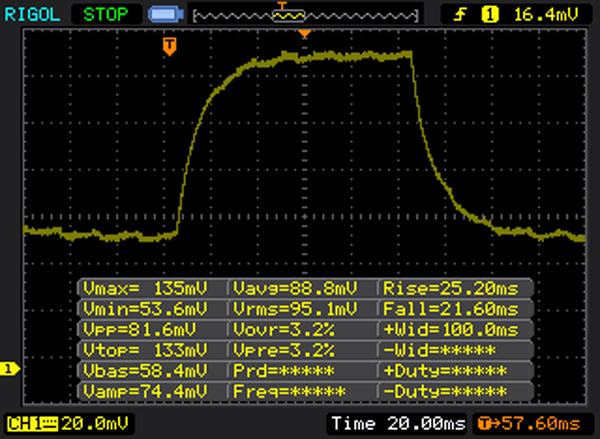 |
| ↘ 21 ms Calo | ||
| Lo schermo mostra tempi di risposta lenti nei nostri tests e sarà insoddisfacente per i gamers. In confronto, tutti i dispositivi di test variano da 0.165 (minimo) a 636 (massimo) ms. » 79 % di tutti i dispositivi è migliore. Questo significa che i tempi di risposta rilevati sono peggiori rispetto alla media di tutti i dispositivi testati (30.9 ms). | ||
Sfarfallio dello schermo / PWM (Pulse-Width Modulation)
| flickering dello schermo / PWM rilevato | 21000 Hz | ≤ 90 % settaggio luminosita' | 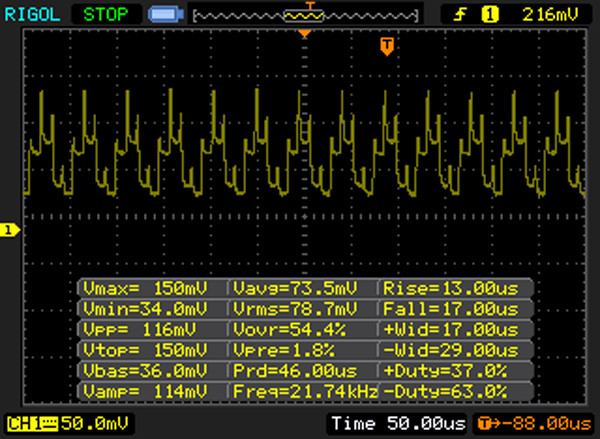 |
Il display sfarfalla a 21000 Hz (Probabilmente a causa dell'uso di PWM) Flickering rilevato ad una luminosita' di 90 % o inferiore. Non dovrebbe verificarsi flickering o PWM sopra questo valore di luminosita'. La frequenza di 21000 Hz è abbastanza alta, quindi la maggioranza degli utenti sensibili al PWM non dovrebbero notare alcun flickering. In confronto: 52 % di tutti i dispositivi testati non utilizza PWM per ridurre la luminosita' del display. Se è rilevato PWM, una media di 7741 (minimo: 5 - massimo: 343500) Hz è stata rilevata. | |||
| PCMark 8 Home Score Accelerated v2 | 3450 punti | |
| PCMark 8 Creative Score Accelerated v2 | 3577 punti | |
| PCMark 8 Work Score Accelerated v2 | 3797 punti | |
| PCMark 10 Score | 2501 punti | |
Aiuto | ||
| Acer Swift 3 SF315-41-R4W1 Intel SSD 600p SSDPEKKW256G7 | Acer Swift 3 SF315-51G-57E5 Hynix HFS128G39TND | HP Spectre x360 15t-bl100 Samsung PM961 NVMe MZVLW512HMJP | Acer Aspire 5 A515-51G-51RL Kingston RBUSNS8180DS3128GH | HP Pavilion 15-cc107ng SanDisk SD8SN8U256G1006 | Dell Inspiron 15 7570 Samsung PM961 NVMe MZVLW512HMJP | |
|---|---|---|---|---|---|---|
| CrystalDiskMark 3.0 | -24% | 118% | -33% | -21% | 96% | |
| Read Seq (MB/s) | 1130 | 481.5 -57% | 1248 10% | 407.5 -64% | 475.4 -58% | 2013 78% |
| Write Seq (MB/s) | 601 | 131.5 -78% | 1476 146% | 283.5 -53% | 453.5 -25% | 1015 69% |
| Read 512 (MB/s) | 837 | 324.8 -61% | 849 1% | 282.4 -66% | 345.2 -59% | 1076 29% |
| Write 512 (MB/s) | 606 | 130.6 -78% | 1118 84% | 72.7 -88% | 299.1 -51% | 1038 71% |
| Read 4k (MB/s) | 20.46 | 30.81 51% | 58.8 187% | 26.81 31% | 27.8 36% | 52.1 155% |
| Write 4k (MB/s) | 81.7 | 84.8 4% | 155.2 90% | 73.7 -10% | 54.2 -34% | 135 65% |
| Read 4k QD32 (MB/s) | 235.5 | 345 46% | 645 174% | 294.8 25% | 250.9 7% | 404.2 72% |
| Write 4k QD32 (MB/s) | 155 | 131.6 -15% | 547 253% | 89.6 -42% | 181.8 17% | 510 229% |

| 3DMark 06 1024x768 Score | 12775 punti | |
| 3DMark Vantage P Result | 9555 punti | |
| 3DMark 11 Performance | 3521 punti | |
| 3DMark Ice Storm Standard Score | 60920 punti | |
| 3DMark Cloud Gate Standard Score | 10542 punti | |
| 3DMark Fire Strike Score | 1928 punti | |
Aiuto | ||
| Rise of the Tomb Raider - 1024x768 Lowest Preset | |
| HP Spectre x360 15t-bl100 | |
| Acer Aspire 5 A515-51G-51RL | |
| HP Envy x360 15m-bq121dx | |
| Acer Swift 3 SF315-41-R4W1 | |
| Dell Inspiron 15 7570 | |
| Deus Ex Mankind Divided - 1280x720 Low Preset AF:1x | |
| Acer Aspire 5 A515-51G-51RL | |
| Acer Swift 3 SF315-41-R4W1 | |
| F1 2017 - 1920x1080 Medium Preset AF:4x | |
| HP Envy x360 15m-bq121dx | |
| Acer Swift 3 SF315-41-R4W1 | |
| Middle-earth: Shadow of War - 1280x720 Lowest Preset | |
| Acer Swift 3 SF315-41-R4W1 | |
| Acer Spin 5 SP513-52N-54SF | |
| BioShock Infinite - 1280x720 Very Low Preset | |
| HP Spectre x360 15t-bl100 | |
| Acer Aspire 5 A515-51G-51RL | |
| Acer Swift 3 SF315-51G-57E5 | |
| HP Envy x360 15m-bq121dx | |
| Acer Swift 3 SF315-41-R4W1 | |
| HP Pavilion 15-cc107ng | |
| Acer Spin 5 SP513-52N-54SF | |
| Metal Gear Solid V - 1920x1080 High / On | |
| HP Envy x360 15m-bq121dx | |
| Acer Swift 3 SF315-41-R4W1 | |
| Acer Spin 5 SP513-52N-54SF | |
| Dirt Rally - 1920x1080 High Preset | |
| Acer Swift 3 SF315-51G-57E5 | |
| Acer Swift 3 SF315-41-R4W1 | |
| Acer Spin 5 SP513-52N-54SF | |
| basso | medio | alto | ultra | |
|---|---|---|---|---|
| StarCraft 2 (2010) | 183.6 | 68.2 | 47.5 | 30.3 |
| The Elder Scrolls V: Skyrim (2011) | 60 | 49.1 | 35.8 | 21 |
| Diablo III (2012) | 104.9 | 87 | 77.7 | 47.2 |
| Counter-Strike: GO (2012) | 120.7 | 95.8 | 67.3 | 41.9 |
| Tomb Raider (2013) | 122 | 61.1 | 50.3 | 26.8 |
| BioShock Infinite (2013) | 101 | 17.6 | ||
| X-Plane 10.25 (2013) | 40.2 | 22.8 | 10.3 | |
| Sims 4 (2014) | 150 | 57.9 | 31.5 | 27.7 |
| Dragon Age: Inquisition (2014) | 35.6 | 27.5 | 12.8 | |
| GTA V (2015) | 65.5 | 57.8 | 15.7 | |
| Dirt Rally (2015) | 59.1 | 31.4 | 14.7 | |
| The Witcher 3 (2015) | 37.3 | 24 | 12.5 | |
| Metal Gear Solid V (2015) | 59.8 | 20.6 | 16 | |
| Dota 2 Reborn (2015) | 56.2 | 46.8 | 29 | 27.3 |
| World of Warships (2015) | 78.6 | 58.8 | 38.4 | 29.1 |
| Anno 2205 (2015) | 51.3 | 28.1 | 13.2 | 6.2 |
| Rainbow Six Siege (2015) | 82.5 | 52 | 28.3 | 22.4 |
| Rise of the Tomb Raider (2016) | 38.7 | 13.6 | ||
| XCOM 2 (2016) | 31.1 | 10.6 | 7.2 | |
| Far Cry Primal (2016) | 32 | 16 | 14 | |
| The Division (2016) | 40.8 | 26.5 | 19.9 | 8.5 |
| Hitman 2016 (2016) | 25.4 | 26.7 | 17.9 | |
| Deus Ex Mankind Divided (2016) | 25.8 | 11.6 | ||
| Battlefield 1 (2016) | 47.2 | 29.8 | 14.4 | 13 |
| Civilization 6 (2016) | 65.1 | 30.6 | 15.5 | 11.5 |
| Farming Simulator 17 (2016) | 102.5 | 80.3 | 37.3 | 15.6 |
| Titanfall 2 (2016) | 65.1 | 46.9 | 17.5 | 15.7 |
| Resident Evil 7 (2017) | 67.6 | 27.8 | 17.3 | 11.2 |
| For Honor (2017) | 49 | 17.6 | 17 | 13.4 |
| Rocket League (2017) | 99.7 | 42.7 | 28.2 | |
| Team Fortress 2 (2017) | 67.3 | 63.4 | 50.5 | 37.5 |
| Playerunknown's Battlegrounds (PUBG) (2017) | 33 | 14 | 12.3 | |
| F1 2017 (2017) | 50 | 23 | 23 | |
| Ark Survival Evolved (2017) | 21.8 | 6.8 | ||
| FIFA 18 (2017) | 125.9 | 69.8 | 57.3 | 53.4 |
| Middle-earth: Shadow of War (2017) | 33 | 14 | 10 | |
| The Evil Within 2 (2017) | 17.7 | 9.9 | 8.9 | |
| Destiny 2 (2017) | 41.2 | 23.5 | 21 | 18.2 |
| Assassin´s Creed Origins (2017) | 12 | |||
| Call of Duty WWII (2017) | 61.4 | 56.1 | 18 | |
| Need for Speed Payback (2017) | 30.6 | 16.3 | 12.8 | |
| Star Wars Battlefront 2 (2017) | 33.7 | 10.3 | 9.3 |
Rumorosità
| Idle |
| 31.8 / 32.1 / 32.1 dB(A) |
| Sotto carico |
| 33 / 34.8 dB(A) |
 | ||
30 dB silenzioso 40 dB(A) udibile 50 dB(A) rumoroso |
||
min: | ||
(±) La temperatura massima sul lato superiore è di 41 °C / 106 F, rispetto alla media di 36.8 °C / 98 F, che varia da 21 a 71 °C per questa classe Multimedia.
(±) Il lato inferiore si riscalda fino ad un massimo di 41.1 °C / 106 F, rispetto alla media di 39.1 °C / 102 F
(+) In idle, la temperatura media del lato superiore è di 27.7 °C / 82 F, rispetto alla media deld ispositivo di 31.3 °C / 88 F.
(±) I poggiapolsi e il touchpad possono diventare molto caldi al tatto con un massimo di 37.3 °C / 99.1 F.
(-) La temperatura media della zona del palmo della mano di dispositivi simili e'stata di 28.7 °C / 83.7 F (-8.6 °C / -15.4 F).
Acer Swift 3 SF315-41-R4W1 analisi audio
(±) | potenza degli altiparlanti media ma buona (76 dB)
Bassi 100 - 315 Hz
(±) | bassi ridotti - in media 13.1% inferiori alla media
(+) | bassi in lineaa (4.5% delta rispetto alla precedente frequenza)
Medi 400 - 2000 Hz
(±) | medi elevati - circa 6.1% superiore alla media
(+) | medi lineari (6.5% delta rispetto alla precedente frequenza)
Alti 2 - 16 kHz
(±) | alti elevati - circa 6.4% superiori alla media
(+) | alti lineari (4.9% delta rispetto alla precedente frequenza)
Nel complesso 100 - 16.000 Hz
(±) | la linearità complessiva del suono è media (17.3% di differenza rispetto alla media
Rispetto alla stessa classe
» 49% di tutti i dispositivi testati in questa classe è stato migliore, 7% simile, 44% peggiore
» Il migliore ha avuto un delta di 5%, medio di 17%, peggiore di 45%
Rispetto a tutti i dispositivi testati
» 33% di tutti i dispositivi testati in questa classe è stato migliore, 8% similare, 59% peggiore
» Il migliore ha avuto un delta di 4%, medio di 23%, peggiore di 134%
Dell Inspiron 15 7570 analisi audio
(-) | altoparlanti non molto potenti (67.4 dB)
Bassi 100 - 315 Hz
(-) | quasi nessun basso - in media 18.2% inferiori alla media
(±) | la linearità dei bassi è media (13.1% delta rispetto alla precedente frequenza)
Medi 400 - 2000 Hz
(+) | medi bilanciati - solo only 3.5% rispetto alla media
(±) | linearità dei medi adeguata (8.1% delta rispetto alla precedente frequenza)
Alti 2 - 16 kHz
(+) | Alti bilanciati - appena 2.3% dalla media
(±) | la linearità degli alti è media (9.9% delta rispetto alla precedente frequenza)
Nel complesso 100 - 16.000 Hz
(±) | la linearità complessiva del suono è media (20.8% di differenza rispetto alla media
Rispetto alla stessa classe
» 49% di tutti i dispositivi testati in questa classe è stato migliore, 9% simile, 42% peggiore
» Il migliore ha avuto un delta di 7%, medio di 21%, peggiore di 53%
Rispetto a tutti i dispositivi testati
» 56% di tutti i dispositivi testati in questa classe è stato migliore, 8% similare, 36% peggiore
» Il migliore ha avuto un delta di 4%, medio di 23%, peggiore di 134%
| Off / Standby | |
| Idle | |
| Sotto carico |
|
Leggenda:
min: | |
| Acer Swift 3 SF315-41-R4W1 R5 2500U, Vega 8, Intel SSD 600p SSDPEKKW256G7, IPS, 1920x1080, 15.6" | HP Envy x360 15m-bq121dx R5 2500U, Vega 8, HGST Travelstar 7K1000 HTS721010A9E630, IPS, 1920x1080, 15.6" | Acer Swift 3 SF315-51G-57E5 i5-8250U, GeForce MX150, Hynix HFS128G39TND, IPS, 1920x1080, 15.6" | HP Spectre x360 15t-bl100 i5-8550U, GeForce MX150, Samsung PM961 NVMe MZVLW512HMJP, IPS, 3840x2160, 15.6" | Acer Aspire 5 A515-51G-51RL i5-7200U, GeForce MX150, Kingston RBUSNS8180DS3128GH, IPS, 1920x1080, 15.6" | HP Pavilion 15-cc107ng i5-8250U, GeForce 940MX, SanDisk SD8SN8U256G1006, TN LED, 1920x1080, 15.6" | Dell Inspiron 15 7570 i5-8550U, GeForce 940MX, Samsung PM961 NVMe MZVLW512HMJP, IPS, 1920x1080, 15.6" | Acer Spin 5 SP513-52N-54SF i5-8250U, UHD Graphics 620, Micron 1100 MTFDDAV256TBN, IPS, 1920x1080, 13.3" | |
|---|---|---|---|---|---|---|---|---|
| Power Consumption | 4% | 9% | -52% | 12% | 15% | 6% | 30% | |
| Idle Minimum * (Watt) | 7.3 | 5.9 19% | 3.8 48% | 11.6 -59% | 2.9 60% | 2.8 62% | 3.6 51% | 3.9 47% |
| Idle Average * (Watt) | 9.7 | 8.7 10% | 6.5 33% | 13.8 -42% | 5.9 39% | 5.8 40% | 6.7 31% | 8.2 15% |
| Idle Maximum * (Watt) | 13 | 10.5 19% | 9.1 30% | 14.2 -9% | 6.4 51% | 7.5 42% | 9.2 29% | 8.8 32% |
| Load Average * (Watt) | 40.4 | 45.7 -13% | 53.4 -32% | 67.9 -68% | 54 -34% | 54 -34% | 59 -46% | 28.5 29% |
| Load Maximum * (Watt) | 42.2 | 49.4 -17% | 55.6 -32% | 76.9 -82% | 66 -56% | 56 -33% | 58 -37% | 30.7 27% |
| Witcher 3 ultra * (Watt) | 45.8 | 59 | 51 |
* ... Meglio usare valori piccoli
| Acer Swift 3 SF315-41-R4W1 R5 2500U, Vega 8, 48 Wh | Acer Swift 3 SF315-51G-57E5 i5-8250U, GeForce MX150, 49.7 Wh | HP Envy x360 15m-bq121dx R5 2500U, Vega 8, 55.8 Wh | HP Spectre x360 15t-bl100 i5-8550U, GeForce MX150, 79.2 Wh | Acer Aspire 5 A515-51G-51RL i5-7200U, GeForce MX150, 48 Wh | HP Pavilion 15-cc107ng i5-8250U, GeForce 940MX, 41.7 Wh | Dell Inspiron 15 7570 i5-8550U, GeForce 940MX, 42 Wh | Acer Spin 5 SP513-52N-54SF i5-8250U, UHD Graphics 620, 53.9 Wh | |
|---|---|---|---|---|---|---|---|---|
| Autonomia della batteria | 63% | 3% | 52% | 69% | 27% | -44% | 60% | |
| Reader / Idle (h) | 12.2 | 10.9 -11% | 15.6 28% | 20.9 71% | 4.7 -61% | |||
| WiFi v1.3 (h) | 5.2 | 8.5 63% | 6.6 27% | 8.5 63% | 8.6 65% | 6.6 27% | 1.8 -65% | 8.3 60% |
| Load (h) | 1.4 | 1.3 -7% | 2.3 64% | 2.4 71% | 1.3 -7% | |||
| H.264 (h) | 8.2 | 4 |
Pro
Contro
Con la CPU Ryzen 5 Mobile, AMD si vede chiaramente davanti ai chip Intel Kaby Lake Refresh. Uno statement con il quale possiamo dichiararci d'accordo, soprattutto se si rimuove la parola "chiaramente". Nel caso del 2500U, la potenza generale di calcolo è al livello del Core i5-8250U o appena al di sotto del Core i7-8550U. In Multi-Core, la CPU Ryzen 5 sembra avere un piccolo vantaggio (+5%), ma il punteggio di Cinebench non riesce ad essere costante. Ma rimaniamo onesti: molti dispositivi con CPU Intel presentano lo stesso calo delle prestazioni con il turbo. La durata del turbo dipende comunque dall'installazione effettuata dal produttore (dalla capacità del sistema di raffreddamento).
Negli ultimi anni, le implementazioni AMD hanno spesso sofferto a causa di hardware di accompagnamento non all'altezza. Per rimanere all'interno della fascia di prezzo sono stati impiegati pannelli TN di scarsa qualità, hard disk HDD, RAM single-channel e chip wlan lenti. Quindi la reputazione dei chip ne ha sofferto molto, anche perché erano comunque inferiori alle alternative Intel.
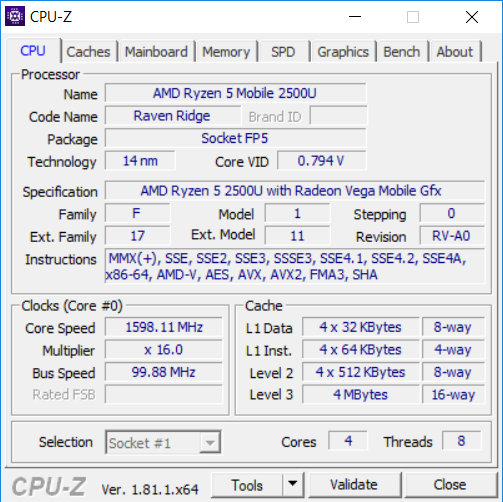
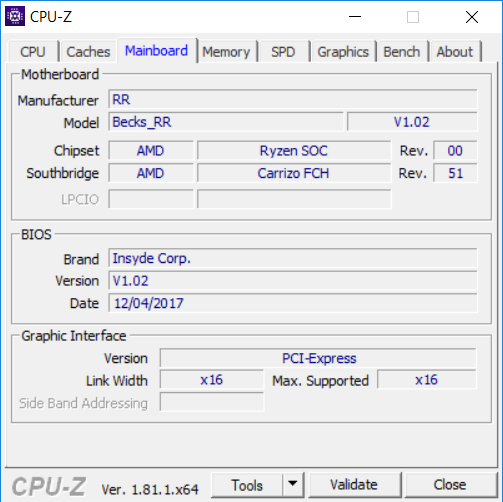
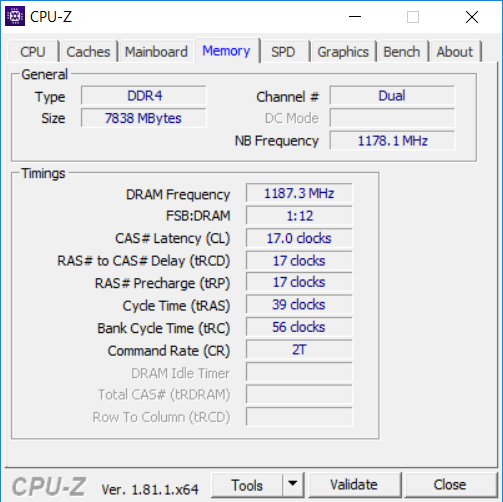
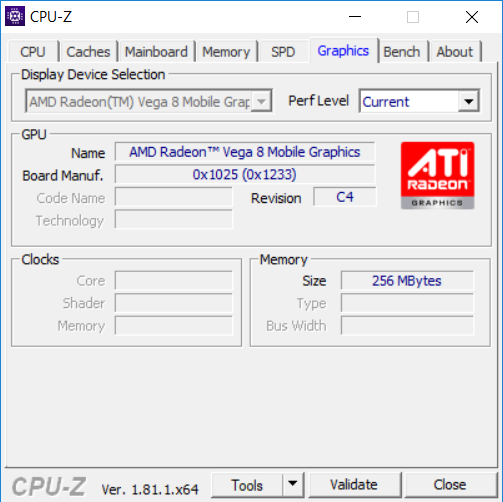
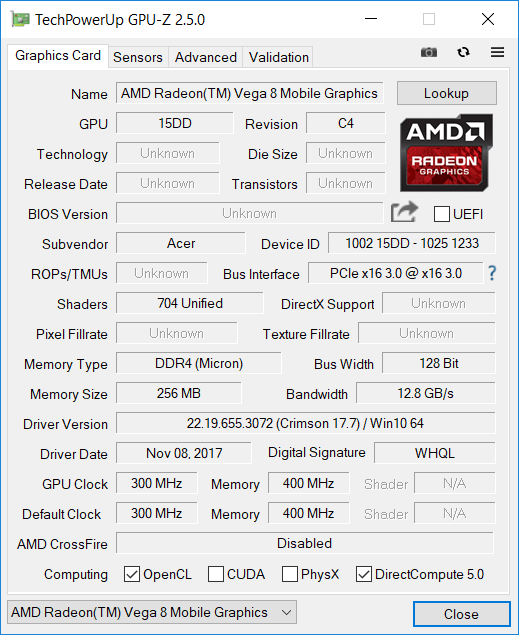
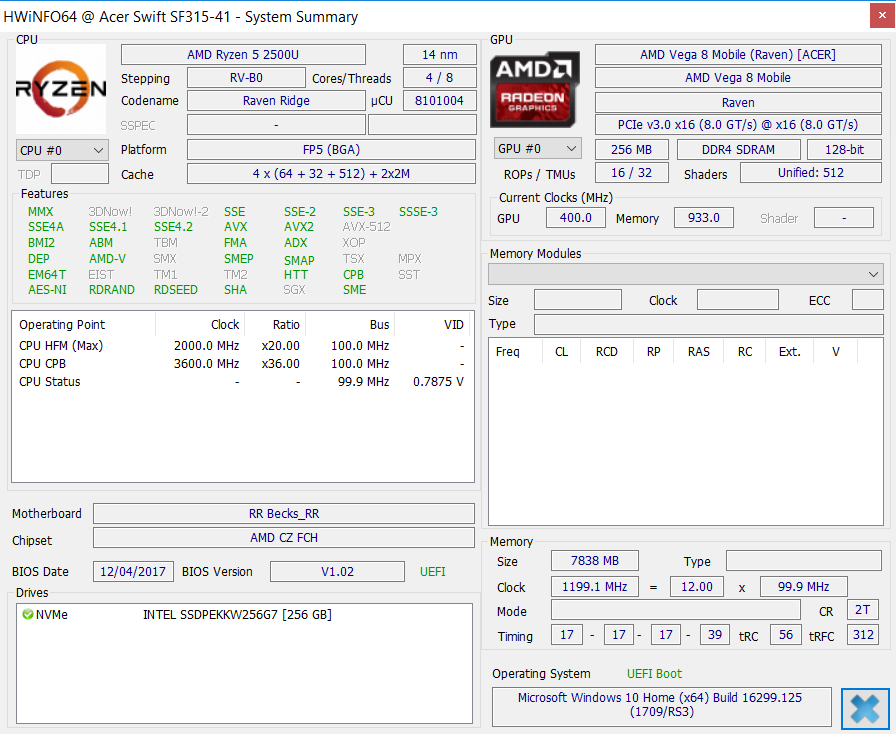
Con lo Swift 3 SF315-41-R4W1, Acer non ha più fatto questi grossi errori, o per lo meno, non così tanti. Questo dispositivo da 15 pollici è dotato di veloce memoria DDR4 (Dual Channel attivato), un buon modulo Wlan (2x2 AC, BT 4.2) e un display di discreta qualità (con i colori calibrati) e dispositivi di input di qualità. Il Ryzen 5 riesce a tenere il passo con i più recenti dispositivi Skylake e Skylake Refresh, mentre la scheda grafica Vega 8 è più veloce rispetto alla scheda Intel UHD Graphics 620 (Skylake Refresh).
Il dispositivo è disponibile a un prezzo di circa 800 Euro (~$955) e possiamo consigliarlo, anche se occorre tenere in considerazione alcuni problemi. I veri difetti sono lo scarso hard disk SSD di Intel, che sembra rovinare i punteggi PCMark, e la scarsa autonomia della batteria (5 ore invece di 8), causata da un consumo eccessivo di energia con il dispositivo in attesa.
La Radeon Vega 8 soddisferà i gamer solo se non hanno troppe pretese (standard 940MX). Bisogna anche vedere come la Radeon RX 540 (2 GB) si comporterà nel futuro prossimo. Se si posizionerà al di sopra della MX 150, il prezzo inferiore a 1.000 Euro (~$1199) del modello con Ryzen 7 (Swift 3 SF315-41G) potrebbe essere giustificato.
Nota: è una recensione breve. Per la recensione originale in inglese leggete qui.
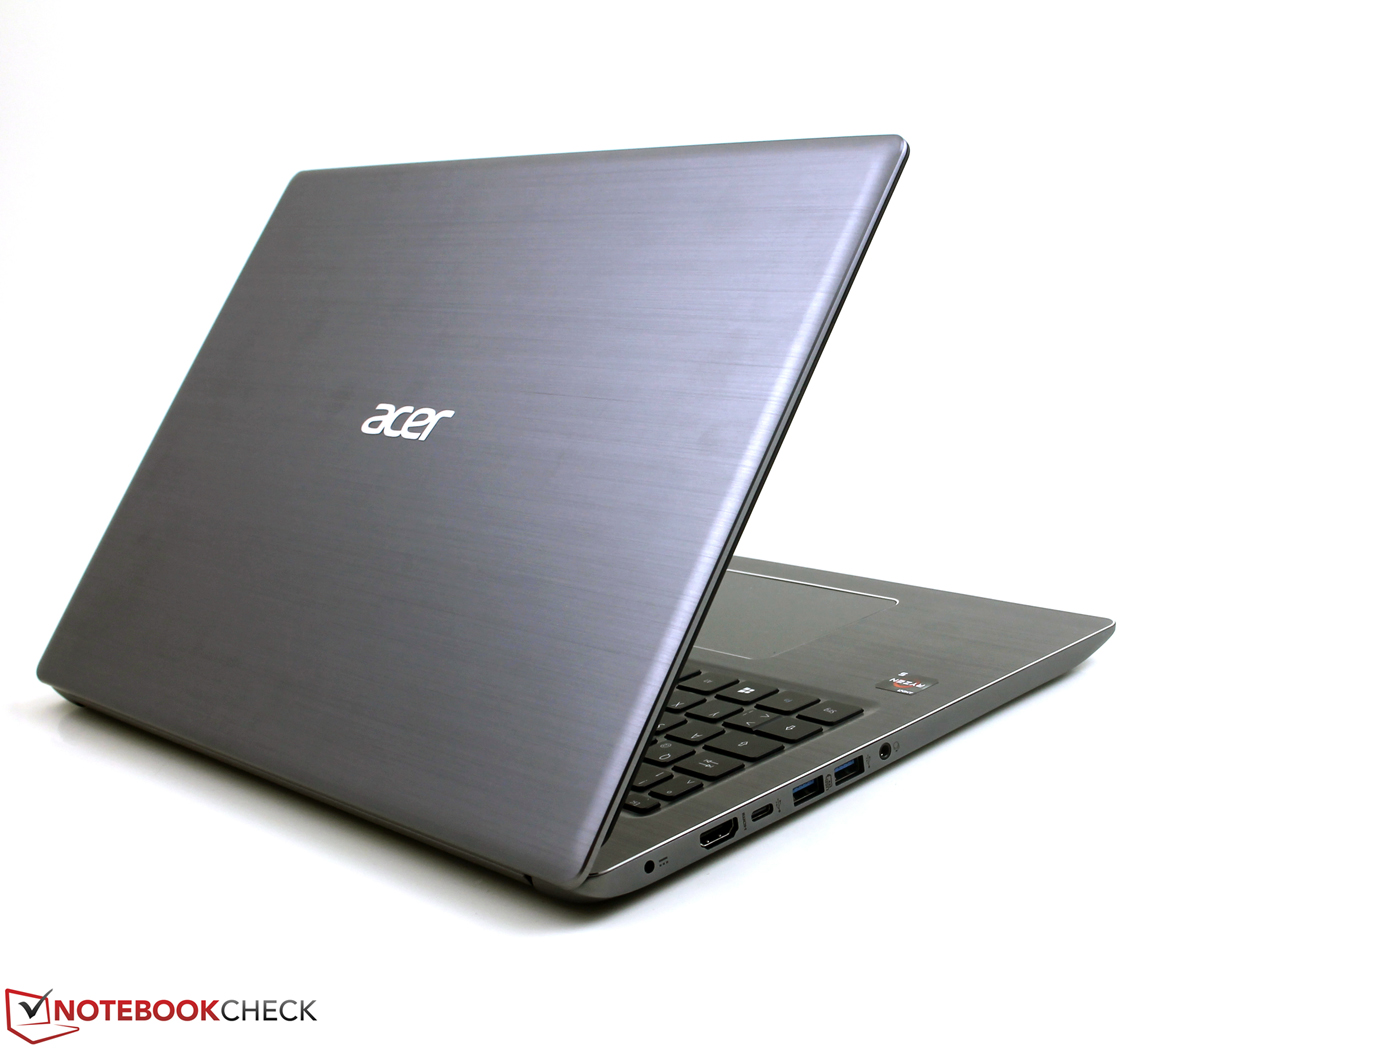
Acer Swift 3 SF315-41-R4W1
- 01/06/2018 v6 (old)
Sebastian Jentsch