Recensione breve del Portatile Asus AsusPro P4540UQ (7200U, 940MX, Full-HD)
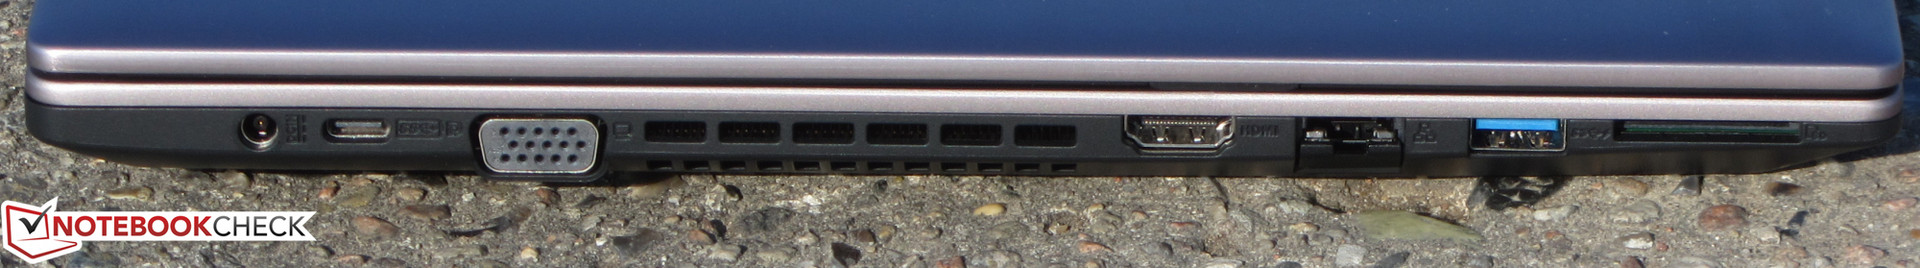
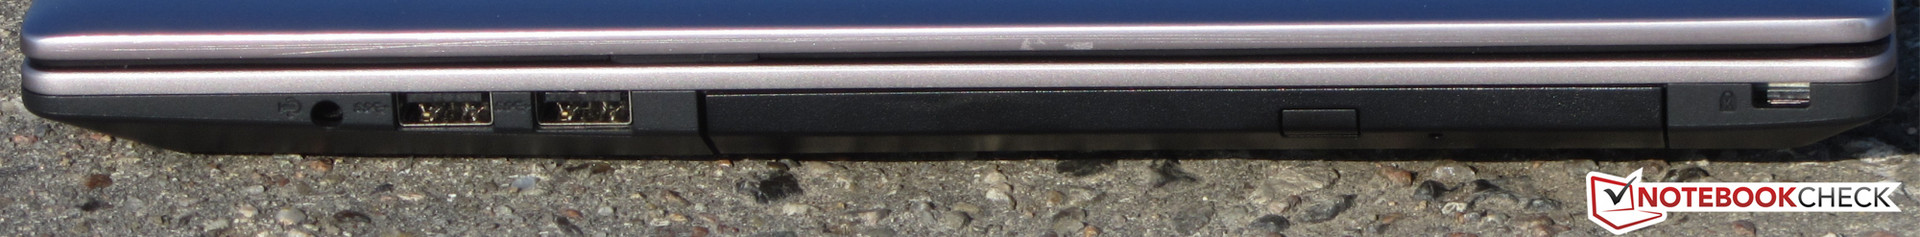
Connectivity
| SD Card Reader | |
| average JPG Copy Test (av. of 3 runs) | |
| HP ProBook 450 G4 Y8B60EA | |
| Asus AsusPro P4540UQ-FY0056R | |
| Acer TravelMate P259-MG-71UU | |
| Lenovo ThinkPad E570-20H6S00000 | |
| Dell Vostro 15-5568 | |
| maximum AS SSD Seq Read Test (1GB) | |
| HP ProBook 450 G4 Y8B60EA | |
| Lenovo ThinkPad E570-20H6S00000 | |
| Dell Vostro 15-5568 | |
| |||||||||||||||||||||||||
Distribuzione della luminosità: 85 %
Al centro con la batteria: 296 cd/m²
Contrasto: 1022:1 (Nero: 0.27 cd/m²)
ΔE ColorChecker Calman: 3.92 | ∀{0.5-29.43 Ø4.71}
ΔE Greyscale Calman: 2.6 | ∀{0.09-98 Ø4.96}
83.7% sRGB (Argyll 1.6.3 3D)
54.5% AdobeRGB 1998 (Argyll 1.6.3 3D)
61.1% AdobeRGB 1998 (Argyll 3D)
83.6% sRGB (Argyll 3D)
63.3% Display P3 (Argyll 3D)
Gamma: 2.53
CCT: 6561 K
| Asus AsusPro P4540UQ-FY0056R IPS, 1920x1080, 15.6" | HP ProBook 450 G4 Y8B60EA TN LED, 1920x1080, 15.6" | Lenovo ThinkPad E570-20H6S00000 IPS LED, 1920x1080, 15.6" | Acer TravelMate P259-MG-71UU TN LED, 1920x1080, 15.6" | Dell Vostro 15-5568 TN LED, 1920x1080, 15.6" | |
|---|---|---|---|---|---|
| Display | -33% | -35% | -35% | ||
| Display P3 Coverage (%) | 63.3 | 39.89 -37% | 38.65 -39% | 38.58 -39% | |
| sRGB Coverage (%) | 83.6 | 59.5 -29% | 58 -31% | 58 -31% | |
| AdobeRGB 1998 Coverage (%) | 61.1 | 41.24 -33% | 39.94 -35% | 39.85 -35% | |
| Response Times | -19% | -3% | 6% | -10% | |
| Response Time Grey 50% / Grey 80% * (ms) | 38 ? | 51 ? -34% | 44.8 ? -18% | 43 ? -13% | 47.6 ? -25% |
| Response Time Black / White * (ms) | 29 ? | 30 ? -3% | 25.6 ? 12% | 22 ? 24% | 27.2 ? 6% |
| PWM Frequency (Hz) | 21000 ? | 50 ? | |||
| Screen | -84% | -15% | -84% | -82% | |
| Brightness middle (cd/m²) | 276 | 214 -22% | 242 -12% | 180 -35% | 229 -17% |
| Brightness (cd/m²) | 283 | 201 -29% | 243 -14% | 178 -37% | 222 -22% |
| Brightness Distribution (%) | 85 | 77 -9% | 75 -12% | 93 9% | 82 -4% |
| Black Level * (cd/m²) | 0.27 | 0.43 -59% | 0.24 11% | 0.45 -67% | 0.56 -107% |
| Contrast (:1) | 1022 | 498 -51% | 1008 -1% | 400 -61% | 409 -60% |
| Colorchecker dE 2000 * | 3.92 | 10.68 -172% | 4.65 -19% | 9.91 -153% | 10.36 -164% |
| Colorchecker dE 2000 max. * | 9.13 | 18.07 -98% | 9.64 -6% | 18.19 -99% | 14.95 -64% |
| Greyscale dE 2000 * | 2.6 | 11.32 -335% | 3.39 -30% | 11.25 -333% | 10.9 -319% |
| Gamma | 2.53 87% | 2.26 97% | 2.7 81% | 2.35 94% | 2.21 100% |
| CCT | 6561 99% | 12204 53% | 6246 104% | 12115 54% | 10084 64% |
| Color Space (Percent of AdobeRGB 1998) (%) | 54.5 | 38 -30% | 36.69 -33% | 37 -32% | 37.69 -31% |
| Color Space (Percent of sRGB) (%) | 83.7 | 59 -30% | 57.66 -31% | 58 -31% | 57.92 -31% |
| Media totale (Programma / Settaggio) | -45% /
-65% | -18% /
-17% | -38% /
-62% | -46% /
-70% |
* ... Meglio usare valori piccoli
Sfarfallio dello schermo / PWM (Pulse-Width Modulation)
| flickering dello schermo / PWM rilevato | 21000 Hz | ≤ 90 % settaggio luminosita' | 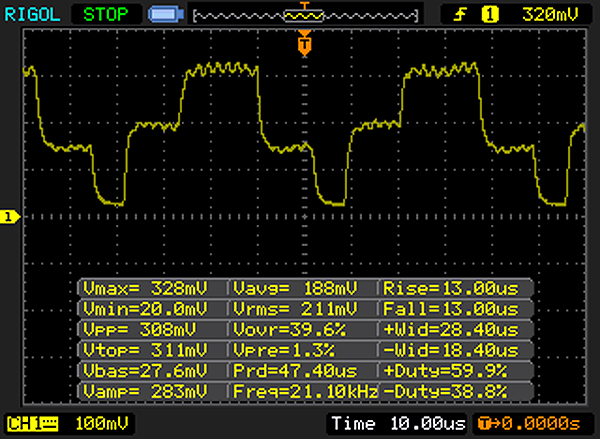 |
Il display sfarfalla a 21000 Hz (Probabilmente a causa dell'uso di PWM) Flickering rilevato ad una luminosita' di 90 % o inferiore. Non dovrebbe verificarsi flickering o PWM sopra questo valore di luminosita'. La frequenza di 21000 Hz è abbastanza alta, quindi la maggioranza degli utenti sensibili al PWM non dovrebbero notare alcun flickering. In confronto: 52 % di tutti i dispositivi testati non utilizza PWM per ridurre la luminosita' del display. Se è rilevato PWM, una media di 7741 (minimo: 5 - massimo: 343500) Hz è stata rilevata. | |||
Tempi di risposta del Display
| ↔ Tempi di risposta dal Nero al Bianco | ||
|---|---|---|
| 29 ms ... aumenta ↗ e diminuisce ↘ combinato | ↗ 17 ms Incremento | 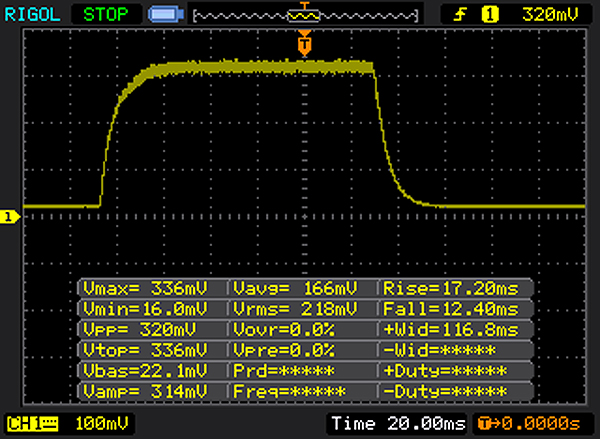 |
| ↘ 12 ms Calo | ||
| Lo schermo mostra tempi di risposta relativamente lenti nei nostri tests e potrebbe essere troppo lento per i gamers. In confronto, tutti i dispositivi di test variano da 0.1 (minimo) a 240 (massimo) ms. » 77 % di tutti i dispositivi è migliore. Questo significa che i tempi di risposta rilevati sono peggiori rispetto alla media di tutti i dispositivi testati (19.8 ms). | ||
| ↔ Tempo di risposta dal 50% Grigio all'80% Grigio | ||
| 38 ms ... aumenta ↗ e diminuisce ↘ combinato | ↗ 20 ms Incremento | 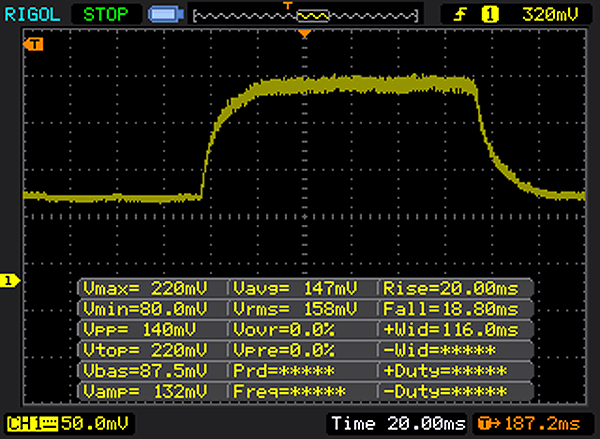 |
| ↘ 18 ms Calo | ||
| Lo schermo mostra tempi di risposta lenti nei nostri tests e sarà insoddisfacente per i gamers. In confronto, tutti i dispositivi di test variano da 0.165 (minimo) a 636 (massimo) ms. » 55 % di tutti i dispositivi è migliore. Questo significa che i tempi di risposta rilevati sono peggiori rispetto alla media di tutti i dispositivi testati (30.9 ms). | ||
| Cinebench R10 | |
| Rendering Multiple CPUs 32Bit | |
| Acer TravelMate P259-MG-71UU | |
| Asus AsusPro P4540UQ-FY0056R | |
| Rendering Single 32Bit | |
| Asus AsusPro P4540UQ-FY0056R | |
| Acer TravelMate P259-MG-71UU | |
| Geekbench 3 | |
| 32 Bit Single-Core Score | |
| Acer TravelMate P259-MG-71UU | |
| Asus AsusPro P4540UQ-FY0056R | |
| 32 Bit Multi-Core Score | |
| Acer TravelMate P259-MG-71UU | |
| Asus AsusPro P4540UQ-FY0056R | |
| Geekbench 4.0 | |
| 64 Bit Single-Core Score | |
| Acer TravelMate P259-MG-71UU | |
| Asus AsusPro P4540UQ-FY0056R | |
| 64 Bit Multi-Core Score | |
| Acer TravelMate P259-MG-71UU | |
| Asus AsusPro P4540UQ-FY0056R | |
| JetStream 1.1 - 1.1 Total | |
| HP ProBook 450 G4 Y8B60EA | |
| Dell Vostro 15-5568 | |
| Asus AsusPro P4540UQ-FY0056R | |
| Lenovo ThinkPad E570-20H6S00000 | |
| Acer TravelMate P259-MG-71UU | |
| PCMark 8 Home Score Accelerated v2 | 3428 punti | |
| PCMark 8 Creative Score Accelerated v2 | 4256 punti | |
| PCMark 8 Work Score Accelerated v2 | 4478 punti | |
Aiuto | ||

| Asus AsusPro P4540UQ-FY0056R SK Hynix HFS256G39TND-N210A | HP ProBook 450 G4 Y8B60EA SanDisk SD8SNAT256G1002 | Lenovo ThinkPad E570-20H6S00000 Toshiba THNSF5256GPUK | Acer TravelMate P259-MG-71UU Liteonit CV3-8D256 | Dell Vostro 15-5568 SanDisk X400 256GB, SATA (SD8SB8U-256G) | |
|---|---|---|---|---|---|
| AS SSD | -15% | 71% | 5% | 10% | |
| Seq Read (MB/s) | 502 | 493.8 -2% | 1227 144% | 402.9 -20% | 502 0% |
| Seq Write (MB/s) | 190.8 | 315.9 66% | 636 233% | 333.5 75% | 465.2 144% |
| 4K Read (MB/s) | 27.19 | 17.96 -34% | 37.12 37% | 29.56 9% | 26.84 -1% |
| 4K Write (MB/s) | 63.5 | 73.4 16% | 73.1 15% | 62.9 -1% | 50.3 -21% |
| 4K-64 Read (MB/s) | 364.5 | 137.1 -62% | 654 79% | 328.5 -10% | 357.9 -2% |
| 4K-64 Write (MB/s) | 233.6 | 195.5 -16% | 232.5 0% | 163.6 -30% | 156.4 -33% |
| Access Time Read * (ms) | 0.084 | 0.141 -68% | 0.06 29% | 0.091 -8% | 0.098 -17% |
| Access Time Write * (ms) | 0.224 | 0.159 29% | 0.036 84% | 0.057 75% | 0.083 63% |
| Score Read (Points) | 442 | 204 -54% | 813 84% | 398 -10% | 435 -2% |
| Score Write (Points) | 316 | 300 -5% | 369 17% | 260 -18% | 253 -20% |
| Score Total (Points) | 977 | 607 -38% | 1578 62% | 869 -11% | 917 -6% |
* ... Meglio usare valori piccoli
| 3DMark 11 Performance | 2800 punti | |
| 3DMark Ice Storm Standard Score | 51531 punti | |
| 3DMark Cloud Gate Standard Score | 7704 punti | |
| 3DMark Fire Strike Score | 1916 punti | |
| 3DMark Time Spy Score | 633 punti | |
Aiuto | ||
| 3DMark 11 - 1280x720 Performance GPU | |
| Lenovo ThinkPad E570-20H6S00000 | |
| Acer TravelMate P259-MG-71UU | |
| Asus AsusPro P4540UQ-FY0056R | |
| Lenovo ThinkPad E470-20H2S00400 | |
| Dell Vostro 15 5568 | |
| Asus Vivobook F556UQ-XO626D | |
| MSI CX62 7QL | |
| HP ProBook 450 G4 Y8B60EA | |
| Dell Vostro 15-5568 | |
| 3DMark - 1920x1080 Fire Strike Score | |
| Lenovo ThinkPad E570-20H6S00000 | |
| Acer TravelMate P259-MG-71UU | |
| Asus AsusPro P4540UQ-FY0056R | |
| Dell Vostro 15 5568 | |
| Lenovo ThinkPad E470-20H2S00400 | |
| MSI CX62 7QL | |
| HP ProBook 450 G4 Y8B60EA | |
| Dell Vostro 15-5568 | |
| basso | medio | alto | ultra | |
|---|---|---|---|---|
| BioShock Infinite (2013) | 111 | 63.3 | 55 | 20.2 |
| Dota 2 Reborn (2015) | 105.9 | 89.8 | 53.1 | 47.7 |
| Resident Evil 7 (2017) | 70 | 34.3 | 19.7 | 5.7 |
| For Honor (2017) | 50.7 | 18.2 | 17.4 | 12.9 |
| Ghost Recon Wildlands (2017) | 32.2 | 12.5 | 11.3 | 6 |
| Mass Effect Andromeda (2017) | 31.2 | 14.5 | 9.8 | 8.6 |
| BioShock Infinite - 1366x768 High Preset | |
| Lenovo ThinkPad E570-20H6S00000 | |
| Acer TravelMate P259-MG-71UU | |
| Asus AsusPro P4540UQ-FY0056R | |
| Dell Vostro 15 5568 | |
| MSI CX62 7QL | |
| Lenovo ThinkPad E470-20H2S00400 | |
| HP ProBook 450 G4 Y8B60EA | |
| Asus Vivobook F556UQ-XO626D | |
| Dell Vostro 15-5568 | |
Rumorosità
| Idle |
| 30.3 / 30.3 / 30.3 dB(A) |
| DVD |
| 36.5 / dB(A) |
| Sotto carico |
| 35.4 / 37.2 dB(A) |
 | ||
30 dB silenzioso 40 dB(A) udibile 50 dB(A) rumoroso |
||
min: | ||
(+) La temperatura massima sul lato superiore è di 38 °C / 100 F, rispetto alla media di 34.3 °C / 94 F, che varia da 21.2 a 62.5 °C per questa classe Office.
(+) Il lato inferiore si riscalda fino ad un massimo di 39.1 °C / 102 F, rispetto alla media di 36.8 °C / 98 F
(+) In idle, la temperatura media del lato superiore è di 22 °C / 72 F, rispetto alla media deld ispositivo di 29.5 °C / 85 F.
(+) I poggiapolsi e il touchpad sono piu' freddi della temperatura della pelle con un massimo di 31.4 °C / 88.5 F e sono quindi freddi al tatto.
(-) La temperatura media della zona del palmo della mano di dispositivi simili e'stata di 27.6 °C / 81.7 F (-3.8 °C / -6.8 F).
Asus AsusPro P4540UQ-FY0056R analisi audio
(±) | potenza degli altiparlanti media ma buona (78 dB)
Bassi 100 - 315 Hz
(±) | bassi ridotti - in media 9.1% inferiori alla media
(+) | bassi in lineaa (5.3% delta rispetto alla precedente frequenza)
Medi 400 - 2000 Hz
(+) | medi bilanciati - solo only 1.9% rispetto alla media
(+) | medi lineari (3.2% delta rispetto alla precedente frequenza)
Alti 2 - 16 kHz
(±) | alti elevati - circa 13.3% superiori alla media
(±) | la linearità degli alti è media (8.3% delta rispetto alla precedente frequenza)
Nel complesso 100 - 16.000 Hz
(±) | la linearità complessiva del suono è media (20.5% di differenza rispetto alla media
Rispetto alla stessa classe
» 46% di tutti i dispositivi testati in questa classe è stato migliore, 10% simile, 44% peggiore
» Il migliore ha avuto un delta di 7%, medio di 21%, peggiore di 53%
Rispetto a tutti i dispositivi testati
» 54% di tutti i dispositivi testati in questa classe è stato migliore, 8% similare, 38% peggiore
» Il migliore ha avuto un delta di 4%, medio di 23%, peggiore di 134%
Apple MacBook 12 (Early 2016) 1.1 GHz analisi audio
(+) | gli altoparlanti sono relativamente potenti (83.6 dB)
Bassi 100 - 315 Hz
(±) | bassi ridotti - in media 11.3% inferiori alla media
(±) | la linearità dei bassi è media (14.2% delta rispetto alla precedente frequenza)
Medi 400 - 2000 Hz
(+) | medi bilanciati - solo only 2.4% rispetto alla media
(+) | medi lineari (5.5% delta rispetto alla precedente frequenza)
Alti 2 - 16 kHz
(+) | Alti bilanciati - appena 2% dalla media
(+) | alti lineari (4.5% delta rispetto alla precedente frequenza)
Nel complesso 100 - 16.000 Hz
(+) | suono nel complesso lineare (10.2% differenza dalla media)
Rispetto alla stessa classe
» 7% di tutti i dispositivi testati in questa classe è stato migliore, 2% simile, 90% peggiore
» Il migliore ha avuto un delta di 5%, medio di 18%, peggiore di 53%
Rispetto a tutti i dispositivi testati
» 5% di tutti i dispositivi testati in questa classe è stato migliore, 1% similare, 94% peggiore
» Il migliore ha avuto un delta di 4%, medio di 23%, peggiore di 134%
| Off / Standby | |
| Idle | |
| Sotto carico |
|
Leggenda:
min: | |
| Battery Runtime - WiFi Websurfing | |
| Asus AsusPro P4540UQ-FY0056R | |
| HP ProBook 450 G4 Y8B60EA | |
| Lenovo ThinkPad E570-20H6S00000 | |
| Dell Vostro 15-5568 | |
| Acer TravelMate P259-MG-71UU | |
Pro
Contro
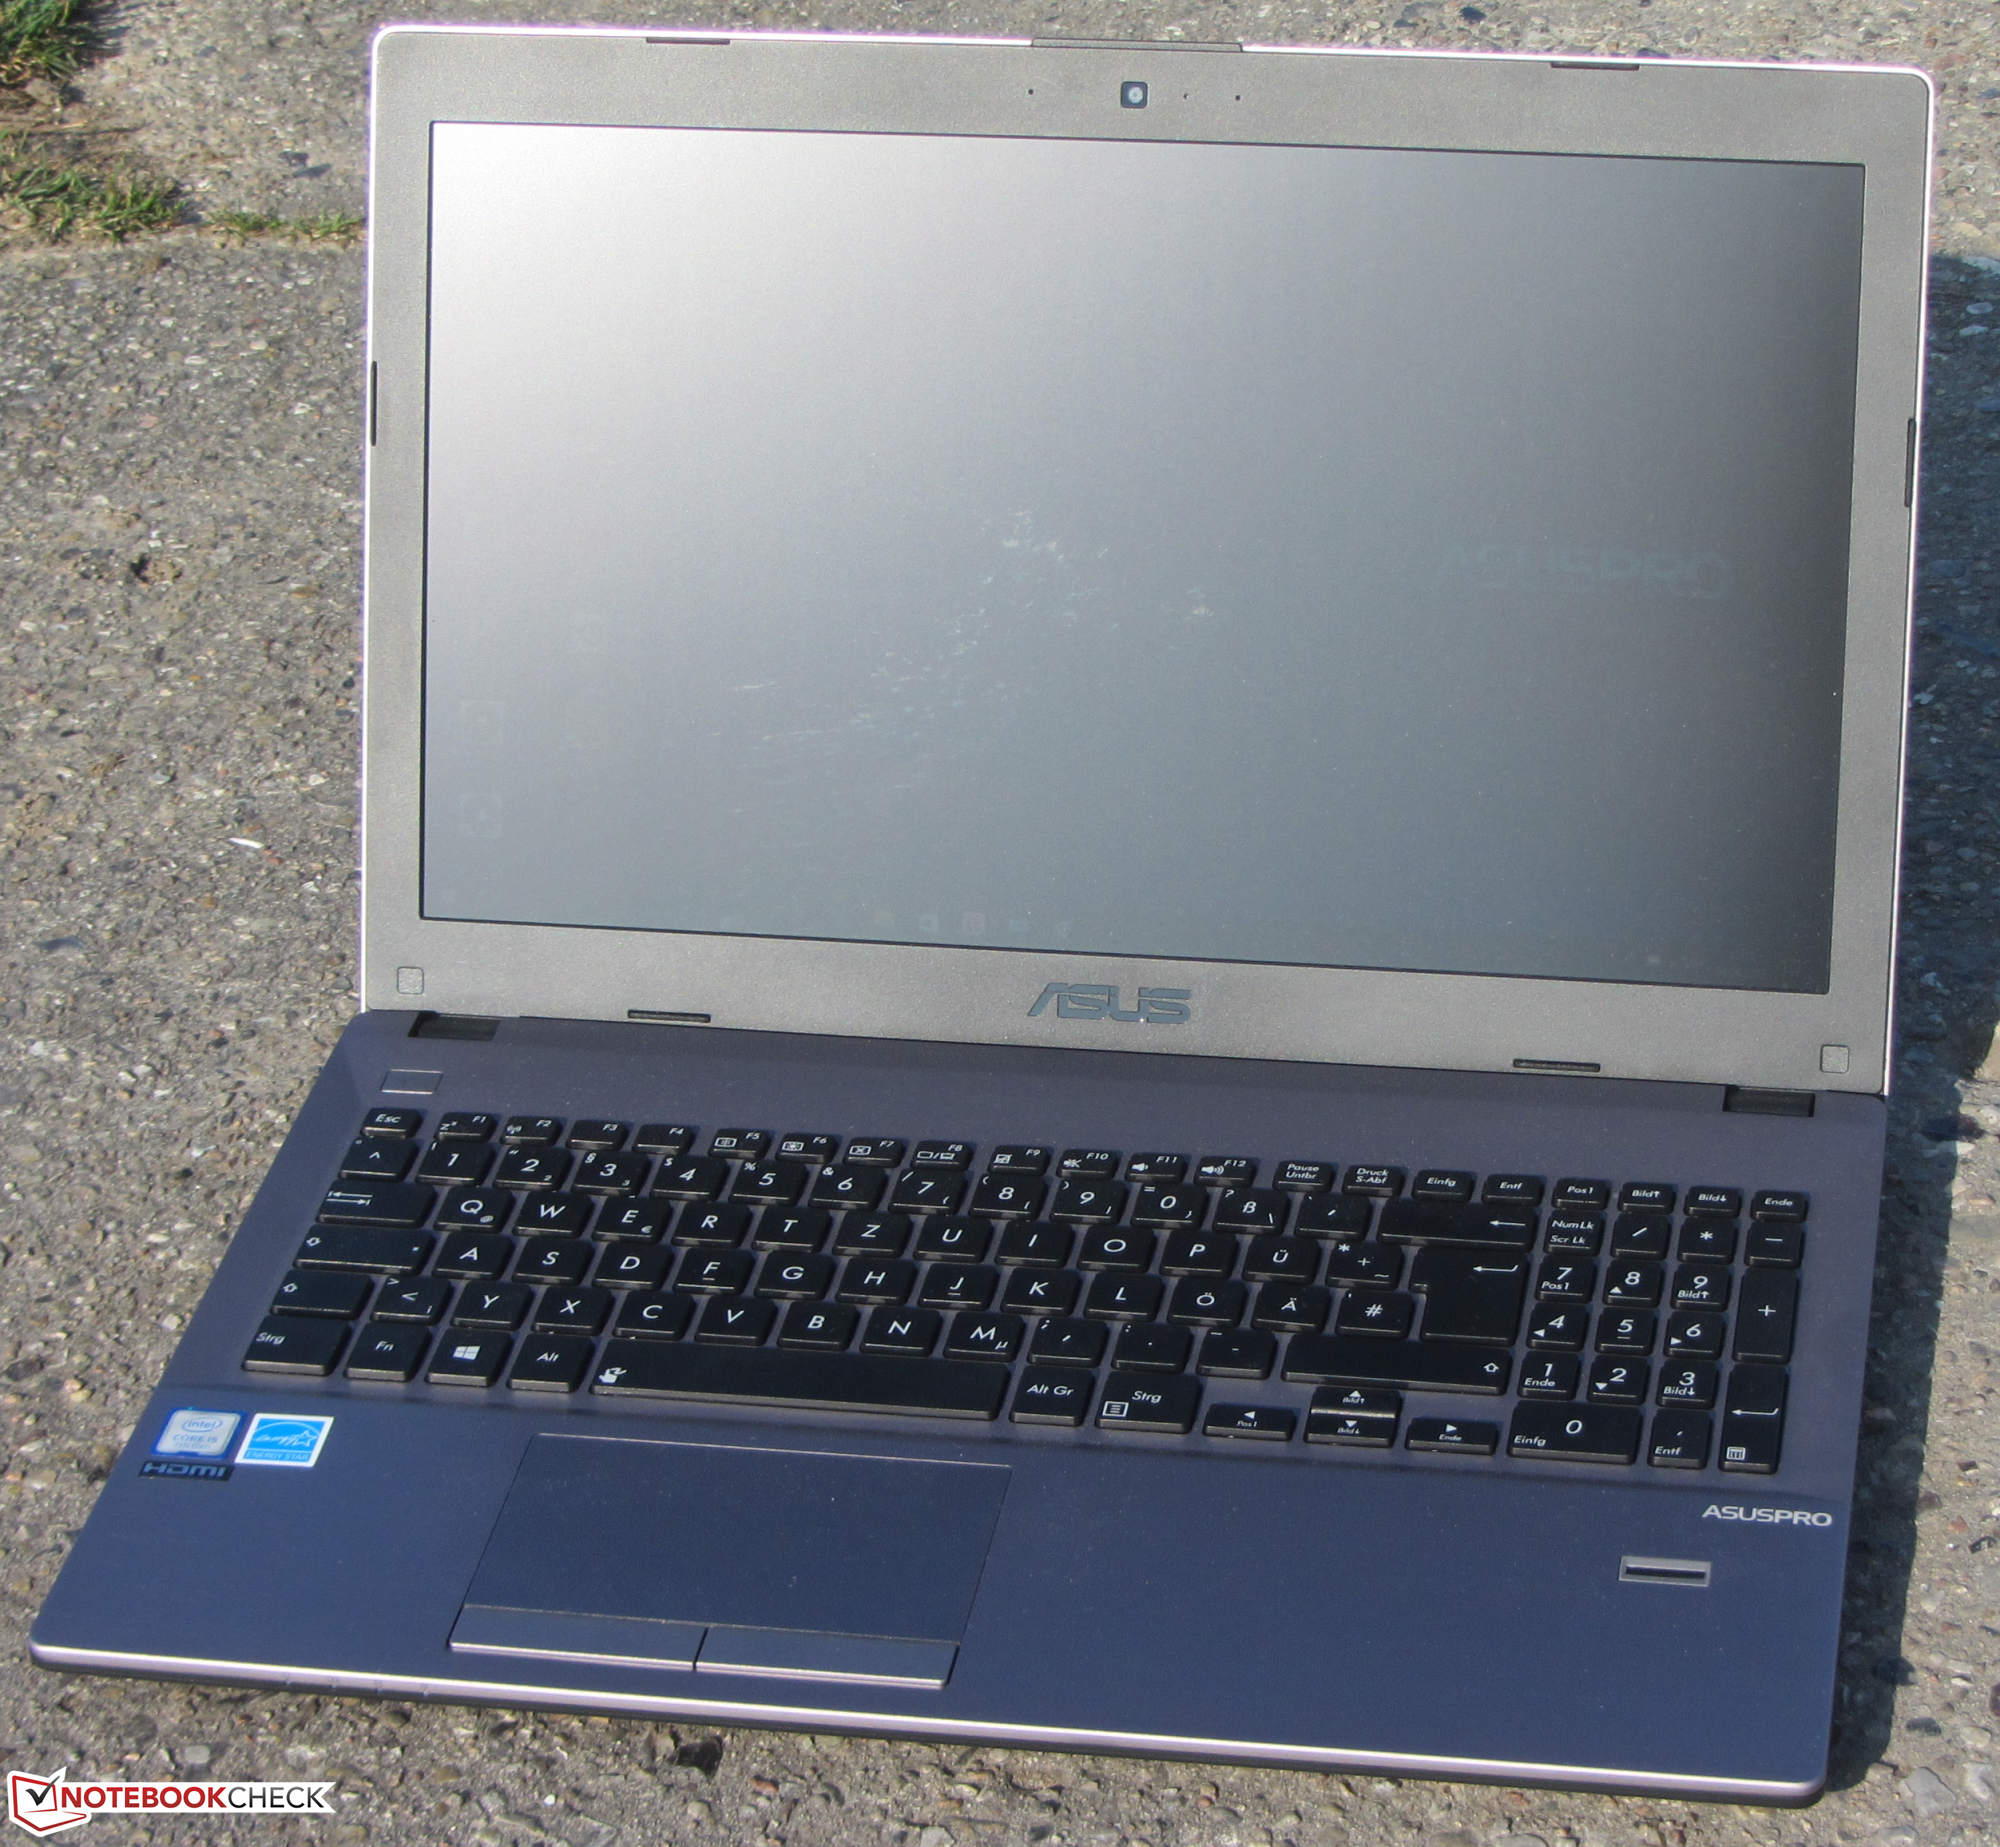
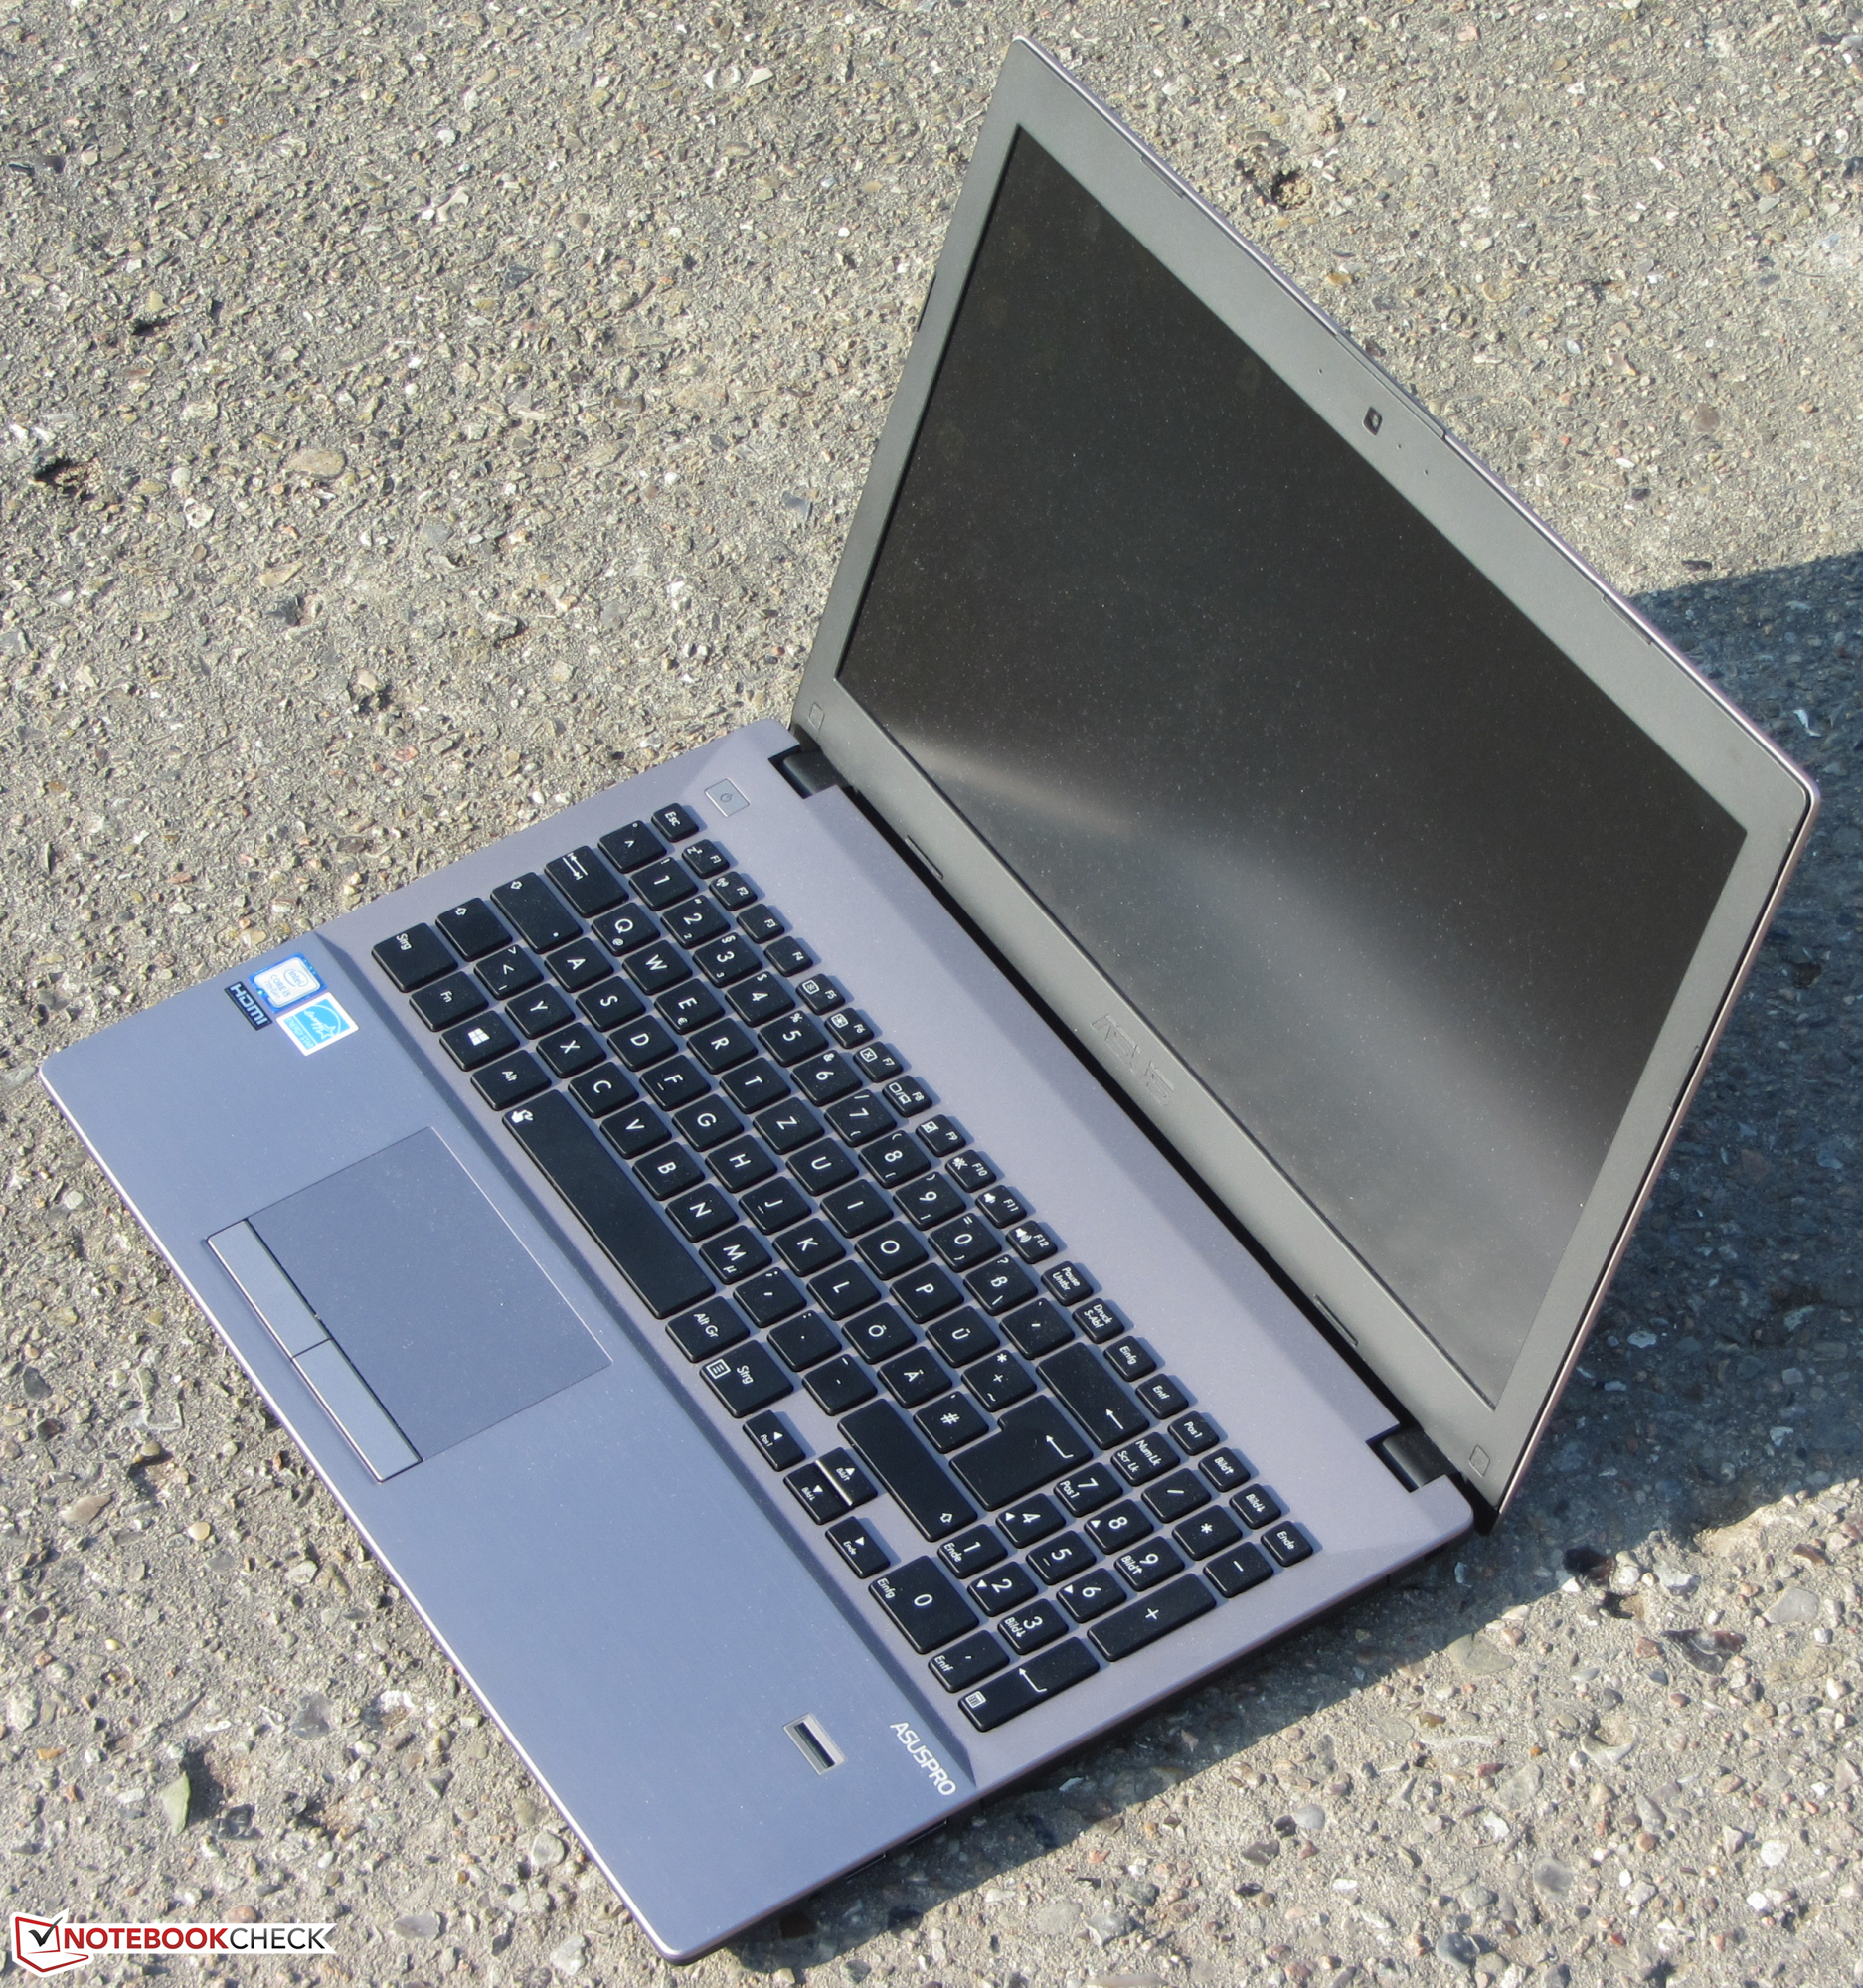
L'Asus AsusPro P4540UQ ha un processore Core-i5 della generazione Kaby-Lake, che dovrebbe soddisfare completamente le esigenze degli utenti. La scheda grafica GeForce consente l'utilizzo per i giochi. Nonostante la decente potenza di calcolo del dispositivo, si scalda poco ed è silenzioso.
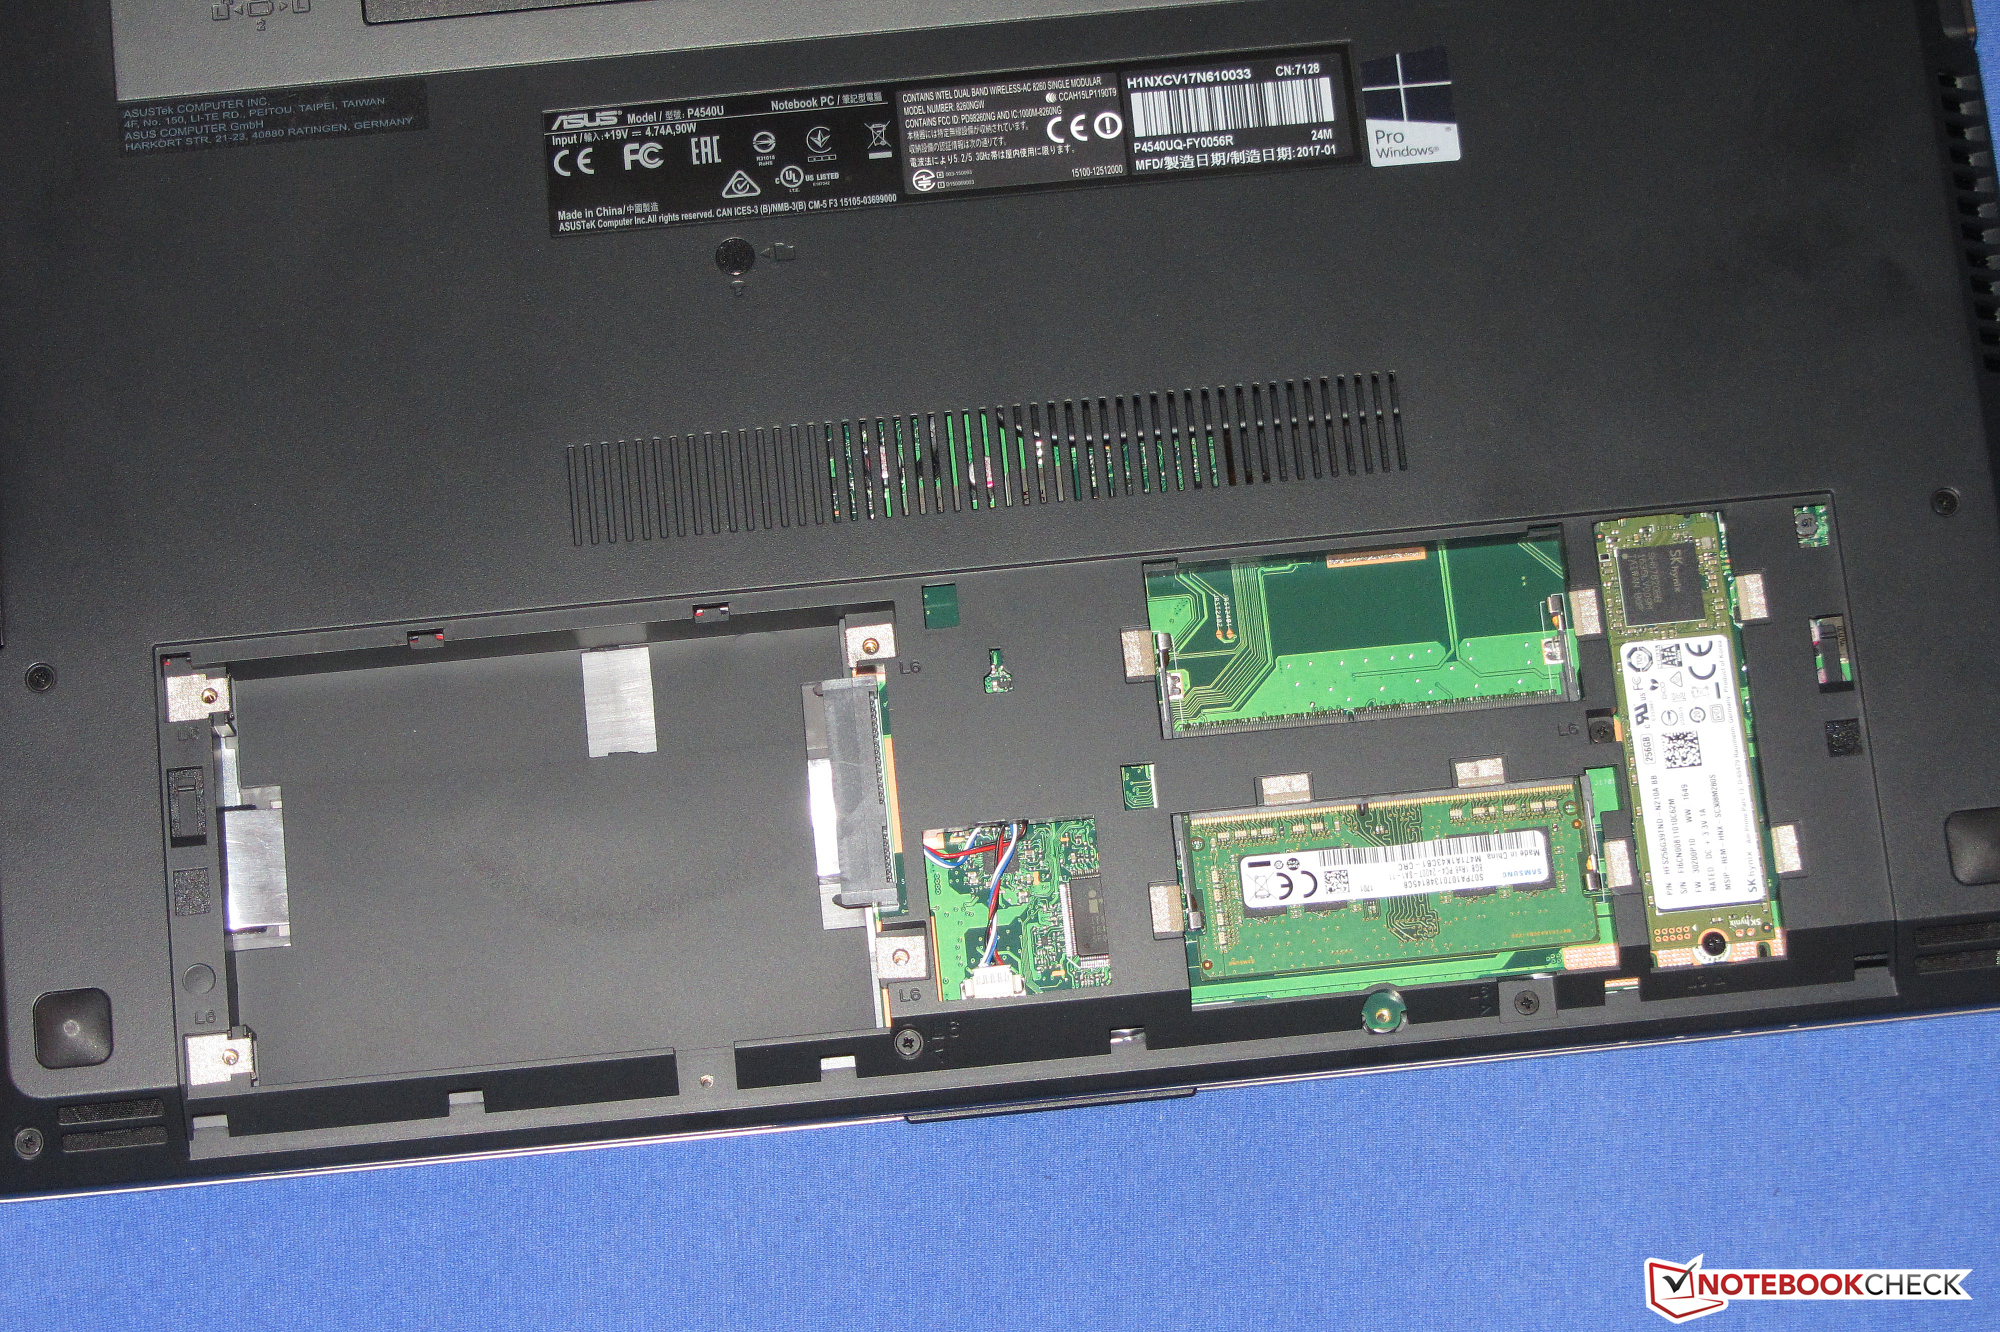
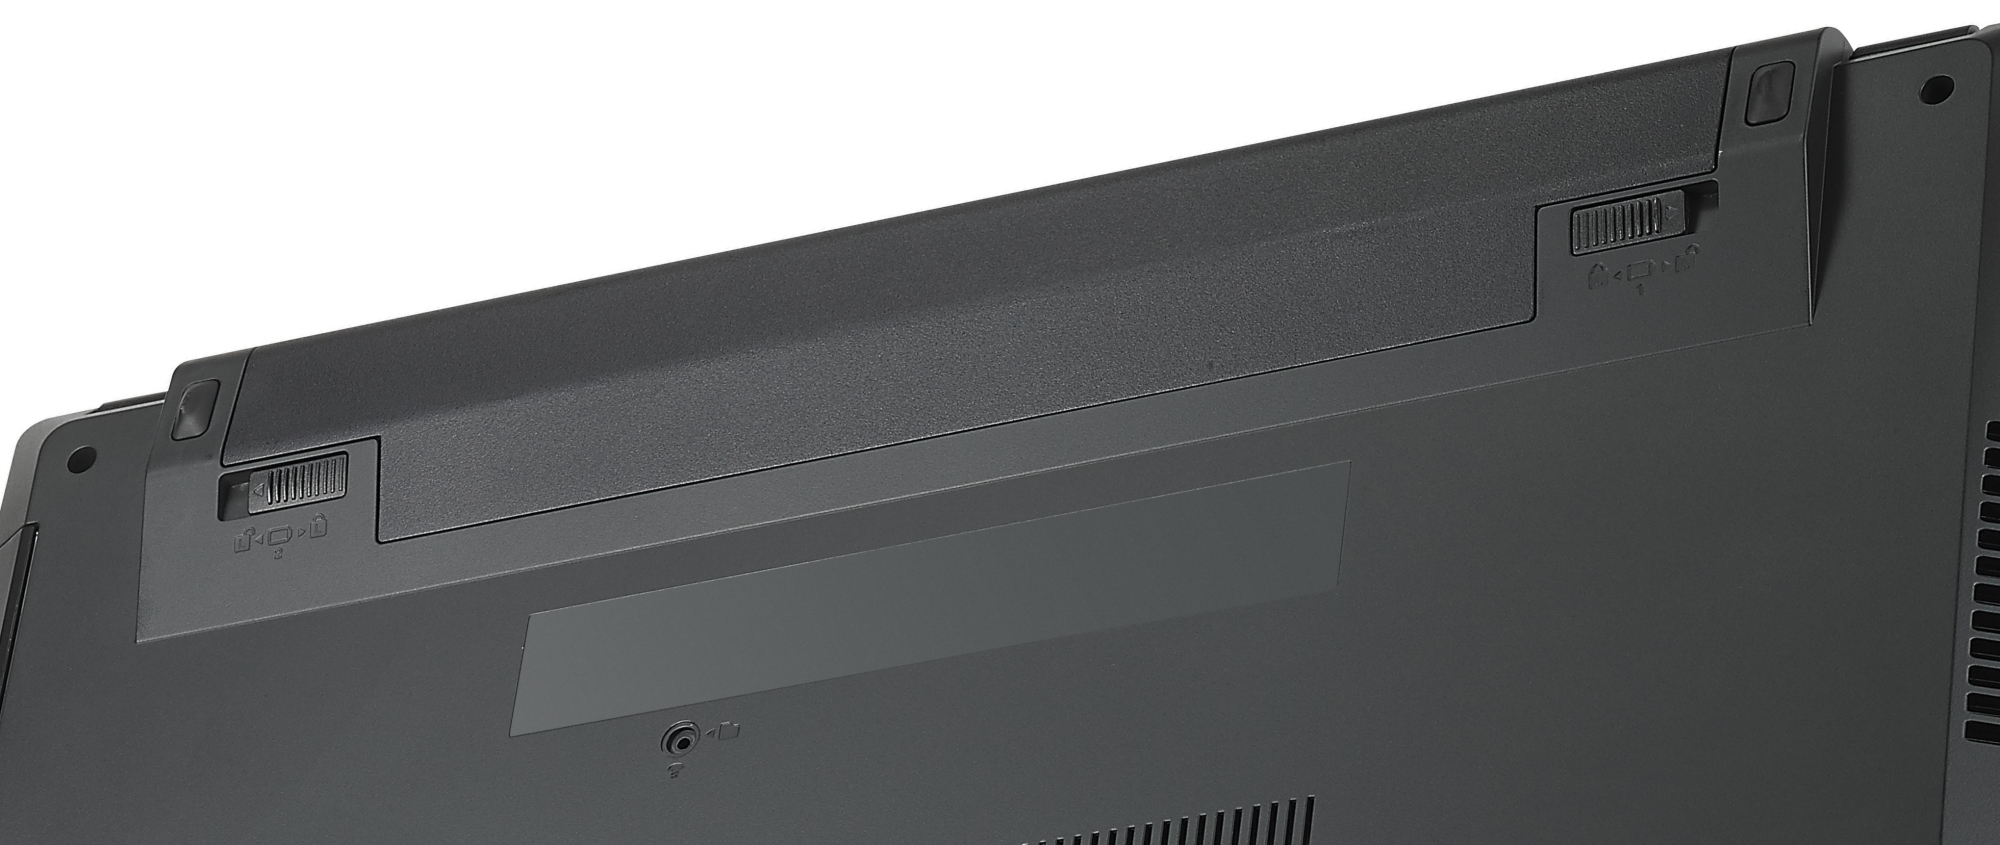
Un solid-state drive rende il sistema scattante. Grazie alla cover, possiamo rapidamente sostituire l'SSD. Ci sono anche possibilità di inserire un secondo hard drive da 2.5" nel computer. Tuttavia, occorre un supporto. Lo schermo matto IPS del computer piace per gli angoli di visuale stabili, il contrasto decente e la buona luminosità. L'autonomia eccellente non è da trascurare.
Con l'AsusPro P4540UQ, Asus compete davvero contro i principali concorrenti.
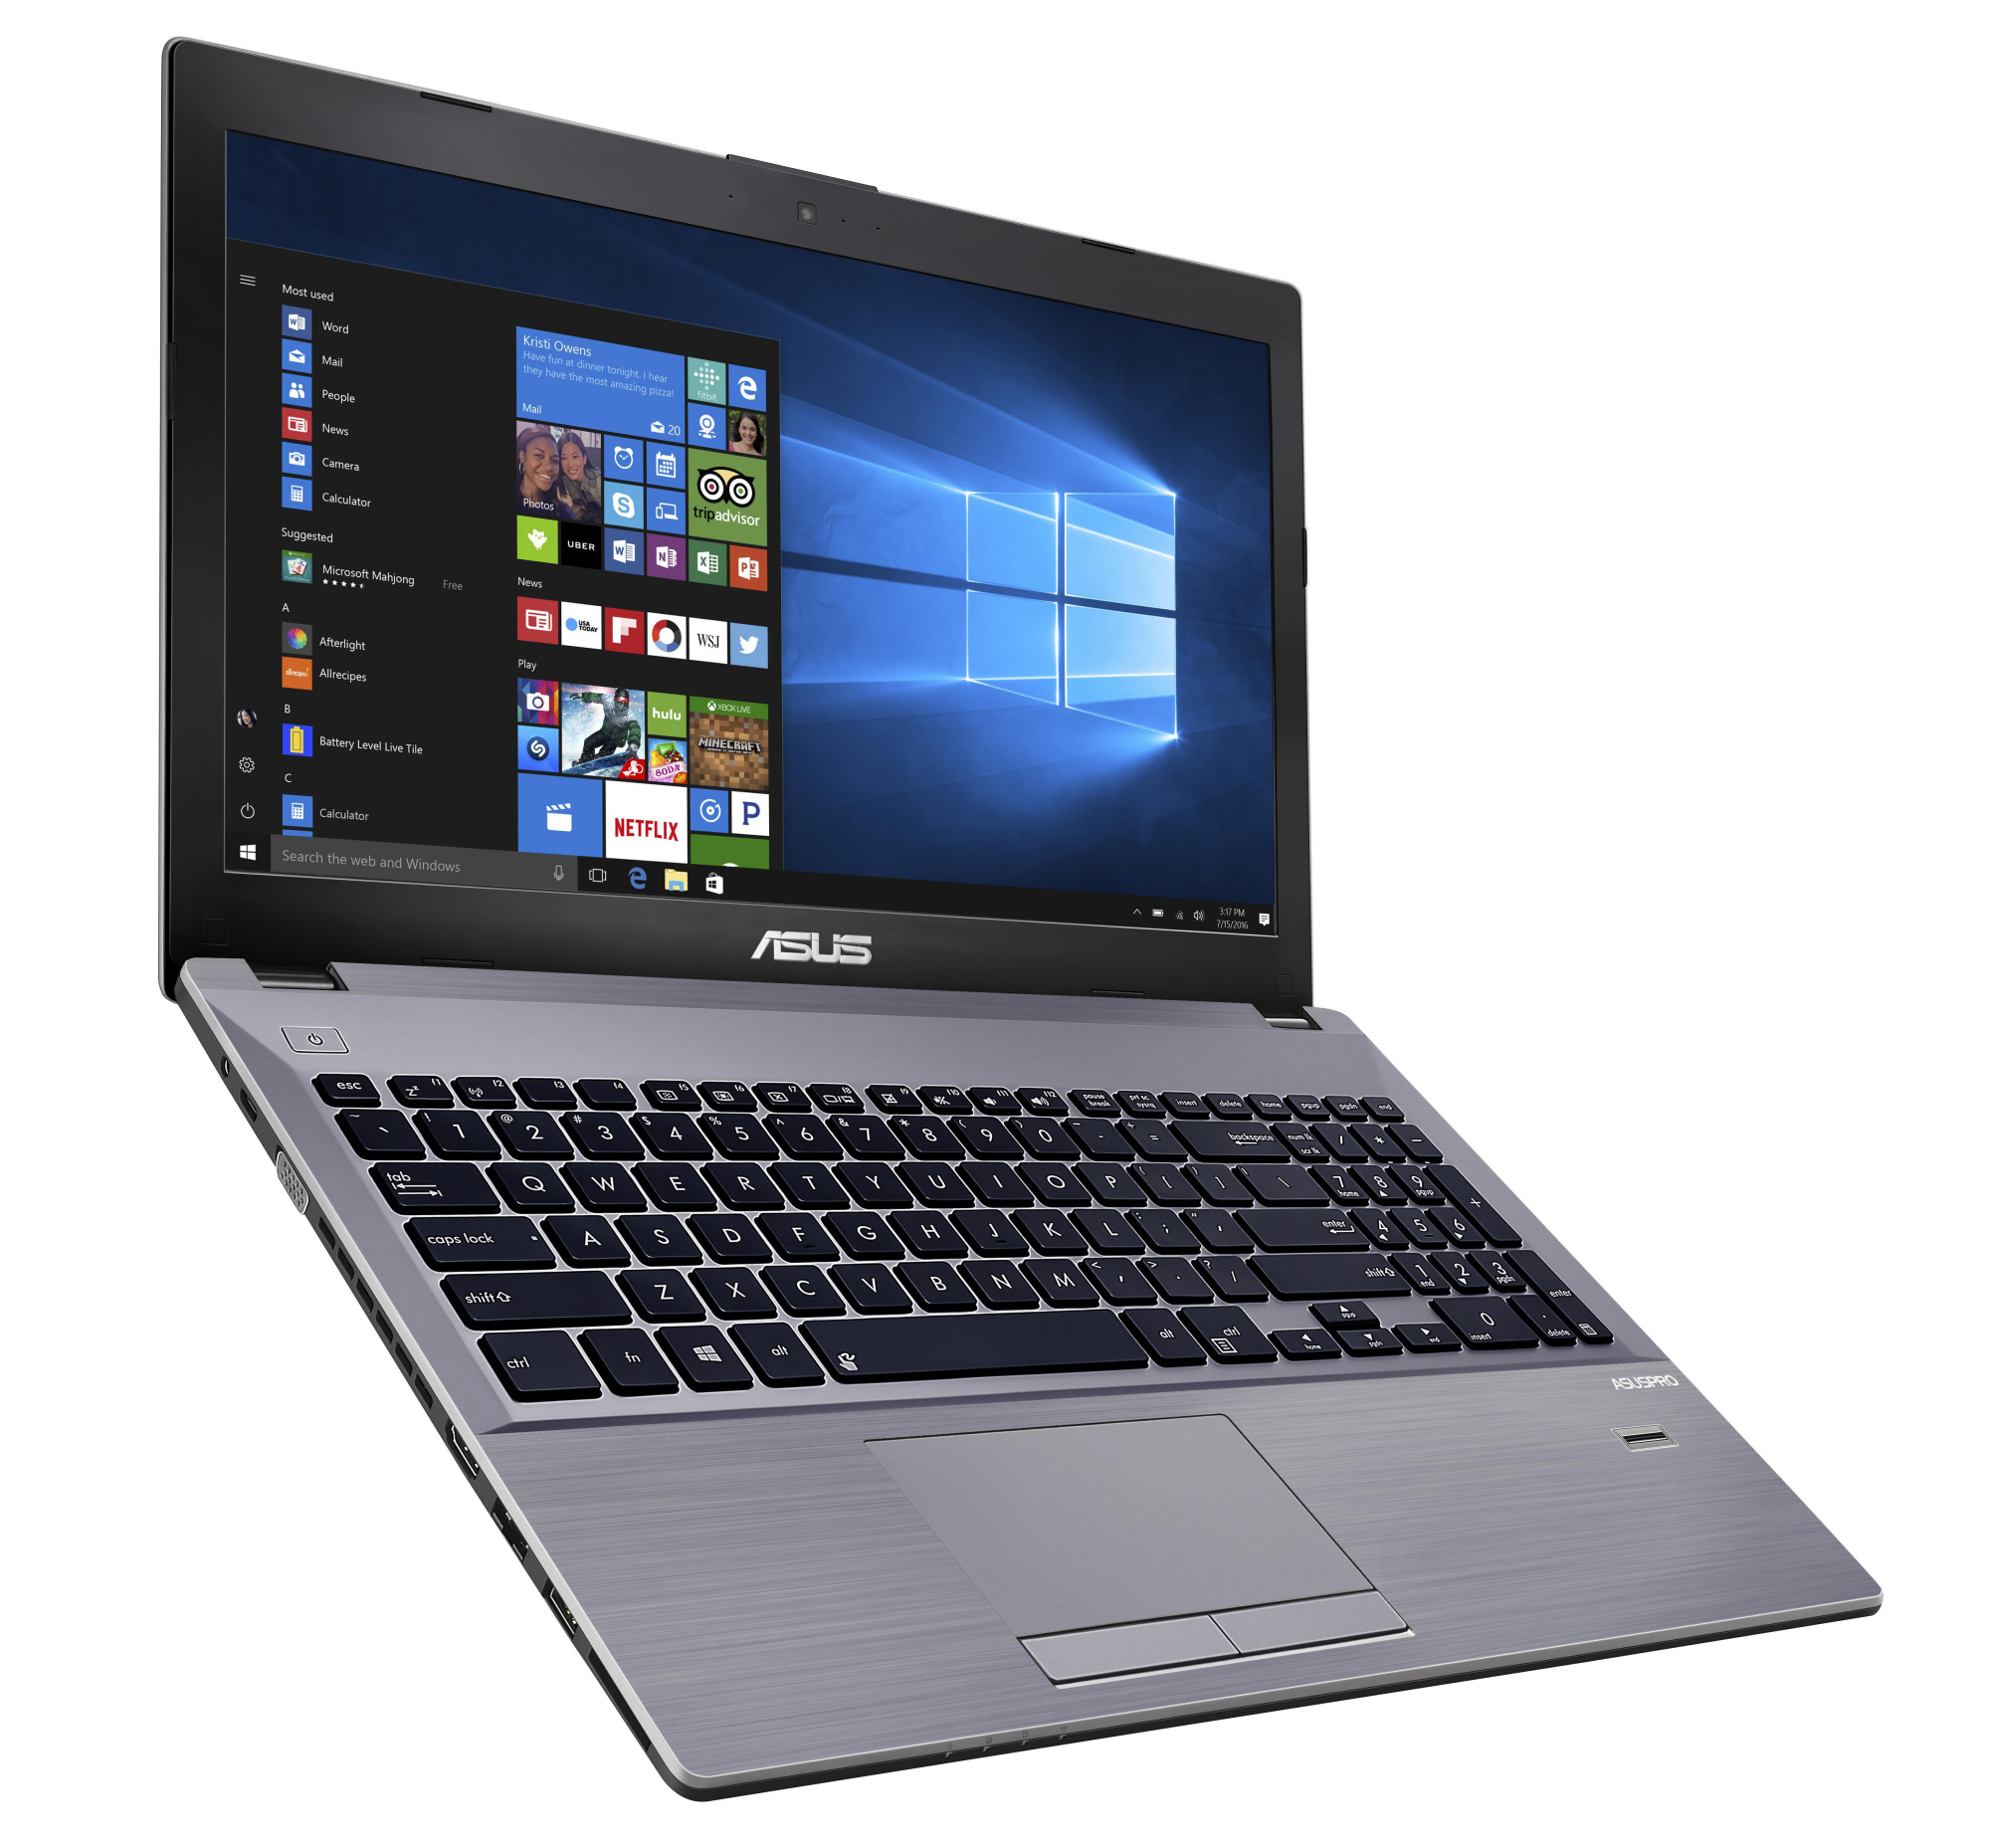
C'è spazio per miglioramenti alla tastiera, che non è male ma non regge il confronto con i modelli usati da HP Probook 450 G4 e Lenovo Thinkpad E570. Inoltre, la tastiera Asus non è illuminata. Ma a tal proposito sembra essere cosa comune in questo segmento.
Nota: si tratta di una recensione breve, con alcune sezioni non tradotte, per la versione integrale in inglese guardate qui.
Asus AsusPro P4540UQ-FY0056R
- 04/06/2017 v6 (old)
Sascha Mölck