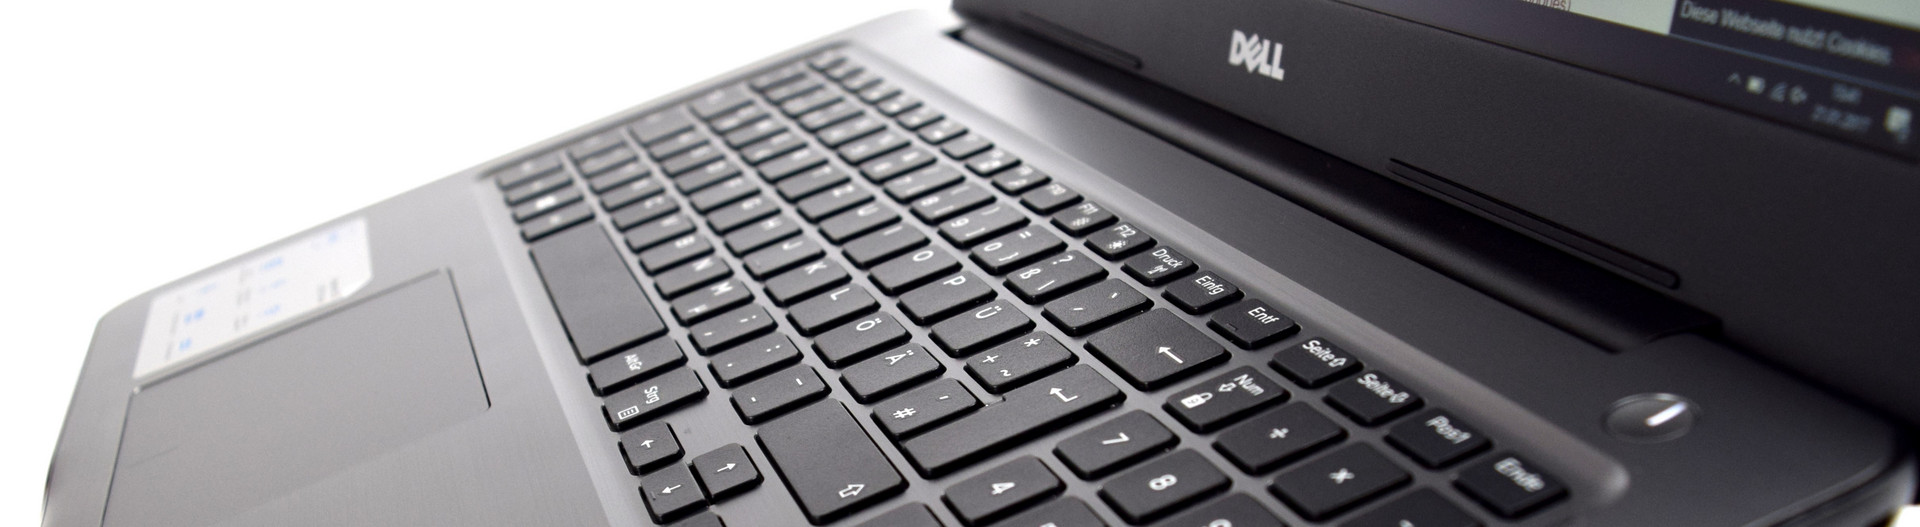
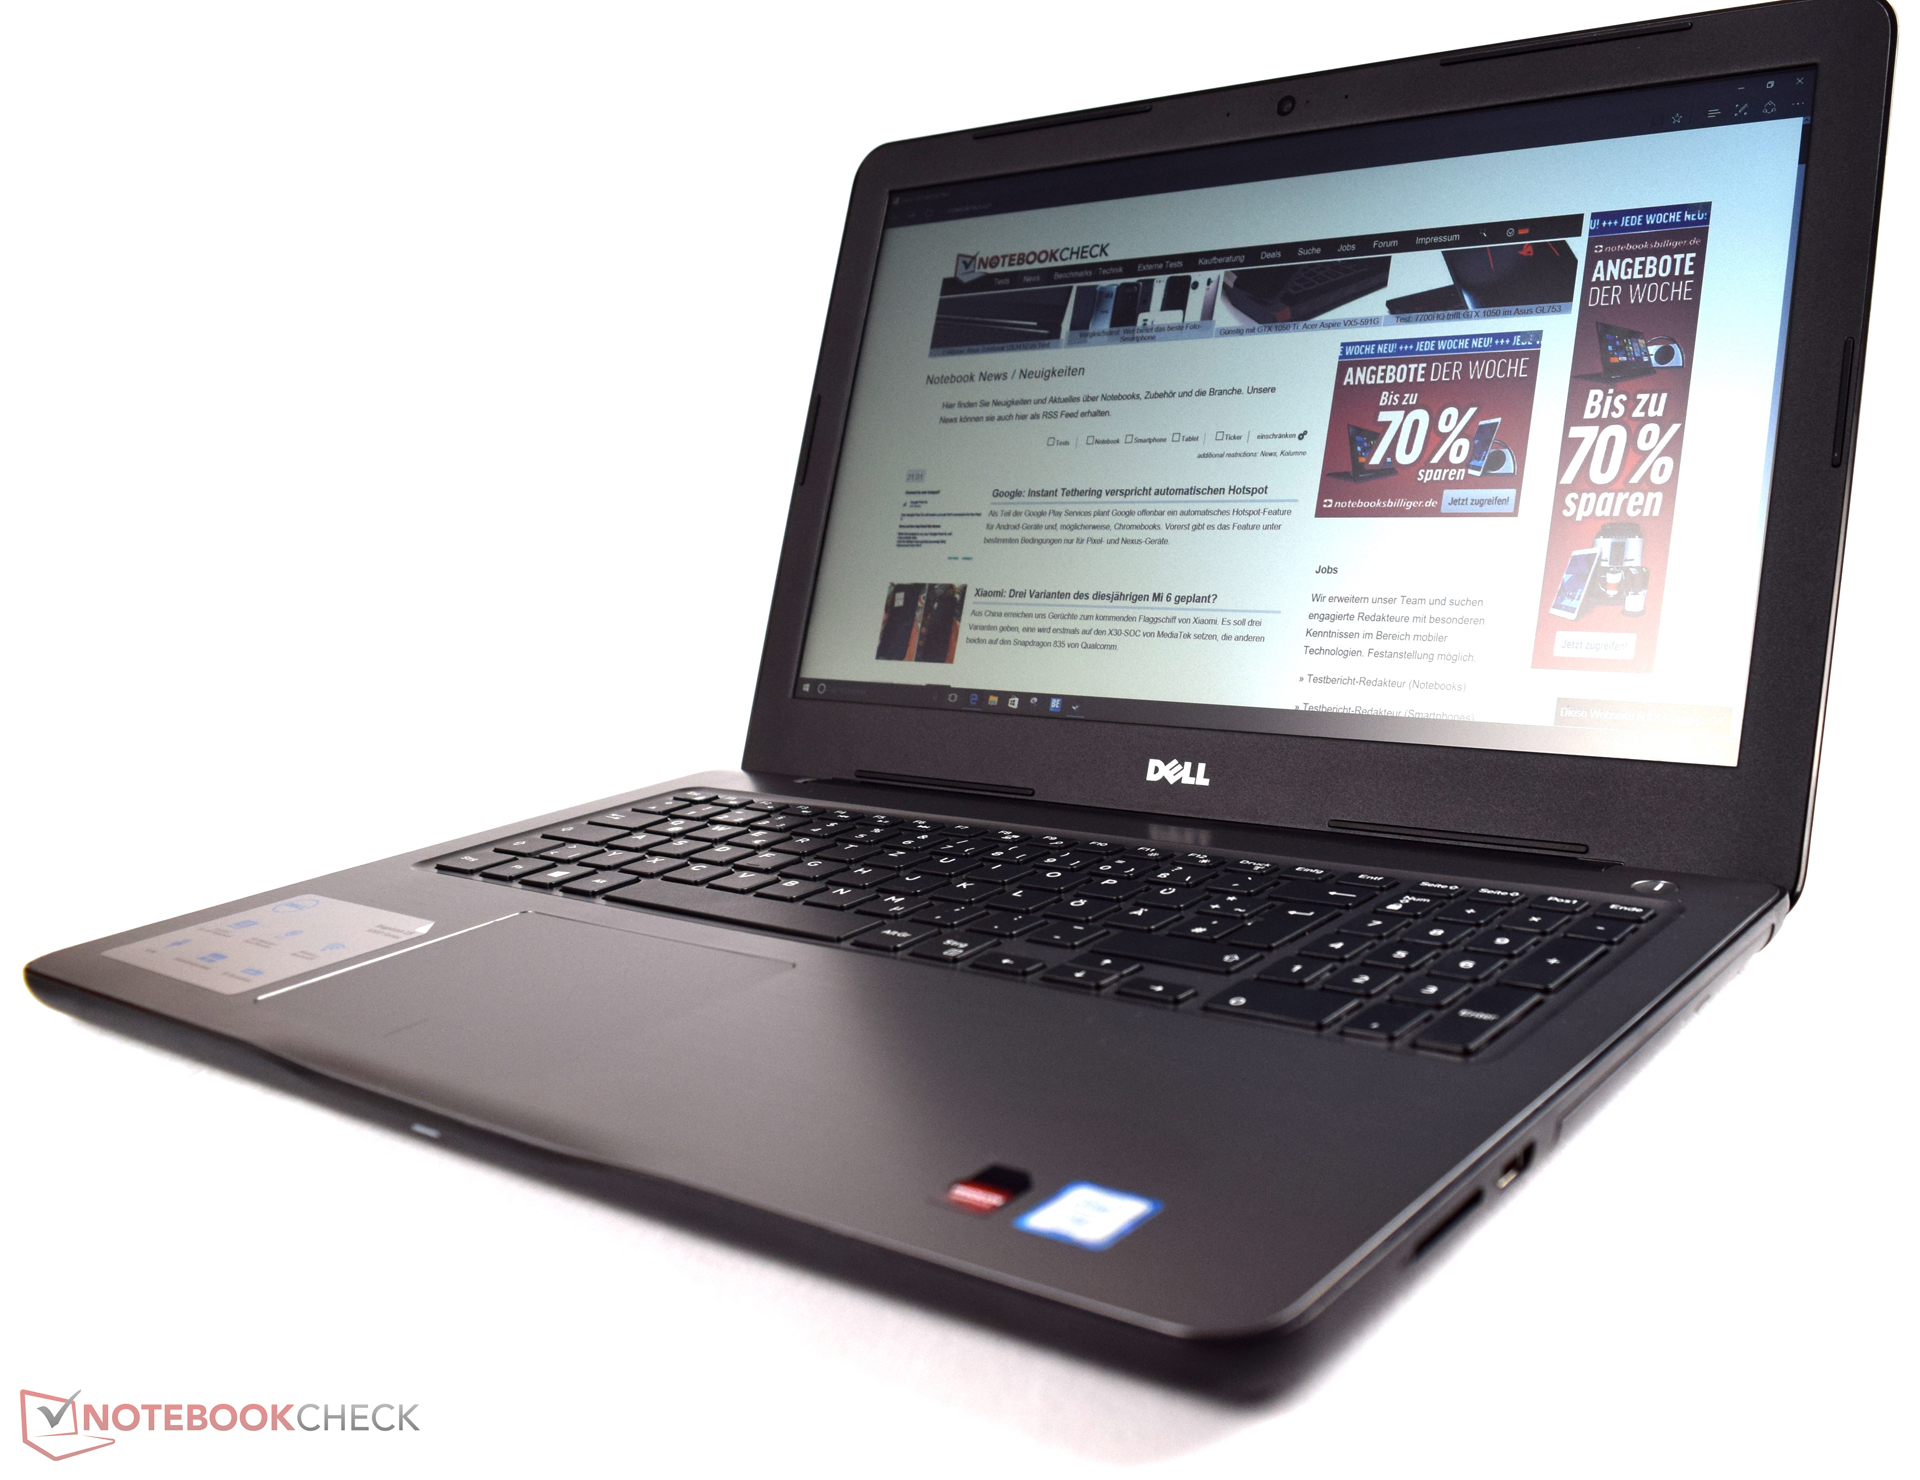
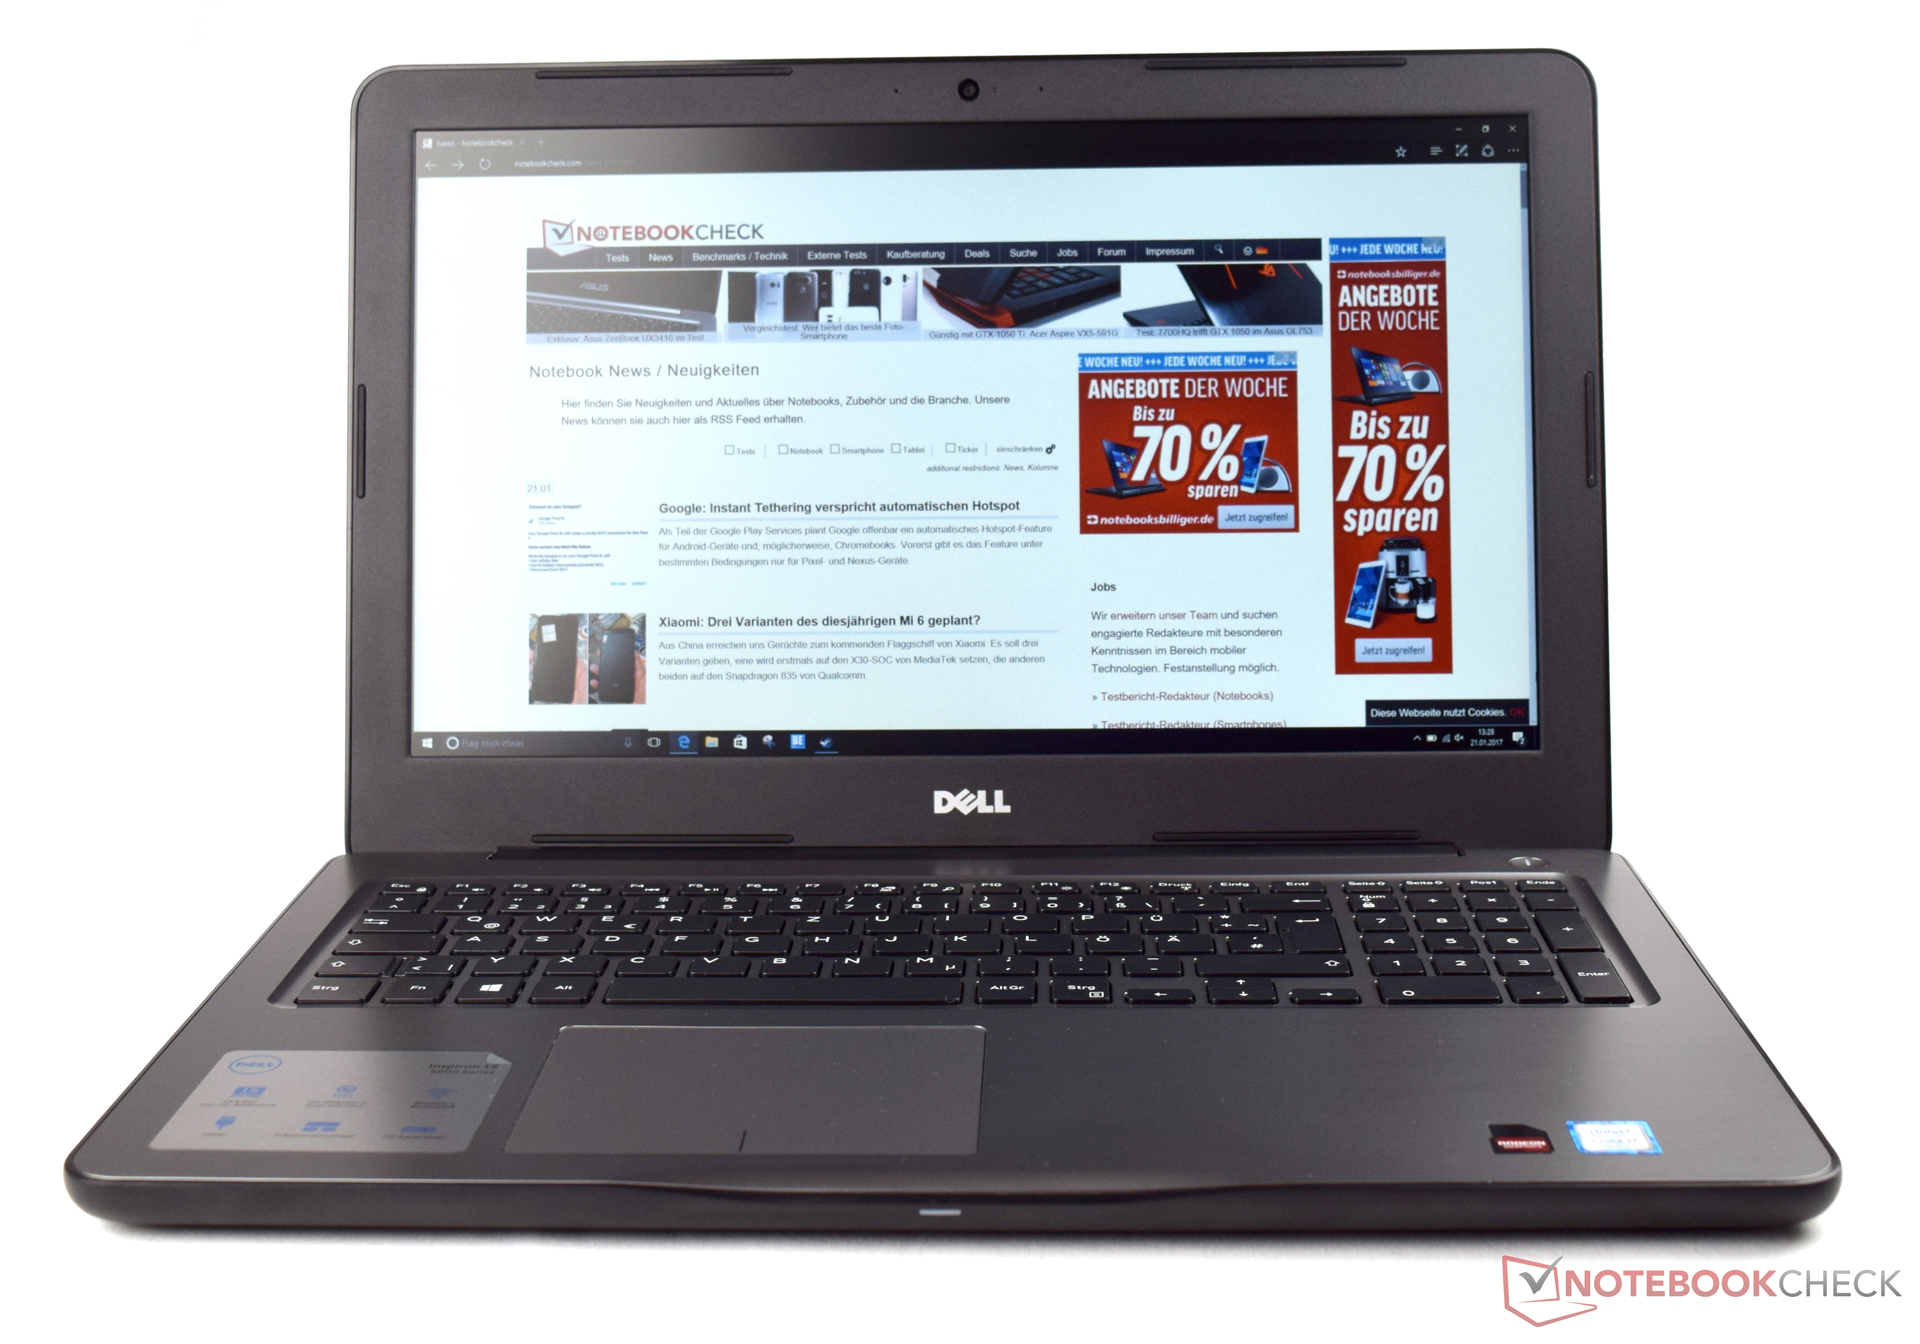
Recensione breve del Portatile Dell Inspiron 15 5000 5567-1753
| SD Card Reader | |
| average JPG Copy Test (av. of 3 runs) | |
| Lenovo ThinkPad E470-20H2S00400 | |
| Lenovo IdeaPad 510-15IKB 80SV0087GE | |
| Acer Aspire F15 F5-573G-53V1 | |
| HP Pavilion 15-aw004ng W8Y60EA | |
| Acer Aspire E5-575G-549D | |
| Dell Inspiron 15 5000 5567-1753 | |
| HP Pavilion 17-x110ng | |
| maximum AS SSD Seq Read Test (1GB) | |
| HP Pavilion 15-aw004ng W8Y60EA | |
| Lenovo ThinkPad E470-20H2S00400 | |
| Acer Aspire E5-575G-549D | |
| Dell Inspiron 15 5000 5567-1753 | |
| Lenovo IdeaPad 510-15IKB 80SV0087GE | |
| HP Pavilion 17-x110ng | |
| Networking | |
| iperf3 transmit AX12 | |
| Lenovo ThinkPad E470-20H2S00400 | |
| Dell Inspiron 15 5000 5567-1753 | |
| HP Pavilion 17-x110ng | |
| iperf3 receive AX12 | |
| Lenovo ThinkPad E470-20H2S00400 | |
| Dell Inspiron 15 5000 5567-1753 | |
| HP Pavilion 17-x110ng | |
| |||||||||||||||||||||||||
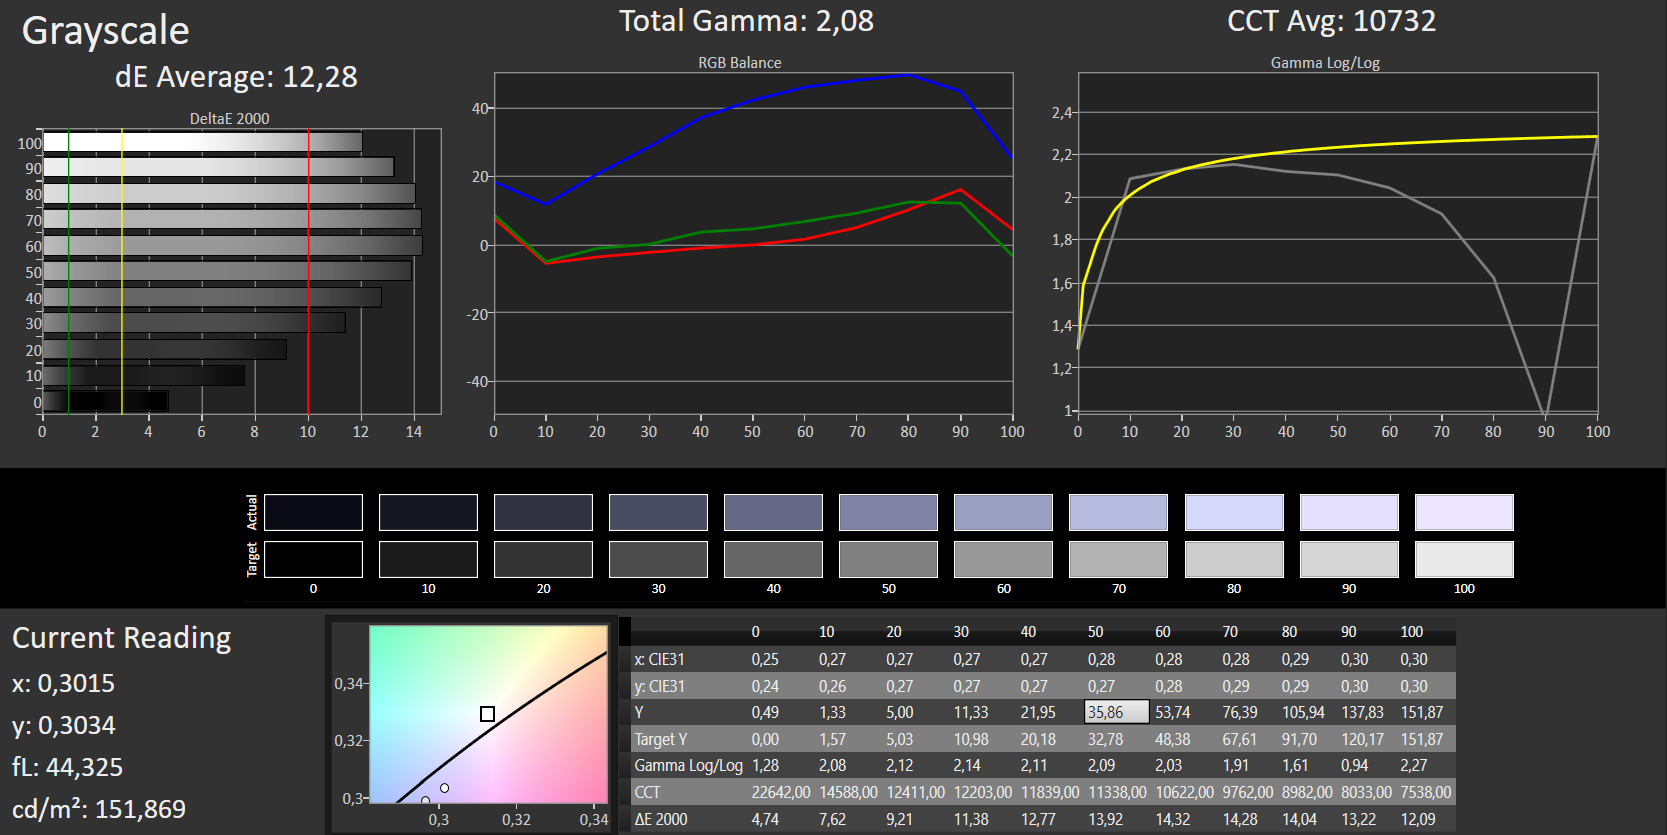
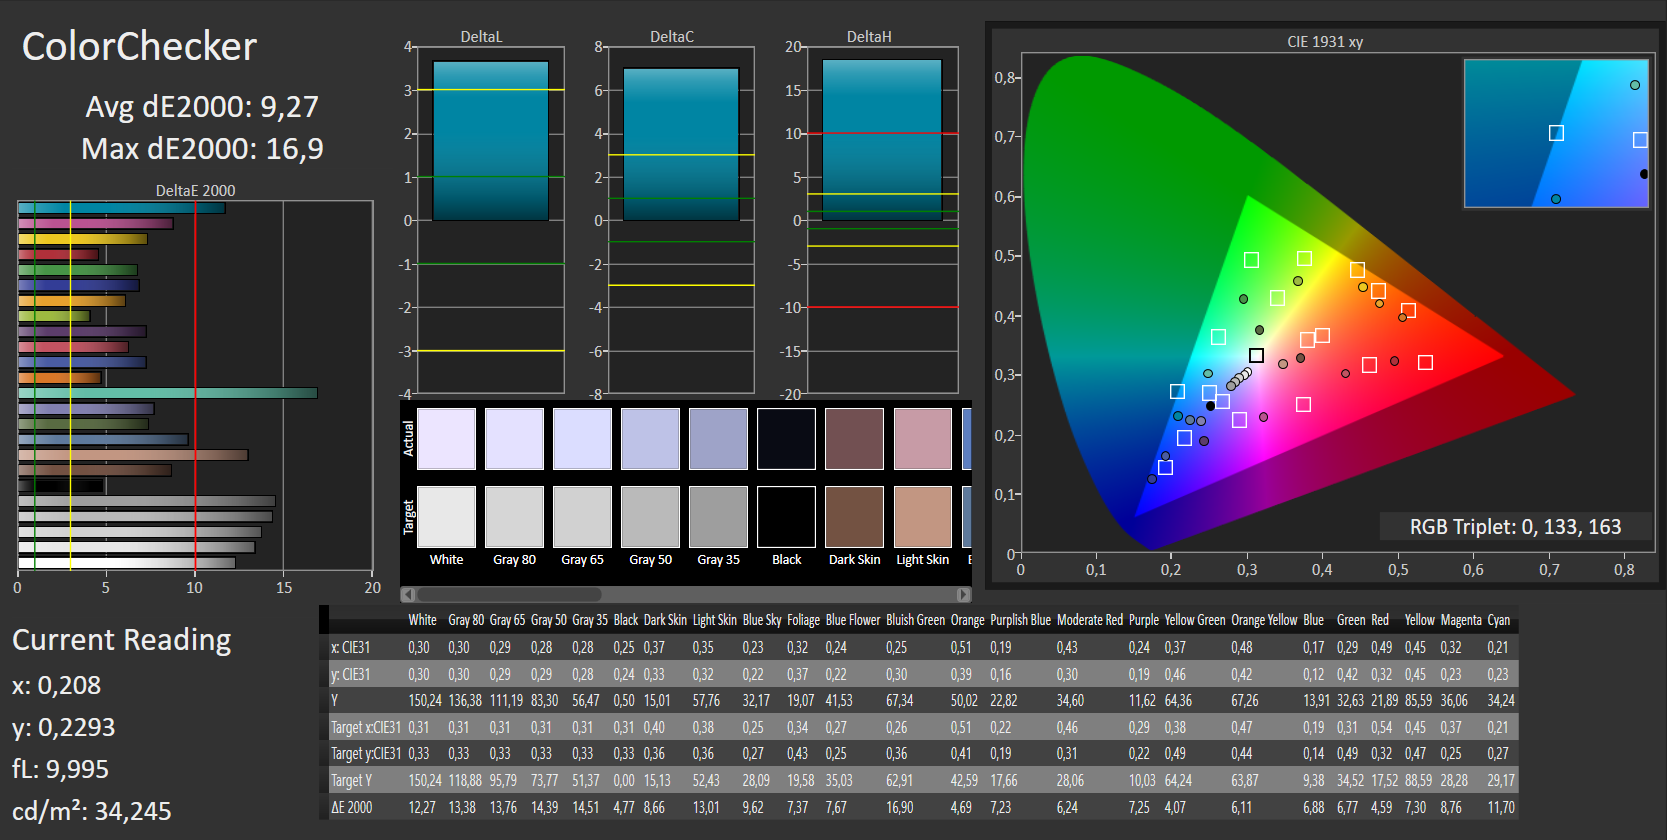
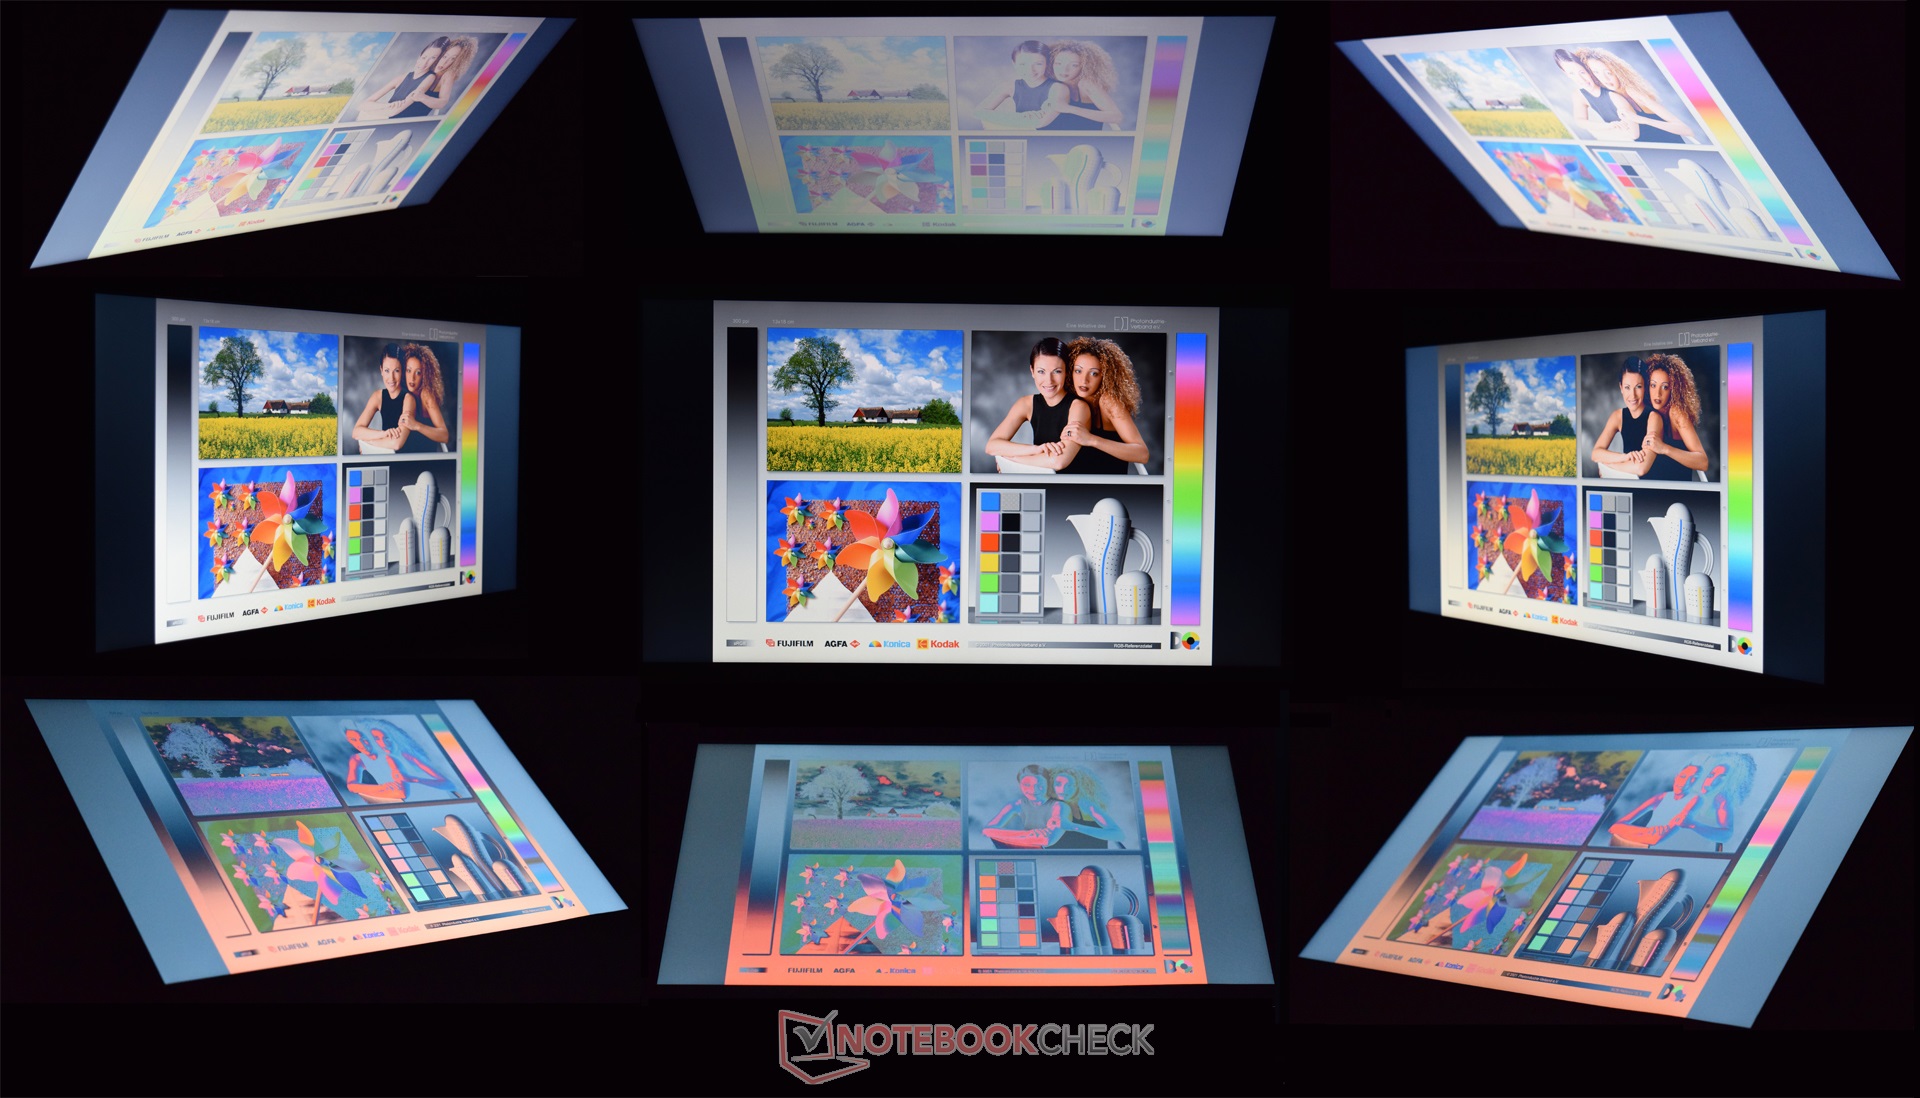
Distribuzione della luminosità: 90 %
Al centro con la batteria: 187 cd/m²
Contrasto: 296:1 (Nero: 0.49 cd/m²)
ΔE ColorChecker Calman: 9.27 | ∀{0.5-29.43 Ø4.71}
ΔE Greyscale Calman: 12.28 | ∀{0.09-98 Ø4.96}
55% sRGB (Argyll 1.6.3 3D)
35% AdobeRGB 1998 (Argyll 1.6.3 3D)
37.44% AdobeRGB 1998 (Argyll 3D)
54.6% sRGB (Argyll 3D)
36.24% Display P3 (Argyll 3D)
Gamma: 2.03
CCT: 10732 K
| Dell Inspiron 15 5000 5567-1753 BOE NT15N41, 1920x1080, 15.6" | Acer Aspire E5-575G-549D Chi Mei CMN15C4, 1920x1080, 15.6" | Lenovo IdeaPad 510-15IKB 80SV0087GE BOE HF NV156FHM-N42, 1920x1080, 15.6" | Lenovo ThinkPad E470-20H2S00400 N140HCA-EAB, 1920x1080, 14" | HP Pavilion 15-aw004ng W8Y60EA Chi Mei, 1920x1080, 15.6" | HP Pavilion 17-x110ng Chi Mei CMN1738, 1920x1080, 17.3" | |
|---|---|---|---|---|---|---|
| Display | 6% | 18% | 13% | 11% | 67% | |
| Display P3 Coverage (%) | 36.24 | 38.57 6% | 42.66 18% | 41.23 14% | 40.35 11% | 63.6 75% |
| sRGB Coverage (%) | 54.6 | 57.4 5% | 64.1 17% | 61.4 12% | 60.3 10% | 86.5 58% |
| AdobeRGB 1998 Coverage (%) | 37.44 | 39.89 7% | 44.08 18% | 42.67 14% | 41.71 11% | 63.3 69% |
| Response Times | -31% | -95% | -56% | -30% | -55% | |
| Response Time Grey 50% / Grey 80% * (ms) | 43 ? | 39 ? 9% | 51 ? -19% | 40.8 ? 5% | 41 ? 5% | 41 ? 5% |
| Response Time Black / White * (ms) | 14 ? | 24 ? -71% | 38 ? -171% | 30.4 ? -117% | 23 ? -64% | 30 ? -114% |
| PWM Frequency (Hz) | 50 ? | 200 ? | ||||
| Screen | 13% | 76% | 40% | 19% | 52% | |
| Brightness middle (cd/m²) | 145 | 176 21% | 291 101% | 244 68% | 240 66% | 288 99% |
| Brightness (cd/m²) | 144 | 169 17% | 265 84% | 231 60% | 228 58% | 285 98% |
| Brightness Distribution (%) | 90 | 91 1% | 86 -4% | 89 -1% | 89 -1% | 88 -2% |
| Black Level * (cd/m²) | 0.49 | 0.47 4% | 0.23 53% | 0.37 24% | 0.49 -0% | 0.61 -24% |
| Contrast (:1) | 296 | 374 26% | 1265 327% | 659 123% | 490 66% | 472 59% |
| Colorchecker dE 2000 * | 9.27 | 8.83 5% | 4.78 48% | 6.41 31% | 10.96 -18% | 4.56 51% |
| Colorchecker dE 2000 max. * | 16.9 | 14.01 17% | 9.51 44% | 13.4 21% | 18.36 -9% | 7.76 54% |
| Greyscale dE 2000 * | 12.28 | 8.97 27% | 3.49 72% | 5.94 52% | 11.34 8% | 4.95 60% |
| Gamma | 2.03 108% | 2.43 91% | 2.58 85% | 2.28 96% | 2.27 97% | 2.48 89% |
| CCT | 10732 61% | 10234 64% | 6013 108% | 6101 107% | 12292 53% | 7669 85% |
| Color Space (Percent of AdobeRGB 1998) (%) | 35 | 36.8 5% | 40 14% | 39.3 12% | 39 11% | |
| Color Space (Percent of sRGB) (%) | 55 | 57.3 4% | 64 16% | 61.1 11% | 60 9% | 93 69% |
| Media totale (Programma / Settaggio) | -4% /
6% | -0% /
41% | -1% /
22% | 0% /
11% | 21% /
40% |
* ... Meglio usare valori piccoli
Tempi di risposta del Display
| ↔ Tempi di risposta dal Nero al Bianco | ||
|---|---|---|
| 14 ms ... aumenta ↗ e diminuisce ↘ combinato | ↗ 6 ms Incremento | 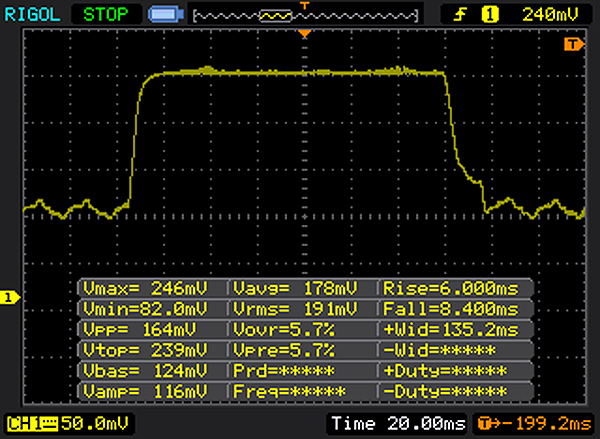 |
| ↘ 8 ms Calo | ||
| Lo schermo mostra buoni tempi di risposta durante i nostri tests, ma potrebbe essere troppo lento per i gamers competitivi. In confronto, tutti i dispositivi di test variano da 0.1 (minimo) a 240 (massimo) ms. » 34 % di tutti i dispositivi è migliore. Questo significa che i tempi di risposta rilevati sono migliori rispettto alla media di tutti i dispositivi testati (19.8 ms). | ||
| ↔ Tempo di risposta dal 50% Grigio all'80% Grigio | ||
| 43 ms ... aumenta ↗ e diminuisce ↘ combinato | ↗ 18 ms Incremento | 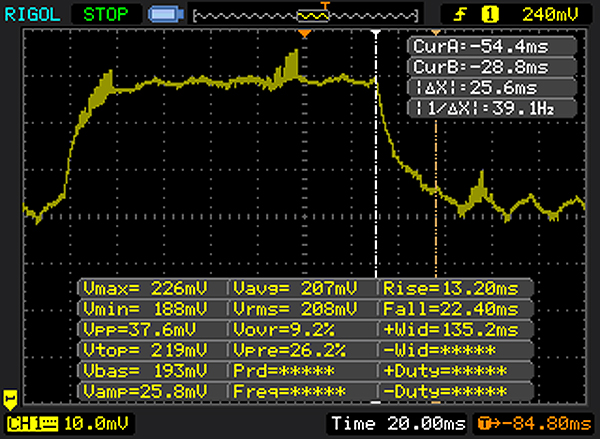 |
| ↘ 25 ms Calo | ||
| Lo schermo mostra tempi di risposta lenti nei nostri tests e sarà insoddisfacente per i gamers. In confronto, tutti i dispositivi di test variano da 0.165 (minimo) a 636 (massimo) ms. » 71 % di tutti i dispositivi è migliore. Questo significa che i tempi di risposta rilevati sono peggiori rispetto alla media di tutti i dispositivi testati (31 ms). | ||
Sfarfallio dello schermo / PWM (Pulse-Width Modulation)
| flickering dello schermo / PWM non rilevato | ||
In confronto: 52 % di tutti i dispositivi testati non utilizza PWM per ridurre la luminosita' del display. Se è rilevato PWM, una media di 7757 (minimo: 5 - massimo: 343500) Hz è stata rilevata. | ||
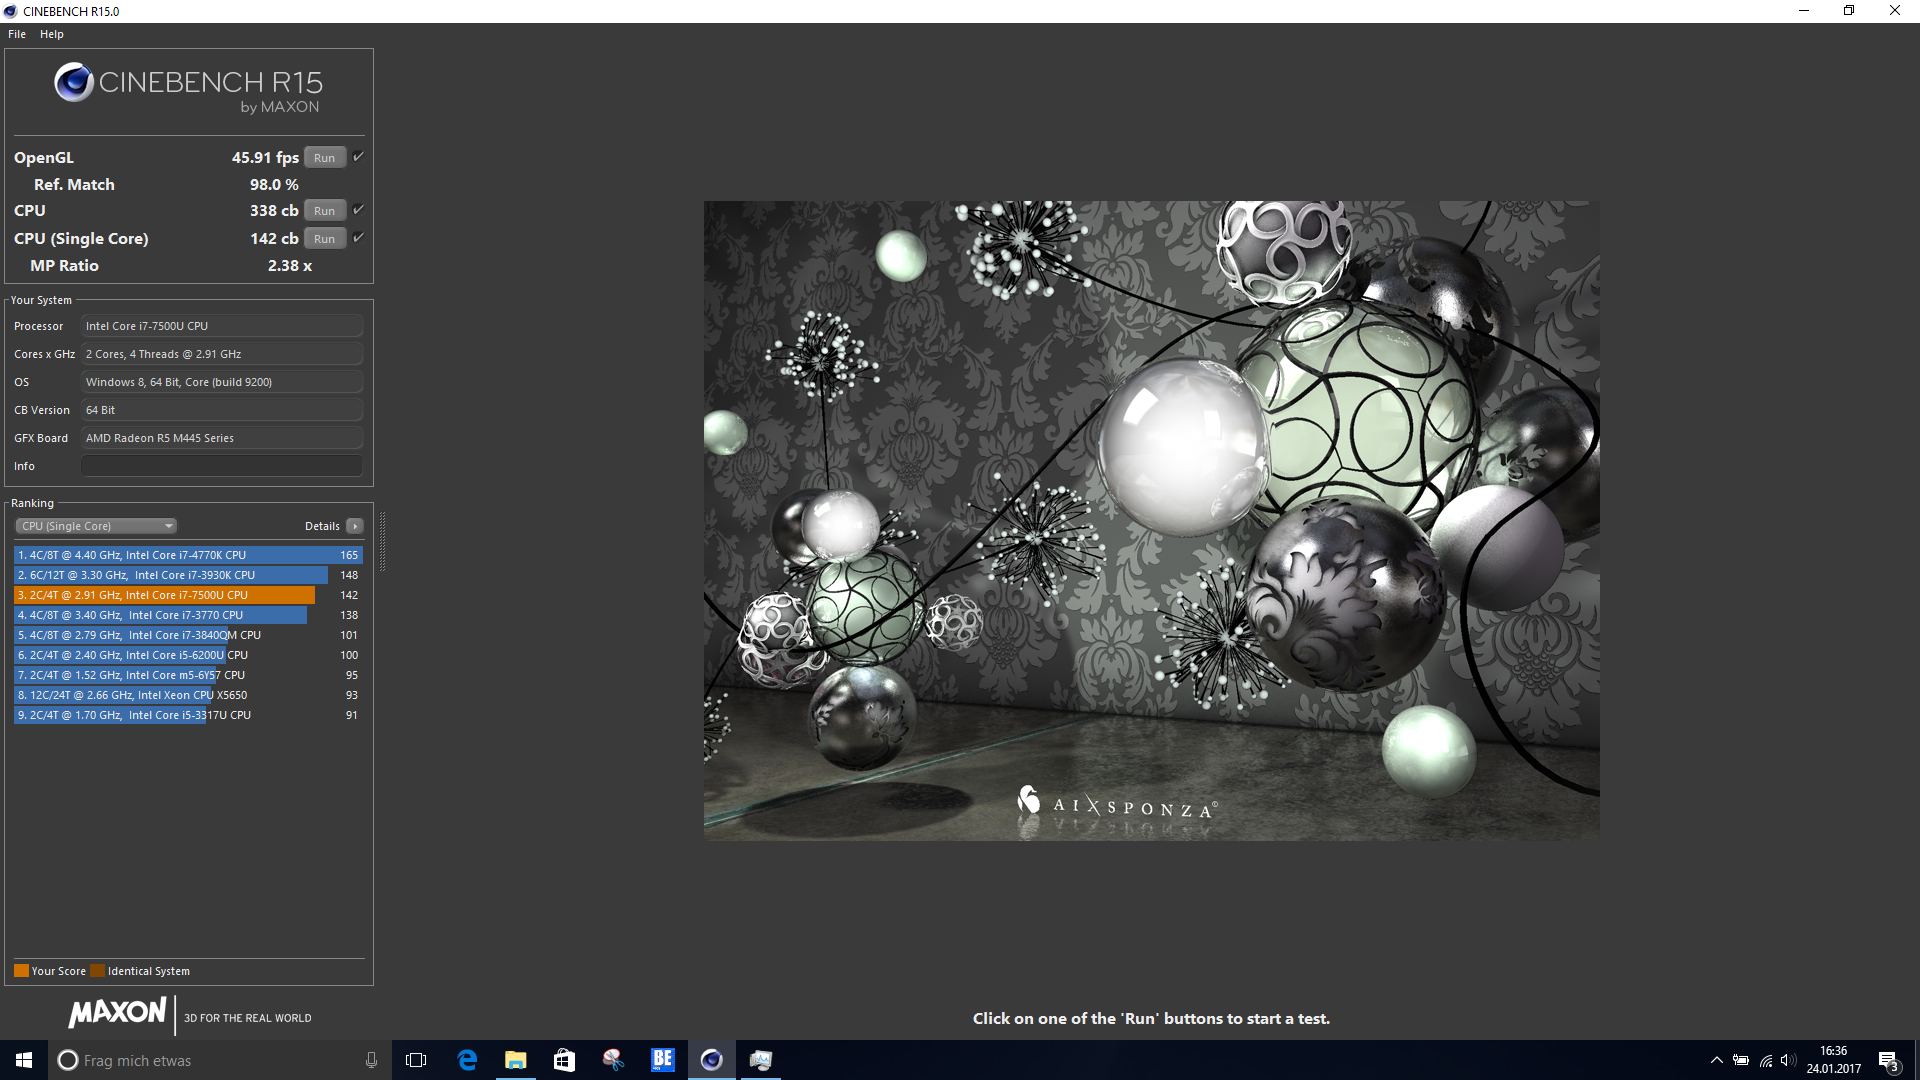
| Cinebench R15 | |
| CPU Single 64Bit | |
| Lenovo IdeaPad 510-15IKB 80SV0087GE | |
| Dell Inspiron 15 5000 5567-1753 | |
| HP Pavilion 17-x110ng | |
| Acer Aspire E5-575G-549D | |
| Lenovo ThinkPad E470-20H2S00400 | |
| HP Pavilion 15-aw004ng W8Y60EA | |
| CPU Multi 64Bit | |
| Lenovo IdeaPad 510-15IKB 80SV0087GE | |
| Dell Inspiron 15 5000 5567-1753 | |
| Acer Aspire E5-575G-549D | |
| Lenovo ThinkPad E470-20H2S00400 | |
| HP Pavilion 17-x110ng | |
| HP Pavilion 15-aw004ng W8Y60EA | |
| Cinebench R11.5 | |
| CPU Single 64Bit | |
| Dell Inspiron 15 5000 5567-1753 | |
| Acer Aspire E5-575G-549D | |
| Lenovo ThinkPad E470-20H2S00400 | |
| HP Pavilion 17-x110ng | |
| HP Pavilion 15-aw004ng W8Y60EA | |
| CPU Multi 64Bit | |
| Dell Inspiron 15 5000 5567-1753 | |
| Acer Aspire E5-575G-549D | |
| Lenovo ThinkPad E470-20H2S00400 | |
| HP Pavilion 17-x110ng | |
| HP Pavilion 15-aw004ng W8Y60EA | |
| Cinebench R10 | |
| Rendering Single CPUs 64Bit | |
| Dell Inspiron 15 5000 5567-1753 | |
| HP Pavilion 17-x110ng | |
| Rendering Multiple CPUs 64Bit | |
| Dell Inspiron 15 5000 5567-1753 | |
| HP Pavilion 17-x110ng | |
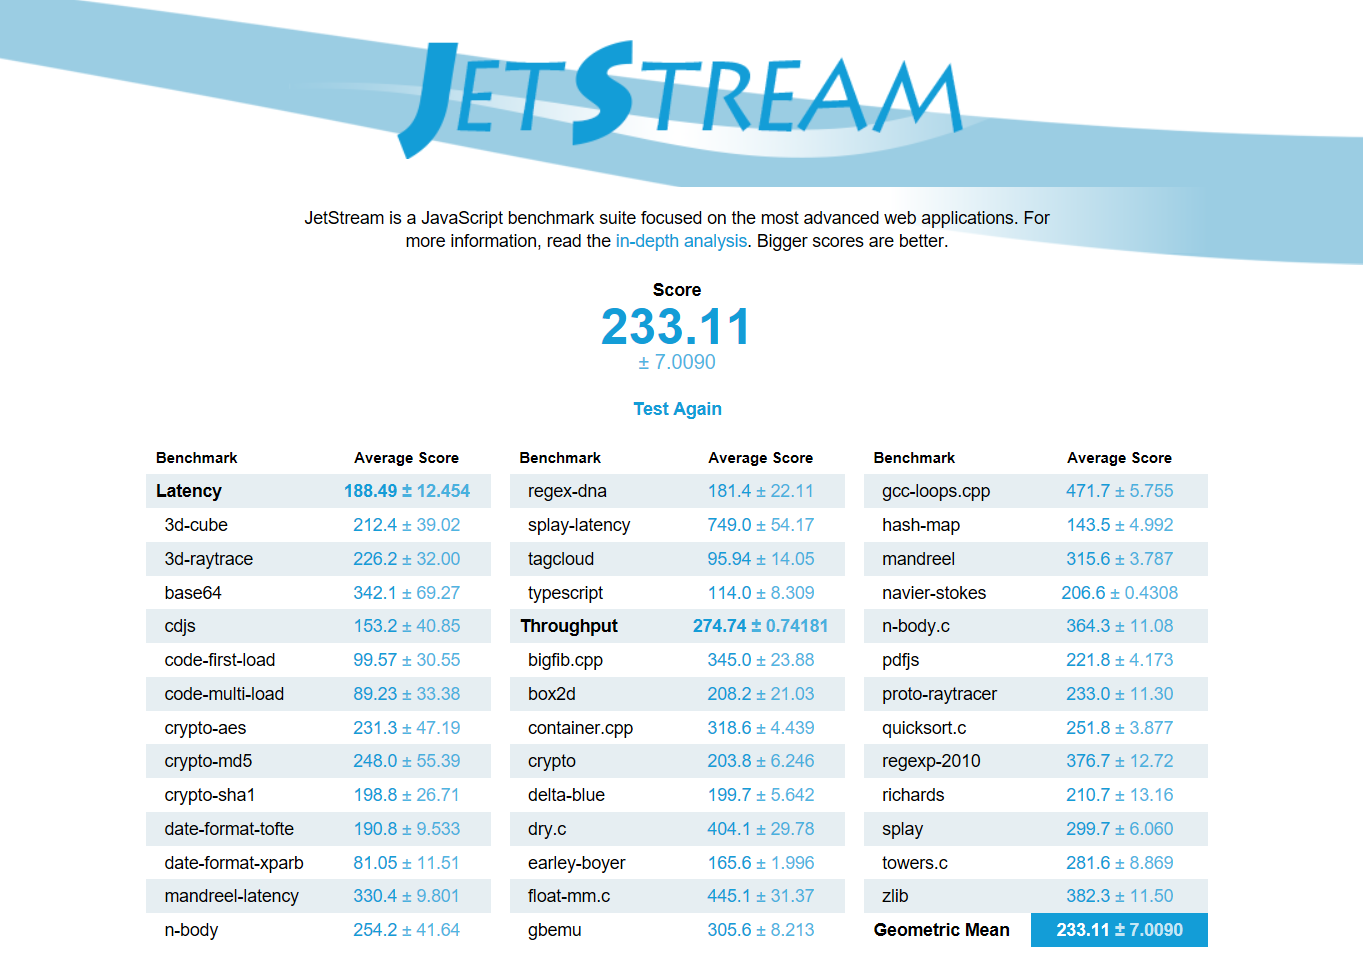
| JetStream 1.1 - 1.1 Total | |
| Lenovo IdeaPad 510-15IKB 80SV0087GE | |
| Dell Inspiron 15 5000 5567-1753 | |
| Acer Aspire E5-575G-549D | |
| HP Pavilion 17-x110ng | |
| Lenovo ThinkPad E470-20H2S00400 | |
| HP Pavilion 15-aw004ng W8Y60EA | |
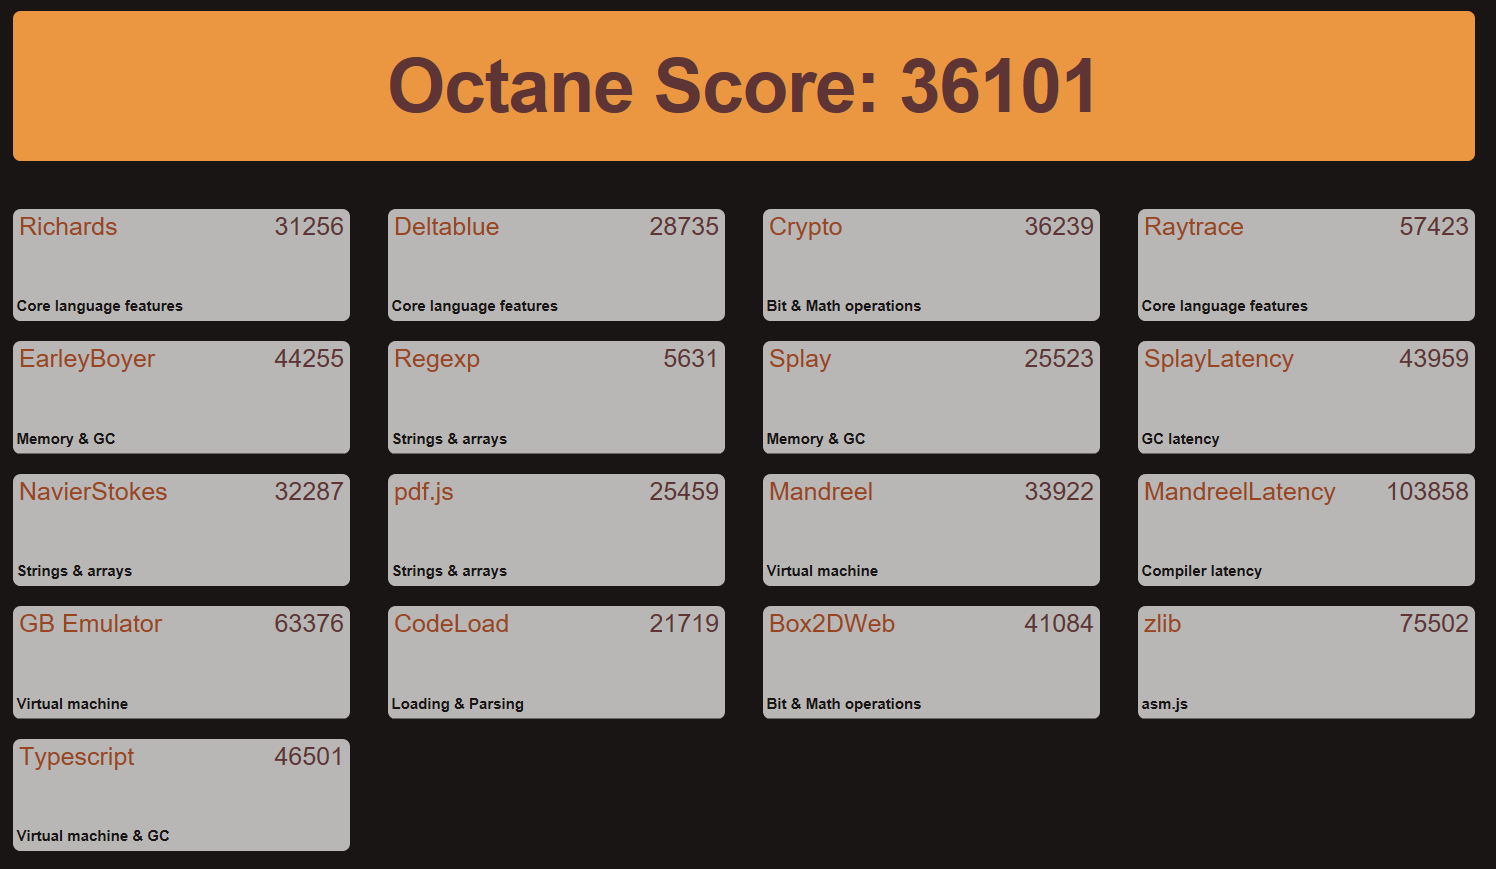
| Octane V2 - Total Score | |
| Dell Inspiron 15 5000 5567-1753 | |
| Lenovo ThinkPad E470-20H2S00400 | |
| HP Pavilion 17-x110ng | |
| Acer Aspire E5-575G-549D | |
| HP Pavilion 15-aw004ng W8Y60EA | |
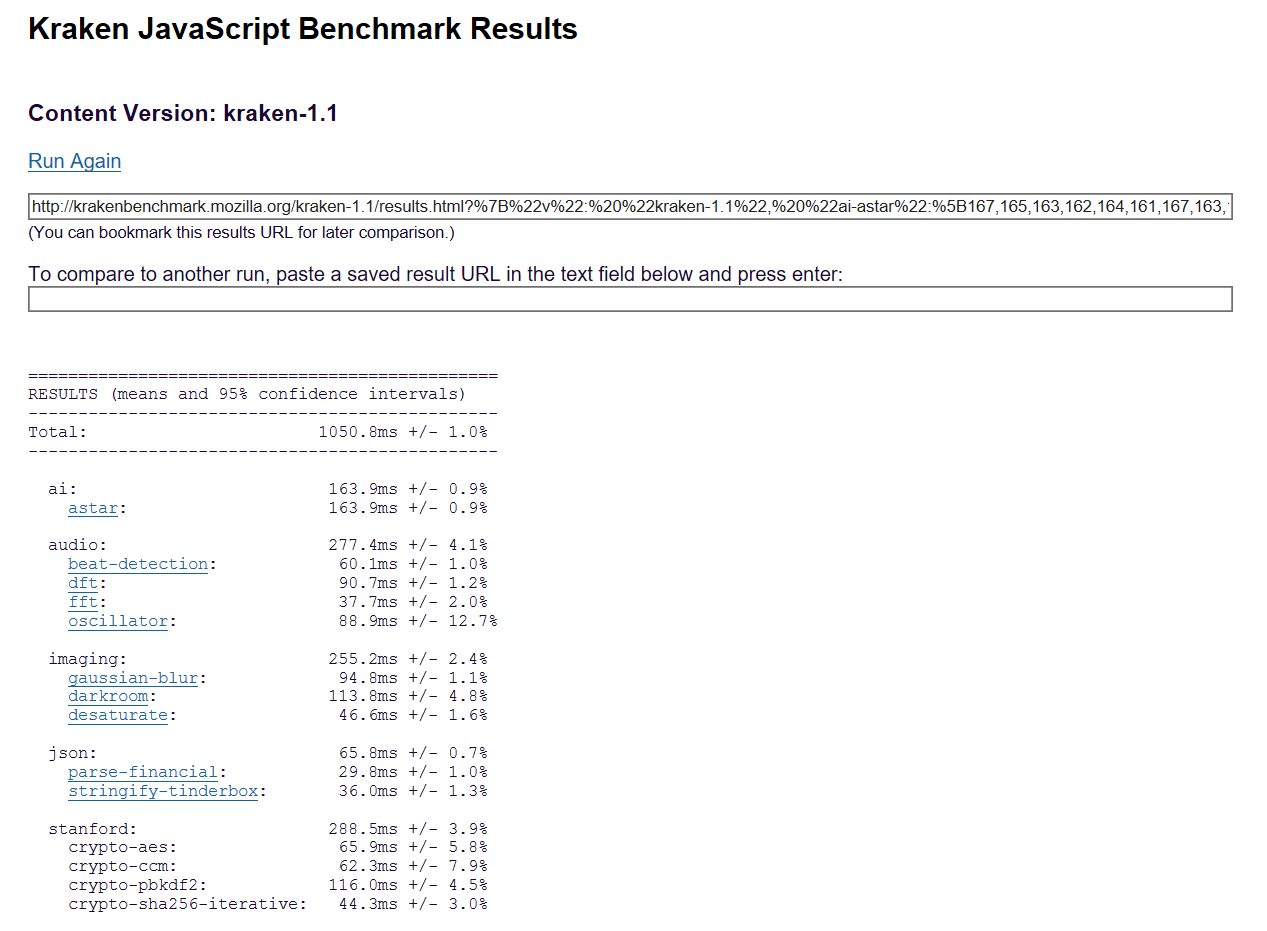
| Mozilla Kraken 1.1 - Total | |
| HP Pavilion 15-aw004ng W8Y60EA | |
| HP Pavilion 17-x110ng | |
| Lenovo ThinkPad E470-20H2S00400 | |
| Acer Aspire E5-575G-549D | |
| Dell Inspiron 15 5000 5567-1753 | |
* ... Meglio usare valori piccoli
| PCMark 8 | |
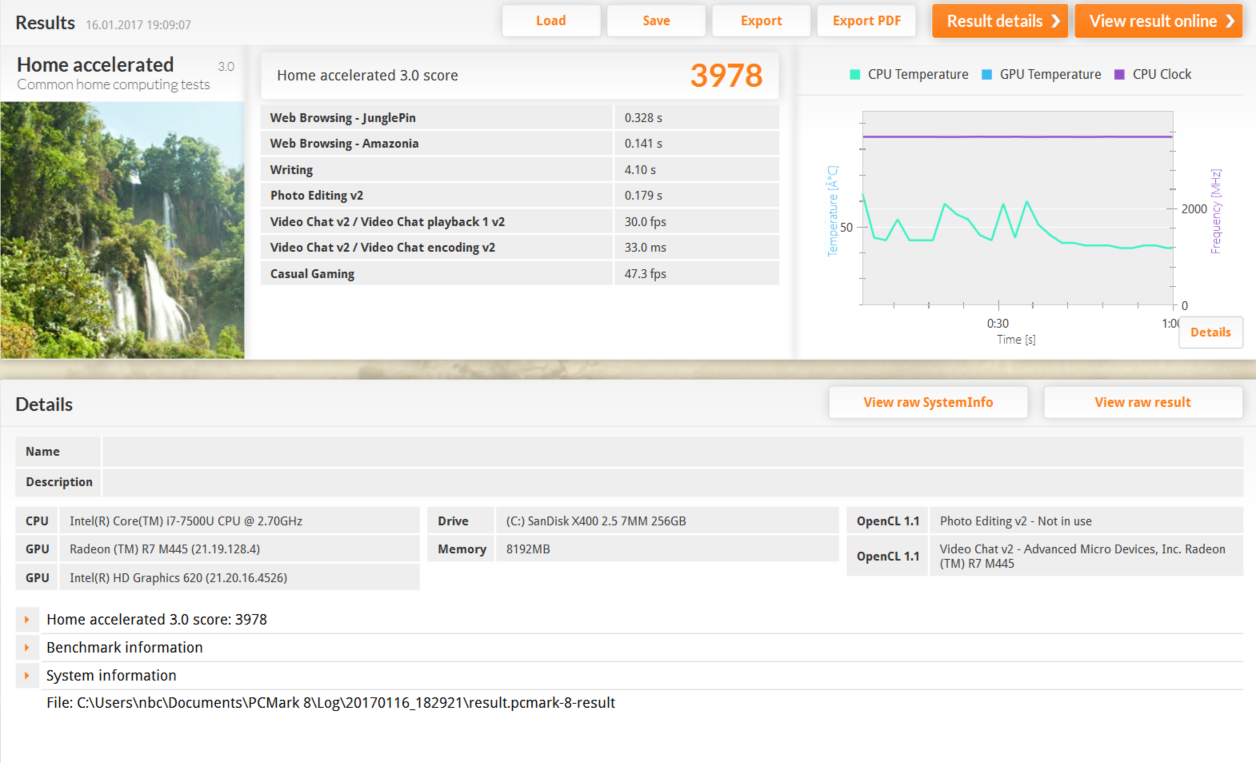
| Home Score Accelerated v2 | |
| Dell Inspiron 15 5000 5567-1753 | |
| Lenovo IdeaPad 510-15IKB 80SV0087GE | |
| Lenovo ThinkPad E470-20H2S00400 | |
| Acer Aspire E5-575G-549D | |
| HP Pavilion 17-x110ng | |
| HP Pavilion 15-aw004ng W8Y60EA | |
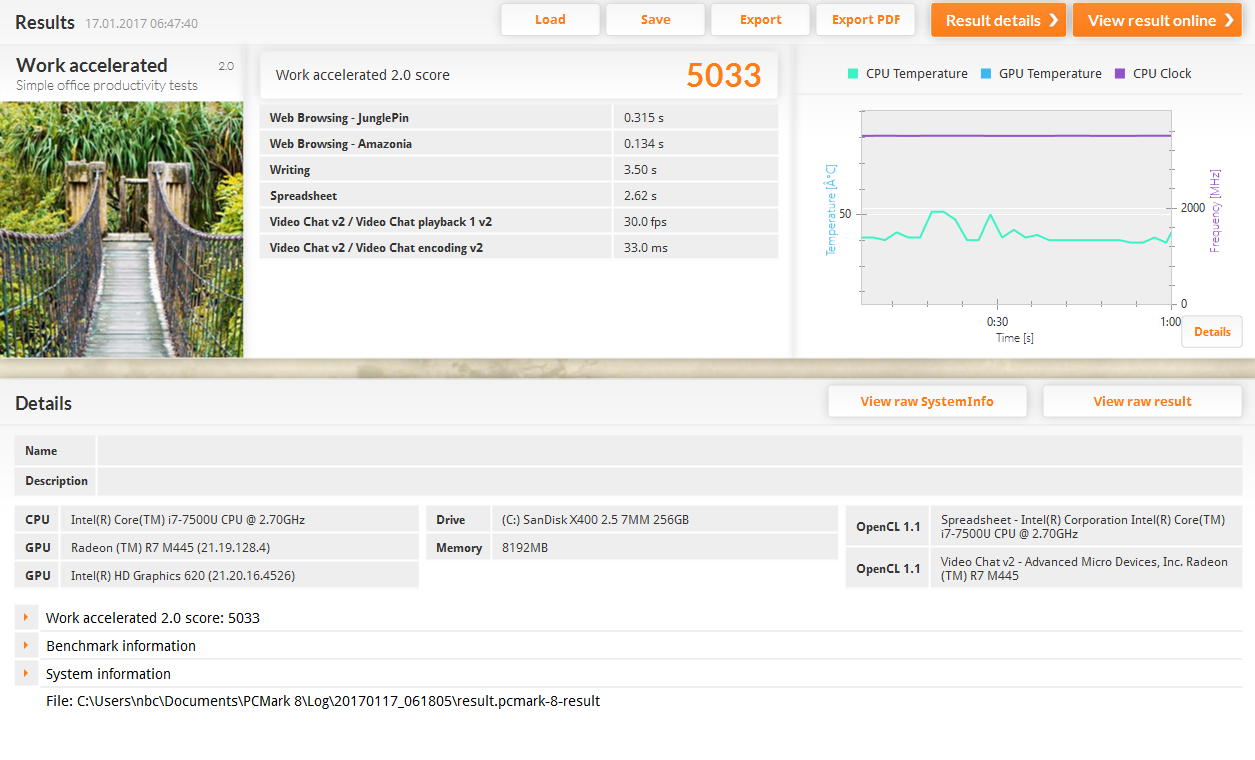
| Work Score Accelerated v2 | |
| Dell Inspiron 15 5000 5567-1753 | |
| Lenovo ThinkPad E470-20H2S00400 | |
| Acer Aspire E5-575G-549D | |
| HP Pavilion 15-aw004ng W8Y60EA | |
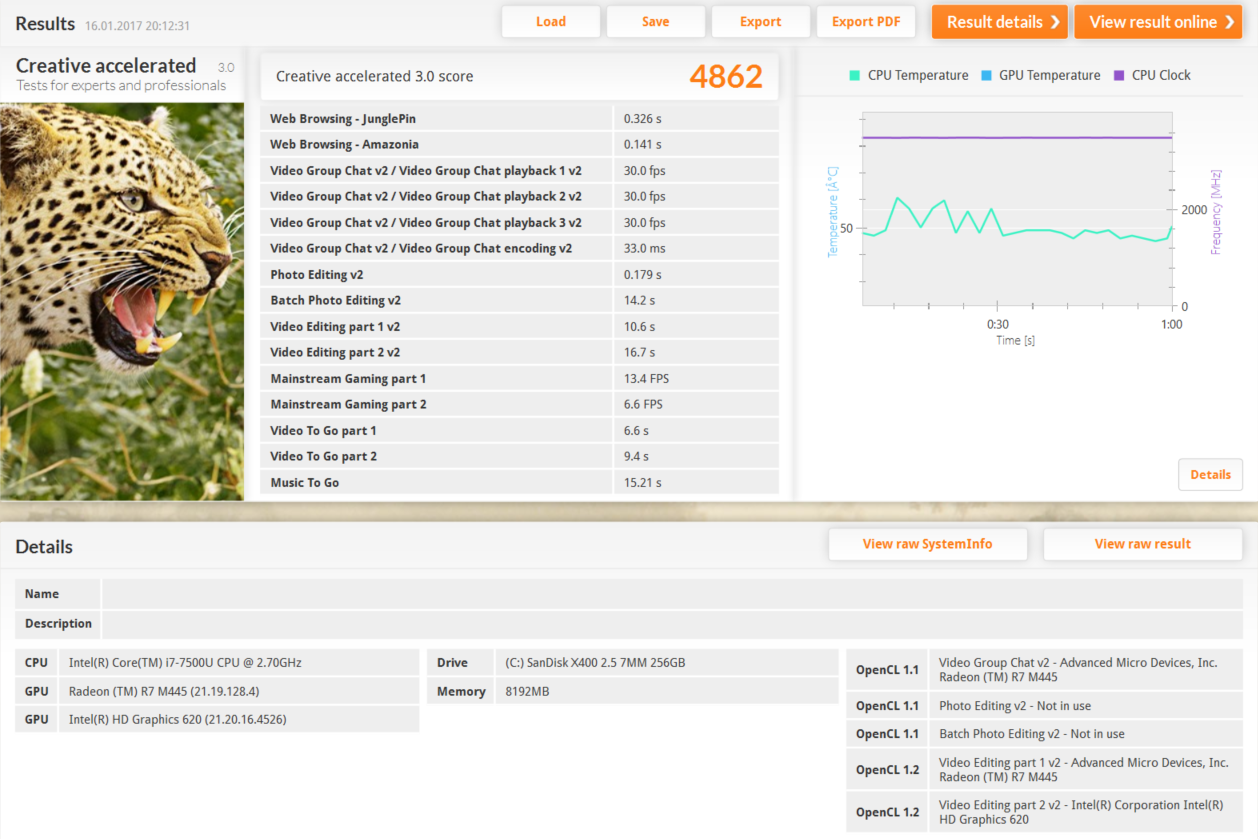
| Creative Score Accelerated v2 | |
| Dell Inspiron 15 5000 5567-1753 | |
| HP Pavilion 17-x110ng | |
| Lenovo ThinkPad E470-20H2S00400 | |
| Acer Aspire E5-575G-549D | |
| HP Pavilion 15-aw004ng W8Y60EA | |
| PCMark 7 | |
| Score | |
| Dell Inspiron 15 5000 5567-1753 | |
| HP Pavilion 17-x110ng | |
| HP Pavilion 15-aw004ng W8Y60EA | |
| Productivity | |
| Dell Inspiron 15 5000 5567-1753 | |
| HP Pavilion 17-x110ng | |
| HP Pavilion 15-aw004ng W8Y60EA | |
| Entertainment | |
| Dell Inspiron 15 5000 5567-1753 | |
| HP Pavilion 17-x110ng | |
| HP Pavilion 15-aw004ng W8Y60EA | |
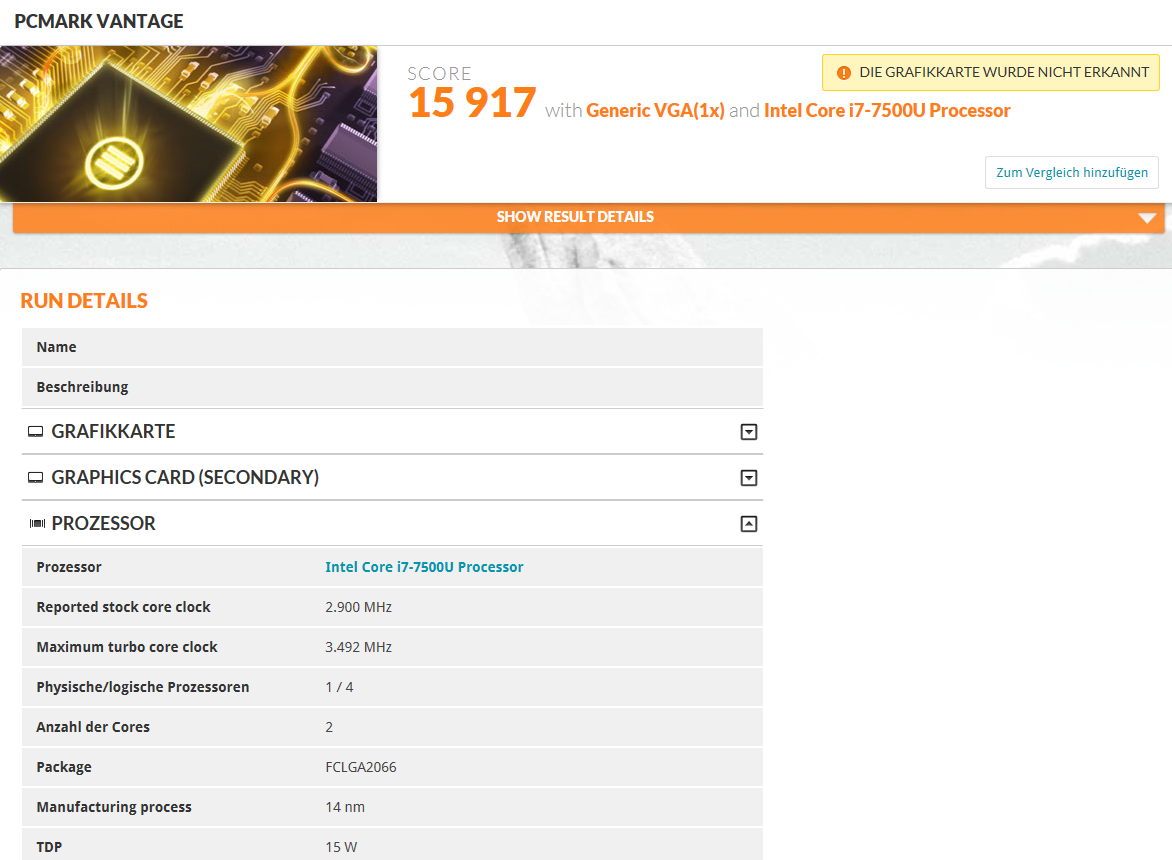
| PCMark Vantage Result | 15917 punti | |
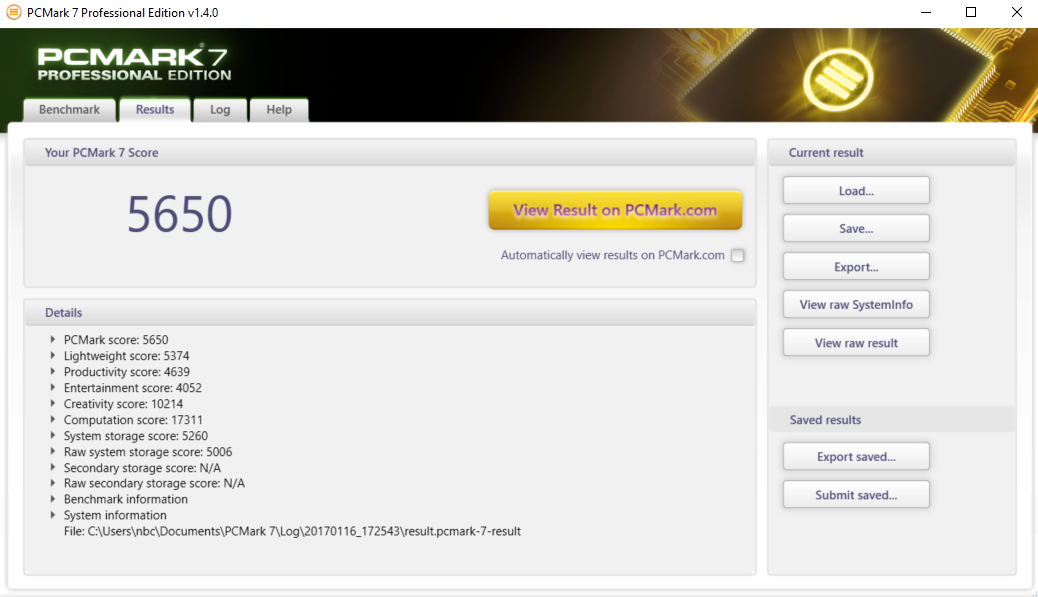
| PCMark 7 Score | 5650 punti | |
| PCMark 8 Home Score Accelerated v2 | 3978 punti | |
| PCMark 8 Creative Score Accelerated v2 | 4862 punti | |
| PCMark 8 Work Score Accelerated v2 | 5033 punti | |
Aiuto | ||
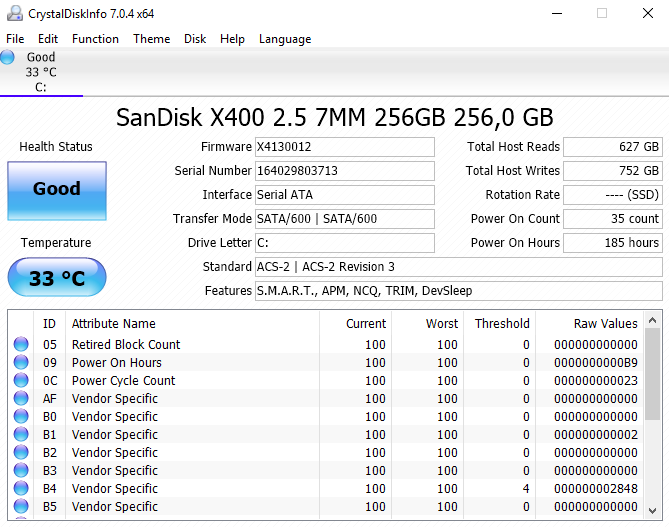
| Dell Inspiron 15 5000 5567-1753 SanDisk X400 SED 256GB, SATA (SD8TB8U-256G) | Acer Aspire E5-575G-549D Toshiba MQ01ABD100 | Lenovo IdeaPad 510-15IKB 80SV0087GE Liteonit CV3-DE256 | Lenovo ThinkPad E470-20H2S00400 SanDisk X400 SED 256GB, SATA (SD8TB8U-256G) | HP Pavilion 15-aw004ng W8Y60EA | HP Pavilion 17-x110ng SanDisk Z400s SD8SNAT-256G | |
|---|---|---|---|---|---|---|
| CrystalDiskMark 3.0 | -93% | 0% | -1% | -31% | -15% | |
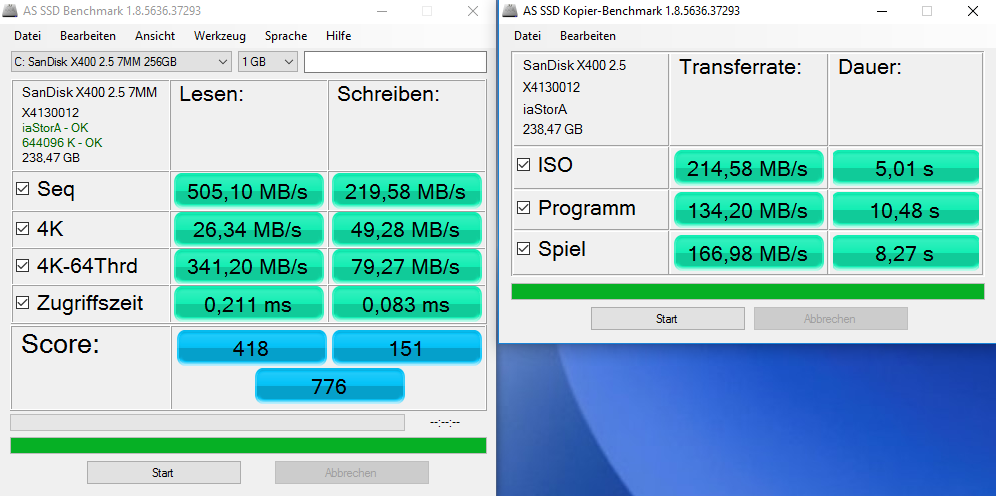
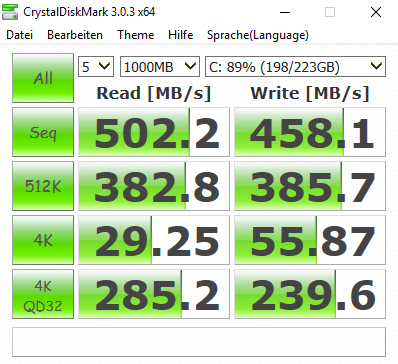
| Read Seq (MB/s) | 502 | 95.3 -81% | 469.2 -7% | 476.5 -5% | 503 0% | 500 0% |
| Write Seq (MB/s) | 458.1 | 85.6 -81% | 431.5 -6% | 458.7 0% | 316.6 -31% | 325.1 -29% |
| Read 512 (MB/s) | 382.8 | 29.32 -92% | 338.3 -12% | 346.4 -10% | 261.9 -32% | 290.2 -24% |
| Write 512 (MB/s) | 385.7 | 25.93 -93% | 297.9 -23% | 291.1 -25% | 281.2 -27% | 300.3 -22% |
| Read 4k (MB/s) | 29.25 | 0.366 -99% | 28.68 -2% | 35.15 20% | 17.04 -42% | 11.24 -62% |
| Write 4k (MB/s) | 55.9 | 0.726 -99% | 66.8 19% | 78.8 41% | 46.55 -17% | 86 54% |
| Read 4k QD32 (MB/s) | 285.2 | 0.647 -100% | 364.7 28% | 276 -3% | 125 -56% | 145.4 -49% |
| Write 4k QD32 (MB/s) | 239.6 | 0.722 -100% | 245.9 3% | 178.3 -26% | 131.4 -45% | 272.7 14% |

| 3DMark | |
| 1280x720 Cloud Gate Standard Graphics | |
| Acer Aspire E5-575G-549D | |
| HP Pavilion 15-aw004ng W8Y60EA | |
| Dell Inspiron 15 5000 5567-1753 | |
| Lenovo ThinkPad E470-20H2S00400 | |
| HP Pavilion 17-x110ng | |
| 1920x1080 Fire Strike Graphics | |
| Acer Aspire E5-575G-549D | |
| HP Pavilion 15-aw004ng W8Y60EA | |
| Lenovo ThinkPad E470-20H2S00400 | |
| Dell Inspiron 15 5000 5567-1753 | |
| HP Pavilion 17-x110ng | |
| 3DMark 11 - 1280x720 Performance GPU | |
| Acer Aspire E5-575G-549D | |
| HP Pavilion 15-aw004ng W8Y60EA | |
| Lenovo ThinkPad E470-20H2S00400 | |
| Lenovo IdeaPad 510-15IKB 80SV0087GE | |
| HP Pavilion 17-x110ng | |
| Dell Inspiron 15 5000 5567-1753 | |
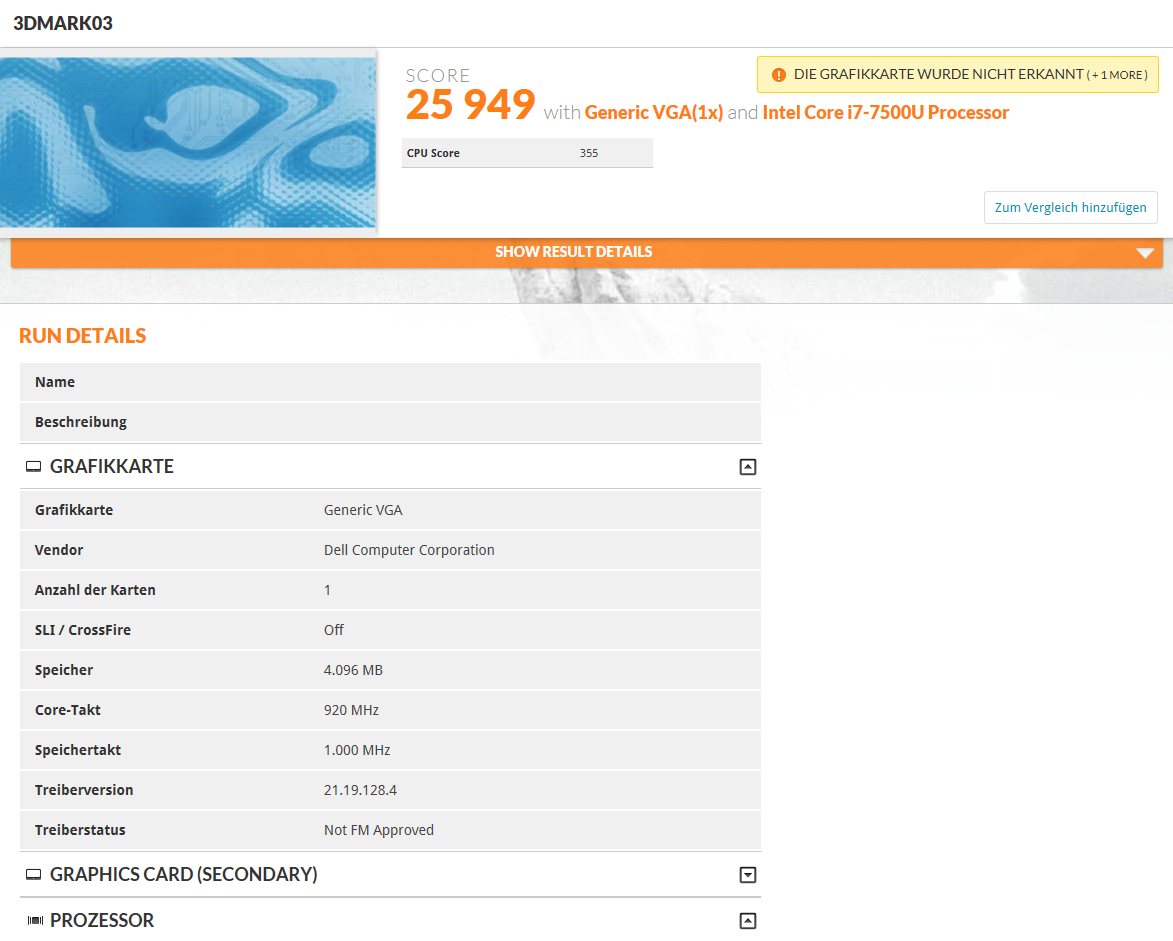
| 3DMark 03 Standard | 25949 punti | |
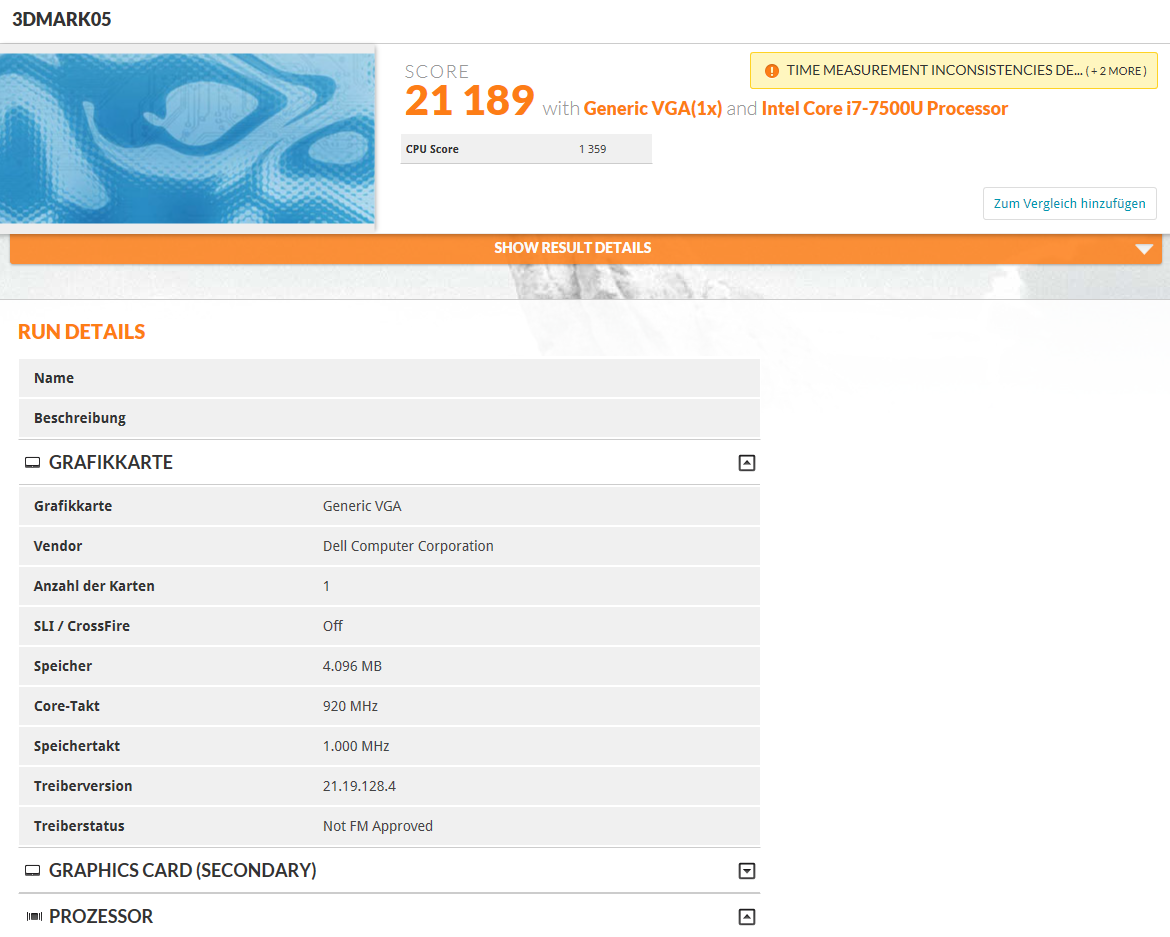
| 3DMark 05 Standard | 21189 punti | |
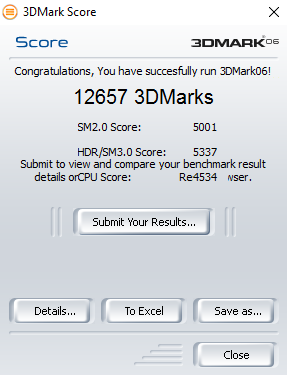
| 3DMark 06 Standard Score | 12657 punti | |
| 3DMark Vantage P Result | 6872 punti | |
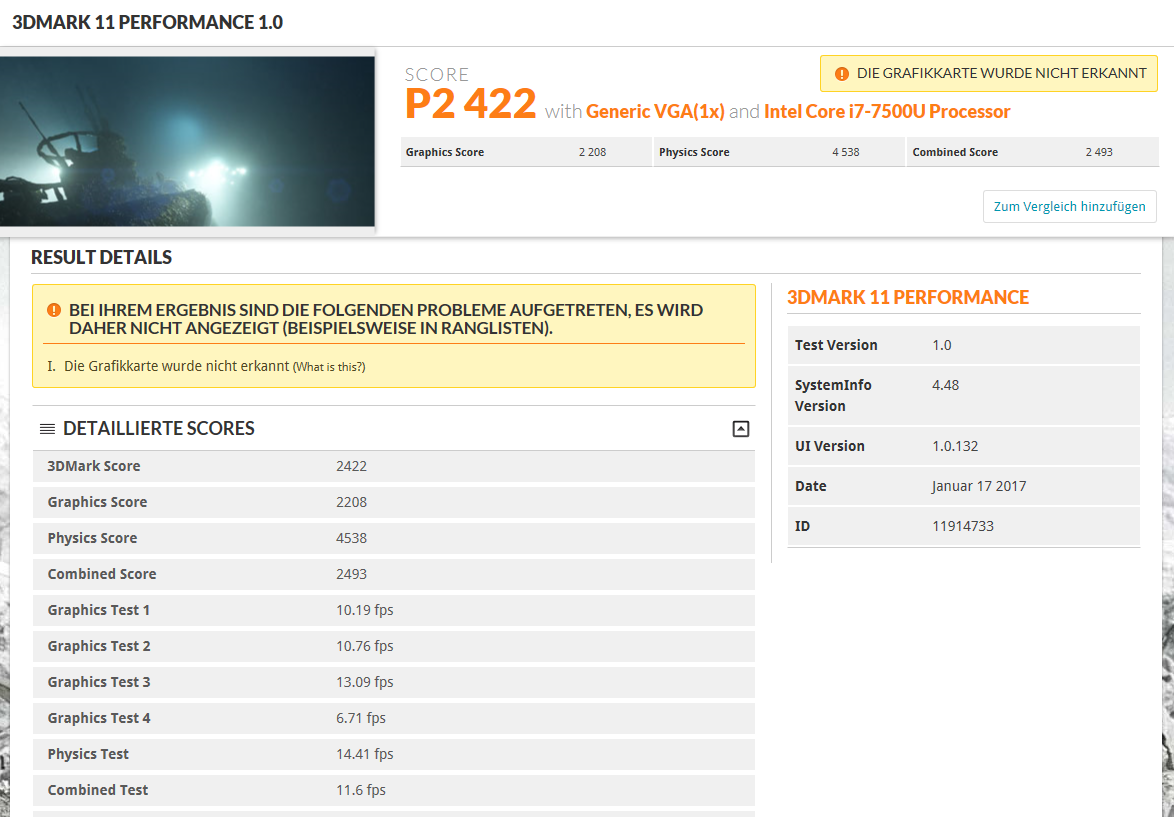
| 3DMark 11 Performance | 2422 punti | |
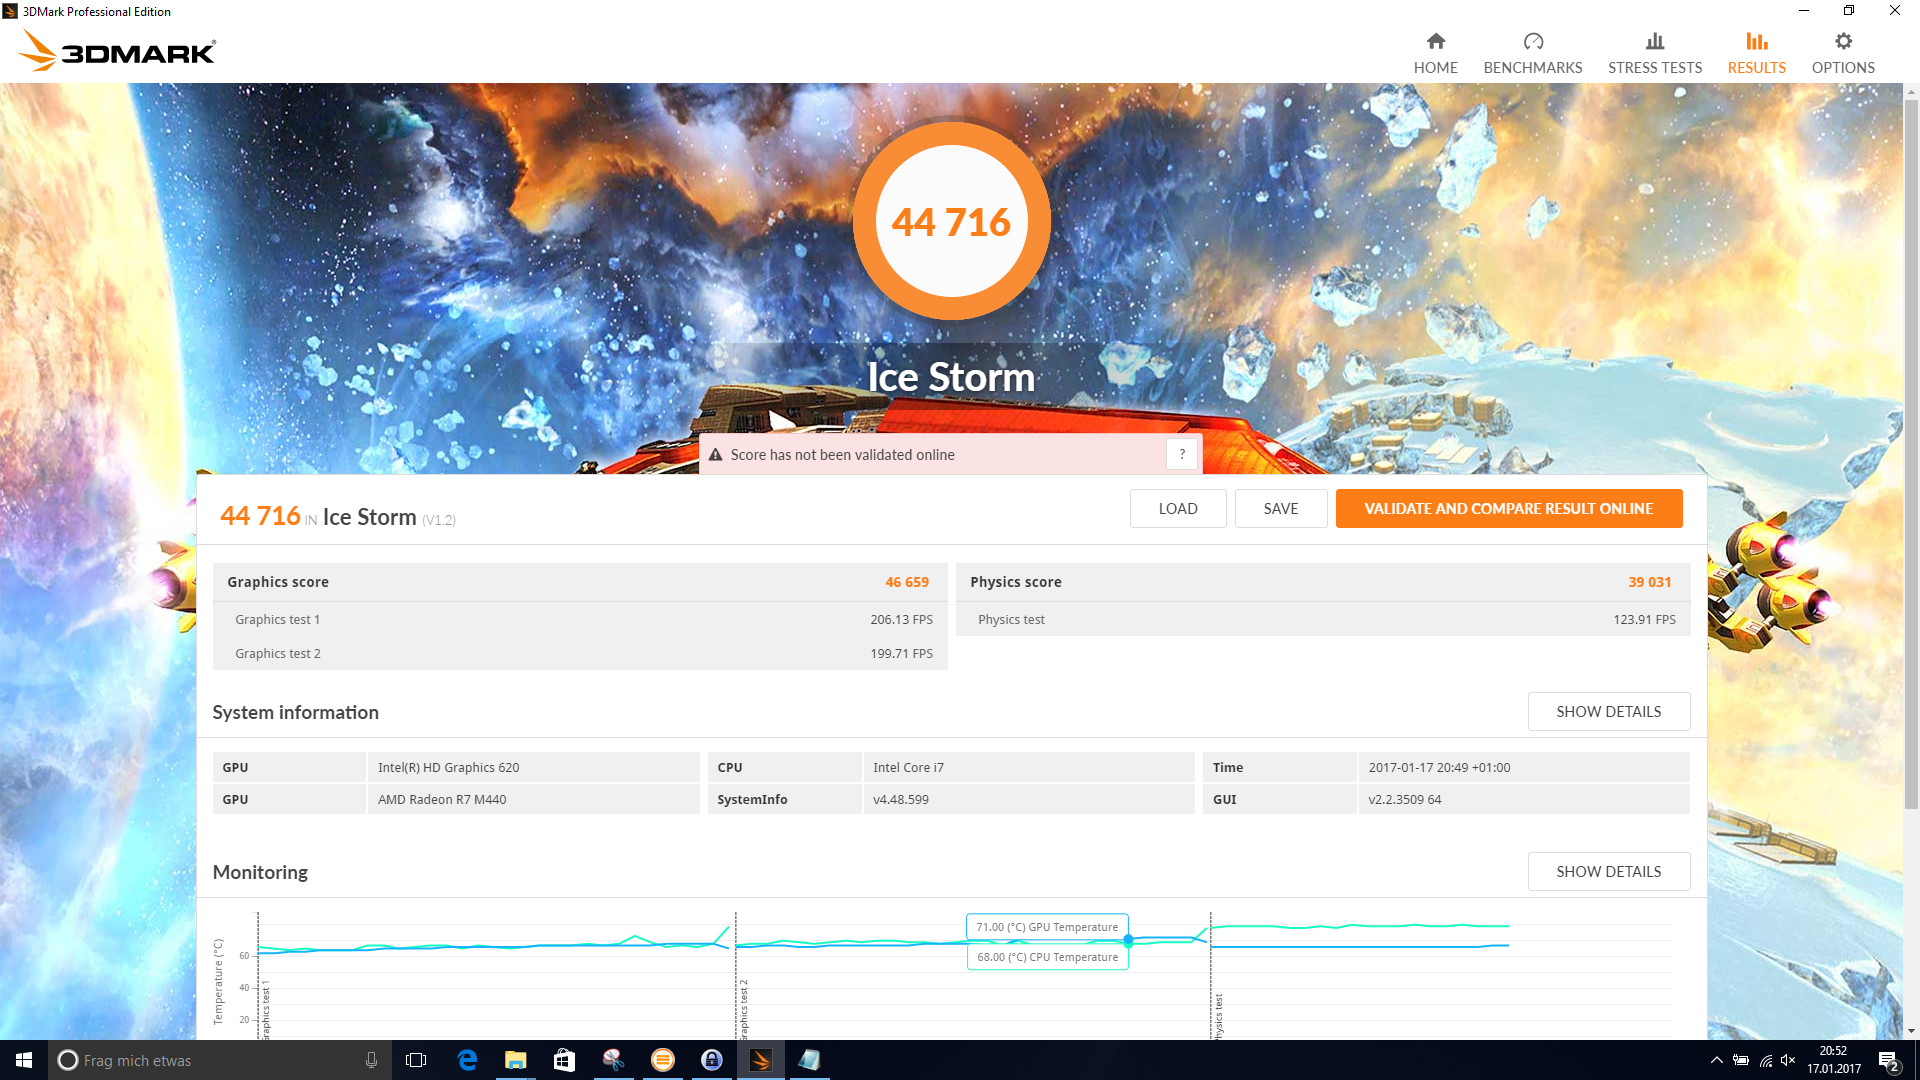
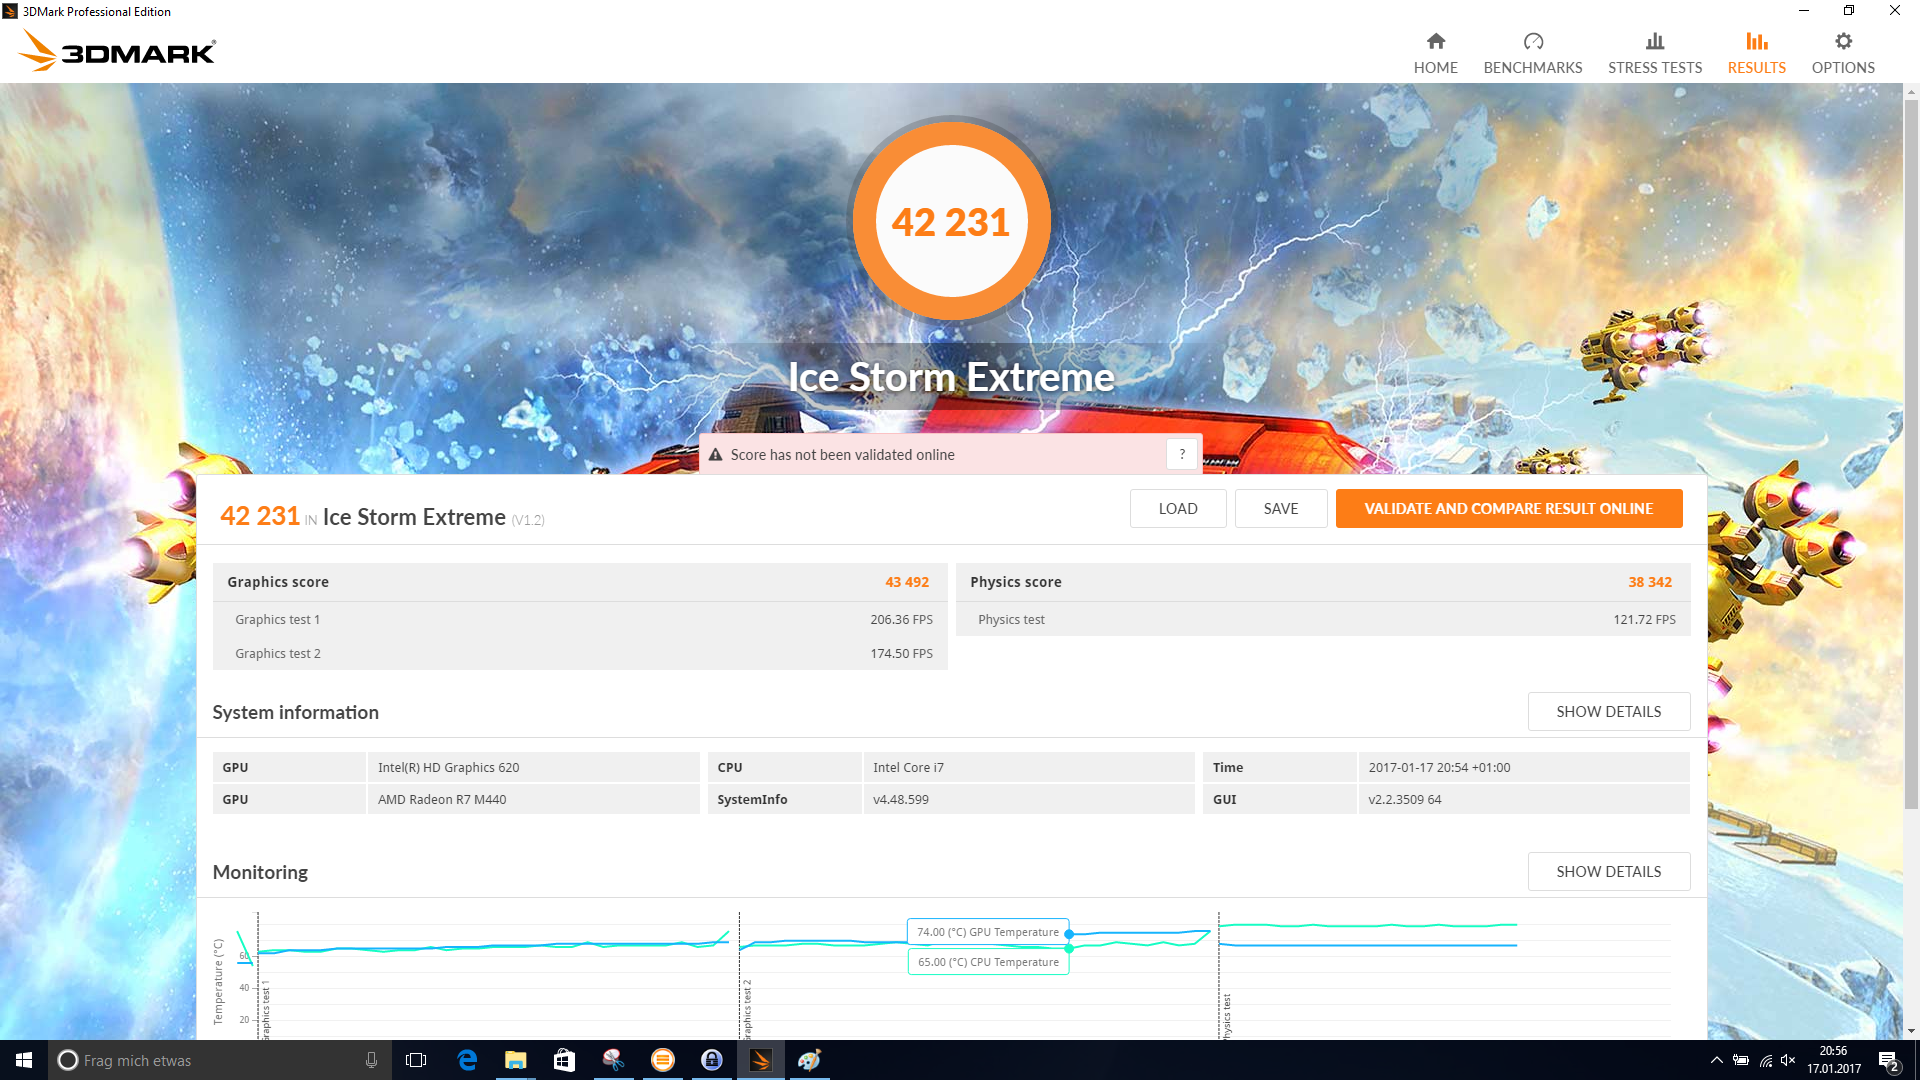
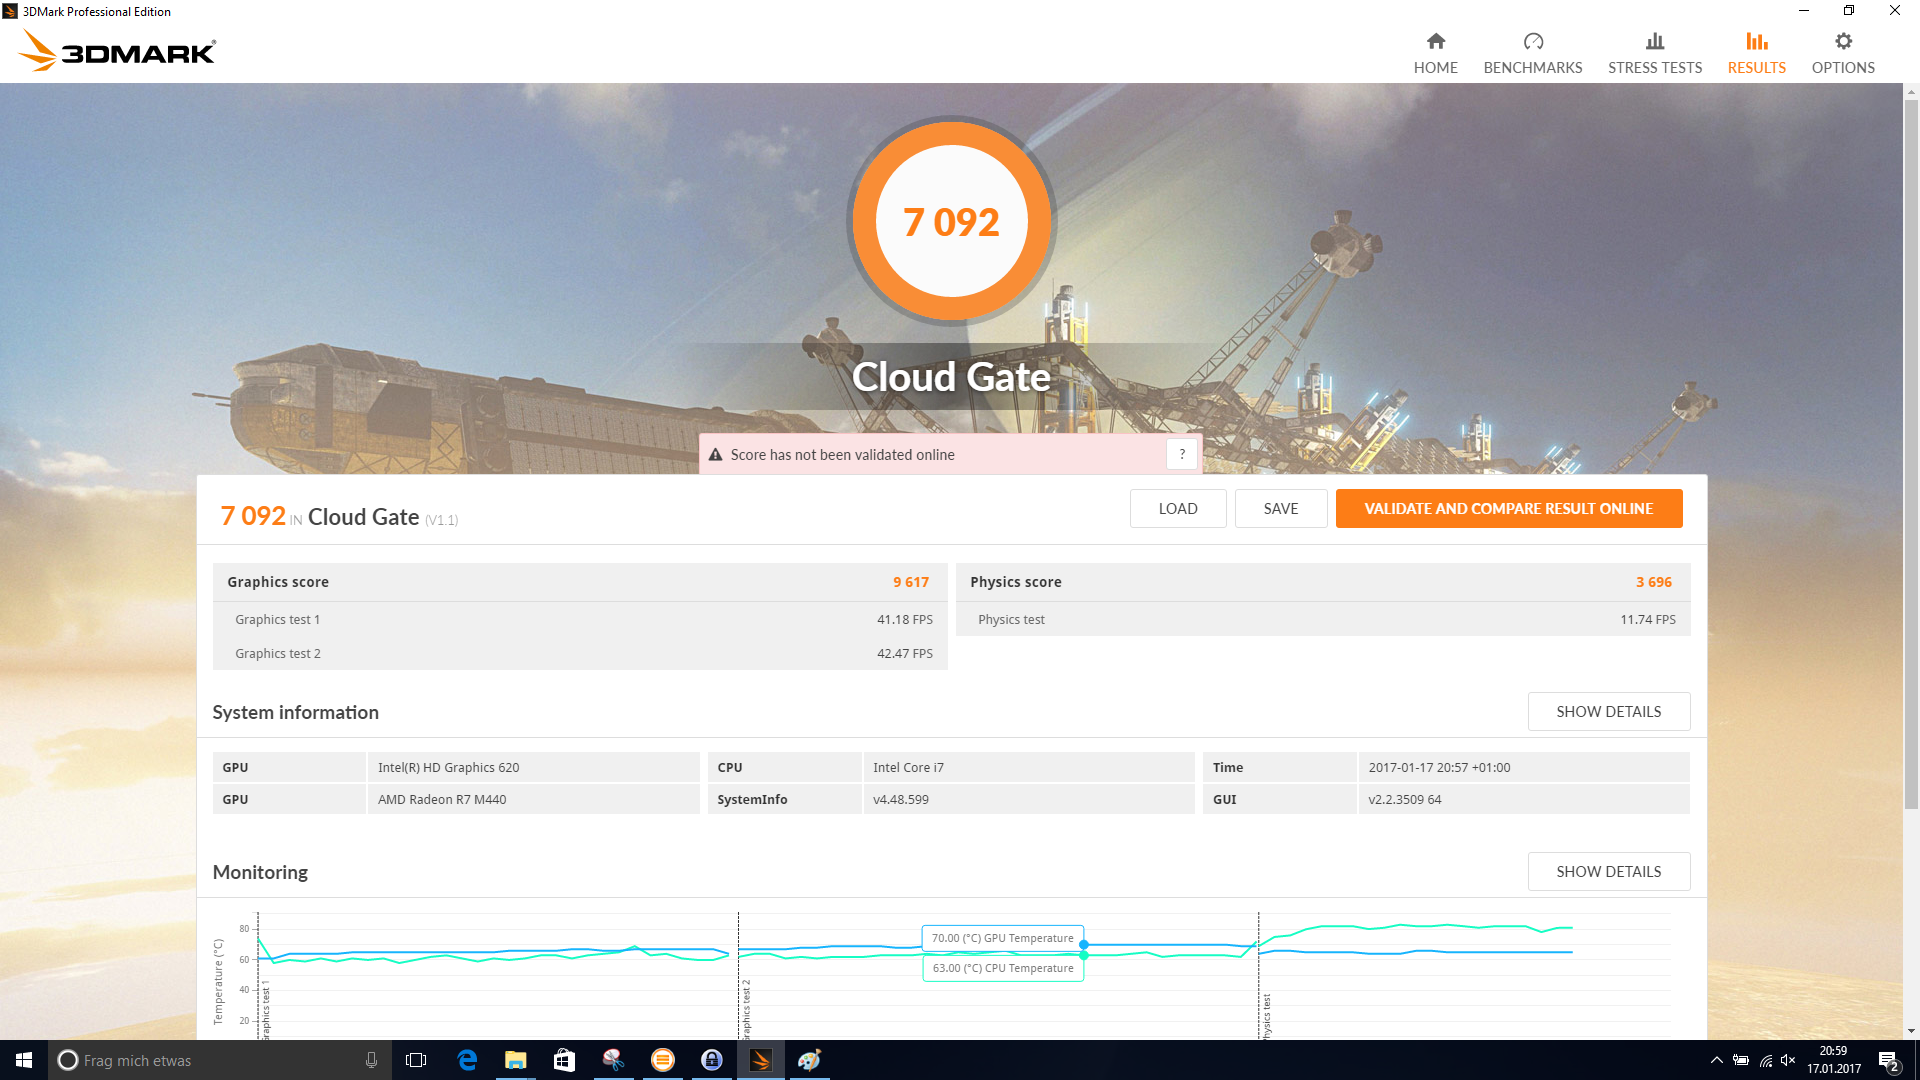
| 3DMark Ice Storm Standard Score | 44716 punti | |
| 3DMark Cloud Gate Standard Score | 7092 punti | |
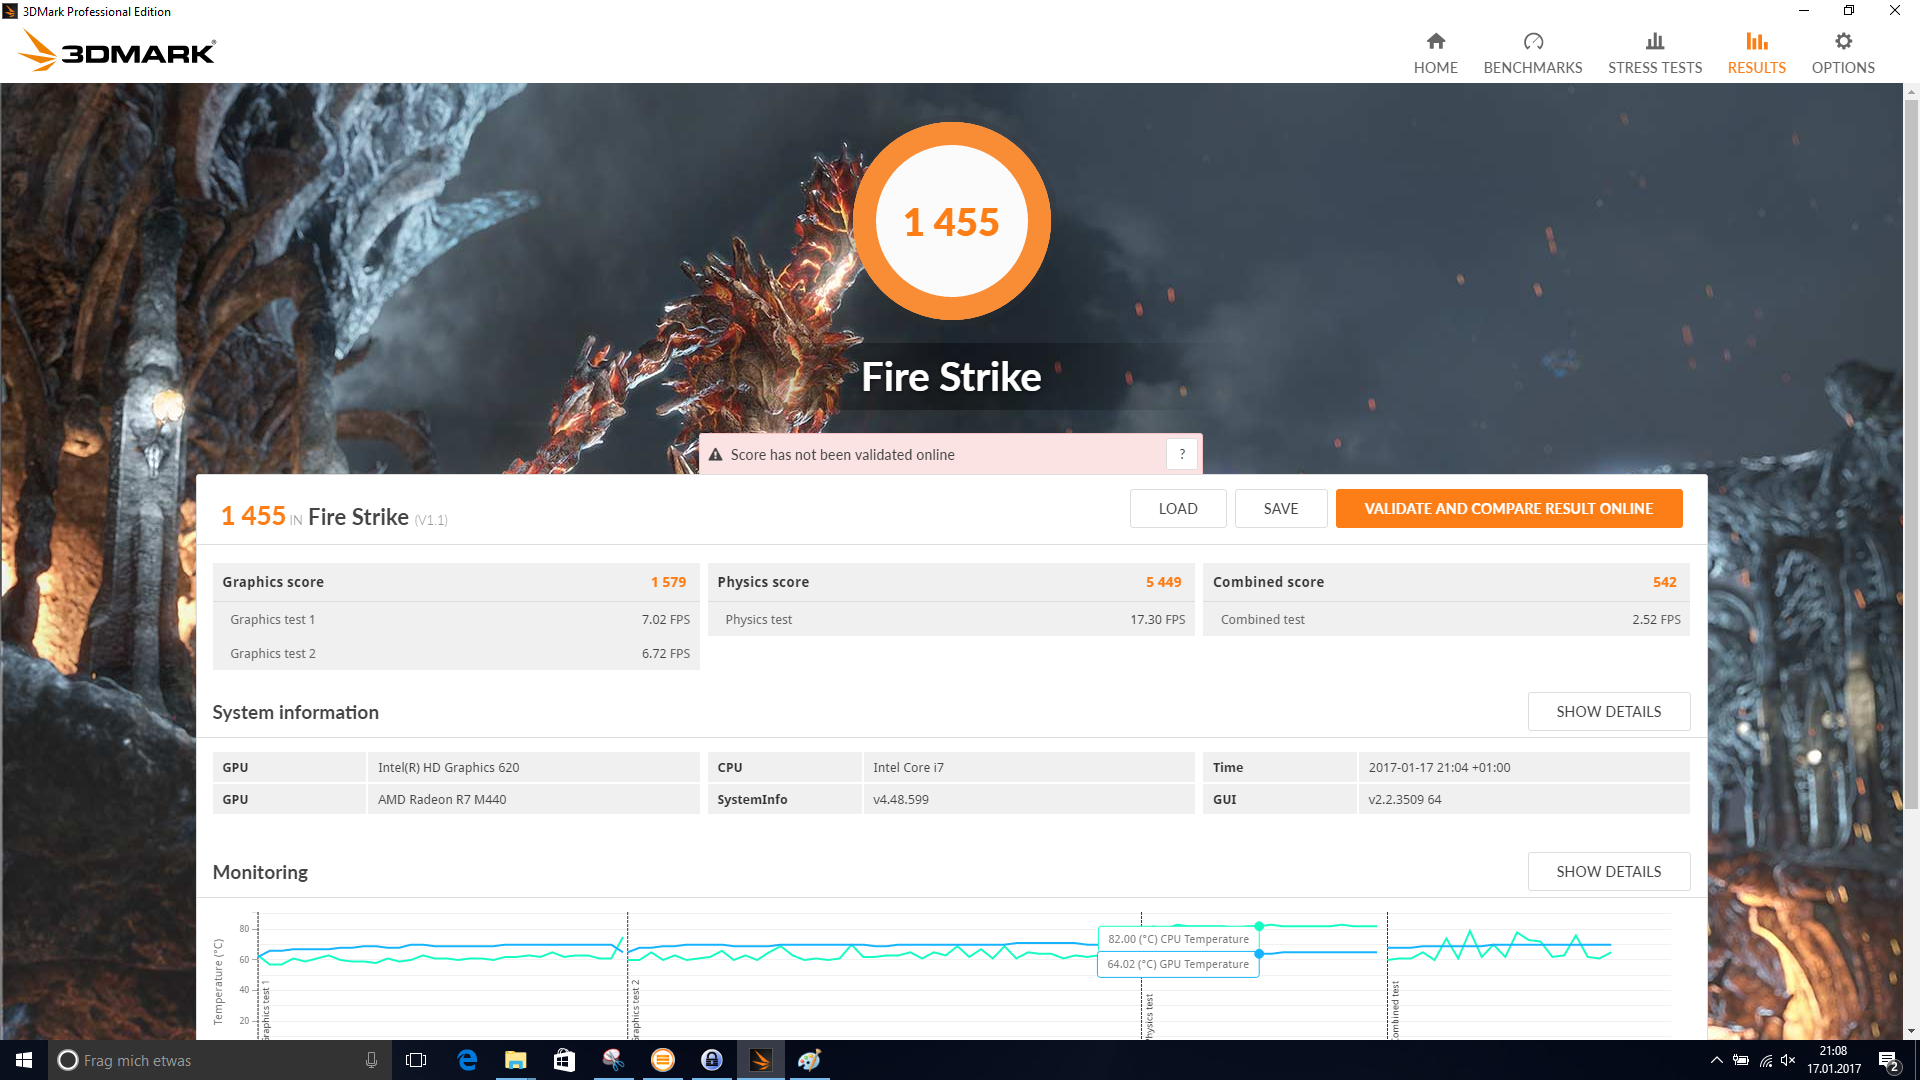
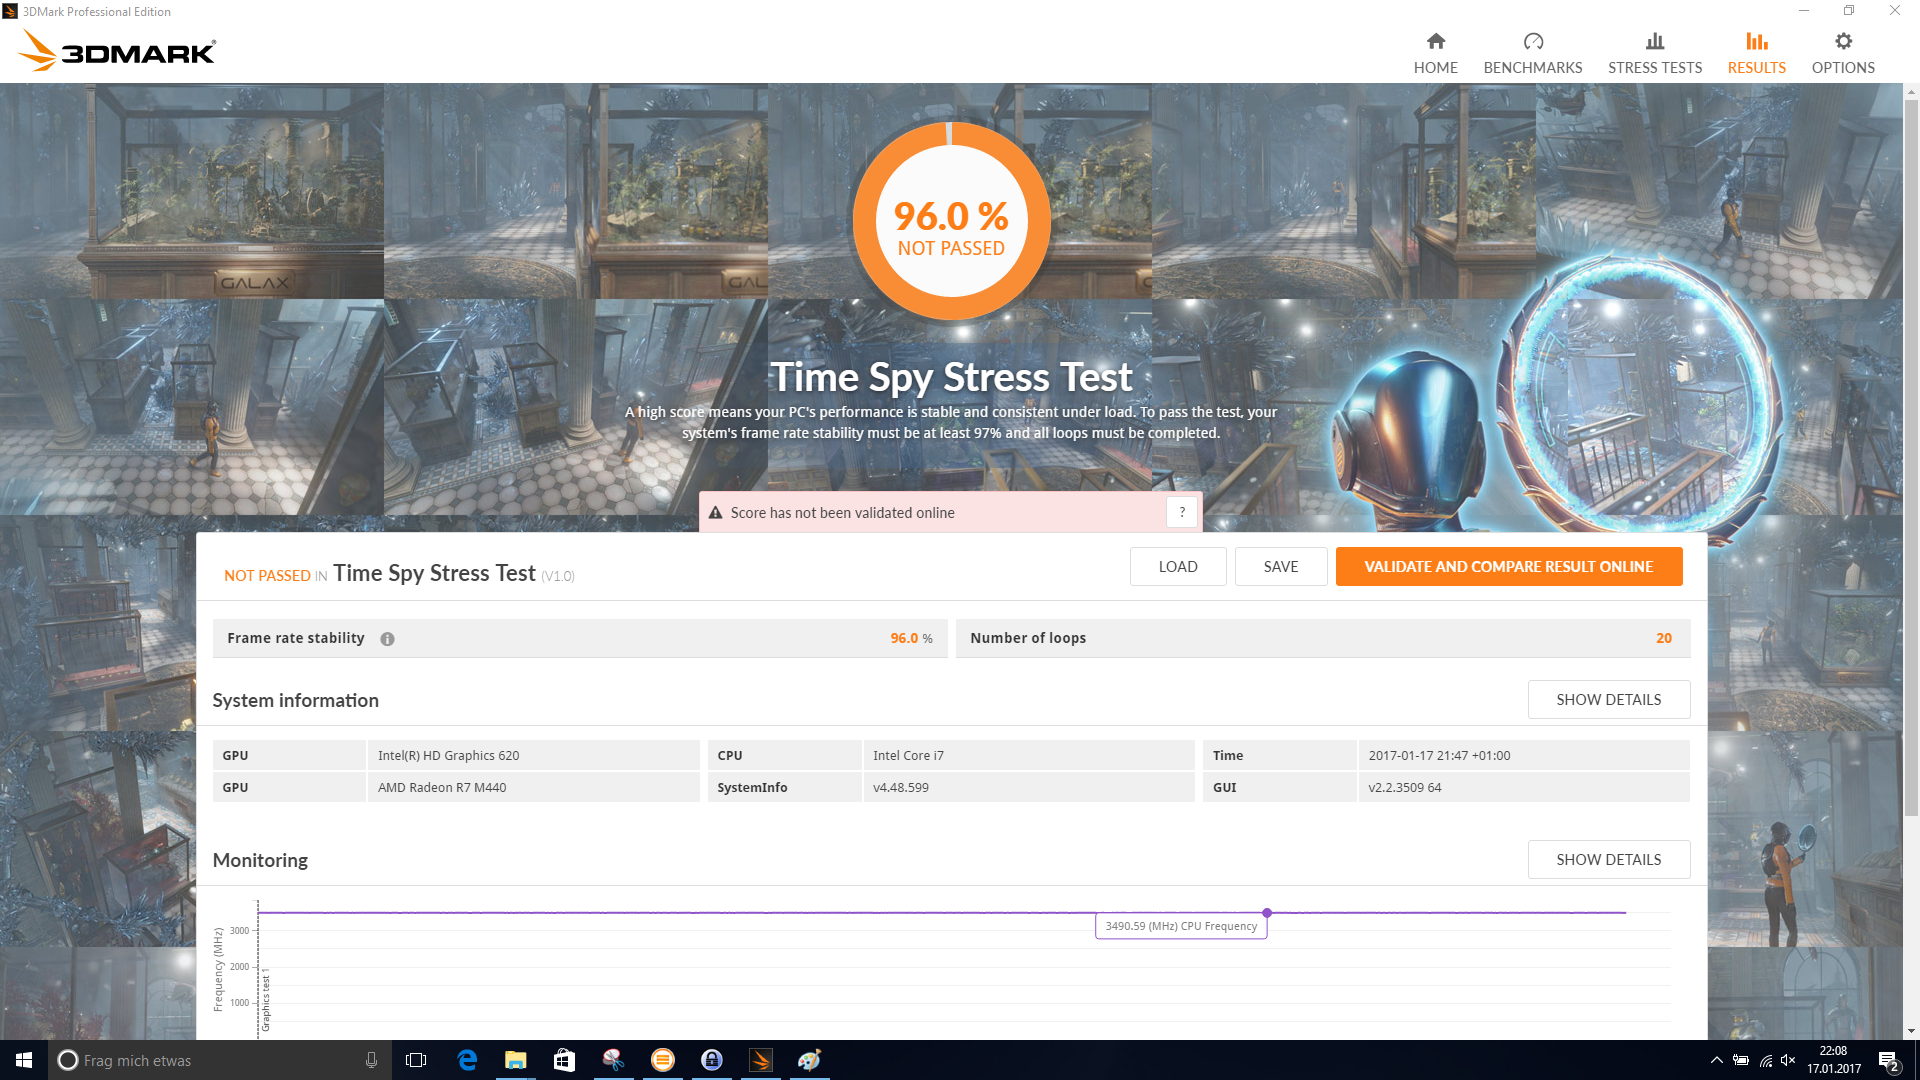
| 3DMark Fire Strike Score | 1455 punti | |
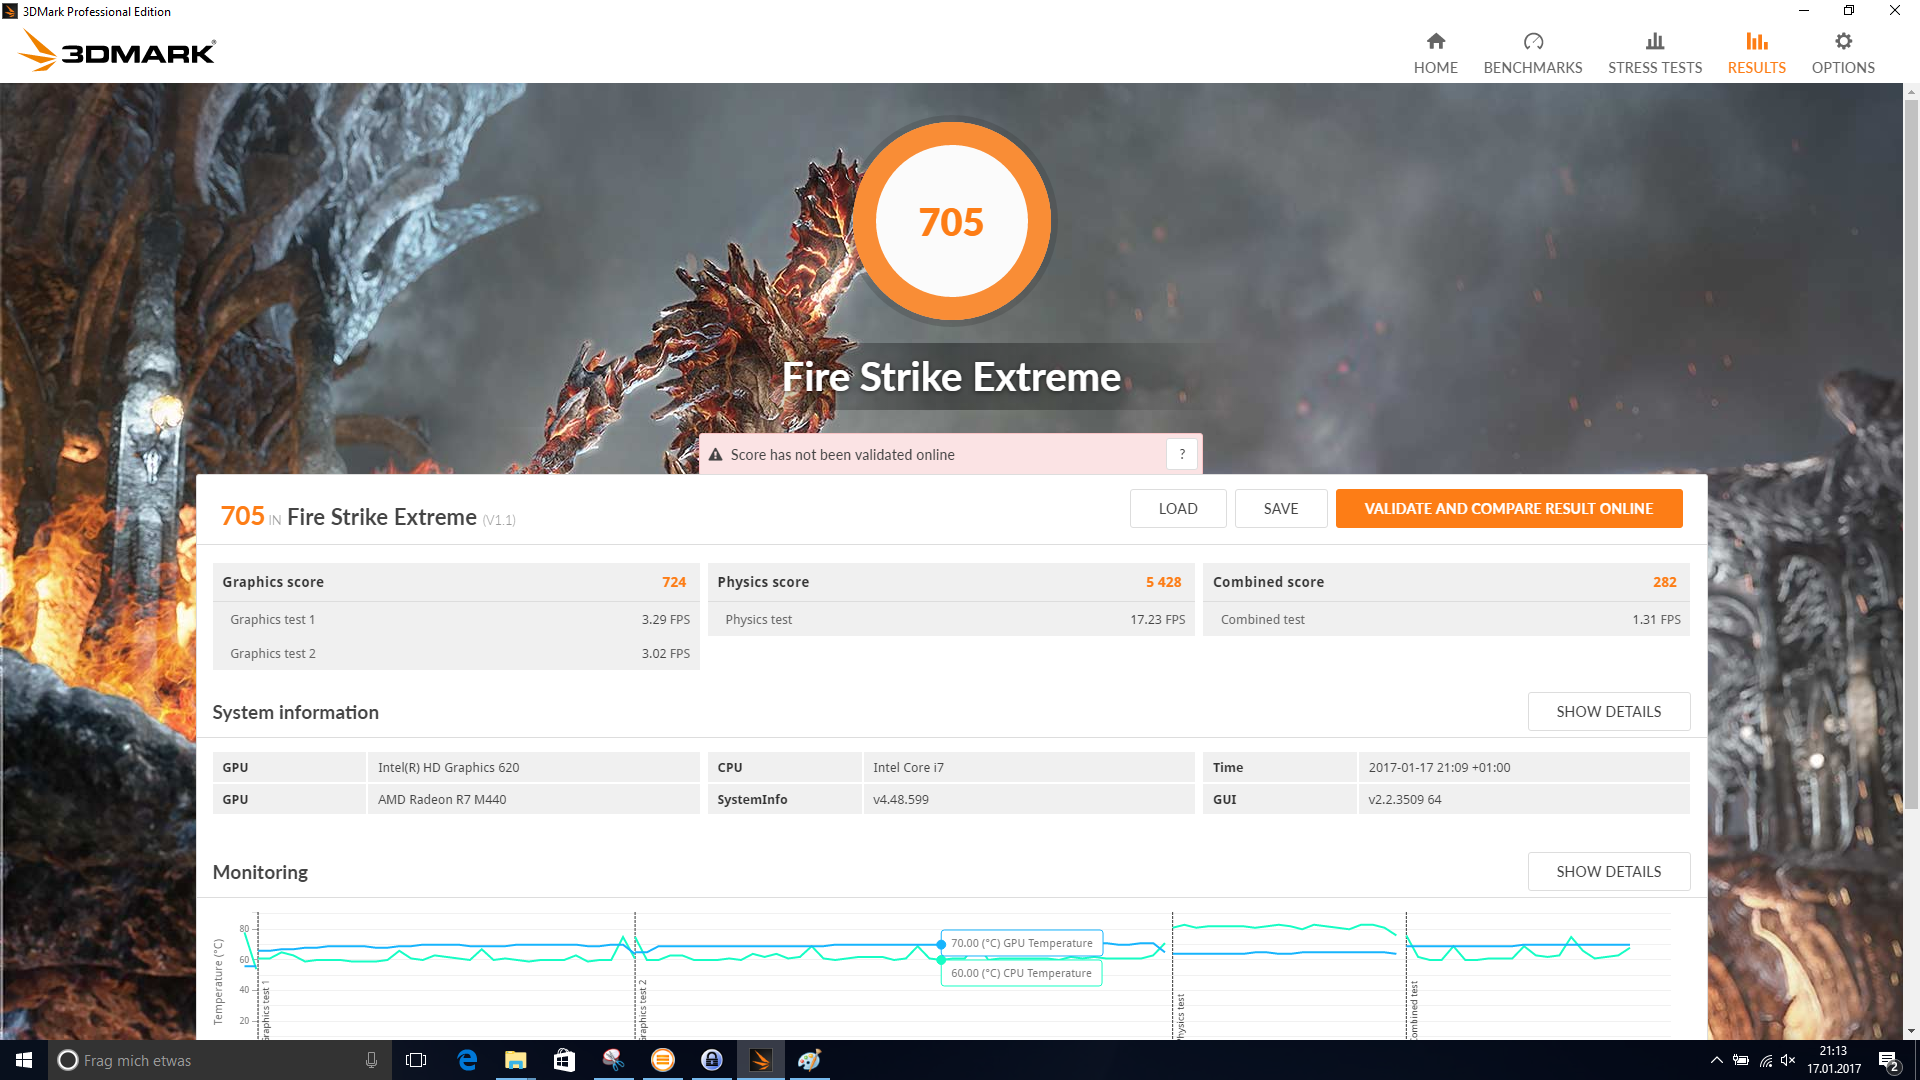
| 3DMark Fire Strike Extreme Score | 705 punti | |
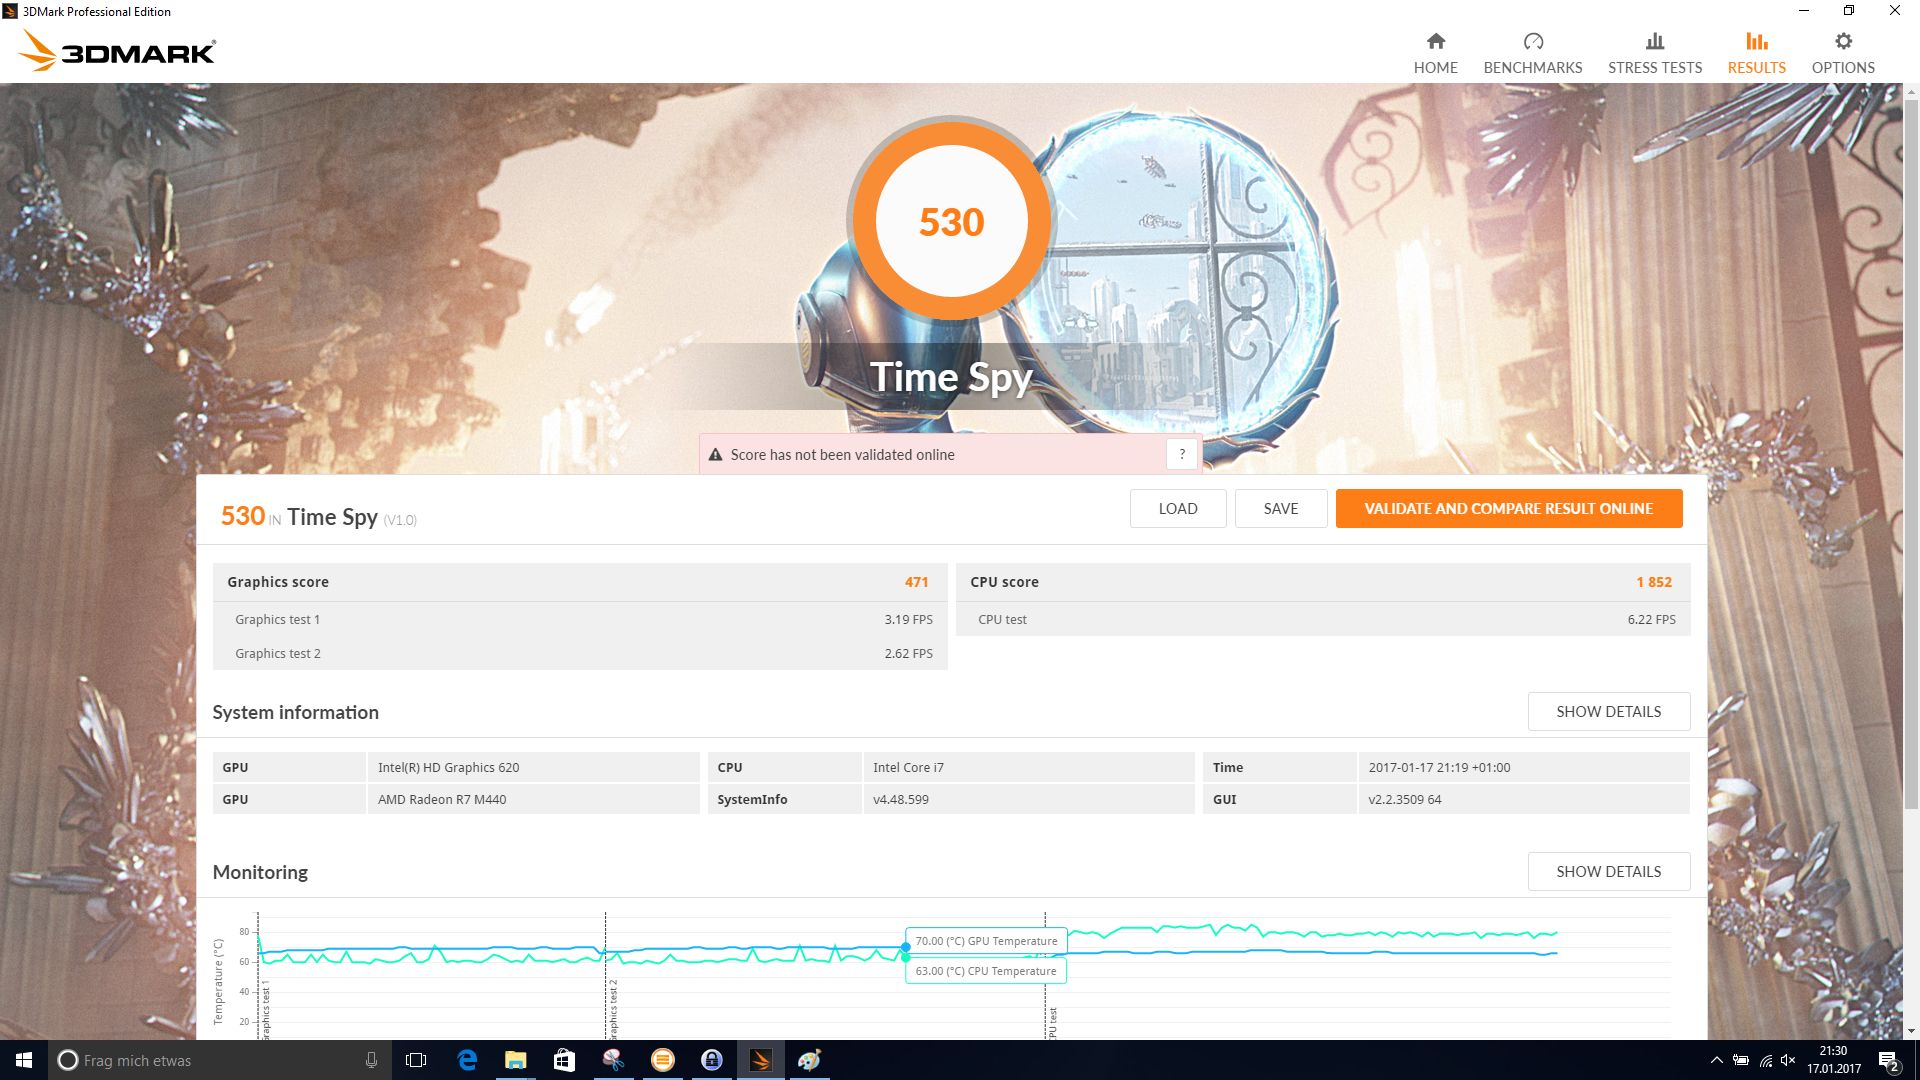
| 3DMark Time Spy Score | 530 punti | |
Aiuto | ||
| BioShock Infinite - 1366x768 Medium Preset | |
| Acer Aspire E5-575G-549D | |
| Dell Inspiron 15 5000 5567-1753 | |
| Lenovo ThinkPad E470-20H2S00400 | |
| Lenovo IdeaPad 510-15IKB 80SV0087GE | |
| HP Pavilion 15-aw004ng W8Y60EA | |
| HP Pavilion 17-x110ng | |
| Rise of the Tomb Raider - 1366x768 Medium Preset AF:2x | |
| Acer Aspire E5-575G-549D | |
| Dell Inspiron 15 5000 5567-1753 | |
| HP Pavilion 15-aw004ng W8Y60EA | |
| HP Pavilion 17-x110ng | |
| Battlefield 4 - 1366x768 Medium Preset | |
| Acer Aspire E5-575G-549D | |
| Dell Inspiron 15 5000 5567-1753 | |
| Lenovo ThinkPad E470-20H2S00400 | |
| HP Pavilion 15-aw004ng W8Y60EA | |
| HP Pavilion 17-x110ng | |
| basso | medio | alto | ultra | |
|---|---|---|---|---|
| BioShock Infinite (2013) | 98.7 | 53.9 | 44.5 | 13.8 |
| Battlefield 4 (2013) | 74.3 | 49.6 | 32.7 | 11.7 |
| Sims 4 (2014) | 132.9 | 66.9 | 28.8 | 27.4 |
| GTA V (2015) | 50.7 | 43.7 | 12.2 | |
| The Witcher 3 (2015) | 30.8 | 18.2 | 9.6 | 4.7 |
| Rainbow Six Siege (2015) | 64.4 | 37.8 | 20.1 | 13.5 |
| Rise of the Tomb Raider (2016) | 29.6 | 15.1 | 8.5 | 6.7 |
| XCOM 2 (2016) | 22.8 | 7.9 | 5.2 | 4.9 |
| Far Cry Primal (2016) | 27 | 12 | 10 | |
| The Division (2016) | 32.4 | 24.5 | 9.6 | 6.7 |
| Doom (2016) | 35 | 28 | 14 | |
| Overwatch (2016) | 75.3 | 52.6 | 23.5 | 14.1 |
| Deus Ex Mankind Divided (2016) | 21 | 14 | 7 | |
| FIFA 17 (2016) | 61.8 | 59.7 | 34.6 | 29.4 |
| Battlefield 1 (2016) | 40 | 28 | 13 | 12 |
| Farming Simulator 17 (2016) | 64.2 | 42.9 | 16.9 | 10 |
| Titanfall 2 (2016) | 57 | 41 | 17 | 16 |
| Call of Duty Infinite Warfare (2016) | 27 | 24 | 16 | |
| Dishonored 2 (2016) | 23.4 | 18.6 | 12.2 | 9.9 |
| Watch Dogs 2 (2016) | 30.2 | 24.1 | 11.5 | |
| Resident Evil 7 (2017) | 55.3 | 24.1 | 13.9 |
Rumorosità
| Idle |
| 30.6 / 30.6 / 30.6 dB(A) |
| DVD |
| 36.9 / dB(A) |
| Sotto carico |
| 41.9 / 41.8 dB(A) |
 | ||
30 dB silenzioso 40 dB(A) udibile 50 dB(A) rumoroso |
||
min: | ||
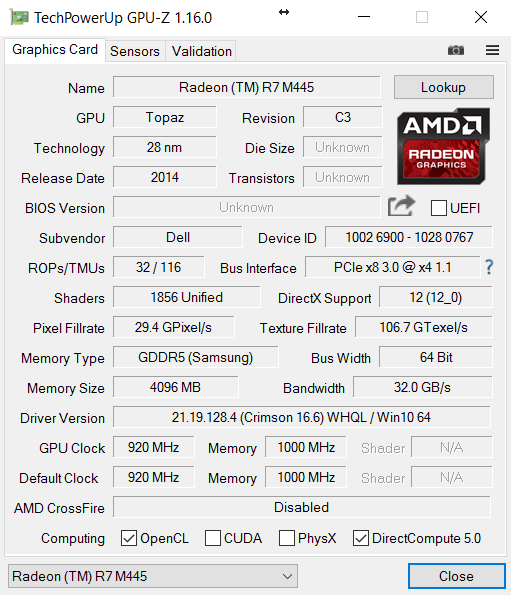
| Dell Inspiron 15 5000 5567-1753 i7-7500U, Radeon R7 M445 | Acer Aspire E5-575G-549D i5-7200U, GeForce GTX 950M | Lenovo IdeaPad 510-15IKB 80SV0087GE i7-7500U, GeForce 940MX | Lenovo ThinkPad E470-20H2S00400 i5-7200U, GeForce 940MX | HP Pavilion 15-aw004ng W8Y60EA A10-9600P, Radeon R8 M445DX | HP Pavilion 17-x110ng i5-7200U, Radeon R7 M440 | |
|---|---|---|---|---|---|---|
| Noise | 5% | 1% | 7% | -2% | 2% | |
| off /ambiente * (dB) | 30.6 | 28.9 6% | 31.6 -3% | 29 5% | 31.2 -2% | 29 5% |
| Idle Minimum * (dB) | 30.6 | 30.8 -1% | 32.6 -7% | 29 5% | 31.7 -4% | 31 -1% |
| Idle Average * (dB) | 30.6 | 30.8 -1% | 32.6 -7% | 29 5% | 31.9 -4% | 31 -1% |
| Idle Maximum * (dB) | 30.6 | 30.8 -1% | 32.6 -7% | 29 5% | 31.9 -4% | 31 -1% |
| Load Average * (dB) | 41.9 | 33.4 20% | 35.3 16% | 35.6 15% | 41 2% | 33.8 19% |
| Load Maximum * (dB) | 41.8 | 40.1 4% | 37.1 11% | 38.5 8% | 42.7 -2% | 44.8 -7% |
* ... Meglio usare valori piccoli
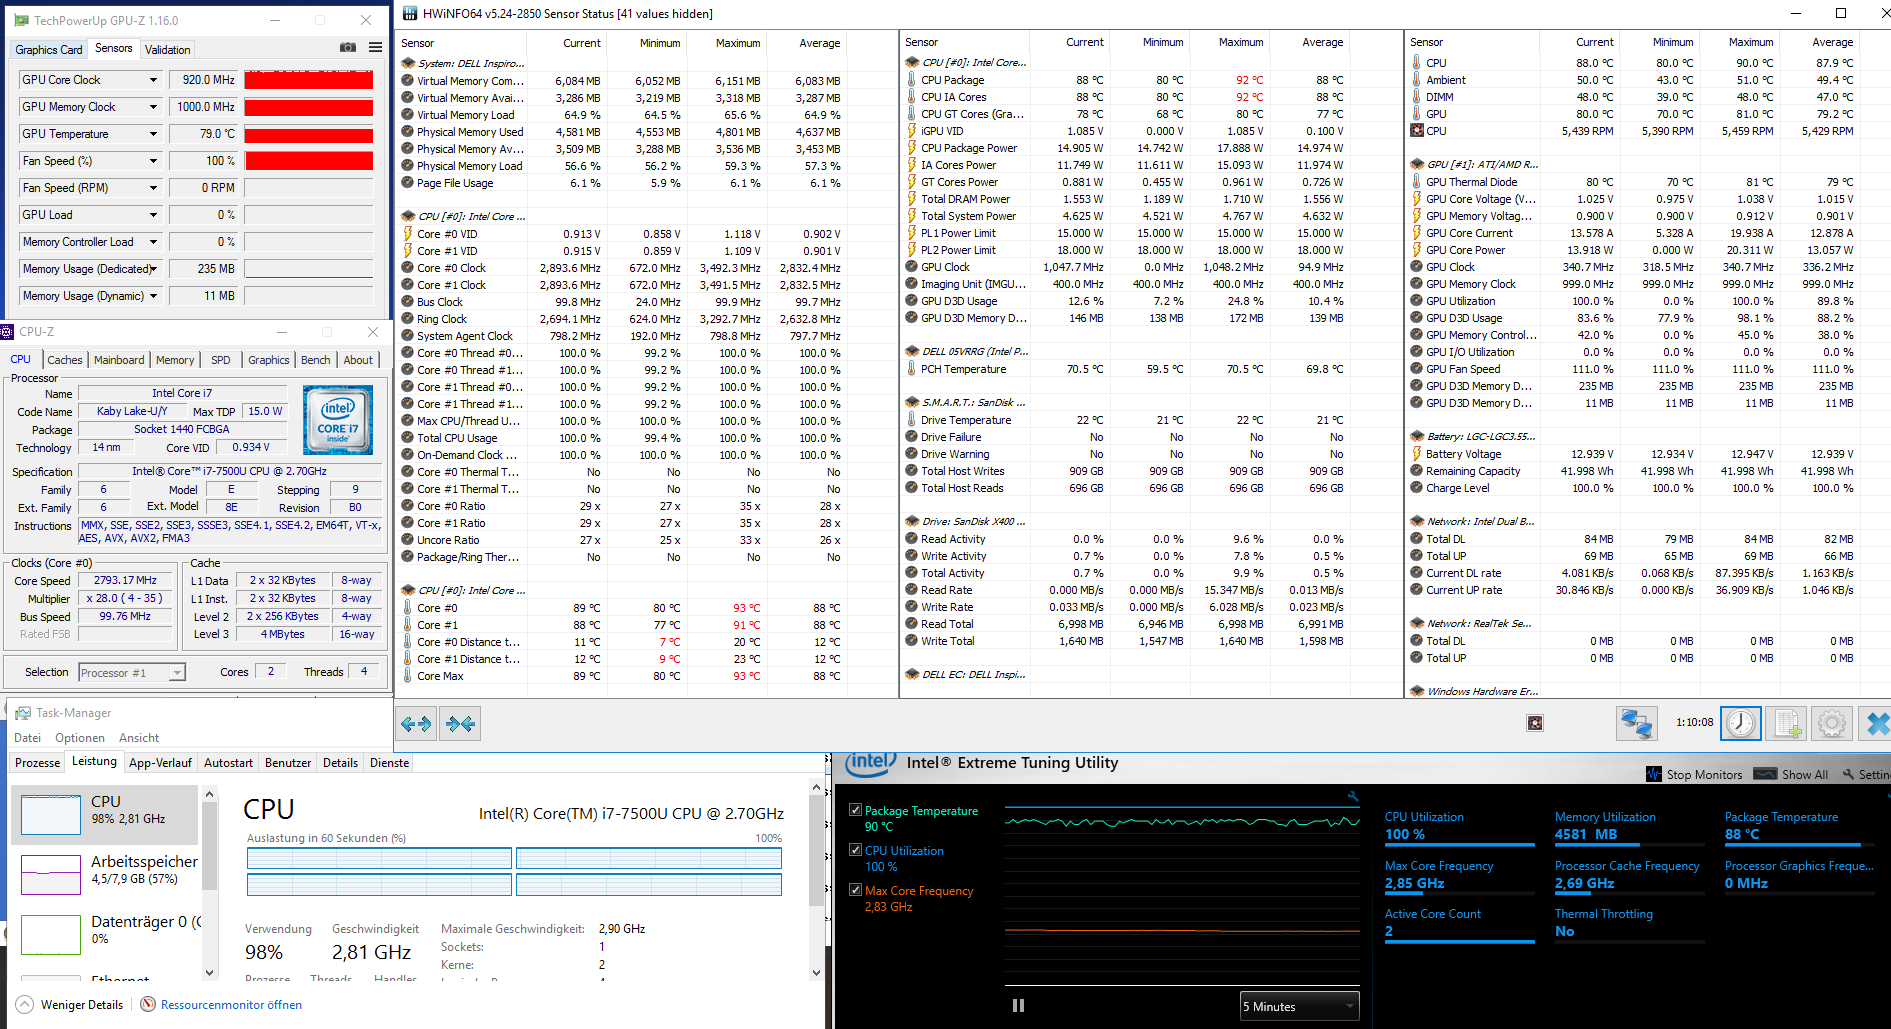
(±) La temperatura massima sul lato superiore è di 41.6 °C / 107 F, rispetto alla media di 36.8 °C / 98 F, che varia da 21 a 71 °C per questa classe Multimedia.
(-) Il lato inferiore si riscalda fino ad un massimo di 51.3 °C / 124 F, rispetto alla media di 39.1 °C / 102 F
(+) In idle, la temperatura media del lato superiore è di 25.6 °C / 78 F, rispetto alla media deld ispositivo di 31.3 °C / 88 F.
(+) I poggiapolsi e il touchpad sono piu' freddi della temperatura della pelle con un massimo di 27.9 °C / 82.2 F e sono quindi freddi al tatto.
(±) La temperatura media della zona del palmo della mano di dispositivi simili e'stata di 28.7 °C / 83.7 F (+0.8 °C / 1.5 F).
| Dell Inspiron 15 5000 5567-1753 i7-7500U, Radeon R7 M445 | Acer Aspire E5-575G-549D i5-7200U, GeForce GTX 950M | Lenovo IdeaPad 510-15IKB 80SV0087GE i7-7500U, GeForce 940MX | Lenovo ThinkPad E470-20H2S00400 i5-7200U, GeForce 940MX | HP Pavilion 15-aw004ng W8Y60EA A10-9600P, Radeon R8 M445DX | HP Pavilion 17-x110ng i5-7200U, Radeon R7 M440 | |
|---|---|---|---|---|---|---|
| Heat | -10% | 19% | 5% | 18% | 15% | |
| Maximum Upper Side * (°C) | 41.6 | 48.1 -16% | 38.3 8% | 43.8 -5% | 33.4 20% | 40.3 3% |
| Maximum Bottom * (°C) | 51.3 | 60.8 -19% | 36 30% | 53 -3% | 32.9 36% | 46.1 10% |
| Idle Upper Side * (°C) | 29.4 | 30.8 -5% | 24.9 15% | 25.9 12% | 27.7 6% | 23.8 19% |
| Idle Bottom * (°C) | 32.4 | 31.9 2% | 25.6 21% | 27.1 16% | 29.4 9% | 23.4 28% |
* ... Meglio usare valori piccoli
Dell Inspiron 15 5000 5567-1753 analisi audio
(±) | potenza degli altiparlanti media ma buona (72 dB)
Bassi 100 - 315 Hz
(-) | quasi nessun basso - in media 19.4% inferiori alla media
(±) | la linearità dei bassi è media (8.9% delta rispetto alla precedente frequenza)
Medi 400 - 2000 Hz
(±) | medi elevati - circa 5.1% superiore alla media
(±) | linearità dei medi adeguata (10.2% delta rispetto alla precedente frequenza)
Alti 2 - 16 kHz
(+) | Alti bilanciati - appena 2.4% dalla media
(+) | alti lineari (6.6% delta rispetto alla precedente frequenza)
Nel complesso 100 - 16.000 Hz
(±) | la linearità complessiva del suono è media (18.6% di differenza rispetto alla media
Rispetto alla stessa classe
» 57% di tutti i dispositivi testati in questa classe è stato migliore, 8% simile, 35% peggiore
» Il migliore ha avuto un delta di 5%, medio di 17%, peggiore di 45%
Rispetto a tutti i dispositivi testati
» 42% di tutti i dispositivi testati in questa classe è stato migliore, 8% similare, 50% peggiore
» Il migliore ha avuto un delta di 4%, medio di 23%, peggiore di 134%
Apple MacBook 12 (Early 2016) 1.1 GHz analisi audio
(+) | gli altoparlanti sono relativamente potenti (83.6 dB)
Bassi 100 - 315 Hz
(±) | bassi ridotti - in media 11.3% inferiori alla media
(±) | la linearità dei bassi è media (14.2% delta rispetto alla precedente frequenza)
Medi 400 - 2000 Hz
(+) | medi bilanciati - solo only 2.4% rispetto alla media
(+) | medi lineari (5.5% delta rispetto alla precedente frequenza)
Alti 2 - 16 kHz
(+) | Alti bilanciati - appena 2% dalla media
(+) | alti lineari (4.5% delta rispetto alla precedente frequenza)
Nel complesso 100 - 16.000 Hz
(+) | suono nel complesso lineare (10.2% differenza dalla media)
Rispetto alla stessa classe
» 7% di tutti i dispositivi testati in questa classe è stato migliore, 2% simile, 90% peggiore
» Il migliore ha avuto un delta di 5%, medio di 18%, peggiore di 53%
Rispetto a tutti i dispositivi testati
» 5% di tutti i dispositivi testati in questa classe è stato migliore, 1% similare, 94% peggiore
» Il migliore ha avuto un delta di 4%, medio di 23%, peggiore di 134%
| Off / Standby | |
| Idle | |
| Sotto carico |
|
Leggenda:
min: | |
| Dell Inspiron 15 5000 5567-1753 i7-7500U, Radeon R7 M445, SanDisk X400 SED 256GB, SATA (SD8TB8U-256G) | Acer Aspire E5-575G-549D i5-7200U, GeForce GTX 950M, Toshiba MQ01ABD100 | Lenovo IdeaPad 510-15IKB 80SV0087GE i7-7500U, GeForce 940MX, Liteonit CV3-DE256 | Lenovo ThinkPad E470-20H2S00400 i5-7200U, GeForce 940MX, SanDisk X400 SED 256GB, SATA (SD8TB8U-256G) | HP Pavilion 15-aw004ng W8Y60EA A10-9600P, Radeon R8 M445DX, | HP Pavilion 17-x110ng i5-7200U, Radeon R7 M440, SanDisk Z400s SD8SNAT-256G | |
|---|---|---|---|---|---|---|
| Power Consumption | -32% | -2% | 10% | -18% | -59% | |
| Idle Minimum * (Watt) | 4 | 6 -50% | 3.9 2% | 2.7 32% | 5.5 -38% | 7.7 -93% |
| Idle Average * (Watt) | 5.4 | 8.1 -50% | 7.4 -37% | 5.5 -2% | 8.2 -52% | 14 -159% |
| Idle Maximum * (Watt) | 8.3 | 9.8 -18% | 9.5 -14% | 6.5 22% | 9.5 -14% | 15.1 -82% |
| Load Average * (Watt) | 54 | 52.5 3% | 41 24% | 44.2 18% | 44.5 18% | 33 39% |
| Load Maximum * (Watt) | 55.4 | 81.6 -47% | 48 13% | 65.2 -18% | 58 -5% | 54.6 1% |
* ... Meglio usare valori piccoli
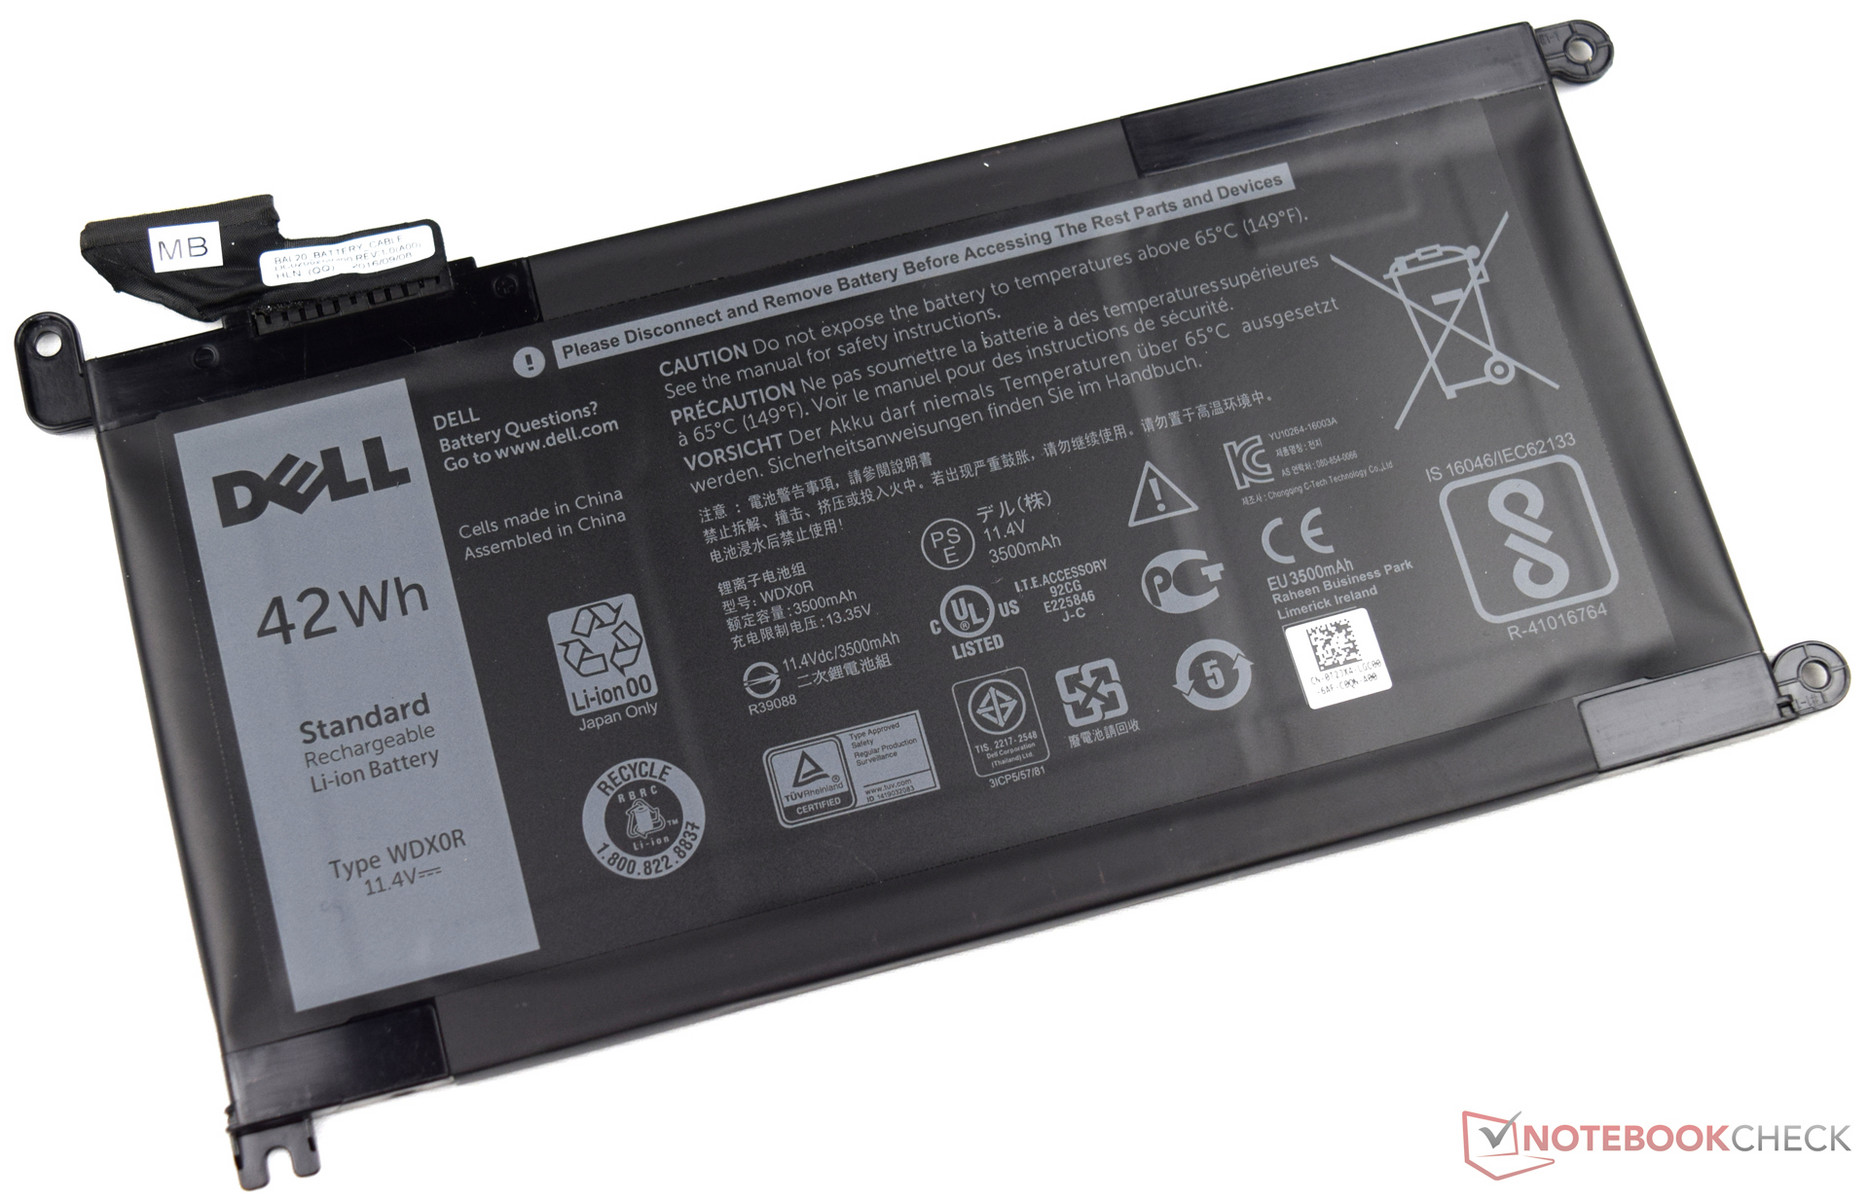
| Dell Inspiron 15 5000 5567-1753 i7-7500U, Radeon R7 M445, 42 Wh | Acer Aspire E5-575G-549D i5-7200U, GeForce GTX 950M, 62 Wh | Lenovo IdeaPad 510-15IKB 80SV0087GE i7-7500U, GeForce 940MX, 30 Wh | Lenovo ThinkPad E470-20H2S00400 i5-7200U, GeForce 940MX, 45 Wh | HP Pavilion 15-aw004ng W8Y60EA A10-9600P, Radeon R8 M445DX, 41 Wh | HP Pavilion 17-x110ng i5-7200U, Radeon R7 M440, 41 Wh | |
|---|---|---|---|---|---|---|
| Autonomia della batteria | 24% | -34% | 47% | -15% | -5% | |
| Reader / Idle (h) | 7.8 | 12.8 64% | 17.4 123% | 9.3 19% | 8.8 13% | |
| H.264 (h) | 5.3 | 7.7 45% | 8.4 58% | 3.2 -40% | 4.8 -9% | |
| WiFi v1.3 (h) | 7 | 7.5 7% | 4.6 -34% | 5.4 -23% | 4.3 -39% | 5.8 -17% |
| Load (h) | 1.6 | 1.3 -19% | 2.1 31% | 1.6 0% | 1.5 -6% |
Pro
Contro

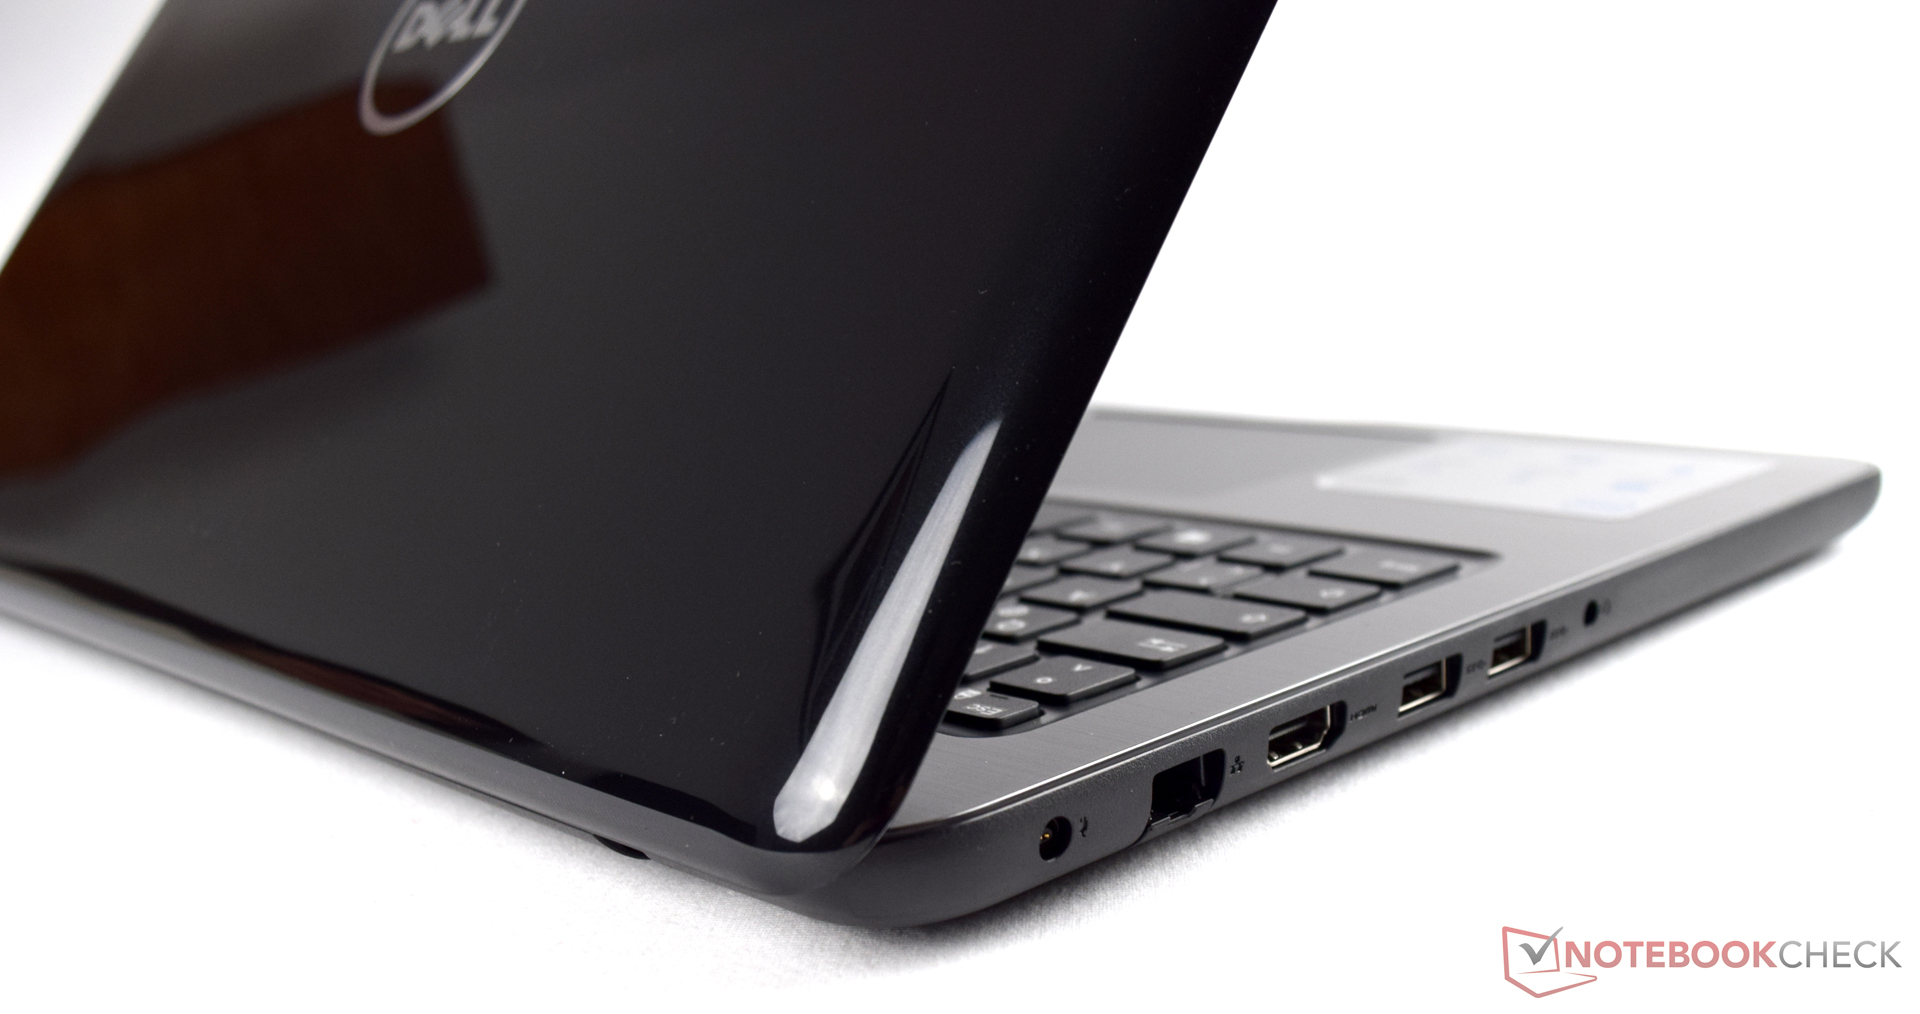
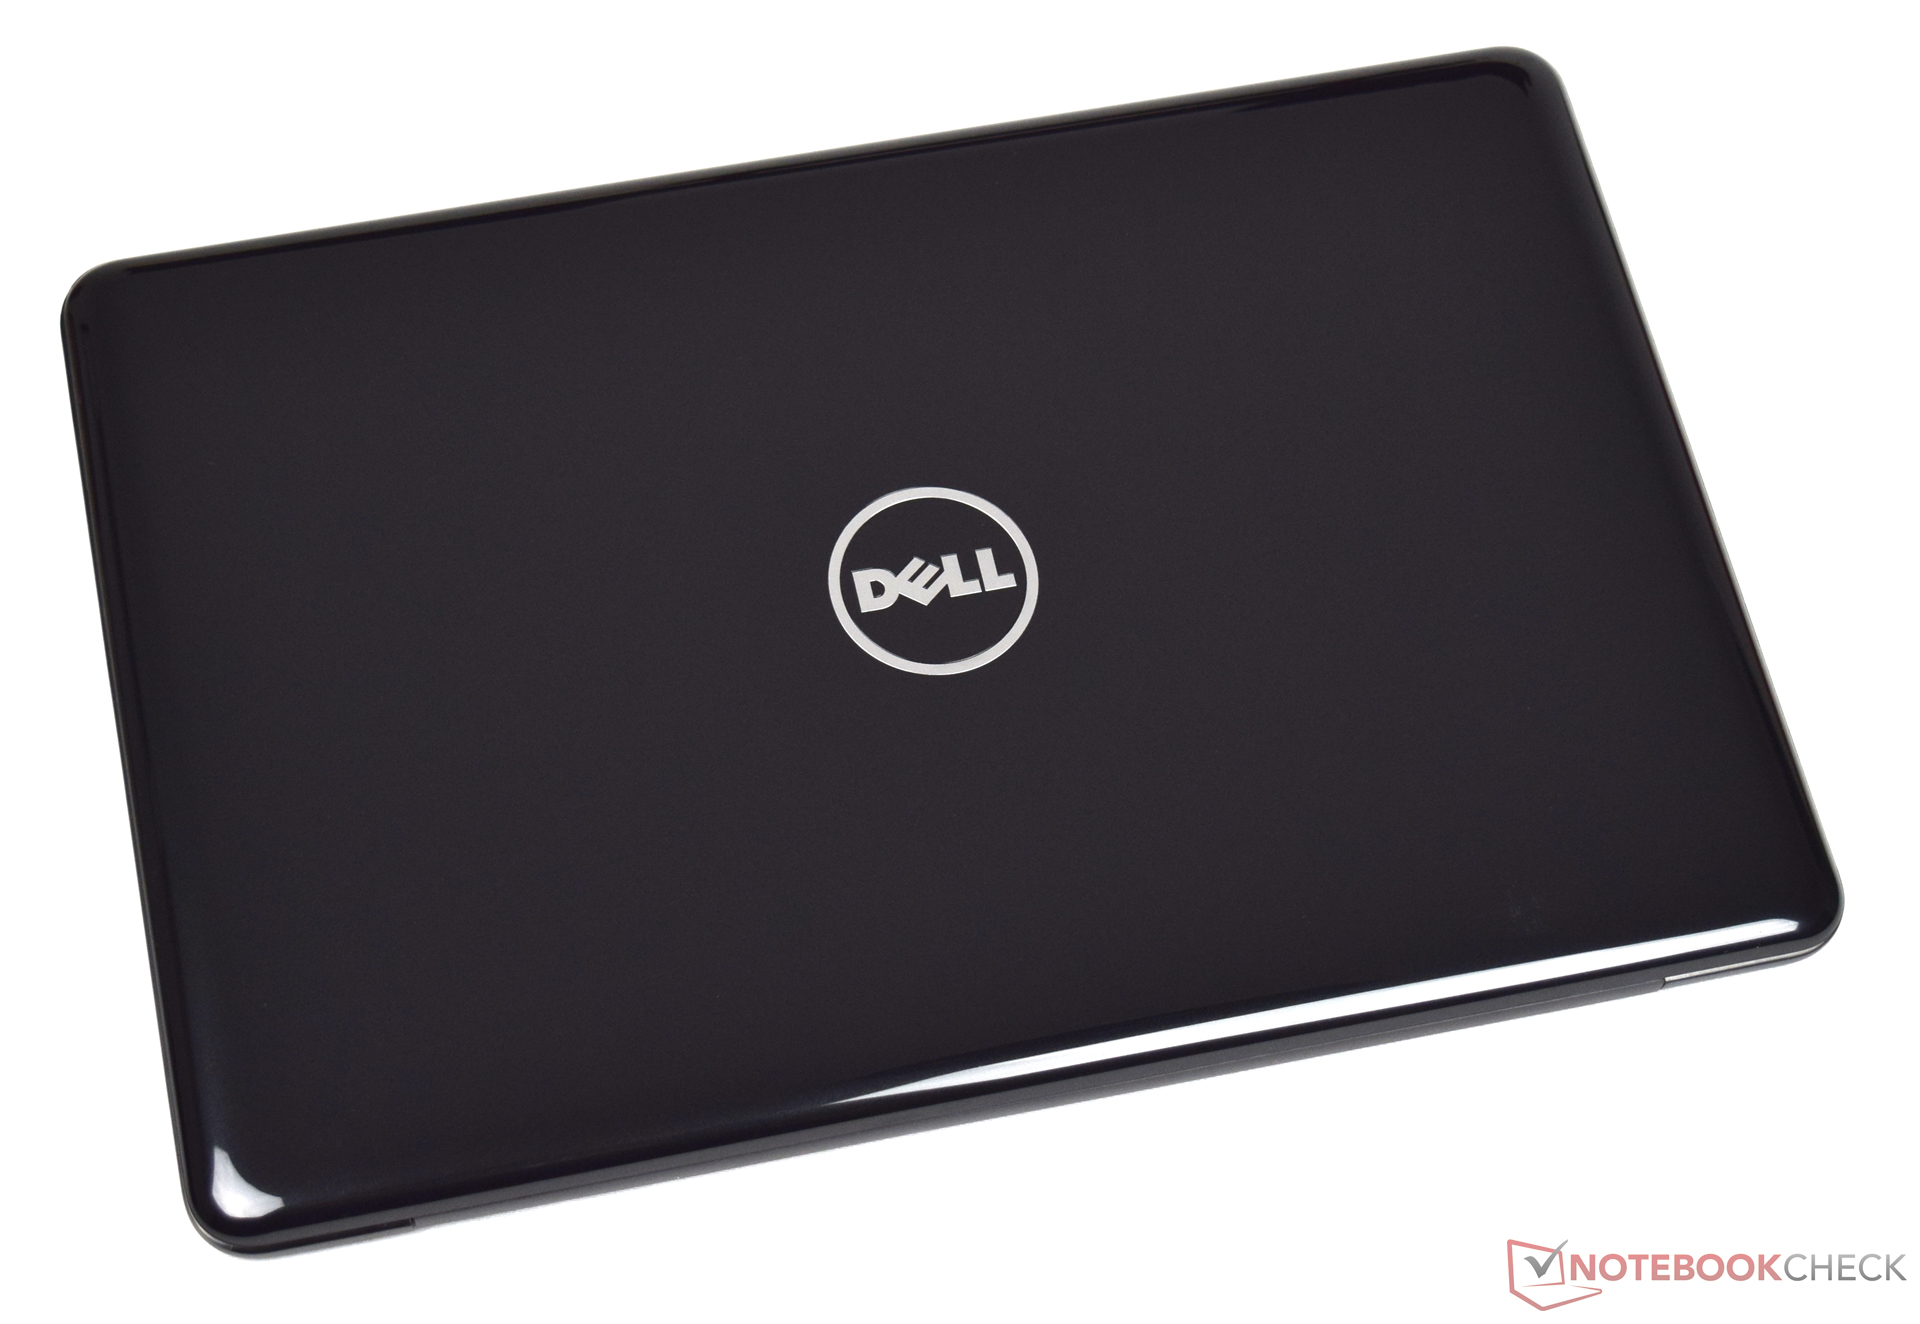
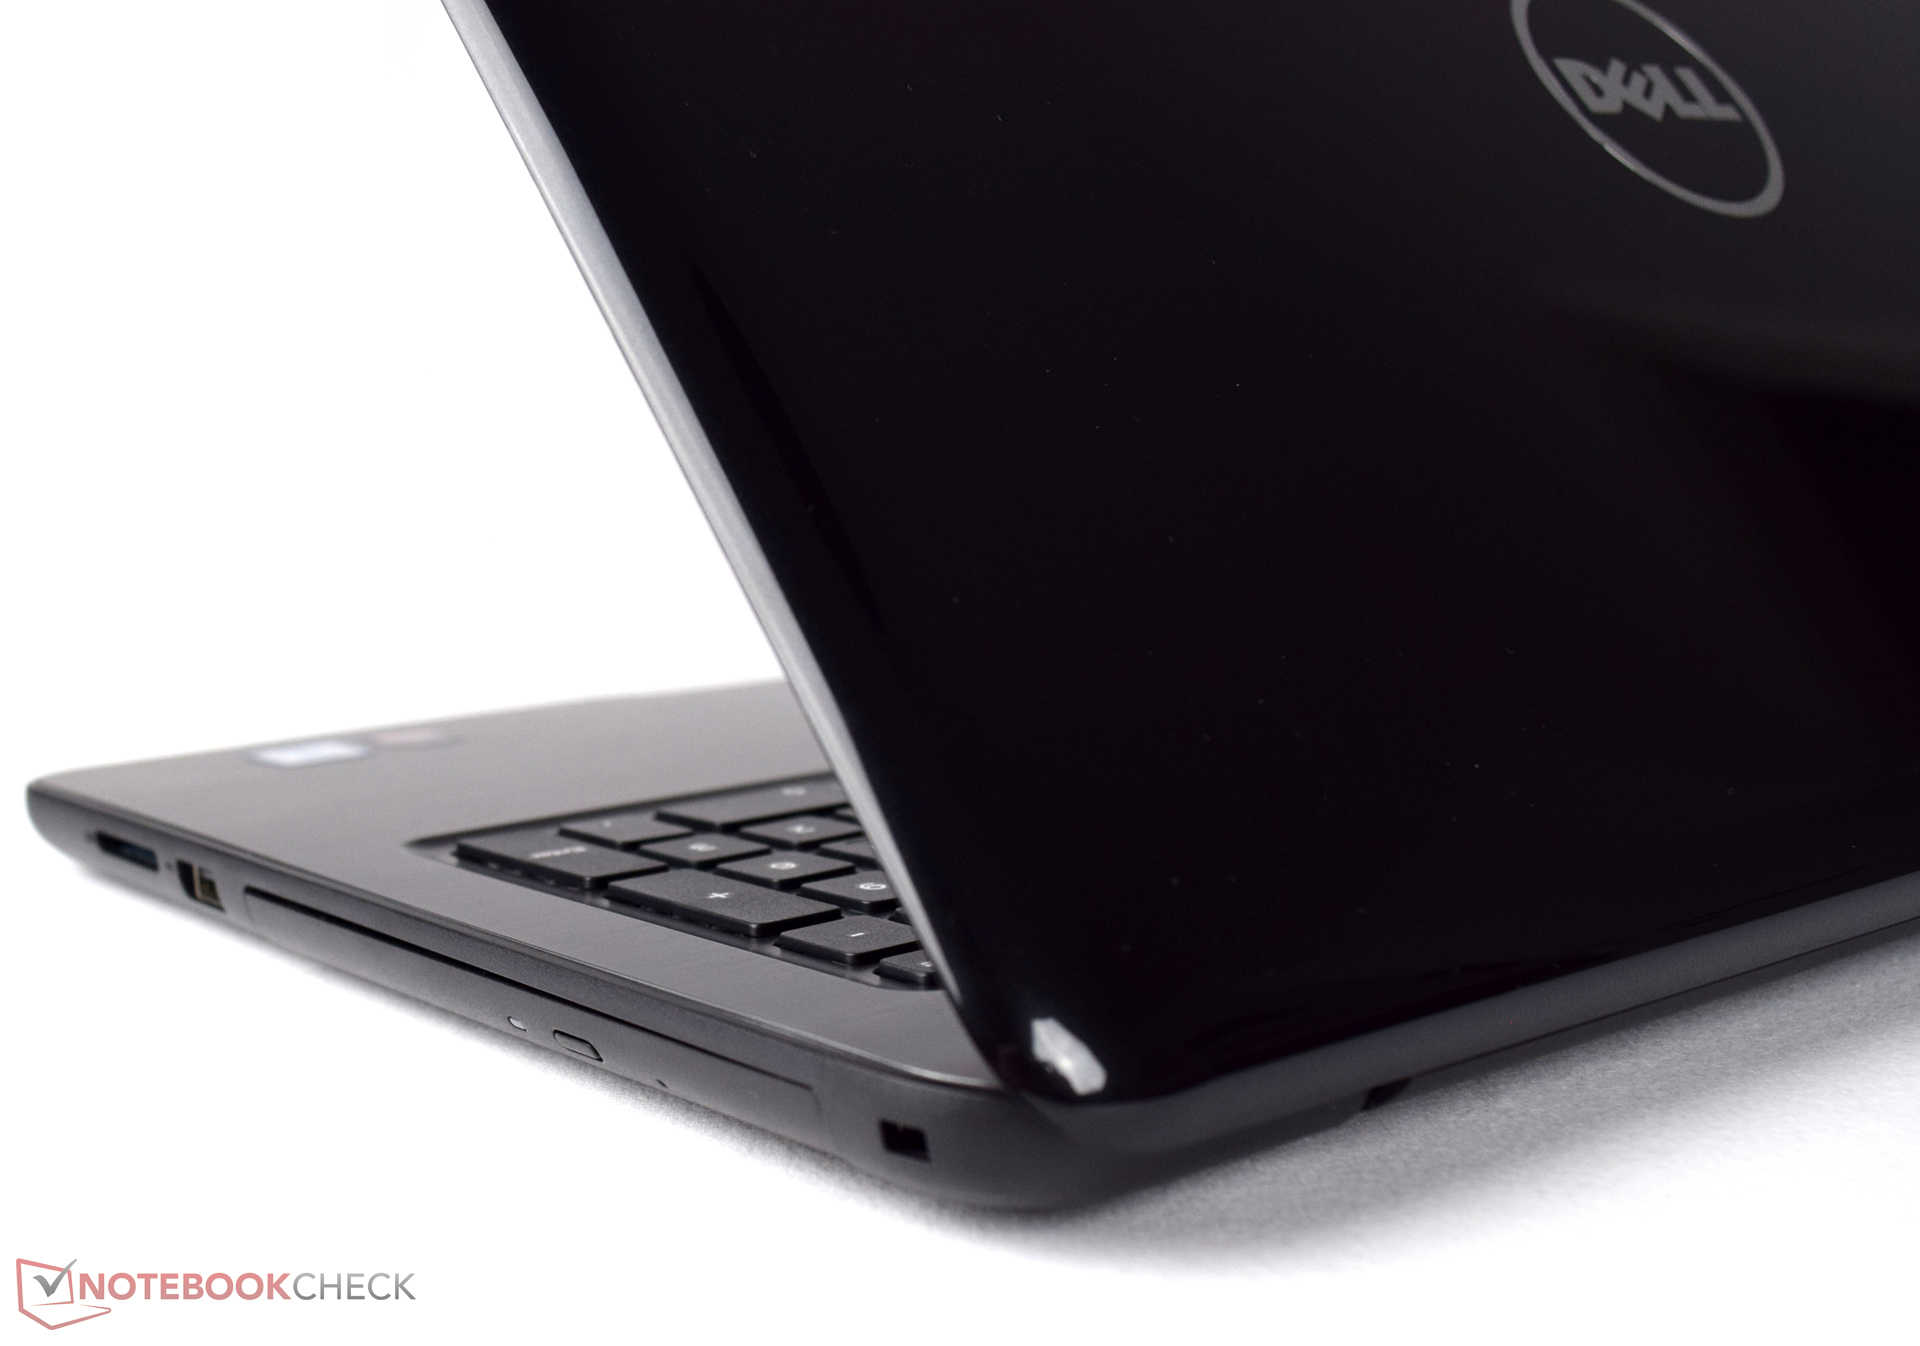
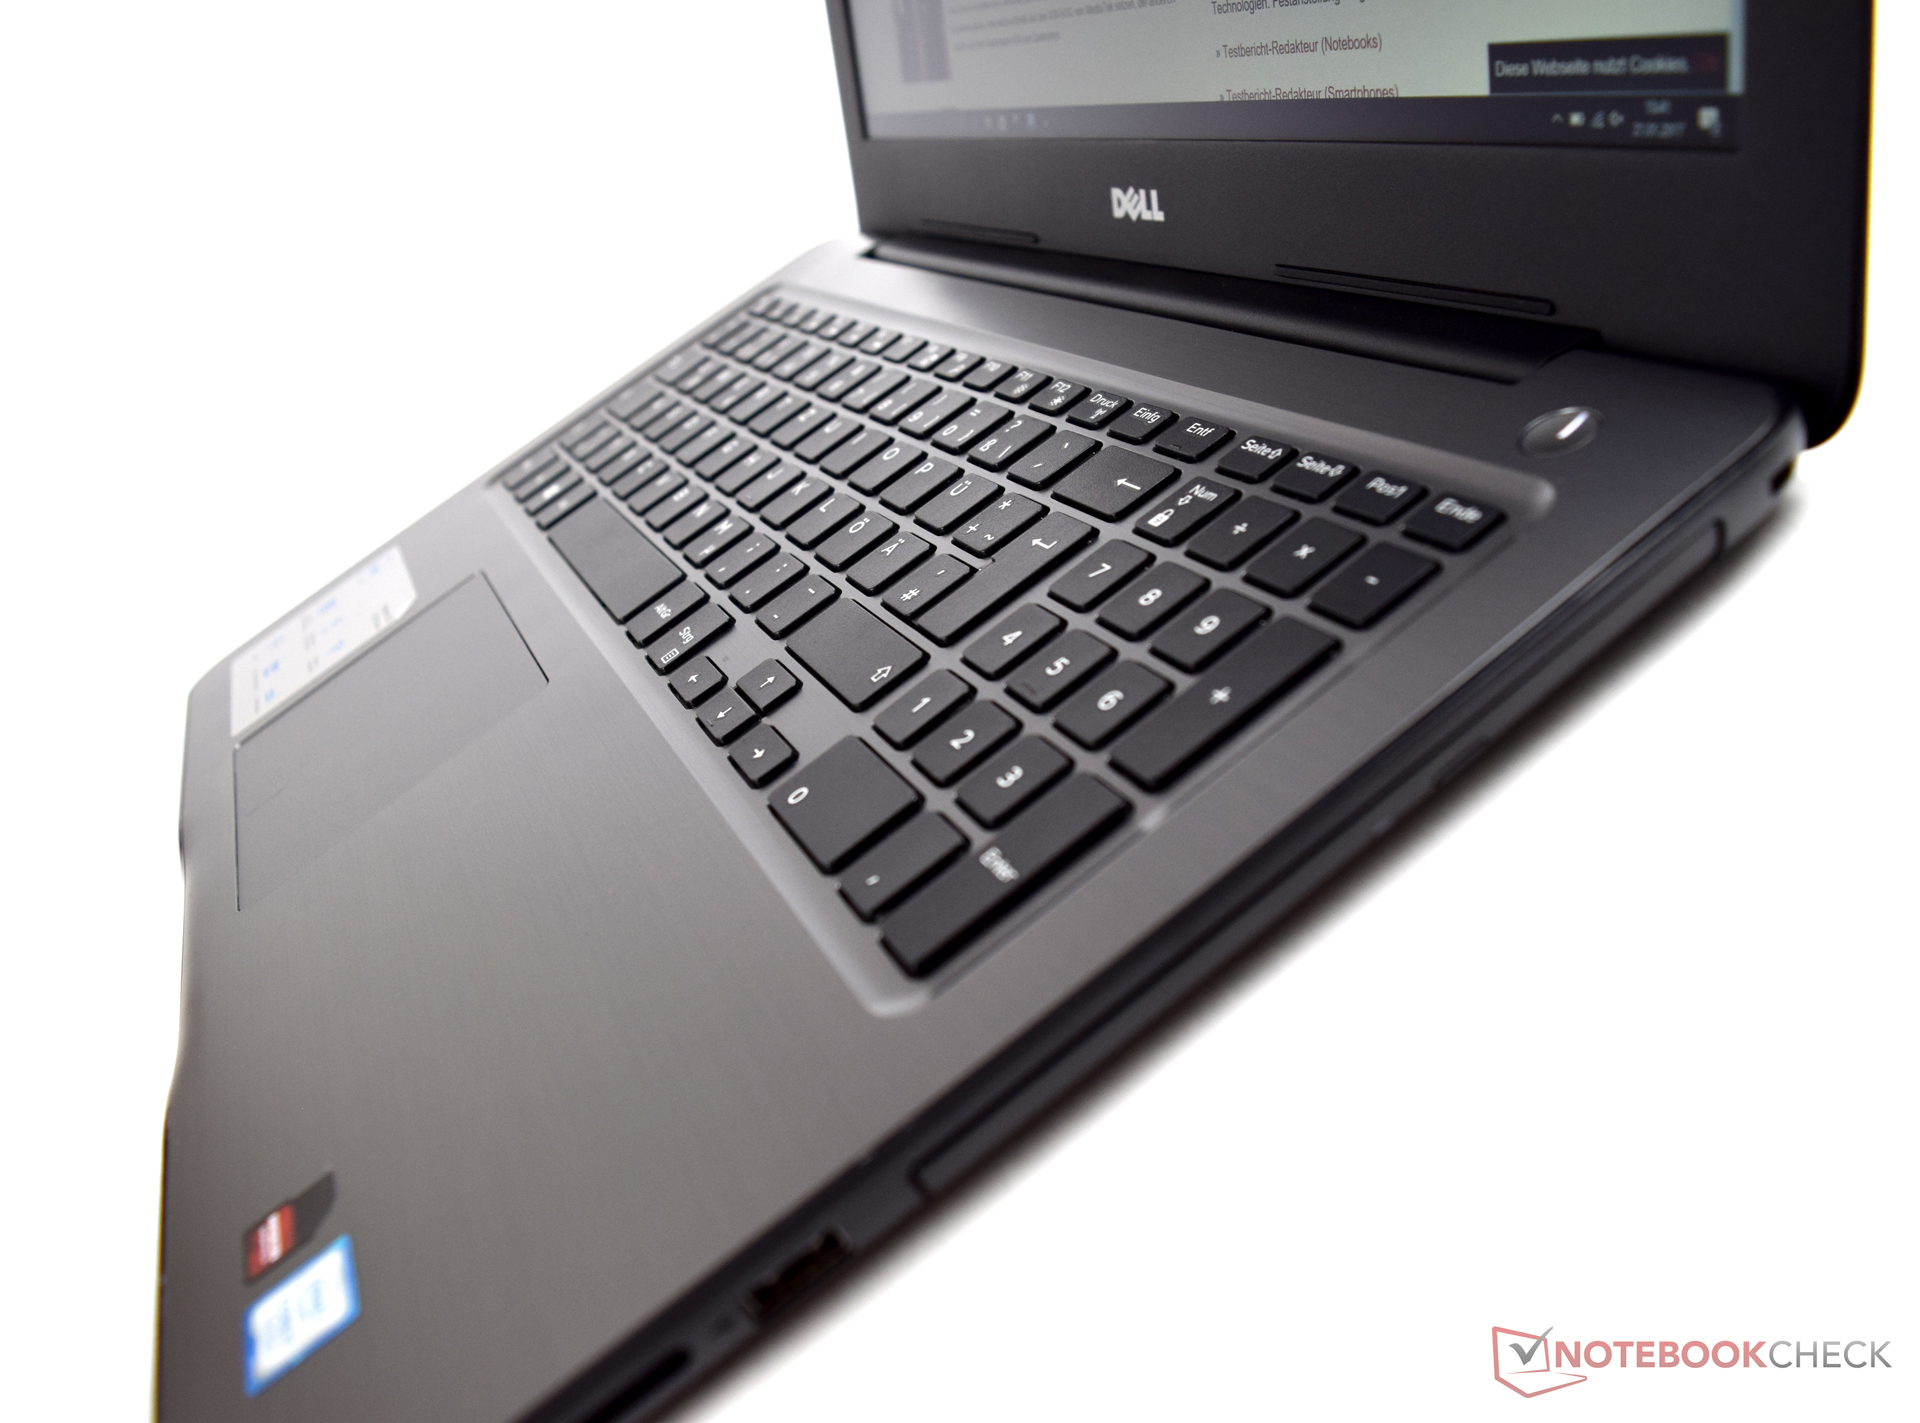
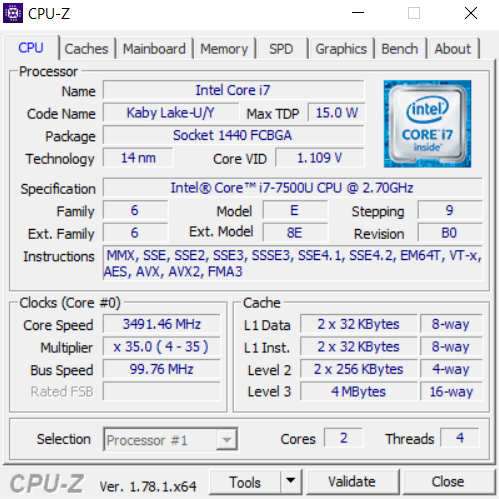
Il Dell Inspiron 15 5000 5567-1753 è un dispositivo multimedia con un design molto semplice. Tuttavia, i graffi possono diventare un problema per la cover lucida, il che non sembra molto carino. Il nostro modello di test da 15.6" monta un moderno e potente processore Intel Kaby Lake. Il Core i7-7500U offre sufficienti performance per le attività multimedia quotidiane, e la scheda grafica dedicata vi consente di usare molti giochi attuali, sebbene la risoluzione nativa è difficile. Il nostro modello di test è attualmente disponibile per 719 Euro in molti negozi online.
Il Dell Inspiron 15 5000 5567-1753 offre solide performance e buoni dispositivi di input per le applicazioni quotidiane. Tuttavia, il display è la vera pecca e non rispecchia le nostre attese. Dell dovrebbe provvedere rapidamente a risolvere questo problema, in quanto pannelli TN di questo tipo fanno parte del passato.
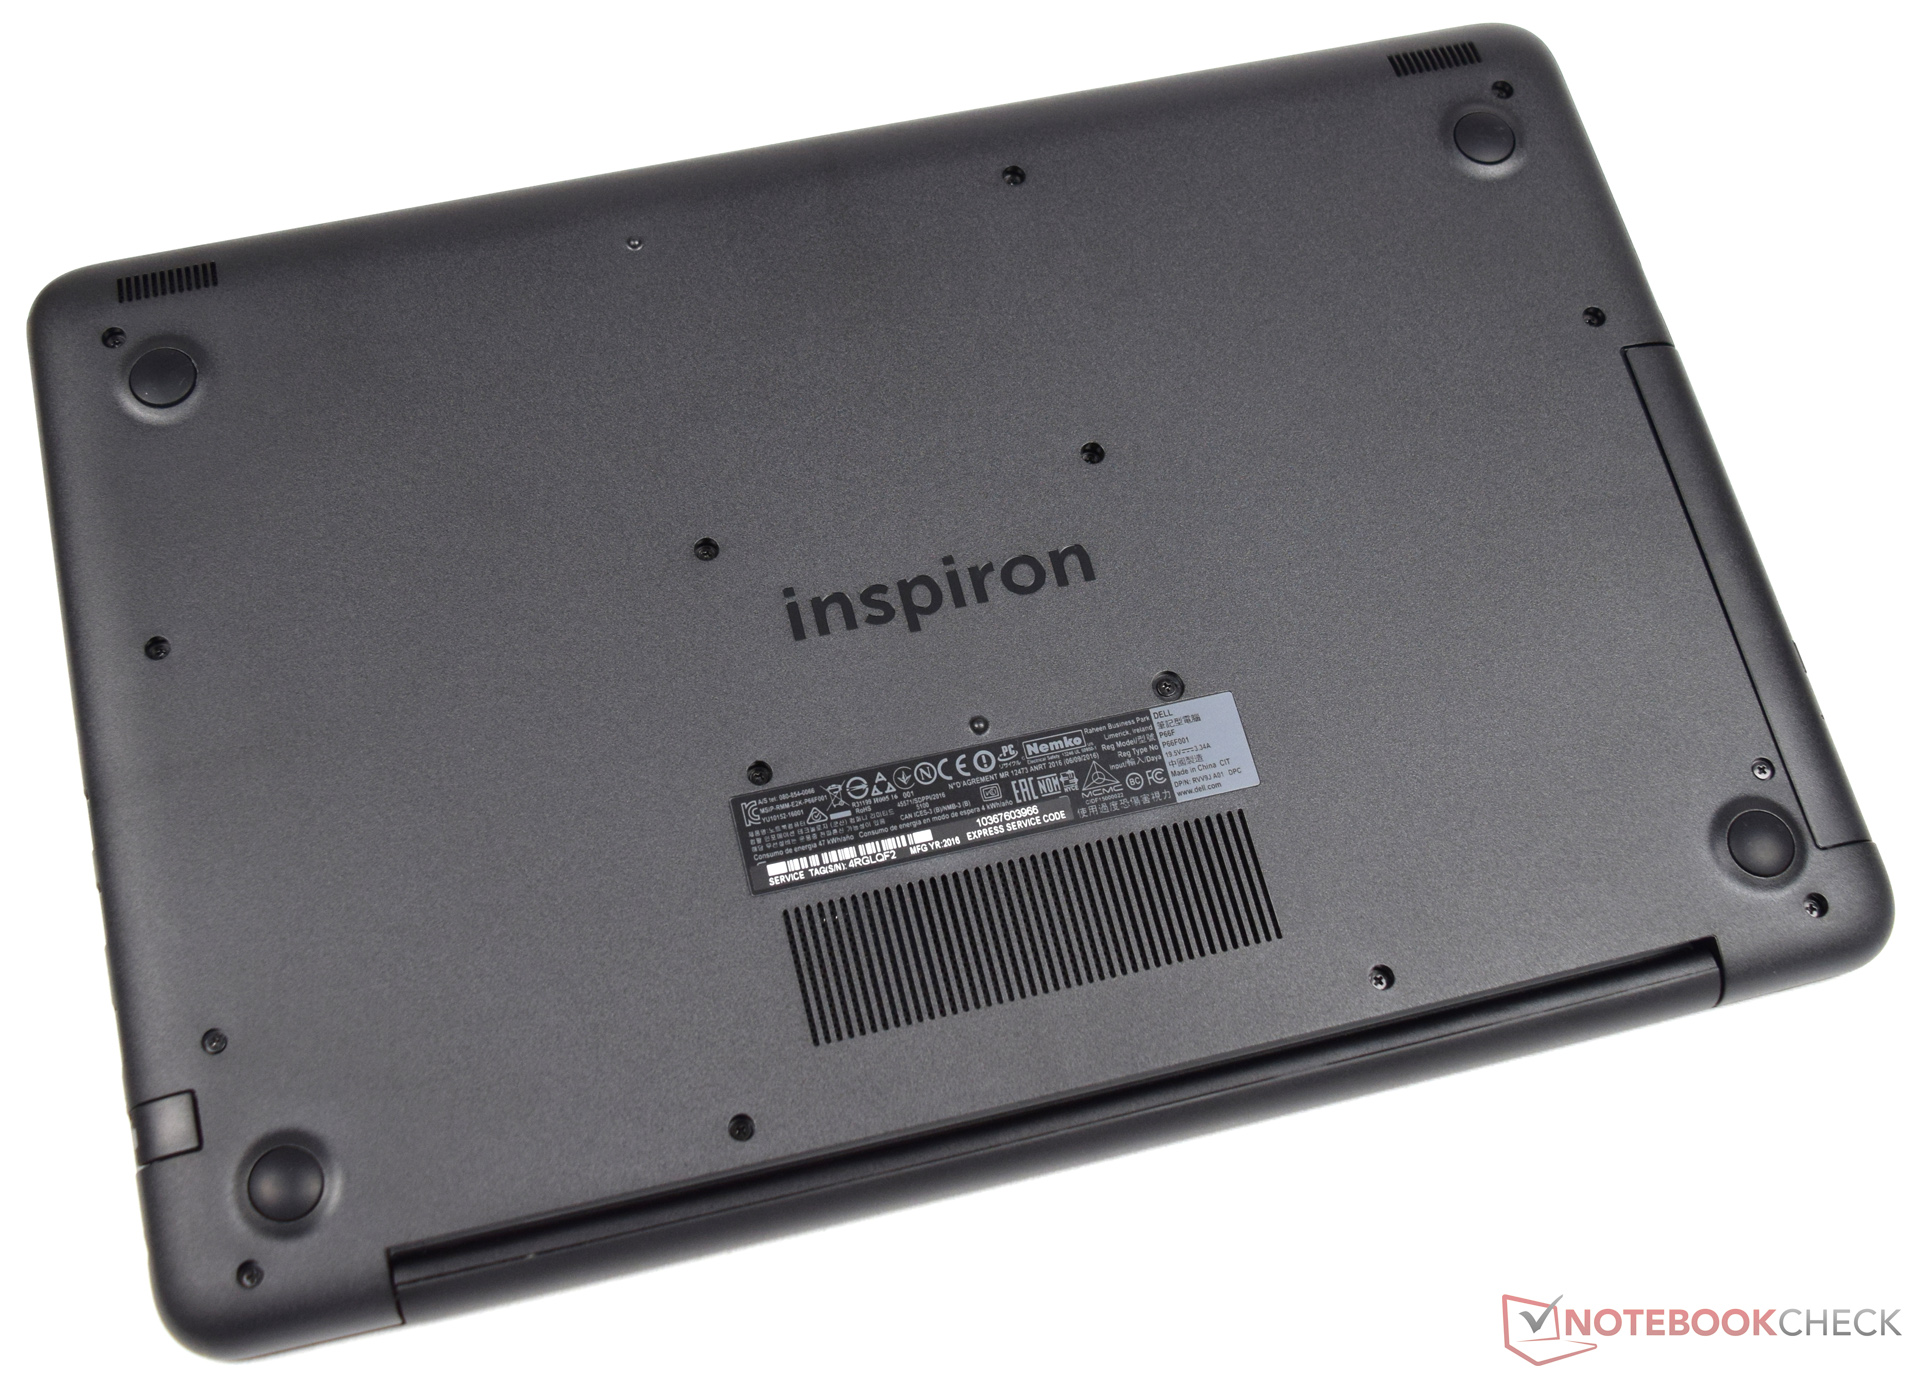
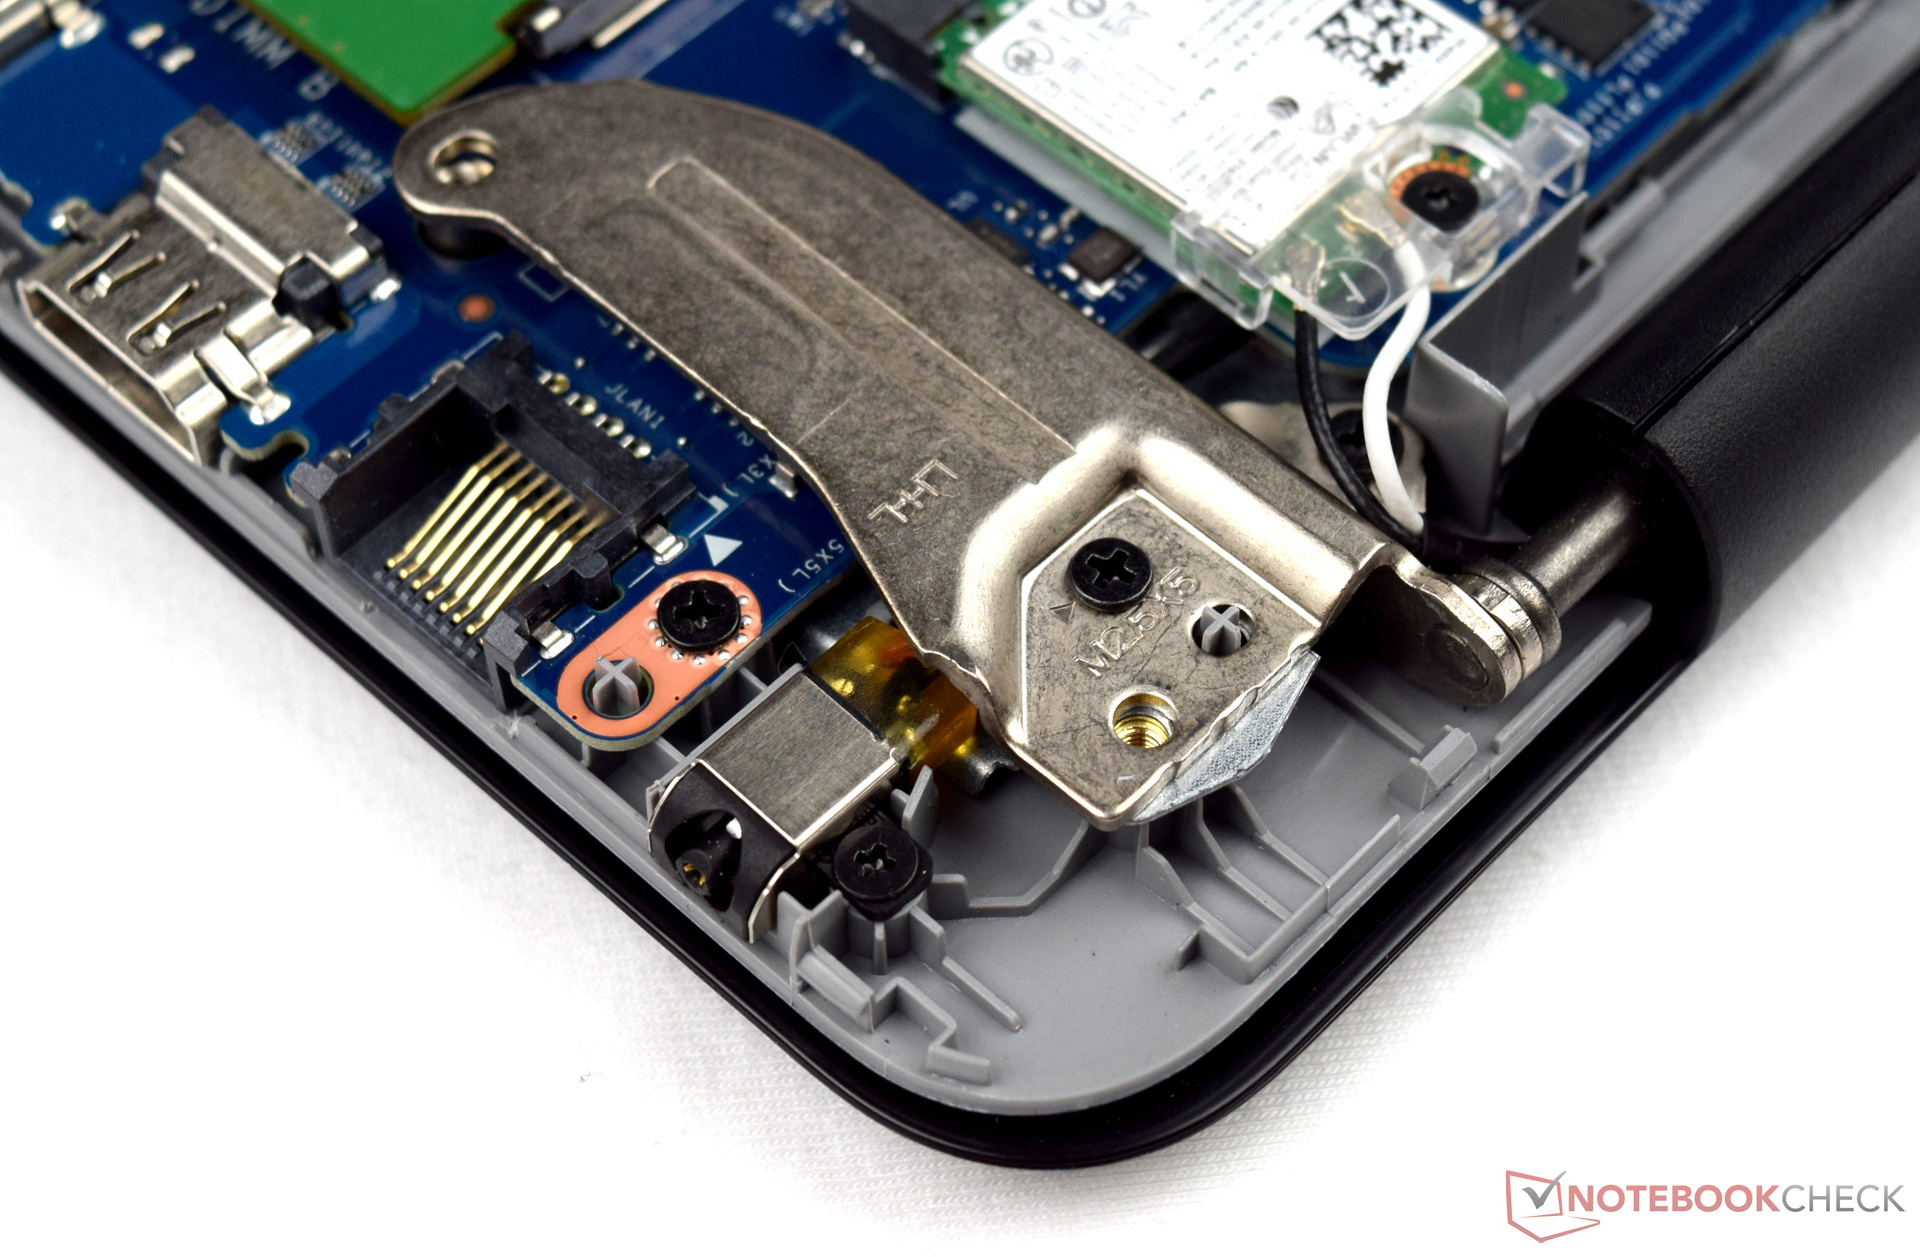
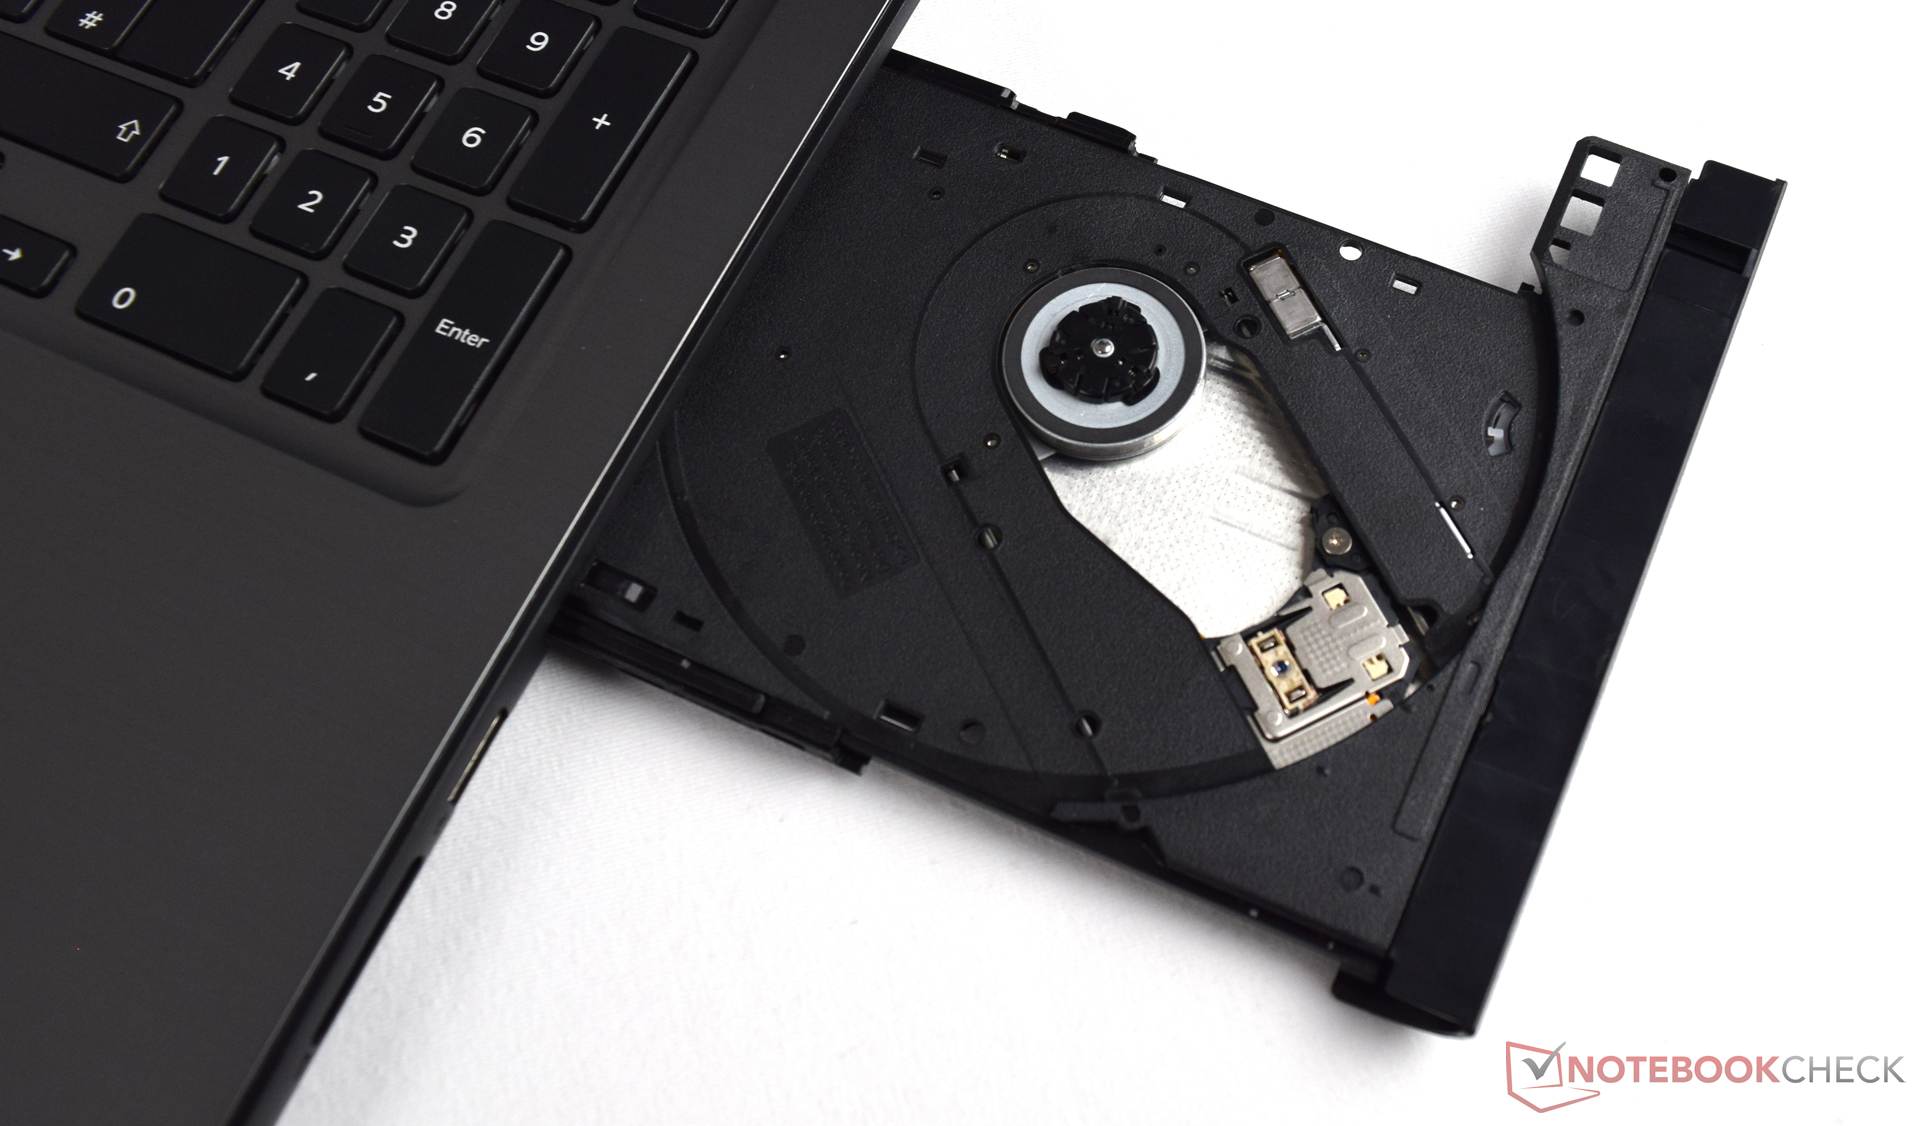
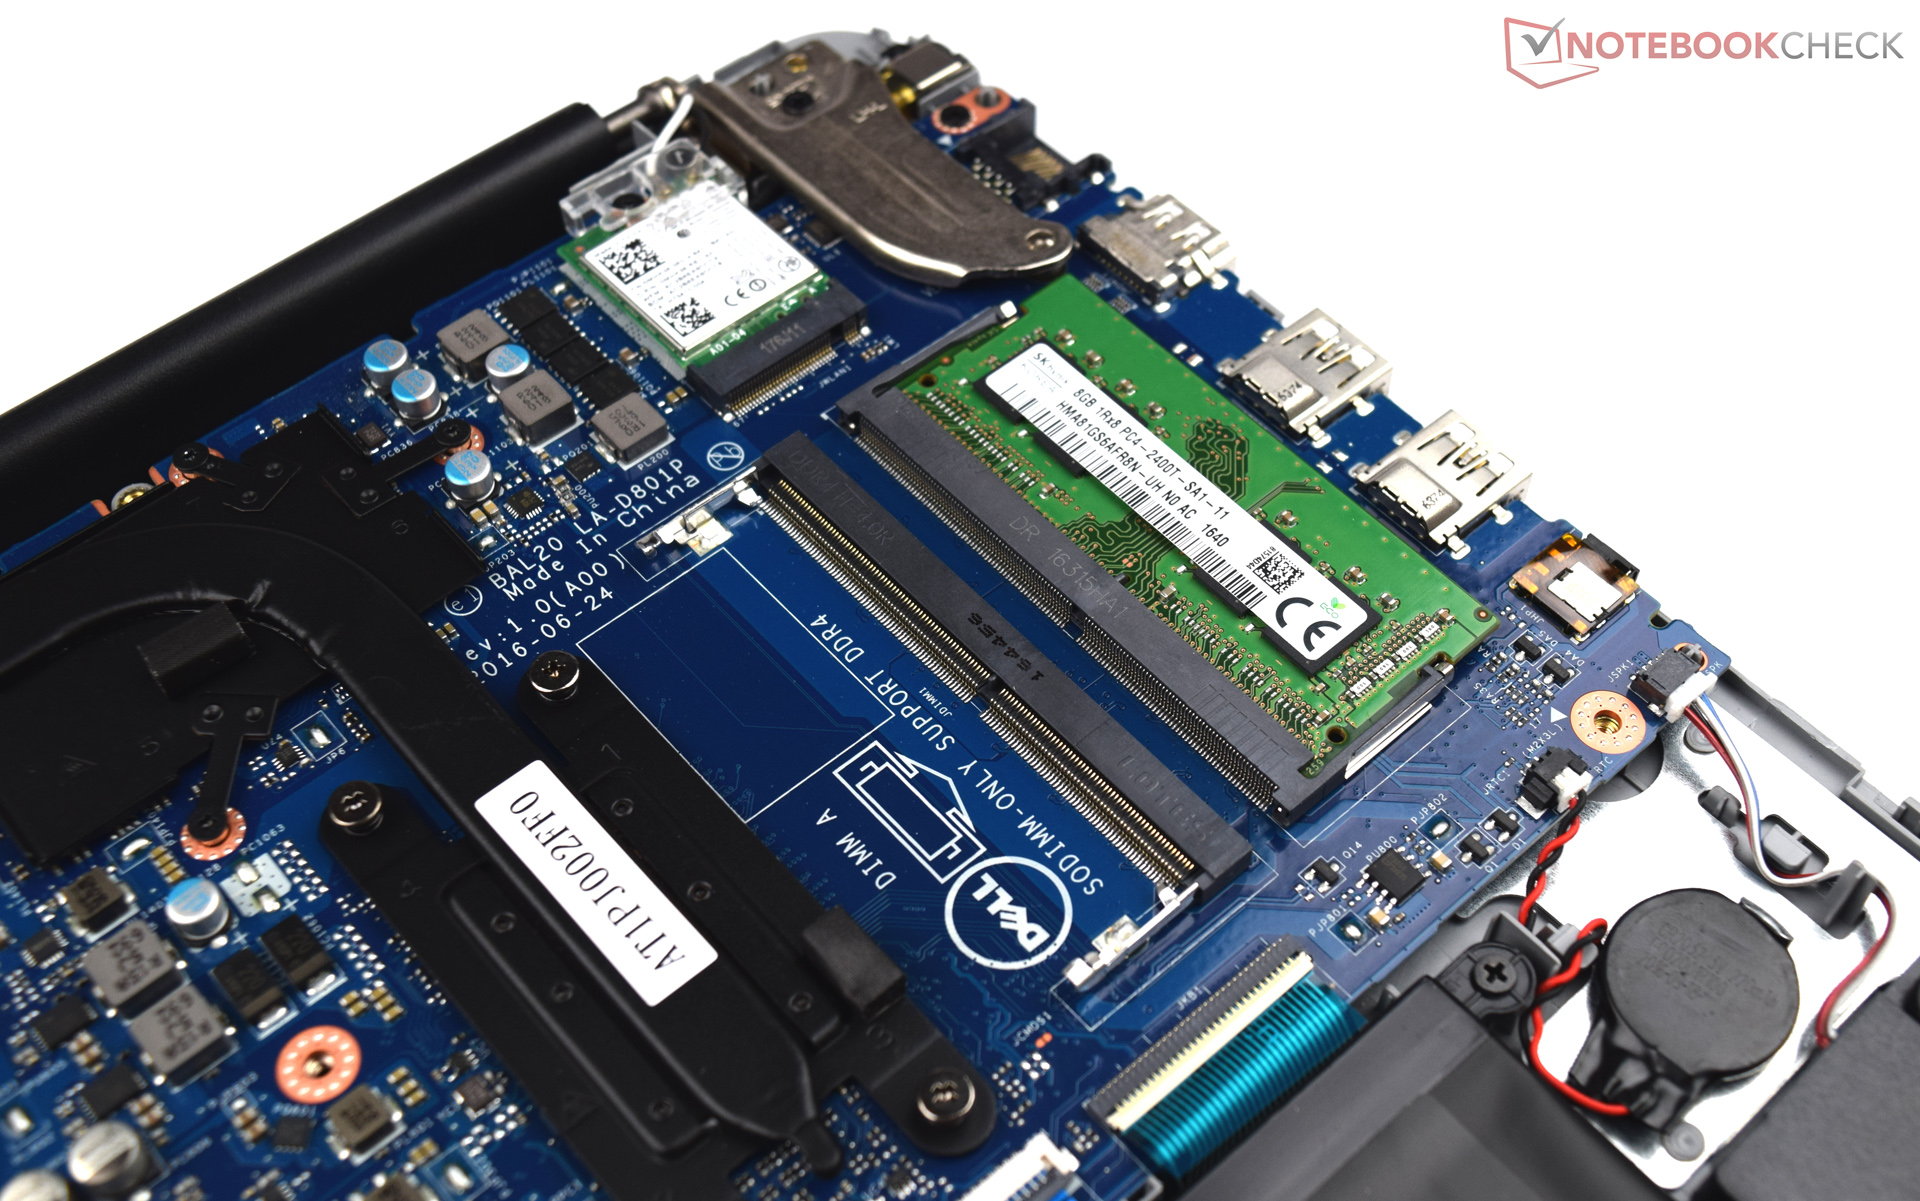
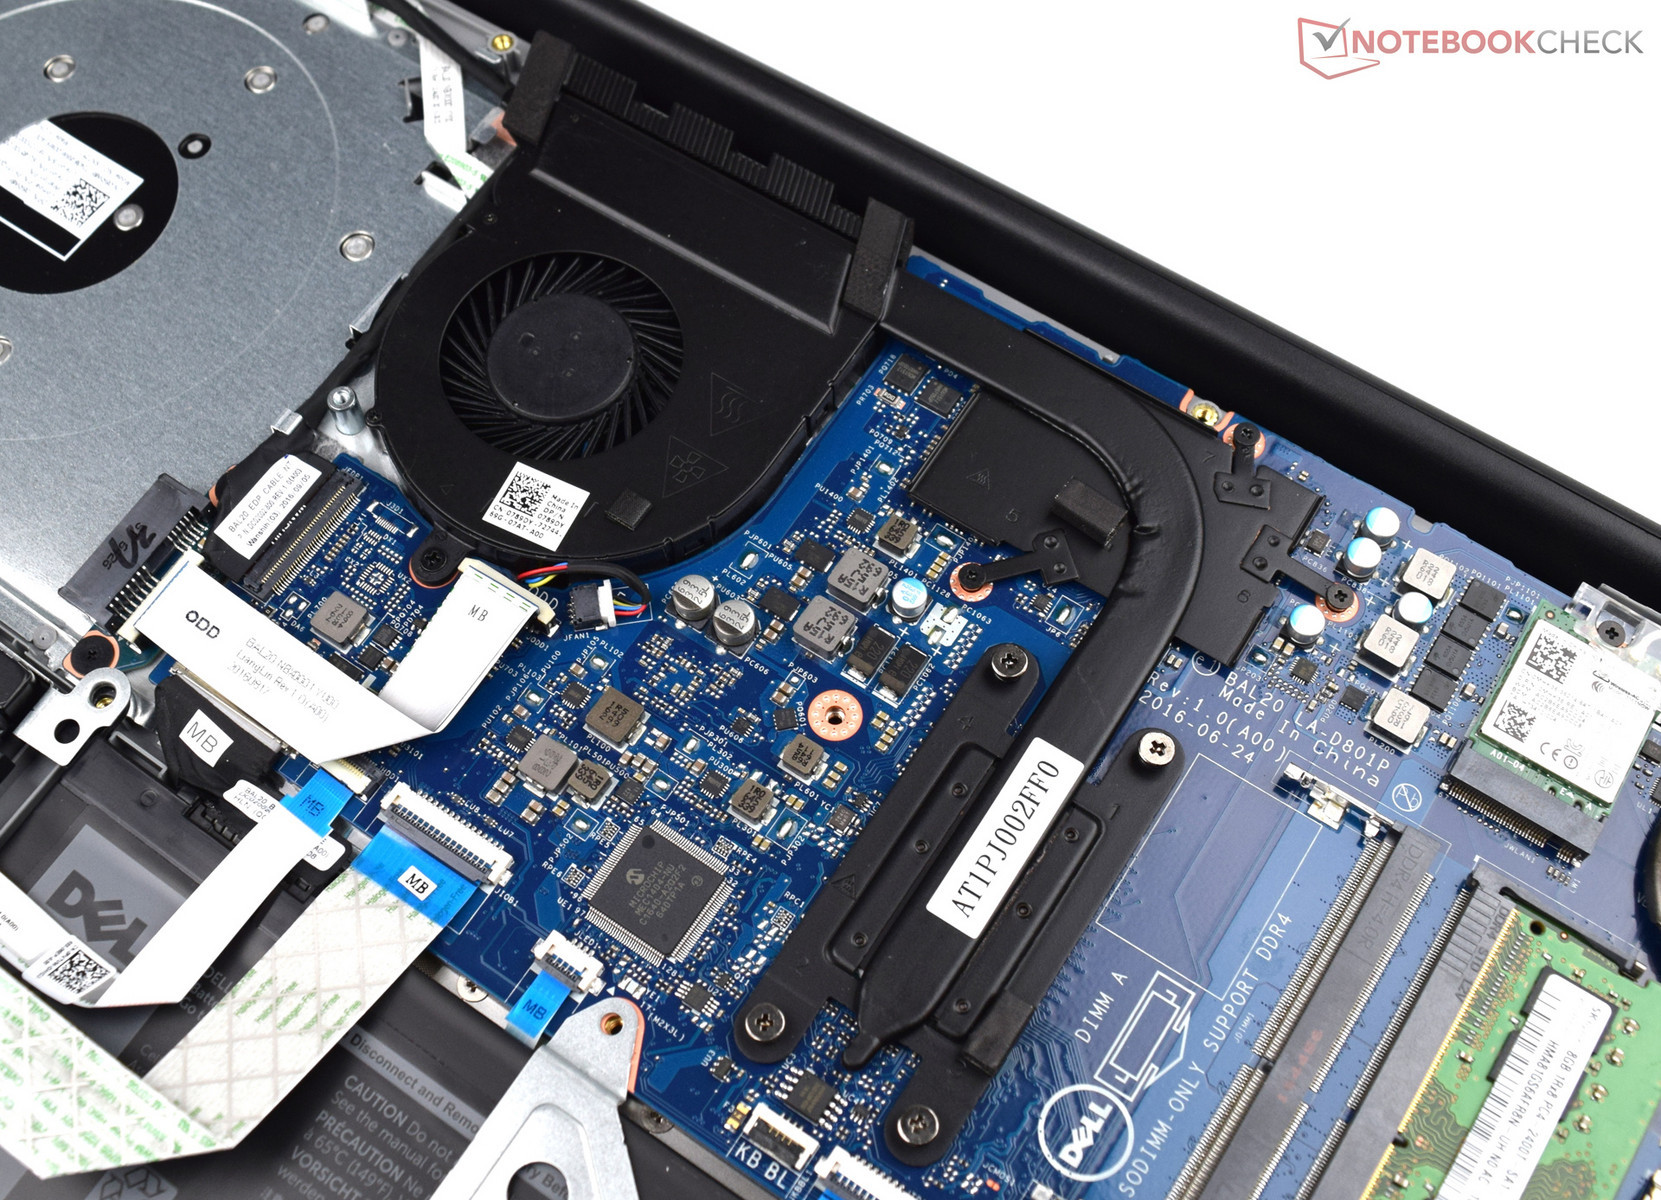
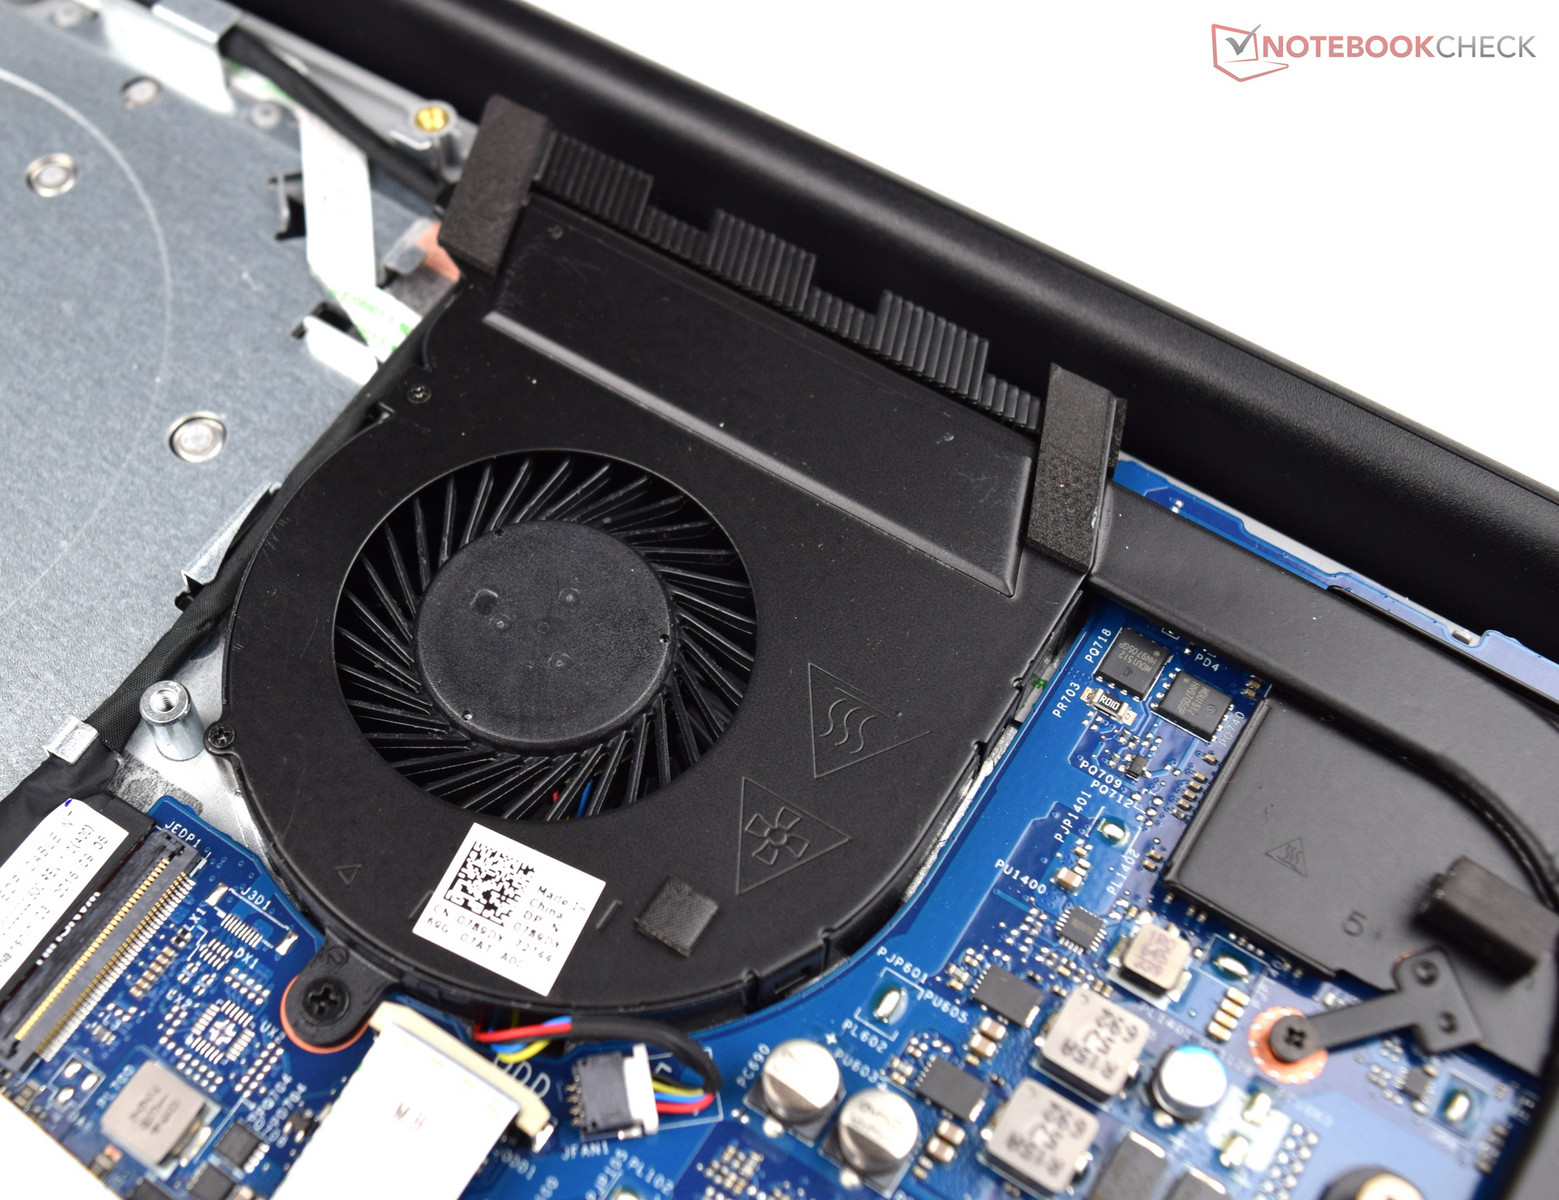
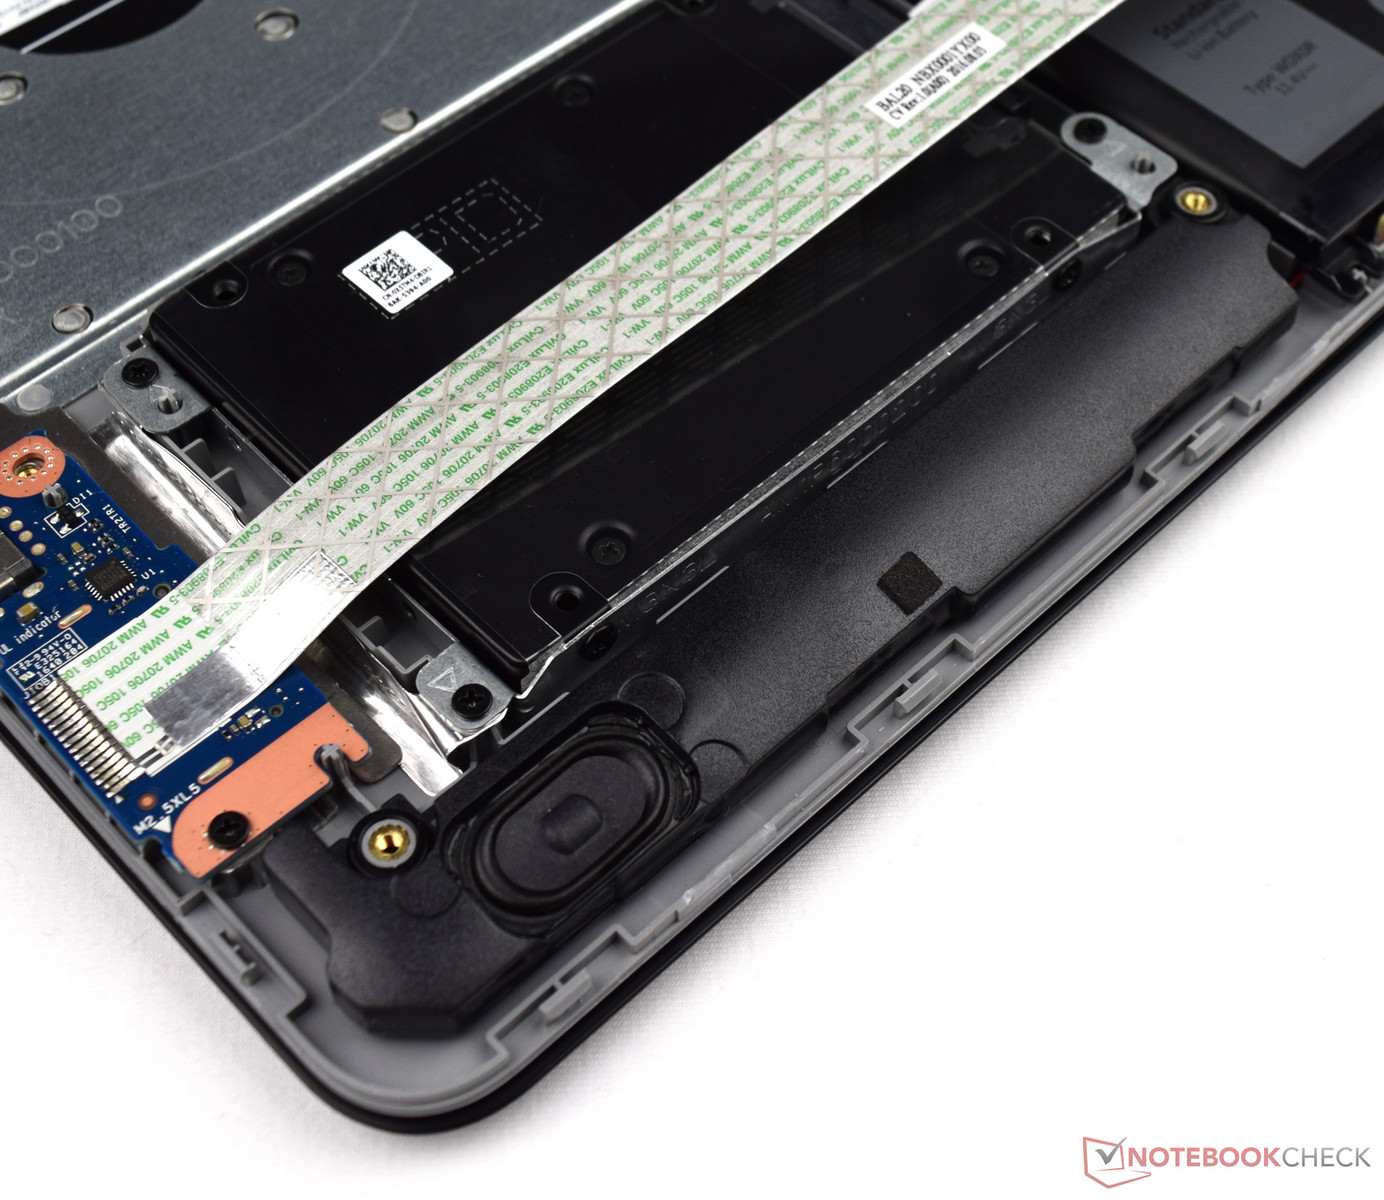
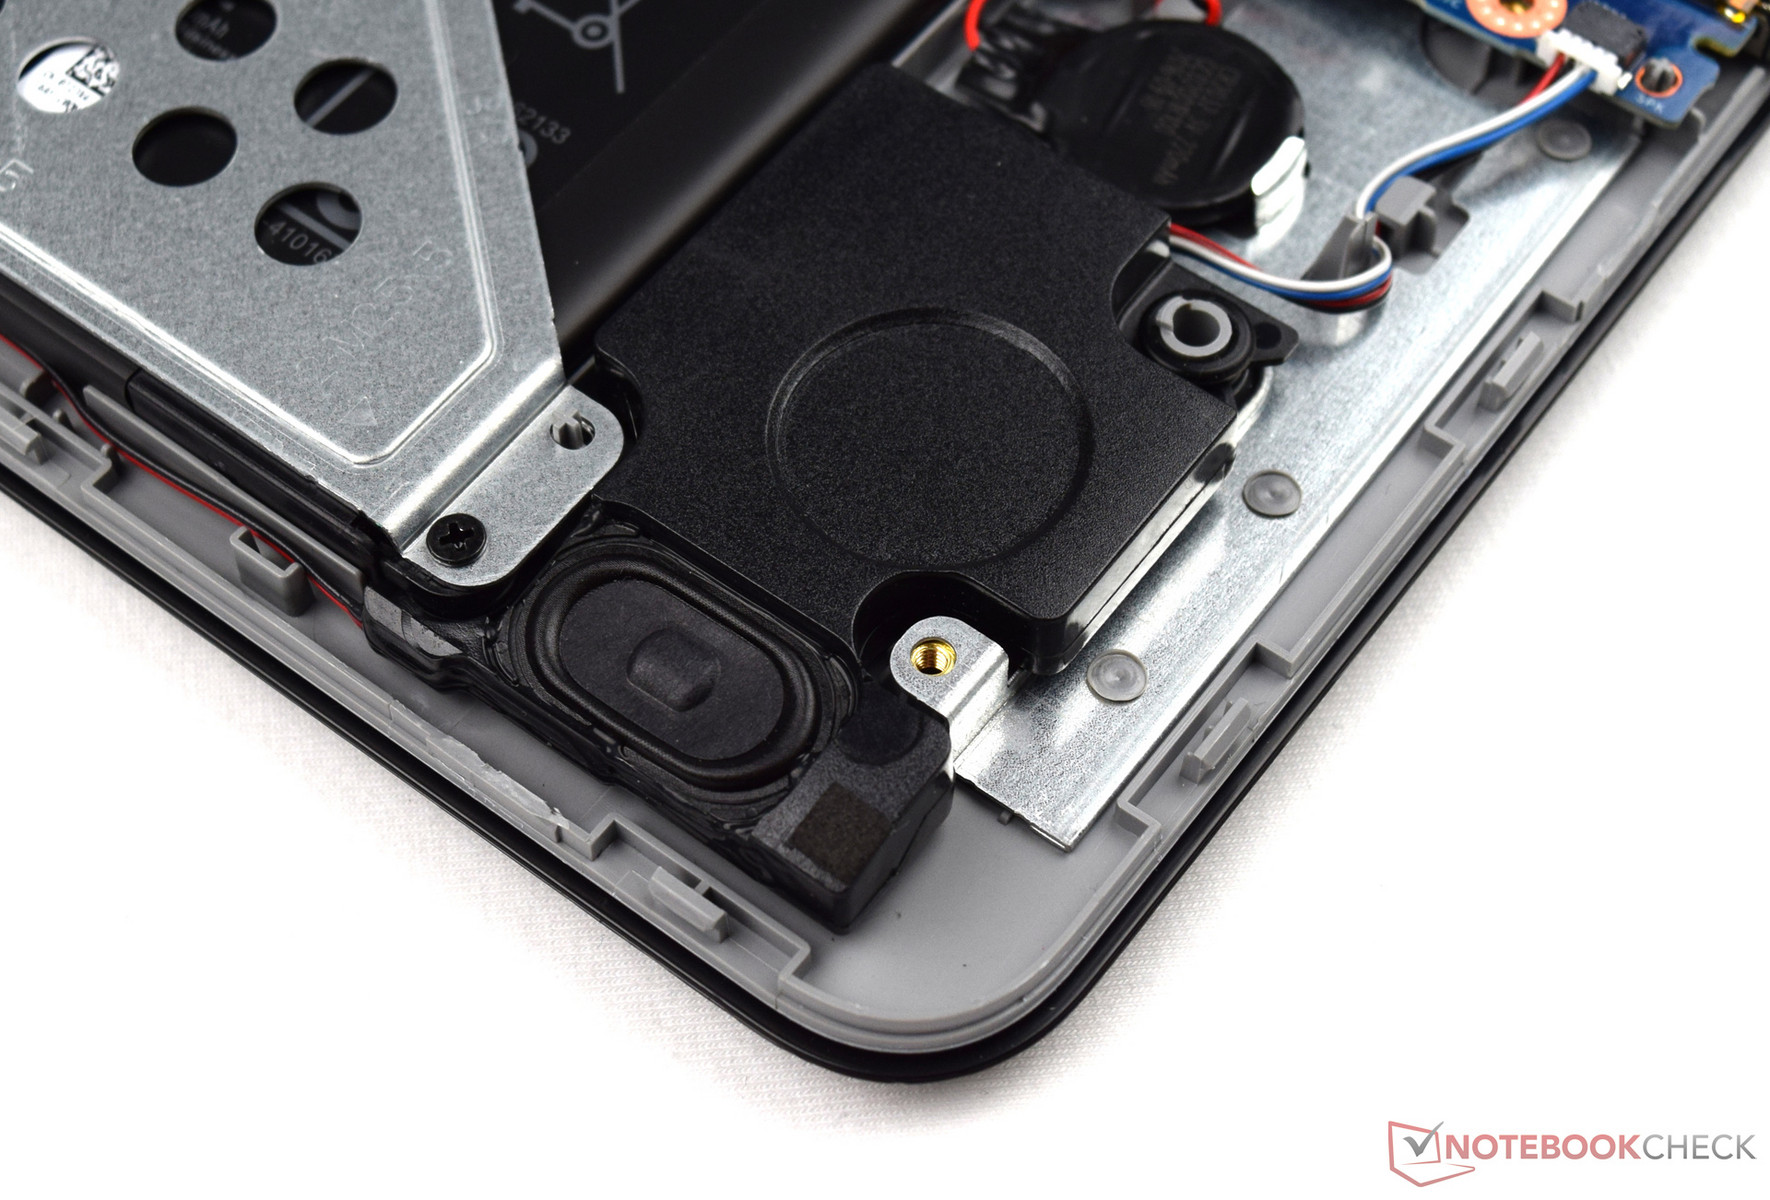
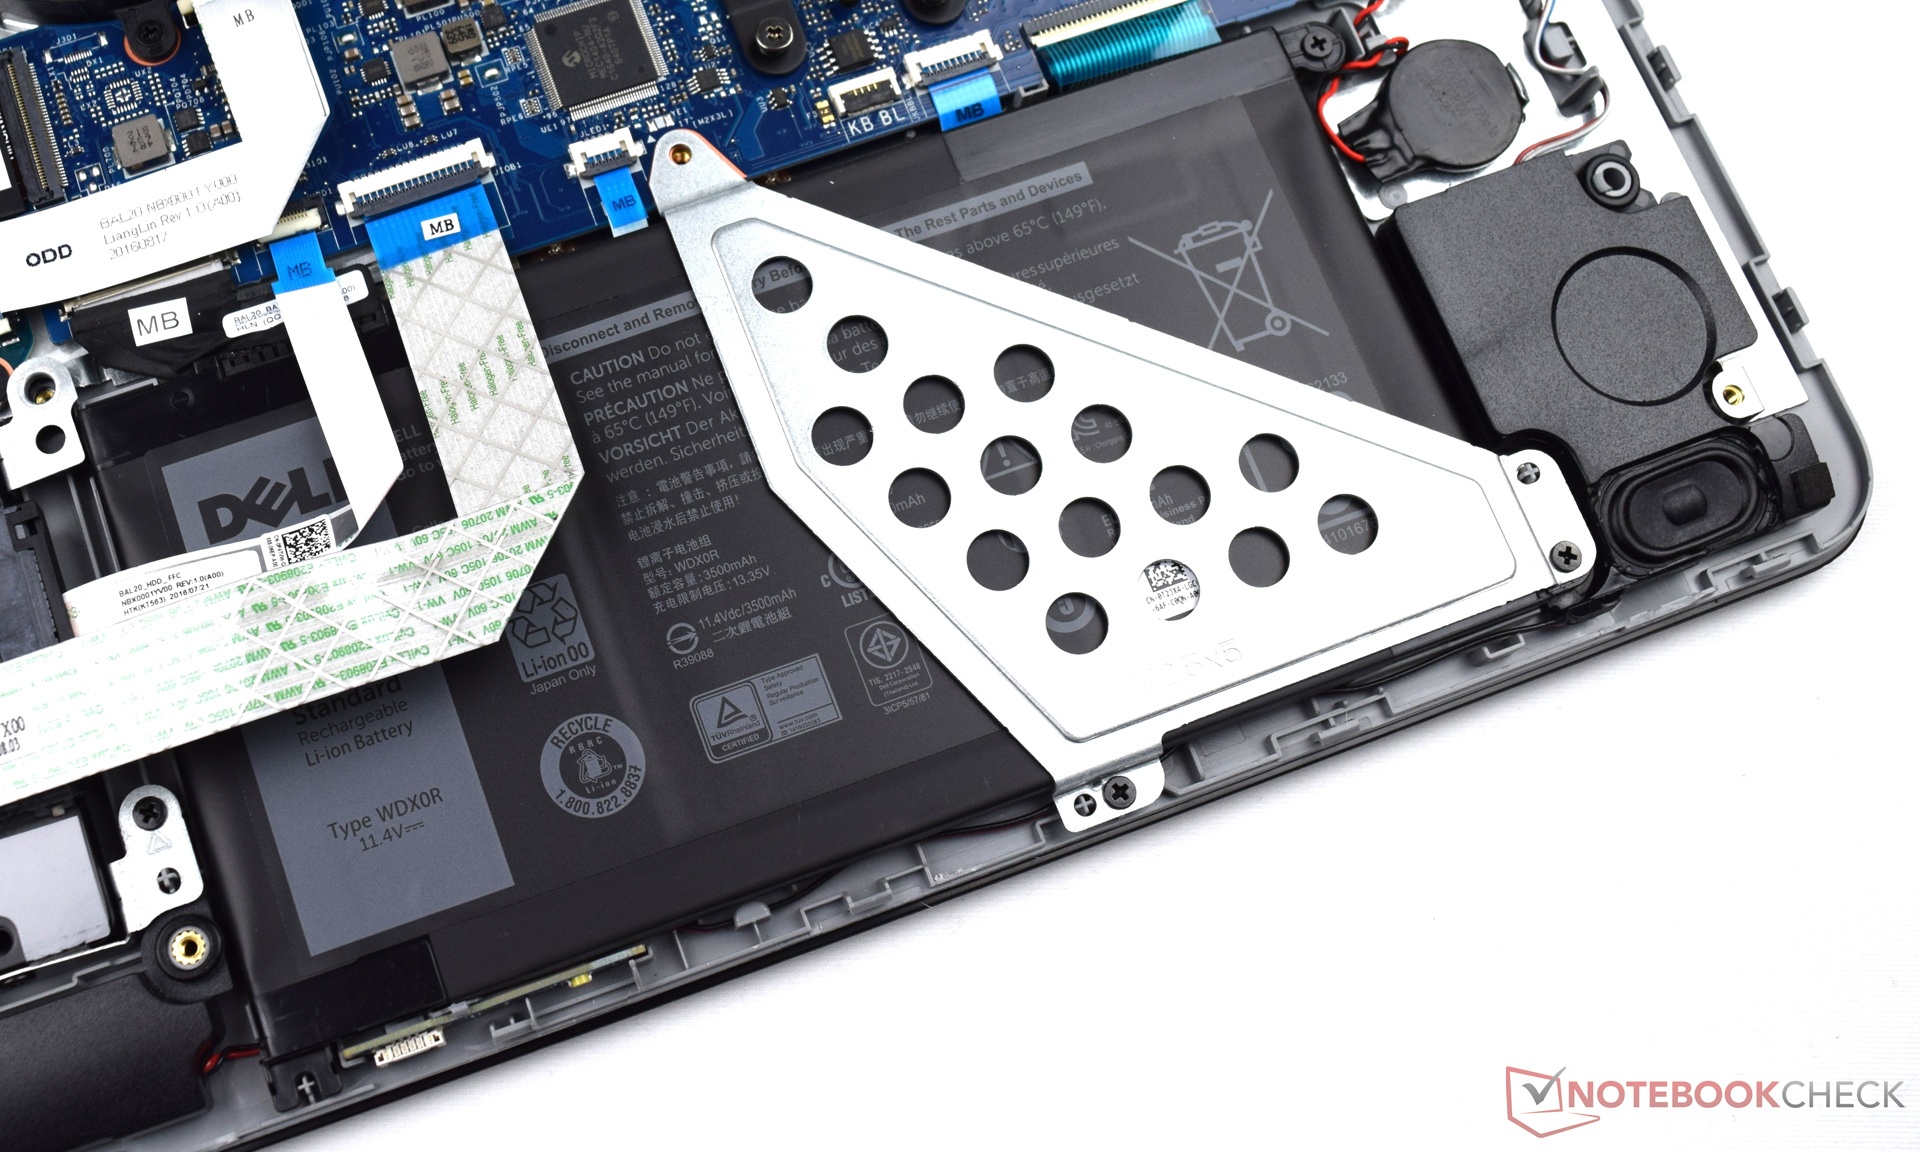
La scelta della soluzione di archiviazione dipende da quanto spazio avete bisogno. Avrete presto problemi se pensate di usare dei giochi, e potrebbe avere senso prendere un SSD più grande. Questo è possibile in quanto potete rimuovere il pannello inferiore, sebbene la procedura non sia semplicissima.
Nota: si tratta di una recensione breve, con alcune sezioni non tradotte, per la versione integrale in inglese guardate qui.
Dell Inspiron 15 5000 5567-1753
- 01/30/2017 v6 (old)
Sebastian Bade
Price comparison
