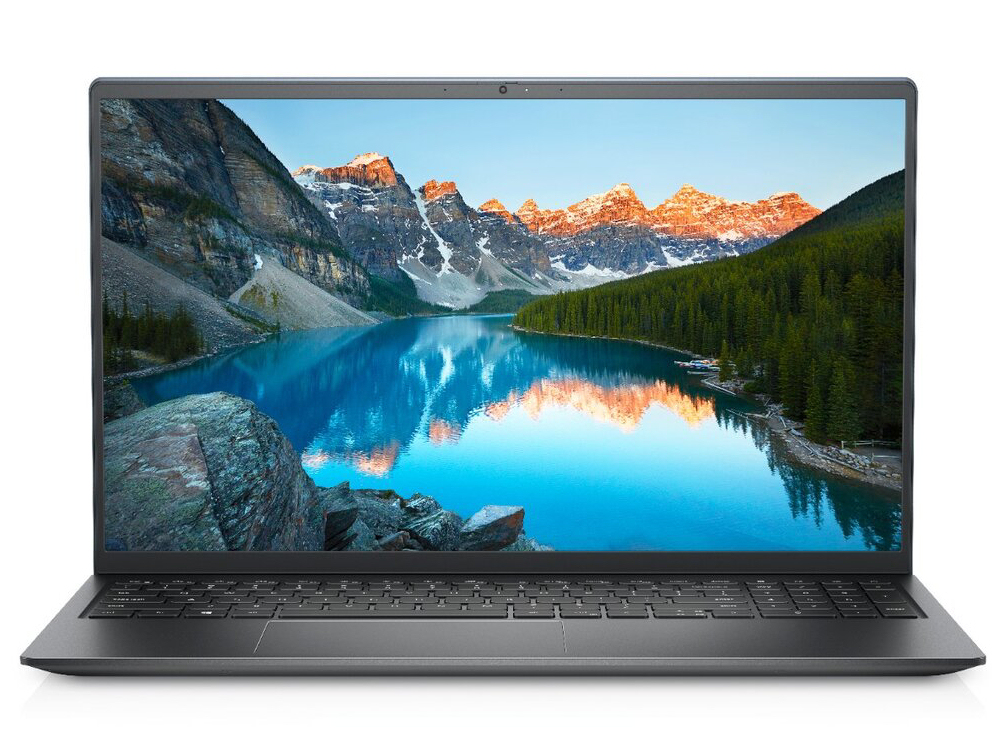
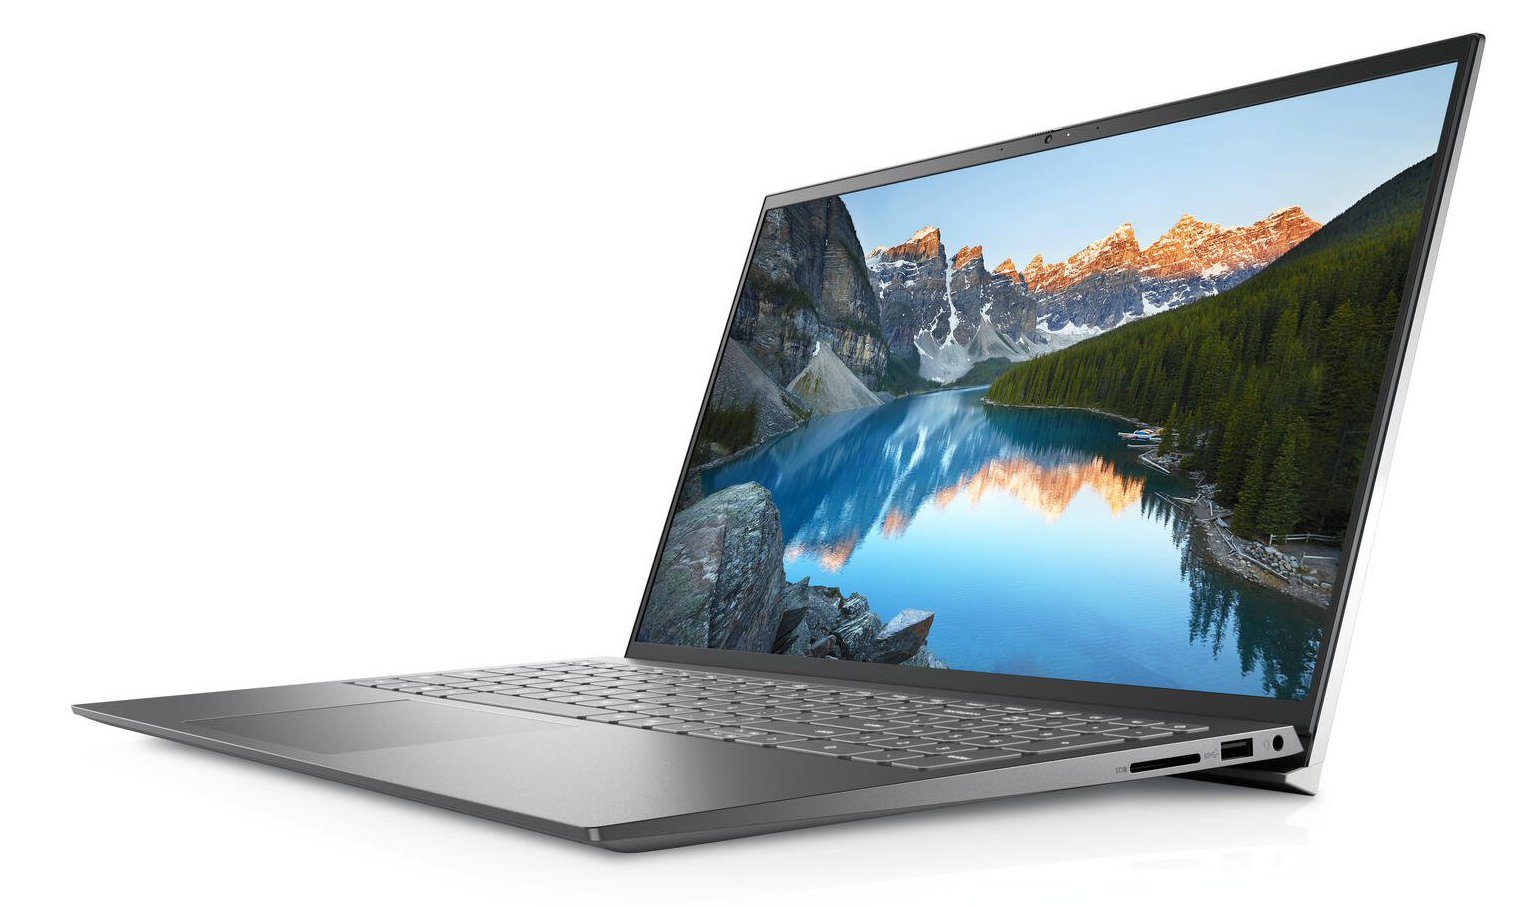
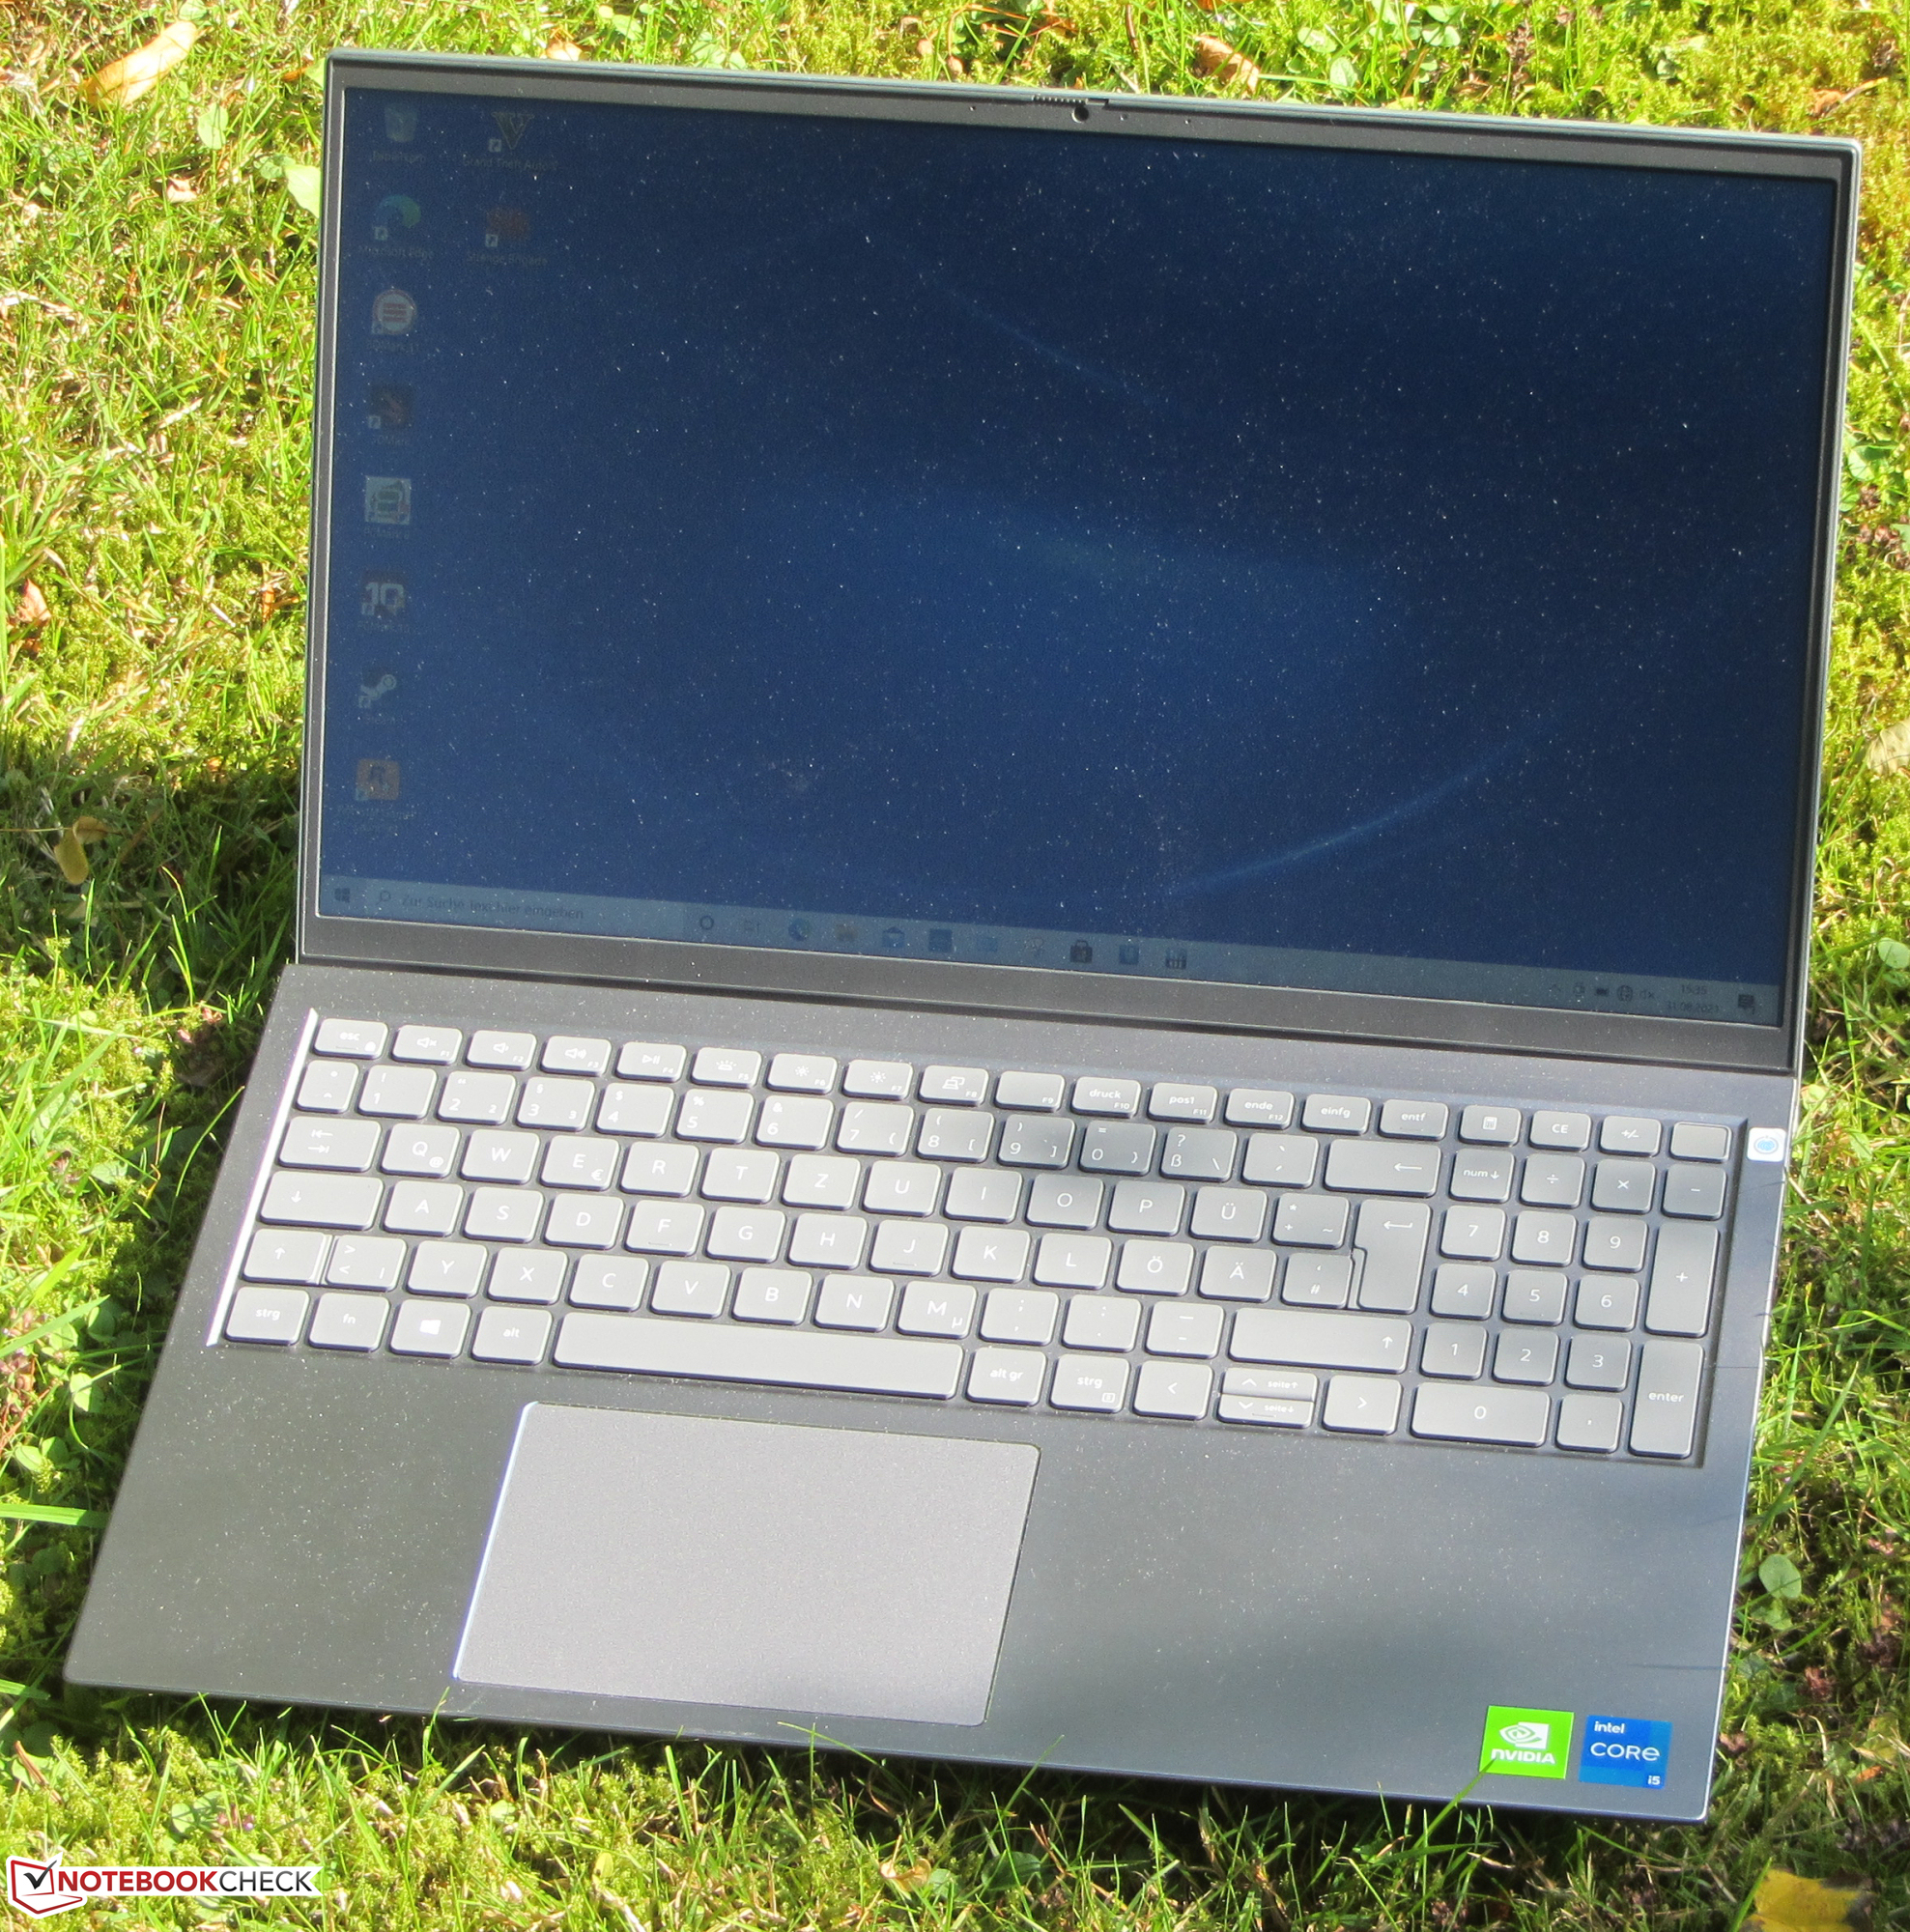
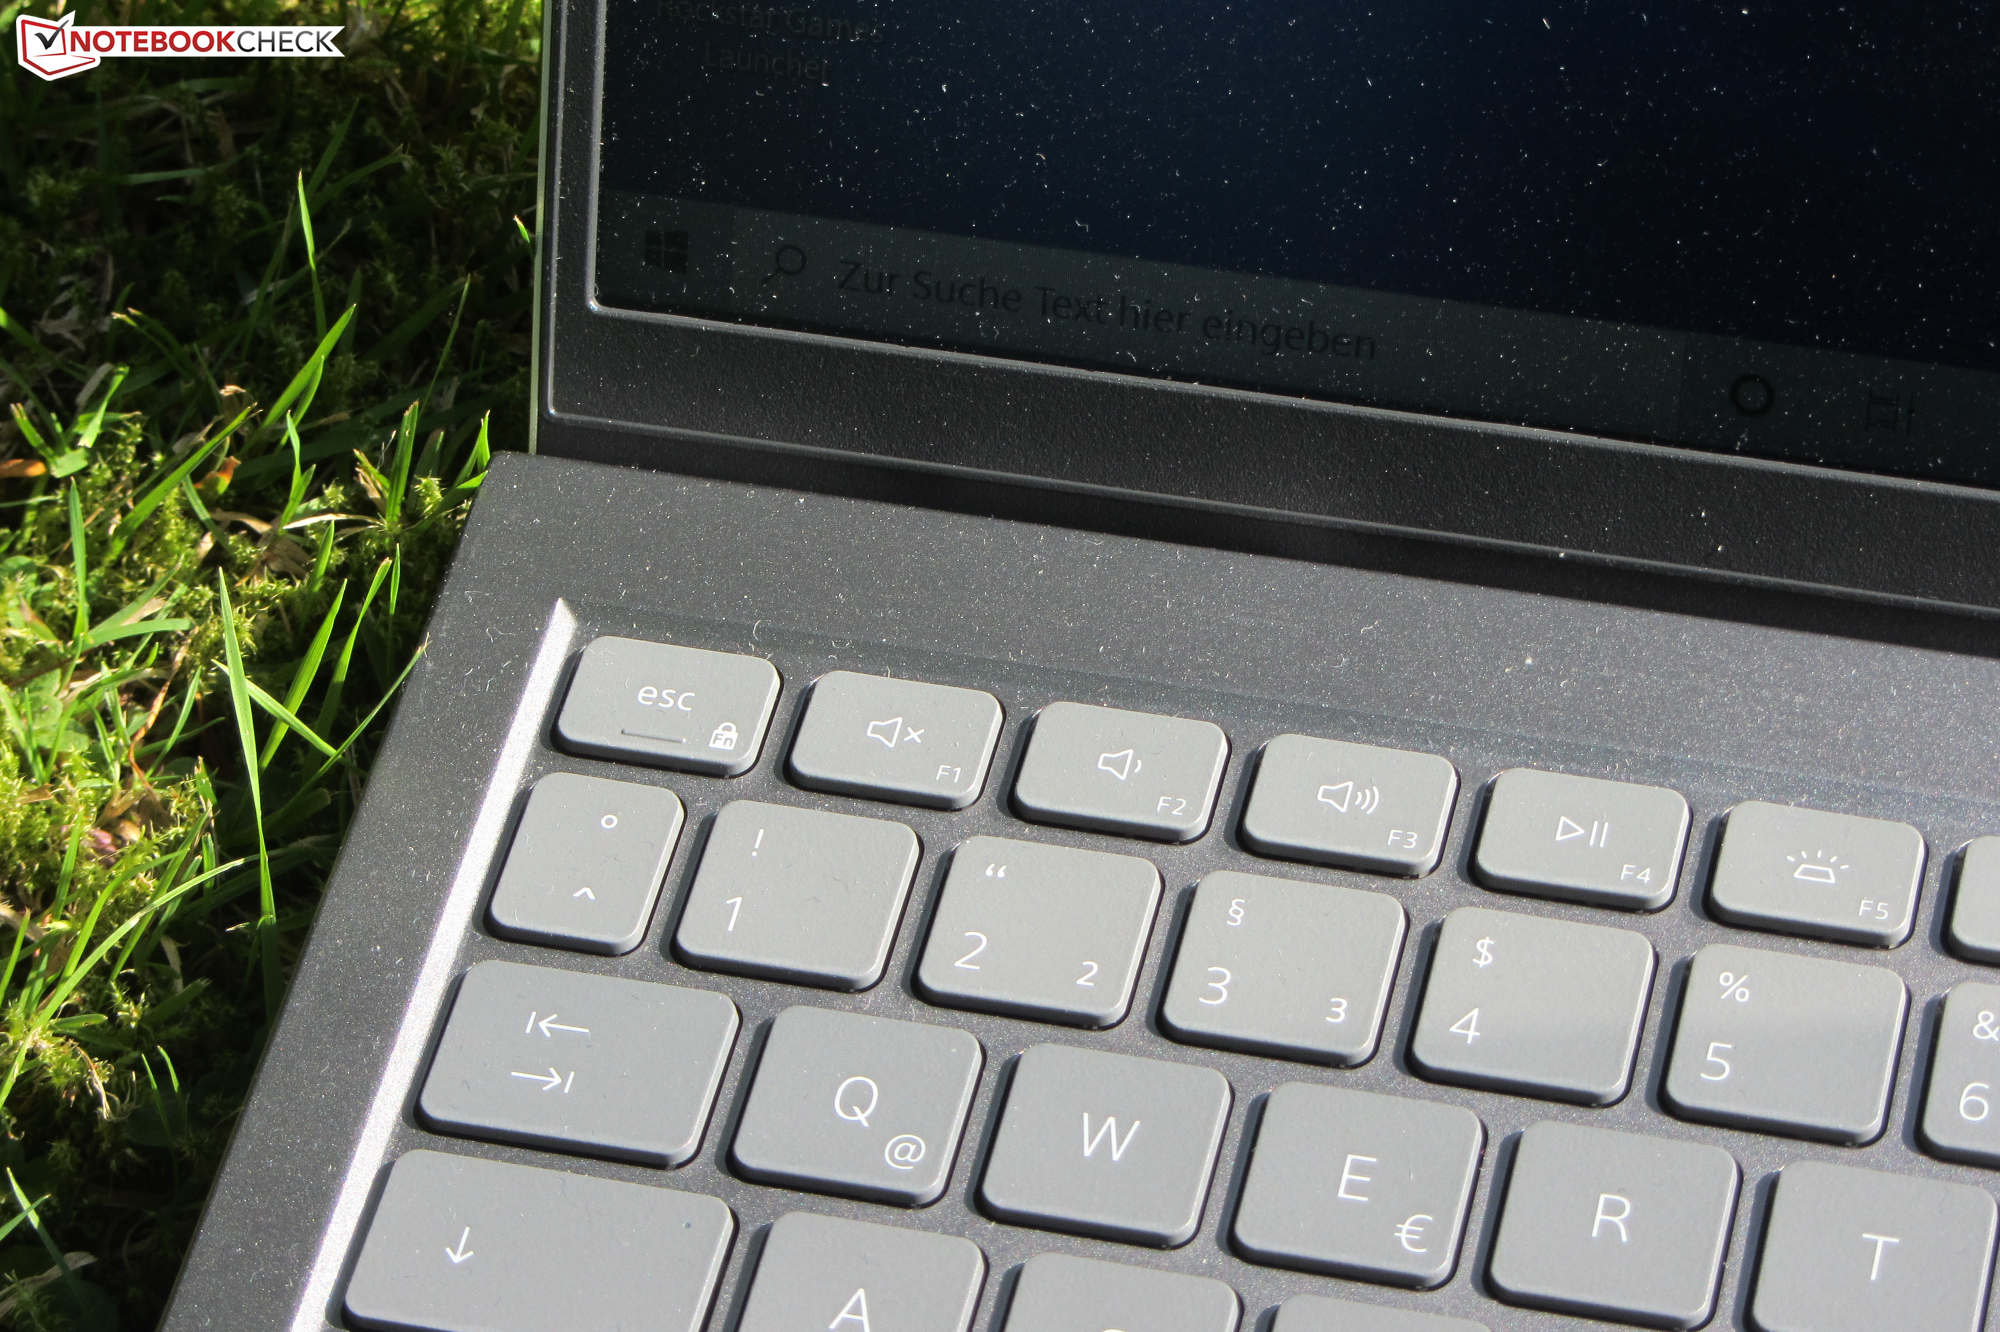
Recensione del Dell Inspiron 15 5518: La CPU è rallentata
Confronto con i potenziali concorrenti
Punteggio | Data | Modello | Peso | Altezza | Dimensione | Risoluzione | Prezzo |
|---|---|---|---|---|---|---|---|
| 82.3 % v7 (old) | 09/2021 | Dell Inspiron 15 5518-2X3JR i5-11300H, GeForce MX450 | 1.8 kg | 18 mm | 15.60" | 1920x1080 | |
| 81.2 % v7 (old) | 06/2021 | HP Pavilion 15-eg i7-1165G7, GeForce MX450 | 1.7 kg | 17.9 mm | 15.60" | 1920x1080 | |
| 83.2 % v7 (old) | 06/2021 | Xiaomi RedmiBook Pro 15 i7-11370H, GeForce MX450 | 1.7 kg | 16 mm | 15.60" | 3200x2000 | |
| 86 % v7 (old) | 08/2021 | Lenovo IdeaPad 5 Pro 16IHU6 i5-11300H, GeForce MX450 | 1.9 kg | 18.4 mm | 16.00" | 2560x1600 | |
| 82.1 % v7 (old) | 07/2021 | Asus VivoBook S15 D533UA R7 5700U, Vega 8 | 1.8 kg | 16.1 mm | 15.60" | 1920x1080 | |
| 83.5 % v7 (old) | 08/2021 | Lenovo IdeaPad 5 15ALC05 R5 5500U, Vega 7 | 1.7 kg | 19.1 mm | 15.60" | 1920x1080 |
Attrezzatura di connessione
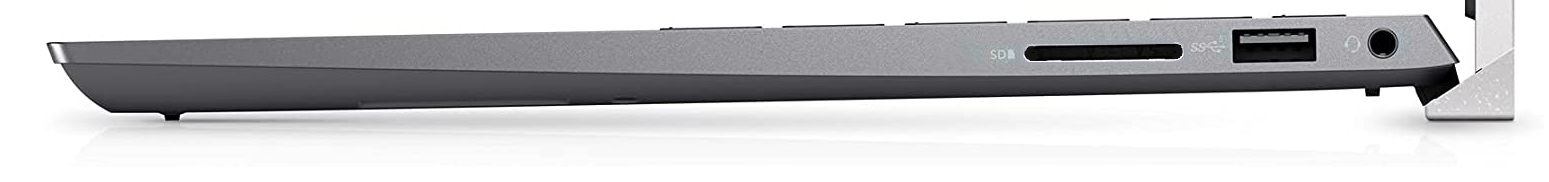
| SD Card Reader | |
| average JPG Copy Test (av. of 3 runs) | |
| HP Pavilion 15-eg (AV PRO microSD 128 GB V60) | |
| Media della classe Office (19.8 - 198.5, n=22, ultimi 2 anni) | |
| Asus VivoBook S15 D533UA (AV PRO microSD 128 GB V60) | |
| Lenovo IdeaPad 5 15ALC05 (Toshiba Exceria Pro SDXC 64 GB UHS-II) | |
| Dell Inspiron 15 5518-2X3JR (AV Pro SD 128 GB V60) | |
| maximum AS SSD Seq Read Test (1GB) | |
| Lenovo IdeaPad 5 Pro 16IHU6 (AV PRO microSD 128 GB V60) | |
| Media della classe Office (27.4 - 249, n=21, ultimi 2 anni) | |
| HP Pavilion 15-eg (AV PRO microSD 128 GB V60) | |
| Asus VivoBook S15 D533UA (AV PRO microSD 128 GB V60) | |
| Lenovo IdeaPad 5 15ALC05 (Toshiba Exceria Pro SDXC 64 GB UHS-II) | |
| Dell Inspiron 15 5518-2X3JR (AV Pro SD 128 GB V60) | |


| |||||||||||||||||||||||||
Distribuzione della luminosità: 87 %
Al centro con la batteria: 257 cd/m²
Contrasto: 1040:1 (Nero: 0.275 cd/m²)
ΔE ColorChecker Calman: 4.74 | ∀{0.5-29.43 Ø4.71}
ΔE Greyscale Calman: 1.57 | ∀{0.09-98 Ø4.96}
41.24% AdobeRGB 1998 (Argyll 3D)
58.8% sRGB (Argyll 3D)
39.92% Display P3 (Argyll 3D)
Gamma: 2.24
CCT: 6348 K
| Dell Inspiron 15 5518-2X3JR BOE NV15N4V, IPS, 1920x1080, 15.6" | HP Pavilion 15-eg Chi Mei CMN1523, IPS, 1920x1080, 15.6" | Xiaomi RedmiBook Pro 15 IPS, 3200x2000, 15.6" | Lenovo IdeaPad 5 Pro 16IHU6 Lenovo LEN160WQXGA, IPS, 2560x1600, 16" | Asus VivoBook S15 D533UA Chi Mei N156HCA-EAB, IPS, 1920x1080, 15.6" | Lenovo IdeaPad 5 15ALC05 Lenovo LEN156FHD, IPS, 1920x1080, 15.6" | |
|---|---|---|---|---|---|---|
| Display | 8% | 66% | 78% | 10% | -4% | |
| Display P3 Coverage (%) | 39.92 | 42.9 7% | 66.7 67% | 74 85% | 43.6 9% | |
| sRGB Coverage (%) | 58.8 | 64 9% | 96.3 64% | 98.7 68% | 65.2 11% | 59 0% |
| AdobeRGB 1998 Coverage (%) | 41.24 | 44.4 8% | 68.5 66% | 74.5 81% | 45 9% | 38 -8% |
| Response Times | 34% | 19% | 71% | 48% | 36% | |
| Response Time Grey 50% / Grey 80% * (ms) | 41 ? | 22.8 ? 44% | 34.8 ? 15% | 13 ? 68% | 18 ? 56% | 29 ? 29% |
| Response Time Black / White * (ms) | 31 ? | 23.6 ? 24% | 24 ? 23% | 8 ? 74% | 19 ? 39% | 18 ? 42% |
| PWM Frequency (Hz) | 1000 ? | 26320 ? | ||||
| Screen | -27% | -27% | 10% | -30% | -64% | |
| Brightness middle (cd/m²) | 286 | 294.3 3% | 312 9% | 356 24% | 289 1% | 376 31% |
| Brightness (cd/m²) | 268 | 251 -6% | 298 11% | 322 20% | 267 0% | 341 27% |
| Brightness Distribution (%) | 87 | 76 -13% | 87 0% | 80 -8% | 85 -2% | 78 -10% |
| Black Level * (cd/m²) | 0.275 | 0.26 5% | 0.18 35% | 0.27 2% | 0.56 -104% | 0.66 -140% |
| Contrast (:1) | 1040 | 1132 9% | 1733 67% | 1319 27% | 516 -50% | 570 -45% |
| Colorchecker dE 2000 * | 4.74 | 4.08 14% | 5.39 -14% | 2.4 49% | 3.96 16% | 6.4 -35% |
| Colorchecker dE 2000 max. * | 8.27 | 19.49 -136% | 9.95 -20% | 4.42 47% | 6.76 18% | 20.45 -147% |
| Greyscale dE 2000 * | 1.57 | 3 -91% | 6.3 -301% | 2.81 -79% | 3.43 -118% | 4.59 -192% |
| Gamma | 2.24 98% | 2.21 100% | 2.192 100% | 2.4 92% | 2.28 96% | 2.26 97% |
| CCT | 6348 102% | 6616 98% | 7473 87% | 6294 103% | 7191 90% | 6819 95% |
| Colorchecker dE 2000 calibrated * | 3.7 | 3.15 | ||||
| Color Space (Percent of AdobeRGB 1998) (%) | 69 | 42 | 38 | |||
| Color Space (Percent of sRGB) (%) | 96 | 65 | 59 | |||
| Media totale (Programma / Settaggio) | 5% /
-9% | 19% /
2% | 53% /
35% | 9% /
-9% | -11% /
-37% |
* ... Meglio usare valori piccoli
Tempi di risposta del Display
| ↔ Tempi di risposta dal Nero al Bianco | ||
|---|---|---|
| 31 ms ... aumenta ↗ e diminuisce ↘ combinato | ↗ 17 ms Incremento |  |
| ↘ 14 ms Calo | ||
| Lo schermo mostra tempi di risposta lenti nei nostri tests e sarà insoddisfacente per i gamers. In confronto, tutti i dispositivi di test variano da 0.1 (minimo) a 240 (massimo) ms. » 84 % di tutti i dispositivi è migliore. Questo significa che i tempi di risposta rilevati sono peggiori rispetto alla media di tutti i dispositivi testati (19.8 ms). | ||
| ↔ Tempo di risposta dal 50% Grigio all'80% Grigio | ||
| 41 ms ... aumenta ↗ e diminuisce ↘ combinato | ↗ 21 ms Incremento |  |
| ↘ 20 ms Calo | ||
| Lo schermo mostra tempi di risposta lenti nei nostri tests e sarà insoddisfacente per i gamers. In confronto, tutti i dispositivi di test variano da 0.165 (minimo) a 636 (massimo) ms. » 65 % di tutti i dispositivi è migliore. Questo significa che i tempi di risposta rilevati sono peggiori rispetto alla media di tutti i dispositivi testati (31 ms). | ||
Sfarfallio dello schermo / PWM (Pulse-Width Modulation)
| flickering dello schermo / PWM rilevato | 1000 Hz | ≤ 90 % settaggio luminosita' |  |
Il display sfarfalla a 1000 Hz (Probabilmente a causa dell'uso di PWM) Flickering rilevato ad una luminosita' di 90 % o inferiore. Non dovrebbe verificarsi flickering o PWM sopra questo valore di luminosita'. La frequenza di 1000 Hz è abbastanza alta, quindi la maggioranza degli utenti sensibili al PWM non dovrebbero notare alcun flickering. In confronto: 52 % di tutti i dispositivi testati non utilizza PWM per ridurre la luminosita' del display. Se è rilevato PWM, una media di 7757 (minimo: 5 - massimo: 343500) Hz è stata rilevata. | |||
Cinebench R15 Multi Endurance test
| Cinebench R23 | |
| Single Core | |
| Media della classe Office (708 - 2130, n=76, ultimi 2 anni) | |
| Xiaomi RedmiBook Pro 15 | |
| HP Pavilion 15-eg | |
| Lenovo IdeaPad 5 Pro 16IHU6 | |
| Dell Inspiron 15 5518-2X3JR (Ultra-Leistung) | |
| Media Intel Core i5-11300H (1218 - 1431, n=11) | |
| Dell Inspiron 15 5518-2X3JR | |
| Asus VivoBook S15 D533UA | |
| Lenovo IdeaPad 5 15ALC05 | |
| Multi Core | |
| Media della classe Office (1673 - 22808, n=76, ultimi 2 anni) | |
| Asus VivoBook S15 D533UA | |
| Lenovo IdeaPad 5 15ALC05 | |
| Lenovo IdeaPad 5 Pro 16IHU6 | |
| Xiaomi RedmiBook Pro 15 | |
| Xiaomi RedmiBook Pro 15 | |
| Media Intel Core i5-11300H (3313 - 6581, n=10) | |
| HP Pavilion 15-eg | |
| Dell Inspiron 15 5518-2X3JR (Ultra-Leistung) | |
| Dell Inspiron 15 5518-2X3JR | |
| Cinebench R20 | |
| CPU (Single Core) | |
| Media della classe Office (345 - 816, n=75, ultimi 2 anni) | |
| Xiaomi RedmiBook Pro 15 | |
| HP Pavilion 15-eg | |
| Lenovo IdeaPad 5 Pro 16IHU6 | |
| Dell Inspiron 15 5518-2X3JR (Ultra-Leistung) | |
| Dell Inspiron 15 5518-2X3JR | |
| Media Intel Core i5-11300H (431 - 548, n=11) | |
| Asus VivoBook S15 D533UA | |
| Lenovo IdeaPad 5 15ALC05 | |
| CPU (Multi Core) | |
| Media della classe Office (648 - 8840, n=75, ultimi 2 anni) | |
| Asus VivoBook S15 D533UA | |
| Lenovo IdeaPad 5 15ALC05 | |
| Lenovo IdeaPad 5 Pro 16IHU6 | |
| Xiaomi RedmiBook Pro 15 | |
| Media Intel Core i5-11300H (1300 - 2533, n=10) | |
| Dell Inspiron 15 5518-2X3JR | |
| HP Pavilion 15-eg | |
| Dell Inspiron 15 5518-2X3JR (Ultra-Leistung) | |
| Cinebench R15 | |
| CPU Single 64Bit | |
| Media della classe Office (99.5 - 316, n=77, ultimi 2 anni) | |
| Xiaomi RedmiBook Pro 15 | |
| Xiaomi RedmiBook Pro 15 | |
| HP Pavilion 15-eg | |
| Asus VivoBook S15 D533UA | |
| Lenovo IdeaPad 5 15ALC05 | |
| Lenovo IdeaPad 5 Pro 16IHU6 | |
| Media Intel Core i5-11300H (123 - 211, n=8) | |
| Dell Inspiron 15 5518-2X3JR | |
| CPU Multi 64Bit | |
| Media della classe Office (250 - 3380, n=77, ultimi 2 anni) | |
| Asus VivoBook S15 D533UA | |
| Lenovo IdeaPad 5 15ALC05 | |
| Xiaomi RedmiBook Pro 15 (Variable PL1 ) | |
| Xiaomi RedmiBook Pro 15 (Pl1 @ 25W) | |
| Xiaomi RedmiBook Pro 15 (PL1 fixed @ 28W) | |
| Lenovo IdeaPad 5 Pro 16IHU6 | |
| Media Intel Core i5-11300H (632 - 990, n=11) | |
| Dell Inspiron 15 5518-2X3JR (Ultra-Leistung) | |
| Dell Inspiron 15 5518-2X3JR | |
| HP Pavilion 15-eg | |
| Blender - v2.79 BMW27 CPU | |
| Dell Inspiron 15 5518-2X3JR | |
| Dell Inspiron 15 5518-2X3JR (Ultra-Leistung) | |
| HP Pavilion 15-eg | |
| Media Intel Core i5-11300H (466 - 862, n=10) | |
| Lenovo IdeaPad 5 Pro 16IHU6 | |
| Xiaomi RedmiBook Pro 15 | |
| Lenovo IdeaPad 5 15ALC05 | |
| Media della classe Office (158 - 1940, n=76, ultimi 2 anni) | |
| Asus VivoBook S15 D533UA | |
| 7-Zip 18.03 | |
| 7z b 4 -mmt1 | |
| Media della classe Office (3387 - 6469, n=77, ultimi 2 anni) | |
| HP Pavilion 15-eg | |
| Xiaomi RedmiBook Pro 15 | |
| Lenovo IdeaPad 5 Pro 16IHU6 | |
| Dell Inspiron 15 5518-2X3JR | |
| Dell Inspiron 15 5518-2X3JR (Ultra-Leistung) | |
| Media Intel Core i5-11300H (4603 - 4969, n=10) | |
| Asus VivoBook S15 D533UA | |
| Lenovo IdeaPad 5 15ALC05 | |
| 7z b 4 | |
| Media della classe Office (7098 - 76886, n=77, ultimi 2 anni) | |
| Asus VivoBook S15 D533UA | |
| Lenovo IdeaPad 5 15ALC05 | |
| Xiaomi RedmiBook Pro 15 | |
| Lenovo IdeaPad 5 Pro 16IHU6 | |
| Media Intel Core i5-11300H (17573 - 26001, n=10) | |
| HP Pavilion 15-eg | |
| Dell Inspiron 15 5518-2X3JR (Ultra-Leistung) | |
| Dell Inspiron 15 5518-2X3JR | |
| Geekbench 5.5 | |
| Single-Core | |
| Media della classe Office (811 - 2175, n=73, ultimi 2 anni) | |
| Xiaomi RedmiBook Pro 15 | |
| Lenovo IdeaPad 5 Pro 16IHU6 | |
| Media Intel Core i5-11300H (1342 - 1462, n=10) | |
| Dell Inspiron 15 5518-2X3JR (Ultra-Leistung) | |
| Dell Inspiron 15 5518-2X3JR | |
| Asus VivoBook S15 D533UA | |
| Lenovo IdeaPad 5 15ALC05 | |
| Multi-Core | |
| Media della classe Office (1483 - 16999, n=73, ultimi 2 anni) | |
| Asus VivoBook S15 D533UA | |
| Lenovo IdeaPad 5 15ALC05 | |
| Xiaomi RedmiBook Pro 15 | |
| Lenovo IdeaPad 5 Pro 16IHU6 | |
| Media Intel Core i5-11300H (3631 - 5499, n=10) | |
| Dell Inspiron 15 5518-2X3JR (Ultra-Leistung) | |
| Dell Inspiron 15 5518-2X3JR | |
| HWBOT x265 Benchmark v2.2 - 4k Preset | |
| Media della classe Office (2.21 - 26, n=76, ultimi 2 anni) | |
| Asus VivoBook S15 D533UA | |
| Lenovo IdeaPad 5 15ALC05 | |
| Lenovo IdeaPad 5 Pro 16IHU6 | |
| Media Intel Core i5-11300H (4.32 - 8.38, n=10) | |
| Xiaomi RedmiBook Pro 15 | |
| HP Pavilion 15-eg | |
| Dell Inspiron 15 5518-2X3JR (Ultra-Leistung) | |
| Dell Inspiron 15 5518-2X3JR | |
| LibreOffice - 20 Documents To PDF | |
| Lenovo IdeaPad 5 15ALC05 | |
| Asus VivoBook S15 D533UA | |
| Media della classe Office (39.9 - 102.3, n=76, ultimi 2 anni) | |
| Lenovo IdeaPad 5 Pro 16IHU6 | |
| Media Intel Core i5-11300H (43.6 - 59.4, n=10) | |
| Xiaomi RedmiBook Pro 15 | |
| Dell Inspiron 15 5518-2X3JR | |
| HP Pavilion 15-eg | |
| Dell Inspiron 15 5518-2X3JR (Ultra-Leistung) | |
| R Benchmark 2.5 - Overall mean | |
| Lenovo IdeaPad 5 15ALC05 | |
| Dell Inspiron 15 5518-2X3JR (Ultra-Leistung) | |
| Dell Inspiron 15 5518-2X3JR | |
| Media Intel Core i5-11300H (0.6 - 0.644, n=10) | |
| Lenovo IdeaPad 5 Pro 16IHU6 | |
| Asus VivoBook S15 D533UA | |
| HP Pavilion 15-eg | |
| Xiaomi RedmiBook Pro 15 | |
| Media della classe Office (0.393 - 0.888, n=76, ultimi 2 anni) | |
* ... Meglio usare valori piccoli
| PCMark 10 Score | 4899 punti | |
Aiuto | ||
| PCMark 10 / Score | |
| Media della classe Office (2601 - 9298, n=68, ultimi 2 anni) | |
| HP Pavilion 15-eg | |
| Xiaomi RedmiBook Pro 15 | |
| Asus VivoBook S15 D533UA | |
| Lenovo IdeaPad 5 Pro 16IHU6 | |
| Lenovo IdeaPad 5 15ALC05 | |
| Media Intel Core i5-11300H, NVIDIA GeForce MX450 (4899 - 5391, n=3) | |
| Dell Inspiron 15 5518-2X3JR | |
| PCMark 10 / Essentials | |
| Media della classe Office (3245 - 11594, n=68, ultimi 2 anni) | |
| HP Pavilion 15-eg | |
| Asus VivoBook S15 D533UA | |
| Lenovo IdeaPad 5 15ALC05 | |
| Lenovo IdeaPad 5 Pro 16IHU6 | |
| Media Intel Core i5-11300H, NVIDIA GeForce MX450 (8366 - 8931, n=3) | |
| Xiaomi RedmiBook Pro 15 | |
| Dell Inspiron 15 5518-2X3JR | |
| PCMark 10 / Productivity | |
| Media della classe Office (5336 - 17243, n=68, ultimi 2 anni) | |
| Xiaomi RedmiBook Pro 15 | |
| HP Pavilion 15-eg | |
| Media Intel Core i5-11300H, NVIDIA GeForce MX450 (8292 - 9188, n=3) | |
| Lenovo IdeaPad 5 Pro 16IHU6 | |
| Dell Inspiron 15 5518-2X3JR | |
| Asus VivoBook S15 D533UA | |
| Lenovo IdeaPad 5 15ALC05 | |
| PCMark 10 / Digital Content Creation | |
| Media della classe Office (2049 - 13541, n=68, ultimi 2 anni) | |
| Xiaomi RedmiBook Pro 15 | |
| HP Pavilion 15-eg | |
| Asus VivoBook S15 D533UA | |
| Lenovo IdeaPad 5 Pro 16IHU6 | |
| Lenovo IdeaPad 5 15ALC05 | |
| Media Intel Core i5-11300H, NVIDIA GeForce MX450 (4600 - 5388, n=3) | |
| Dell Inspiron 15 5518-2X3JR | |
| DPC Latencies / LatencyMon - interrupt to process latency (max), Web, Youtube, Prime95 | |
| Xiaomi RedmiBook Pro 15 | |
| HP Pavilion 15-eg | |
| Dell Inspiron 15 5518-2X3JR | |
| Lenovo IdeaPad 5 15ALC05 | |
| Lenovo IdeaPad 5 Pro 16IHU6 | |
| Asus VivoBook S15 D533UA | |
* ... Meglio usare valori piccoli

| Dell Inspiron 15 5518-2X3JR Toshiba KBG40ZNS512G NVMe | HP Pavilion 15-eg Samsung PM991 MZVLQ1T0HALB | Xiaomi RedmiBook Pro 15 Toshiba KBG40ZNV512G | Lenovo IdeaPad 5 Pro 16IHU6 Samsung SSD PM981a MZVLB512HBJQ | Asus VivoBook S15 D533UA WDC PC SN530 SDBPNPZ-1T00 | Lenovo IdeaPad 5 15ALC05 | Media Toshiba KBG40ZNS512G NVMe | Media della classe Office | |
|---|---|---|---|---|---|---|---|---|
| CrystalDiskMark 5.2 / 6 | -16% | -12% | 27% | -5% | -21% | -23% | 55% | |
| Write 4K (MB/s) | 207.3 | 141.6 -32% | 136 -34% | 203 -2% | 116.8 -44% | 82.7 -60% | 126.4 ? -39% | 153.2 ? -26% |
| Read 4K (MB/s) | 61.3 | 42.61 -30% | 60.4 -1% | 52.3 -15% | 43.92 -28% | 39.96 -35% | 50 ? -18% | 73.4 ? 20% |
| Write Seq (MB/s) | 1499 | 1337 -11% | 1447 -3% | 2138 43% | 1990 33% | 1273 -15% | 1207 ? -19% | 2531 ? 69% |
| Read Seq (MB/s) | 1858 | 1575 -15% | 1507 -19% | 1974 6% | 1959 5% | 1601 -14% | 1567 ? -16% | 3292 ? 77% |
| Write 4K Q32T1 (MB/s) | 510 | 397.8 -22% | 235.6 -54% | 640 25% | 373.3 -27% | 360.4 -29% | 347 ? -32% | 431 ? -15% |
| Read 4K Q32T1 (MB/s) | 640 | 454.2 -29% | 737 15% | 707 10% | 524 -18% | 410.4 -36% | 425 ? -34% | 516 ? -19% |
| Write Seq Q32T1 (MB/s) | 1521 | 1648 8% | 1529 1% | 2973 95% | 1985 31% | 1589 4% | 1224 ? -20% | 4178 ? 175% |
| Read Seq Q32T1 (MB/s) | 2316 | 2388 3% | 2357 2% | 3559 54% | 2456 6% | 2652 15% | 2278 ? -2% | 6043 ? 161% |
| AS SSD | 35% | -7% | 86% | 43% | 30% | -10% | 85% | |
| Seq Read (MB/s) | 2086 | 2030 -3% | 1972 -5% | 2541 22% | 2082 0% | 2549 22% | 1871 ? -10% | 4326 ? 107% |
| Seq Write (MB/s) | 1124 | 1003 -11% | 981 -13% | 2555 127% | 1844 64% | 1571 40% | 810 ? -28% | 2771 ? 147% |
| 4K Read (MB/s) | 54.1 | 46.74 -14% | 55.8 3% | 56 4% | 44.33 -18% | 41.92 -23% | 45.8 ? -15% | 58.1 ? 7% |
| 4K Write (MB/s) | 138.1 | 164.2 19% | 133.5 -3% | 129.6 -6% | 157.5 14% | 110.3 -20% | 110.9 ? -20% | 162.6 ? 18% |
| 4K-64 Read (MB/s) | 1295 | 1098 -15% | 1277 -1% | 1633 26% | 1039 -20% | 1086 -16% | 997 ? -23% | 958 ? -26% |
| 4K-64 Write (MB/s) | 750 | 891 19% | 313.9 -58% | 1863 148% | 1556 107% | 1083 44% | 452 ? -40% | 1643 ? 119% |
| Access Time Read * (ms) | 0.141 | 0.053 62% | 0.15 -6% | 0.077 45% | 0.05 65% | 0.119 16% | 0.1024 ? 27% | 0.08448 ? 40% |
| Access Time Write * (ms) | 0.169 | 0.062 63% | 0.513 -204% | 0.029 83% | 0.065 62% | 0.034 80% | 0.4026 ? -138% | 0.05931 ? 65% |
| Score Read (Points) | 1558 | 1348 -13% | 1530 -2% | 1944 25% | 1292 -17% | 1383 -11% | 1232 ? -21% | 1449 ? -7% |
| Score Write (Points) | 1001 | 1155 15% | 546 -45% | 2248 125% | 1898 90% | 1351 35% | 644 ? -36% | 2083 ? 108% |
| Score Total (Points) | 3316 | 3149 -5% | 2819 -15% | 5192 57% | 3845 16% | 3398 2% | 2461 ? -26% | 4207 ? 27% |
| Copy ISO MB/s (MB/s) | 678 | 1583 133% | 1105 63% | 2246 231% | 1441 113% | 1286 90% | 1785 ? 163% | 2541 ? 275% |
| Copy Program MB/s (MB/s) | 364.8 | 682 87% | 799 119% | 861 136% | 484.9 33% | 574 57% | 388 ? 6% | 790 ? 117% |
| Copy Game MB/s (MB/s) | 557 | 1428 156% | 957 72% | 1552 179% | 1098 97% | 1133 103% | 715 ? 28% | 1627 ? 192% |
| Media totale (Programma / Settaggio) | 10% /
17% | -10% /
-9% | 57% /
64% | 19% /
26% | 5% /
11% | -17% /
-14% | 70% /
74% |
* ... Meglio usare valori piccoli
Carico di lettura continuo: DiskSpd Read Loop, Queue Depth 8
| 3DMark 11 Performance | 7524 punti | |
| 3DMark Ice Storm Standard Score | 55566 punti | |
| 3DMark Cloud Gate Standard Score | 14683 punti | |
| 3DMark Fire Strike Score | 4287 punti | |
| 3DMark Time Spy Score | 2030 punti | |
Aiuto | ||
| 3DMark 11 - 1280x720 Performance GPU | |
| Lenovo IdeaPad 5 Pro 16IHU6 | |
| Dell Inspiron 15 5518-2X3JR (Ultra-Leistung) | |
| Dell Inspiron 15 5518-2X3JR | |
| Media della classe Office (2551 - 18313, n=72, ultimi 2 anni) | |
| HP Pavilion 15-eg | |
| Media NVIDIA GeForce MX450 (6341 - 9580, n=16) | |
| Xiaomi RedmiBook Pro 15 | |
| Asus VivoBook S15 D533UA | |
| Lenovo IdeaPad 5 15ALC05 | |
| 3DMark | |
| 1920x1080 Fire Strike Graphics | |
| Media della classe Office (736 - 21871, n=75, ultimi 2 anni) | |
| Lenovo IdeaPad 5 Pro 16IHU6 | |
| Media NVIDIA GeForce MX450 (4336 - 5753, n=17) | |
| Dell Inspiron 15 5518-2X3JR | |
| HP Pavilion 15-eg | |
| Dell Inspiron 15 5518-2X3JR (Ultra-Leistung) | |
| Xiaomi RedmiBook Pro 15 | |
| Asus VivoBook S15 D533UA | |
| Lenovo IdeaPad 5 15ALC05 | |
| 1280x720 Cloud Gate Standard Graphics | |
| Media della classe Office (11640 - 118515, n=38, ultimi 2 anni) | |
| Lenovo IdeaPad 5 Pro 16IHU6 | |
| Media NVIDIA GeForce MX450 (25467 - 33806, n=13) | |
| Dell Inspiron 15 5518-2X3JR (Ultra-Leistung) | |
| HP Pavilion 15-eg | |
| Dell Inspiron 15 5518-2X3JR | |
| Xiaomi RedmiBook Pro 15 | |
| Lenovo IdeaPad 5 15ALC05 | |
| 2560x1440 Time Spy Graphics | |
| Media della classe Office (493 - 6679, n=70, ultimi 2 anni) | |
| Lenovo IdeaPad 5 Pro 16IHU6 | |
| Dell Inspiron 15 5518-2X3JR (Ultra-Leistung) | |
| HP Pavilion 15-eg | |
| Dell Inspiron 15 5518-2X3JR | |
| Media NVIDIA GeForce MX450 (1086 - 2300, n=16) | |
| Lenovo IdeaPad 5 15ALC05 | |
| Asus VivoBook S15 D533UA | |
| Dota 2 Reborn - 1920x1080 ultra (3/3) best looking | |
| Lenovo IdeaPad 5 Pro 16IHU6 | |
| HP Pavilion 15-eg | |
| MSI Modern 14 B11SB-085 | |
| Media NVIDIA GeForce MX450 (34.9 - 104.6, n=20) | |
| Xiaomi RedmiBook Pro 15 | |
| Dell Inspiron 15 5518-2X3JR (Ultra-Leistung) | |
| Dell Inspiron 15 5518-2X3JR | |
| Media della classe Office (14.6 - 135, n=77, ultimi 2 anni) | |
| Asus VivoBook S15 D533UA | |
| Lenovo IdeaPad 5 15ALC05 | |
| X-Plane 11.11 - 1920x1080 high (fps_test=3) | |
| HP Pavilion 15-eg | |
| Lenovo IdeaPad 5 Pro 16IHU6 | |
| Xiaomi RedmiBook Pro 15 | |
| MSI Modern 14 B11SB-085 | |
| Media NVIDIA GeForce MX450 (35.4 - 71.4, n=20) | |
| Dell Inspiron 15 5518-2X3JR | |
| Dell Inspiron 15 5518-2X3JR (Ultra-Leistung) | |
| Media della classe Office (12 - 82.4, n=69, ultimi 2 anni) | |
| Lenovo IdeaPad 5 15ALC05 | |
| Asus VivoBook S15 D533UA | |
| Final Fantasy XV Benchmark - 1280x720 Lite Quality | |
| Lenovo IdeaPad 5 Pro 16IHU6 (1.3) | |
| Media della classe Office (16.5 - 171.2, n=73, ultimi 2 anni) | |
| Media NVIDIA GeForce MX450 (27.6 - 72.2, n=16) | |
| MSI Modern 14 B11SB-085 (1.3) | |
| Dell Inspiron 15 5518-2X3JR (1.3, Ultra-Leistung) | |
| Xiaomi RedmiBook Pro 15 (1.3) | |
| Dell Inspiron 15 5518-2X3JR (1.3) | |
| HP Pavilion 15-eg (1.3) | |
| Asus VivoBook S15 D533UA (1.3) | |
| GTA V - 1920x1080 High/On (Advanced Graphics Off) AA:2xMSAA + FX AF:8x | |
| Lenovo IdeaPad 5 Pro 16IHU6 | |
| Media NVIDIA GeForce MX450 (30.6 - 68.3, n=11) | |
| Dell Inspiron 15 5518-2X3JR (Ultra-Leistung) | |
| Dell Inspiron 15 5518-2X3JR | |
| MSI Modern 14 B11SB-085 | |
| HP Pavilion 15-eg | |
| Media della classe Office (11.4 - 163.1, n=70, ultimi 2 anni) | |
| Asus VivoBook S15 D533UA | |
| Strange Brigade - 1280x720 lowest AF:1 | |
| Media della classe Office (19.4 - 388, n=53, ultimi 2 anni) | |
| Lenovo IdeaPad 5 Pro 16IHU6 (1.47.22.14 D3D12) | |
| Media NVIDIA GeForce MX450 (61.4 - 137.7, n=12) | |
| MSI Modern 14 B11SB-085 (1.47.22.14 D3D12) | |
| Dell Inspiron 15 5518-2X3JR (1.47.22.14 D3D12) | |
| Dell Inspiron 15 5518-2X3JR (1.47.22.14 D3D12, Ultra-Leistung) | |
| Xiaomi RedmiBook Pro 15 (1.47.22.14 D3D12) | |
| Asus VivoBook S15 D533UA (1.47.22.14 D3D12) | |
Diagramma FPS Thhe Witcher 3
| basso | medio | alto | ultra | |
|---|---|---|---|---|
| GTA V (2015) | 115 | 95.8 | 51.8 | 23.8 |
| The Witcher 3 (2015) | 99.3 | 57.8 | 30.7 | 17.7 |
| Dota 2 Reborn (2015) | 104 | 90.5 | 80.7 | 75.3 |
| Final Fantasy XV Benchmark (2018) | 54.1 | 25.3 | 13.8 | |
| X-Plane 11.11 (2018) | 68.8 | 53.7 | 47 | |
| Strange Brigade (2018) | 106 | 40.6 | 35.4 | 25 |
| Control (2019) | 74.8 | 24.7 | 15.7 | |
| Flight Simulator 2020 (2020) | 61 | 22.7 | 14.8 | 7.86 |
| Deathloop (2021) | 27.7 | 13.5 | 11 | |
| Alan Wake Remastered (2021) | 25.5 | 16.2 | 13.4 | |
| Back 4 Blood (2021) | 128.3 | 46.9 | 29.4 | 26.7 |
| Riders Republic (2021) | 62 | 28 | 23 | 20 |
| Forza Horizon 5 (2021) | 72 | 28 | 23 | 13 |
| Halo Infinite (2021) | 8.6 | |||
| God of War (2022) | 25.8 | 18.4 | 8.66 | 3.09 |
| Rainbow Six Extraction (2022) | 54 | 28 | 26 | 16 |
| Dying Light 2 (2022) | 22 | 16.7 | 11.8 | |
| GRID Legends (2022) | 67.7 | 45.8 | 39.7 | 24.9 |
| Elden Ring (2022) | 31 | 19 | 17.2 | 15.1 |
| Elex 2 (2022) | 23.1 | 10.7 | 6.62 | |
| Ghostwire Tokyo (2022) | 38.2 | 25.8 | 25.8 | 24.9 |
| Tiny Tina's Wonderlands (2022) | 37.2 | 22.7 | 14 | 10.5 |
| Vampire Bloodhunt (2022) | 96.5 | 59.3 | 50.7 | 33.4 |
| F1 22 (2022) | 54.7 | 49.2 | 36 | 22.2 |
| The Quarry (2022) | 30 | 21.1 | 14.9 | 9.31 |
| FIFA 23 (2022) | 57.4 | 42.1 | 37.8 | 33.9 |
| A Plague Tale Requiem (2022) | 22.6 | 18.3 | 12.4 | 8.51 |
| Uncharted Legacy of Thieves Collection (2022) | 9.73 | 8.41 | 5.83 | 5.51 |
| Call of Duty Modern Warfare 2 2022 (2022) | 37 | 33 | 15 | 17 |
| Spider-Man Miles Morales (2022) | 22.9 | 21 | 17.6 | 11.2 |
| The Callisto Protocol (2022) | 34.2 | 15 | 8 | 7.4 |
| Need for Speed Unbound (2022) | 28.7 | 21.4 | 13.5 | |
| High On Life (2023) | 29.4 | 15.8 | 14 | 12.4 |
| The Witcher 3 v4 (2023) | 45.8 | 32.4 | 24.9 | 14.1 |
| Dead Space Remake (2023) | 17.1 | 15.7 | 6.37 | |
| Baldur's Gate 3 (2023) | 11.3 | 5.94 | ||
| Cyberpunk 2077 (2023) | 22.6 | 14 | 8.12 | 7.09 |
| Counter-Strike 2 (2023) | 87.5 | 67 | 34.8 | 21.7 |
| EA Sports FC 24 (2023) | 58 | 57.3 | 56.4 | 55.9 |
| Assassin's Creed Mirage (2023) | 18 | 15 | ||
| Skull & Bones (2024) | 21 | 21 | 13 | |
| Horizon Forbidden West (2024) | 11.6 | |||
| F1 24 (2024) | 31.9 | 25.7 | 20.4 | 13.4 |
Rumorosità
| Idle |
| 26 / 26 / 26 dB(A) |
| Sotto carico |
| 47.4 / 48.4 dB(A) |
 | ||
30 dB silenzioso 40 dB(A) udibile 50 dB(A) rumoroso |
||
min: | ||
| Dell Inspiron 15 5518-2X3JR Intel Core i5-11300H, NVIDIA GeForce MX450 | HP Pavilion 15-eg Intel Core i7-1165G7, NVIDIA GeForce MX450 | Xiaomi RedmiBook Pro 15 Intel Core i7-11370H, NVIDIA GeForce MX450 | Lenovo IdeaPad 5 Pro 16IHU6 Intel Core i5-11300H, NVIDIA GeForce MX450 | Asus VivoBook S15 D533UA AMD Ryzen 7 5700U, AMD Radeon RX Vega 8 (Ryzen 4000/5000) | Lenovo IdeaPad 5 15ALC05 AMD Ryzen 5 5500U, AMD Radeon RX Vega 7 | |
|---|---|---|---|---|---|---|
| Noise | 7% | 4% | 8% | 0% | 6% | |
| off /ambiente * (dB) | 26 | 25.4 2% | 25 4% | 25 4% | 26 -0% | 26 -0% |
| Idle Minimum * (dB) | 26 | 25.6 2% | 25 4% | 25 4% | 26 -0% | 26 -0% |
| Idle Average * (dB) | 26 | 25.6 2% | 26 -0% | 25 4% | 26 -0% | 26 -0% |
| Idle Maximum * (dB) | 26 | 25.6 2% | 27 -4% | 25 4% | 28.8 -11% | 26 -0% |
| Load Average * (dB) | 47.4 | 39.2 17% | 43 9% | 44.5 6% | 45 5% | 42.6 10% |
| Load Maximum * (dB) | 48.4 | 41.5 14% | 44 9% | 36.5 25% | 45 7% | 37.4 23% |
| Witcher 3 ultra * (dB) | 39.1 | 42 |
* ... Meglio usare valori piccoli
(-) La temperatura massima sul lato superiore è di 55.1 °C / 131 F, rispetto alla media di 34.3 °C / 94 F, che varia da 21.2 a 62.5 °C per questa classe Office.
(-) Il lato inferiore si riscalda fino ad un massimo di 62.4 °C / 144 F, rispetto alla media di 36.8 °C / 98 F
(+) In idle, la temperatura media del lato superiore è di 26.3 °C / 79 F, rispetto alla media deld ispositivo di 29.5 °C / 85 F.
(+) I poggiapolsi e il touchpad sono piu' freddi della temperatura della pelle con un massimo di 28.3 °C / 82.9 F e sono quindi freddi al tatto.
(±) La temperatura media della zona del palmo della mano di dispositivi simili e'stata di 27.5 °C / 81.5 F (-0.8 °C / -1.4 F).
| Dell Inspiron 15 5518-2X3JR Intel Core i5-11300H, NVIDIA GeForce MX450 | HP Pavilion 15-eg Intel Core i7-1165G7, NVIDIA GeForce MX450 | Xiaomi RedmiBook Pro 15 Intel Core i7-11370H, NVIDIA GeForce MX450 | Lenovo IdeaPad 5 Pro 16IHU6 Intel Core i5-11300H, NVIDIA GeForce MX450 | Asus VivoBook S15 D533UA AMD Ryzen 7 5700U, AMD Radeon RX Vega 8 (Ryzen 4000/5000) | Lenovo IdeaPad 5 15ALC05 AMD Ryzen 5 5500U, AMD Radeon RX Vega 7 | |
|---|---|---|---|---|---|---|
| Heat | 13% | 6% | 6% | 16% | 20% | |
| Maximum Upper Side * (°C) | 55.1 | 44 20% | 54 2% | 65.3 -19% | 46.1 16% | 40.5 26% |
| Maximum Bottom * (°C) | 62.4 | 53.4 14% | 52 17% | 55.4 11% | 46.6 25% | 42 33% |
| Idle Upper Side * (°C) | 29.8 | 27.4 8% | 33 -11% | 25.4 15% | 27.4 8% | 26.5 11% |
| Idle Bottom * (°C) | 32.5 | 28.8 11% | 28 14% | 26.8 18% | 28.2 13% | 29 11% |
* ... Meglio usare valori piccoli
Dell Inspiron 15 5518-2X3JR analisi audio
(+) | gli altoparlanti sono relativamente potenti (88.4 dB)
Bassi 100 - 315 Hz
(-) | quasi nessun basso - in media 21.3% inferiori alla media
(+) | bassi in lineaa (5.8% delta rispetto alla precedente frequenza)
Medi 400 - 2000 Hz
(+) | medi bilanciati - solo only 3.1% rispetto alla media
(+) | medi lineari (4.2% delta rispetto alla precedente frequenza)
Alti 2 - 16 kHz
(±) | alti elevati - circa 5.5% superiori alla media
(+) | alti lineari (6.4% delta rispetto alla precedente frequenza)
Nel complesso 100 - 16.000 Hz
(±) | la linearità complessiva del suono è media (17% di differenza rispetto alla media
Rispetto alla stessa classe
» 24% di tutti i dispositivi testati in questa classe è stato migliore, 7% simile, 68% peggiore
» Il migliore ha avuto un delta di 7%, medio di 21%, peggiore di 53%
Rispetto a tutti i dispositivi testati
» 31% di tutti i dispositivi testati in questa classe è stato migliore, 8% similare, 61% peggiore
» Il migliore ha avuto un delta di 4%, medio di 23%, peggiore di 134%
HP Pavilion 15-eg analisi audio
(±) | potenza degli altiparlanti media ma buona (81.3 dB)
Bassi 100 - 315 Hz
(-) | quasi nessun basso - in media 18% inferiori alla media
(±) | la linearità dei bassi è media (12.8% delta rispetto alla precedente frequenza)
Medi 400 - 2000 Hz
(+) | medi bilanciati - solo only 2.8% rispetto alla media
(+) | medi lineari (4% delta rispetto alla precedente frequenza)
Alti 2 - 16 kHz
(+) | Alti bilanciati - appena 1% dalla media
(+) | alti lineari (3% delta rispetto alla precedente frequenza)
Nel complesso 100 - 16.000 Hz
(+) | suono nel complesso lineare (13.2% differenza dalla media)
Rispetto alla stessa classe
» 27% di tutti i dispositivi testati in questa classe è stato migliore, 5% simile, 68% peggiore
» Il migliore ha avuto un delta di 5%, medio di 17%, peggiore di 45%
Rispetto a tutti i dispositivi testati
» 13% di tutti i dispositivi testati in questa classe è stato migliore, 3% similare, 84% peggiore
» Il migliore ha avuto un delta di 4%, medio di 23%, peggiore di 134%
| Off / Standby | |
| Idle | |
| Sotto carico |
|
Leggenda:
min: | |
Consumo energetico The Witcher 3 / Stress test
| Dell Inspiron 15 5518-2X3JR Intel Core i5-11300H, NVIDIA GeForce MX450 | HP Pavilion 15-eg Intel Core i7-1165G7, NVIDIA GeForce MX450 | Xiaomi RedmiBook Pro 15 Intel Core i7-11370H, NVIDIA GeForce MX450 | Lenovo IdeaPad 5 Pro 16IHU6 Intel Core i5-11300H, NVIDIA GeForce MX450 | Asus VivoBook S15 D533UA AMD Ryzen 7 5700U, AMD Radeon RX Vega 8 (Ryzen 4000/5000) | Lenovo IdeaPad 5 15ALC05 AMD Ryzen 5 5500U, AMD Radeon RX Vega 7 | |
|---|---|---|---|---|---|---|
| Power Consumption | -19% | -37% | -30% | -3% | 11% | |
| Idle Minimum * (Watt) | 4 | 4.9 -23% | 6 -50% | 5 -25% | 5 -25% | 3.7 7% |
| Idle Average * (Watt) | 7.6 | 7.9 -4% | 9 -18% | 9 -18% | 7.7 -1% | 7.9 -4% |
| Idle Maximum * (Watt) | 10.2 | 14.2 -39% | 12 -18% | 9.4 8% | 12.2 -20% | 9.3 9% |
| Load Average * (Watt) | 49.4 | 64.3 -30% | 74 -50% | 71 -44% | 41 17% | 41 17% |
| Witcher 3 ultra * (Watt) | 49.4 | 55.6 -13% | 70.7 -43% | 72.4 -47% | 43 13% | 41 17% |
| Load Maximum * (Watt) | 63.4 | 65.4 -3% | 91 -44% | 99 -56% | 65 -3% | 52.2 18% |
* ... Meglio usare valori piccoli
Pro
Contro
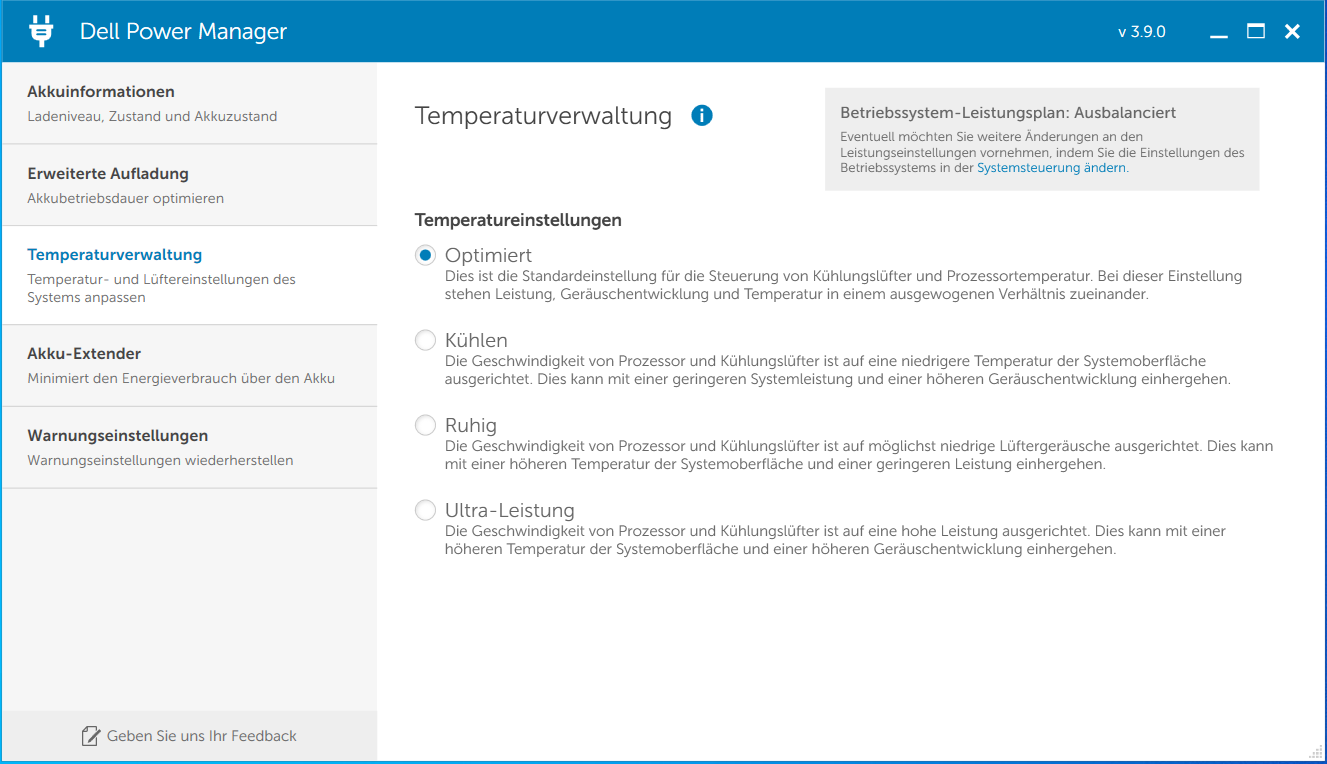
Valutazione complessiva - L'Inspiron 15 5518 offre un potenziale di miglioramento

Il Core i5-11300HCPU offre prestazioni sufficienti per le applicazioni d'ufficio e Internet, la GeForce-MX450 permette l'uso di giochi per computer o applicazioni pesanti con la GPU. L'hardware è alloggiato in un elegante case di alluminio.
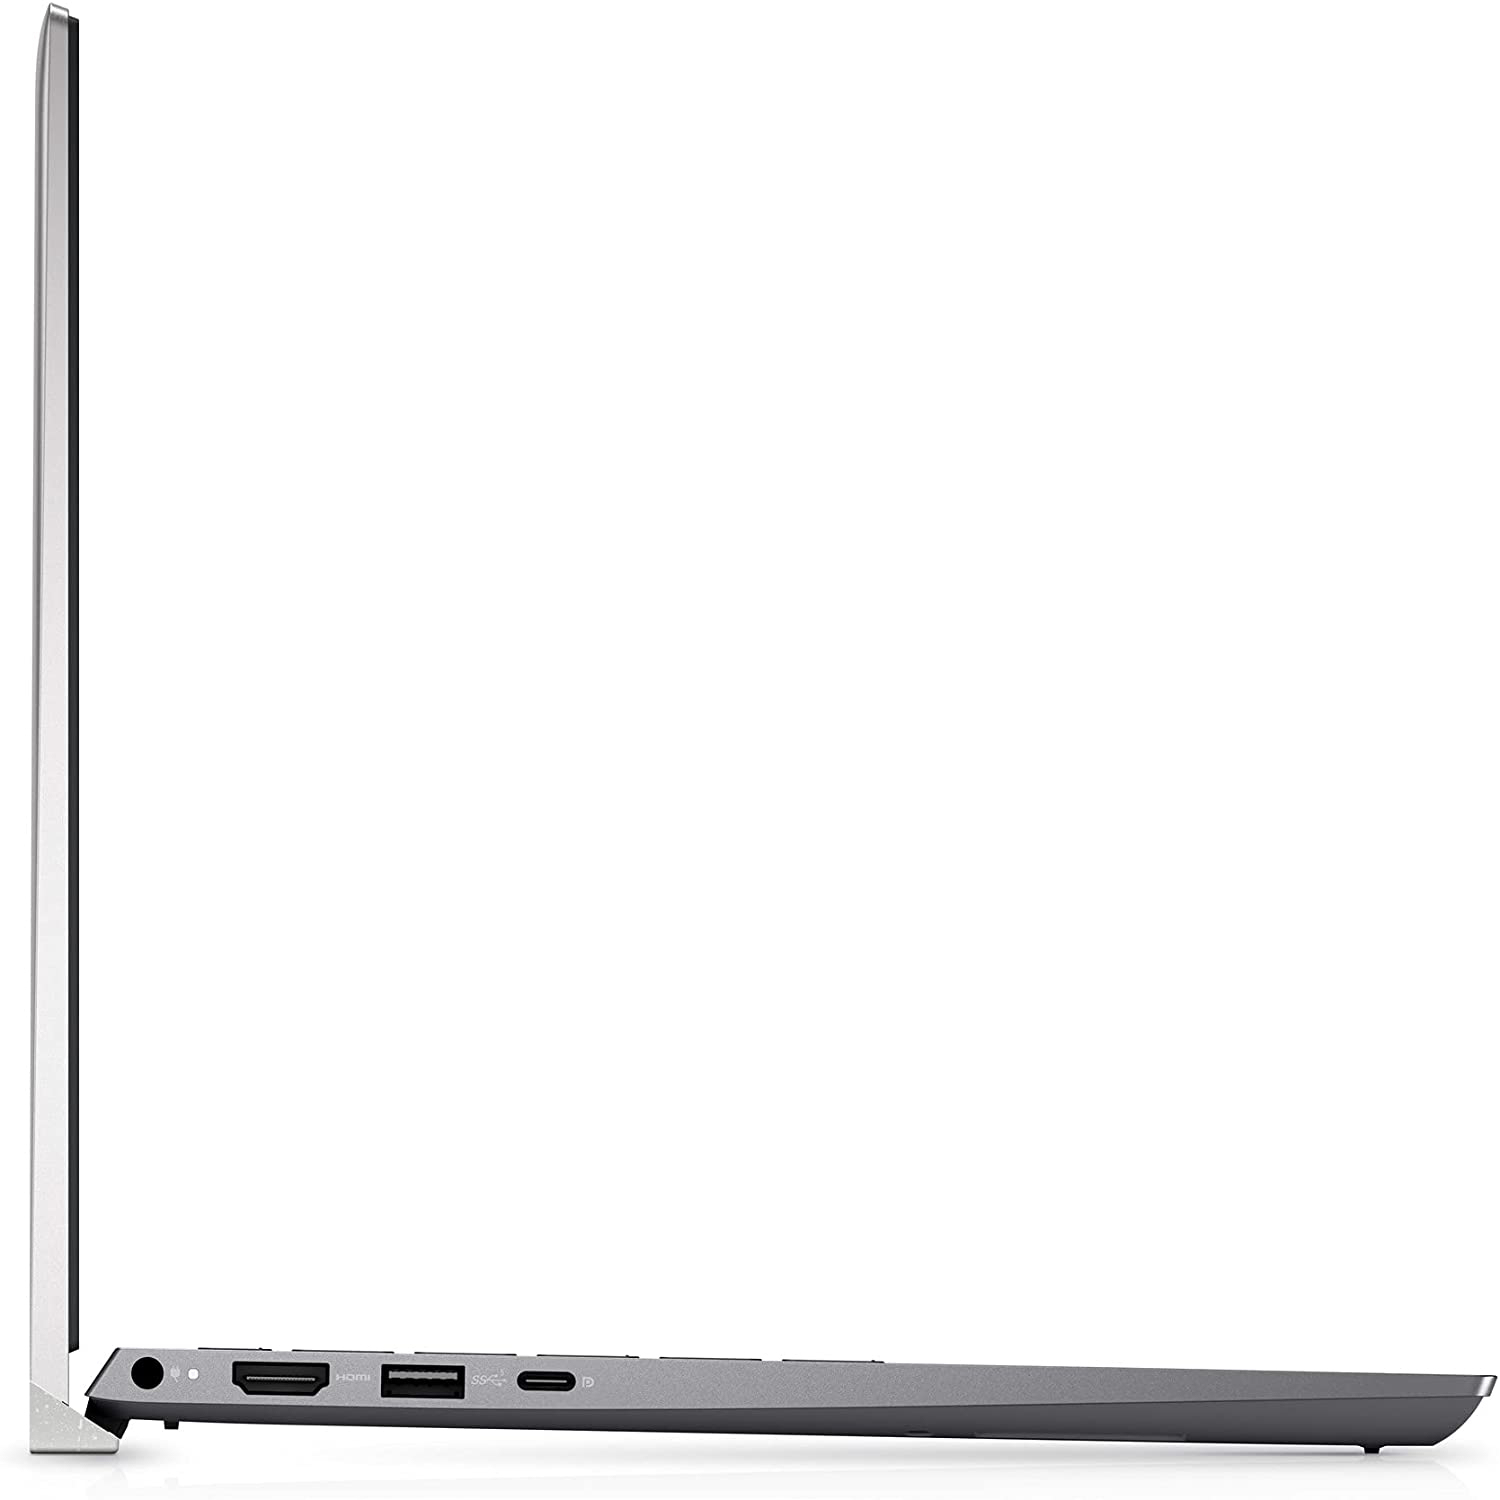
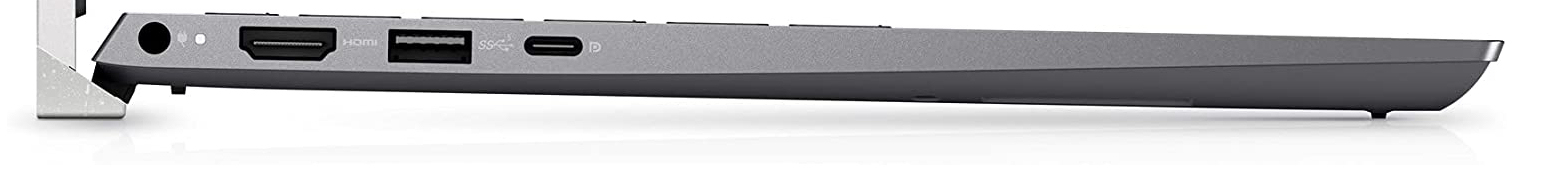
Thunderbolt 4 è riservato al modello Core i7 dell'Inspiron.
Un'autonomia WLAN di quasi 9,5 ore dovrebbe farvi passare la giornata senza un adattatore di corrente. L'alimentazione può essere fornita tramite l'adattatore proprietario Dell incluso o tramite un adattatore di alimentazione USB-C - la porta USB-C del 5518 funziona secondo lo standard USB 3.2 Gen 2x2.
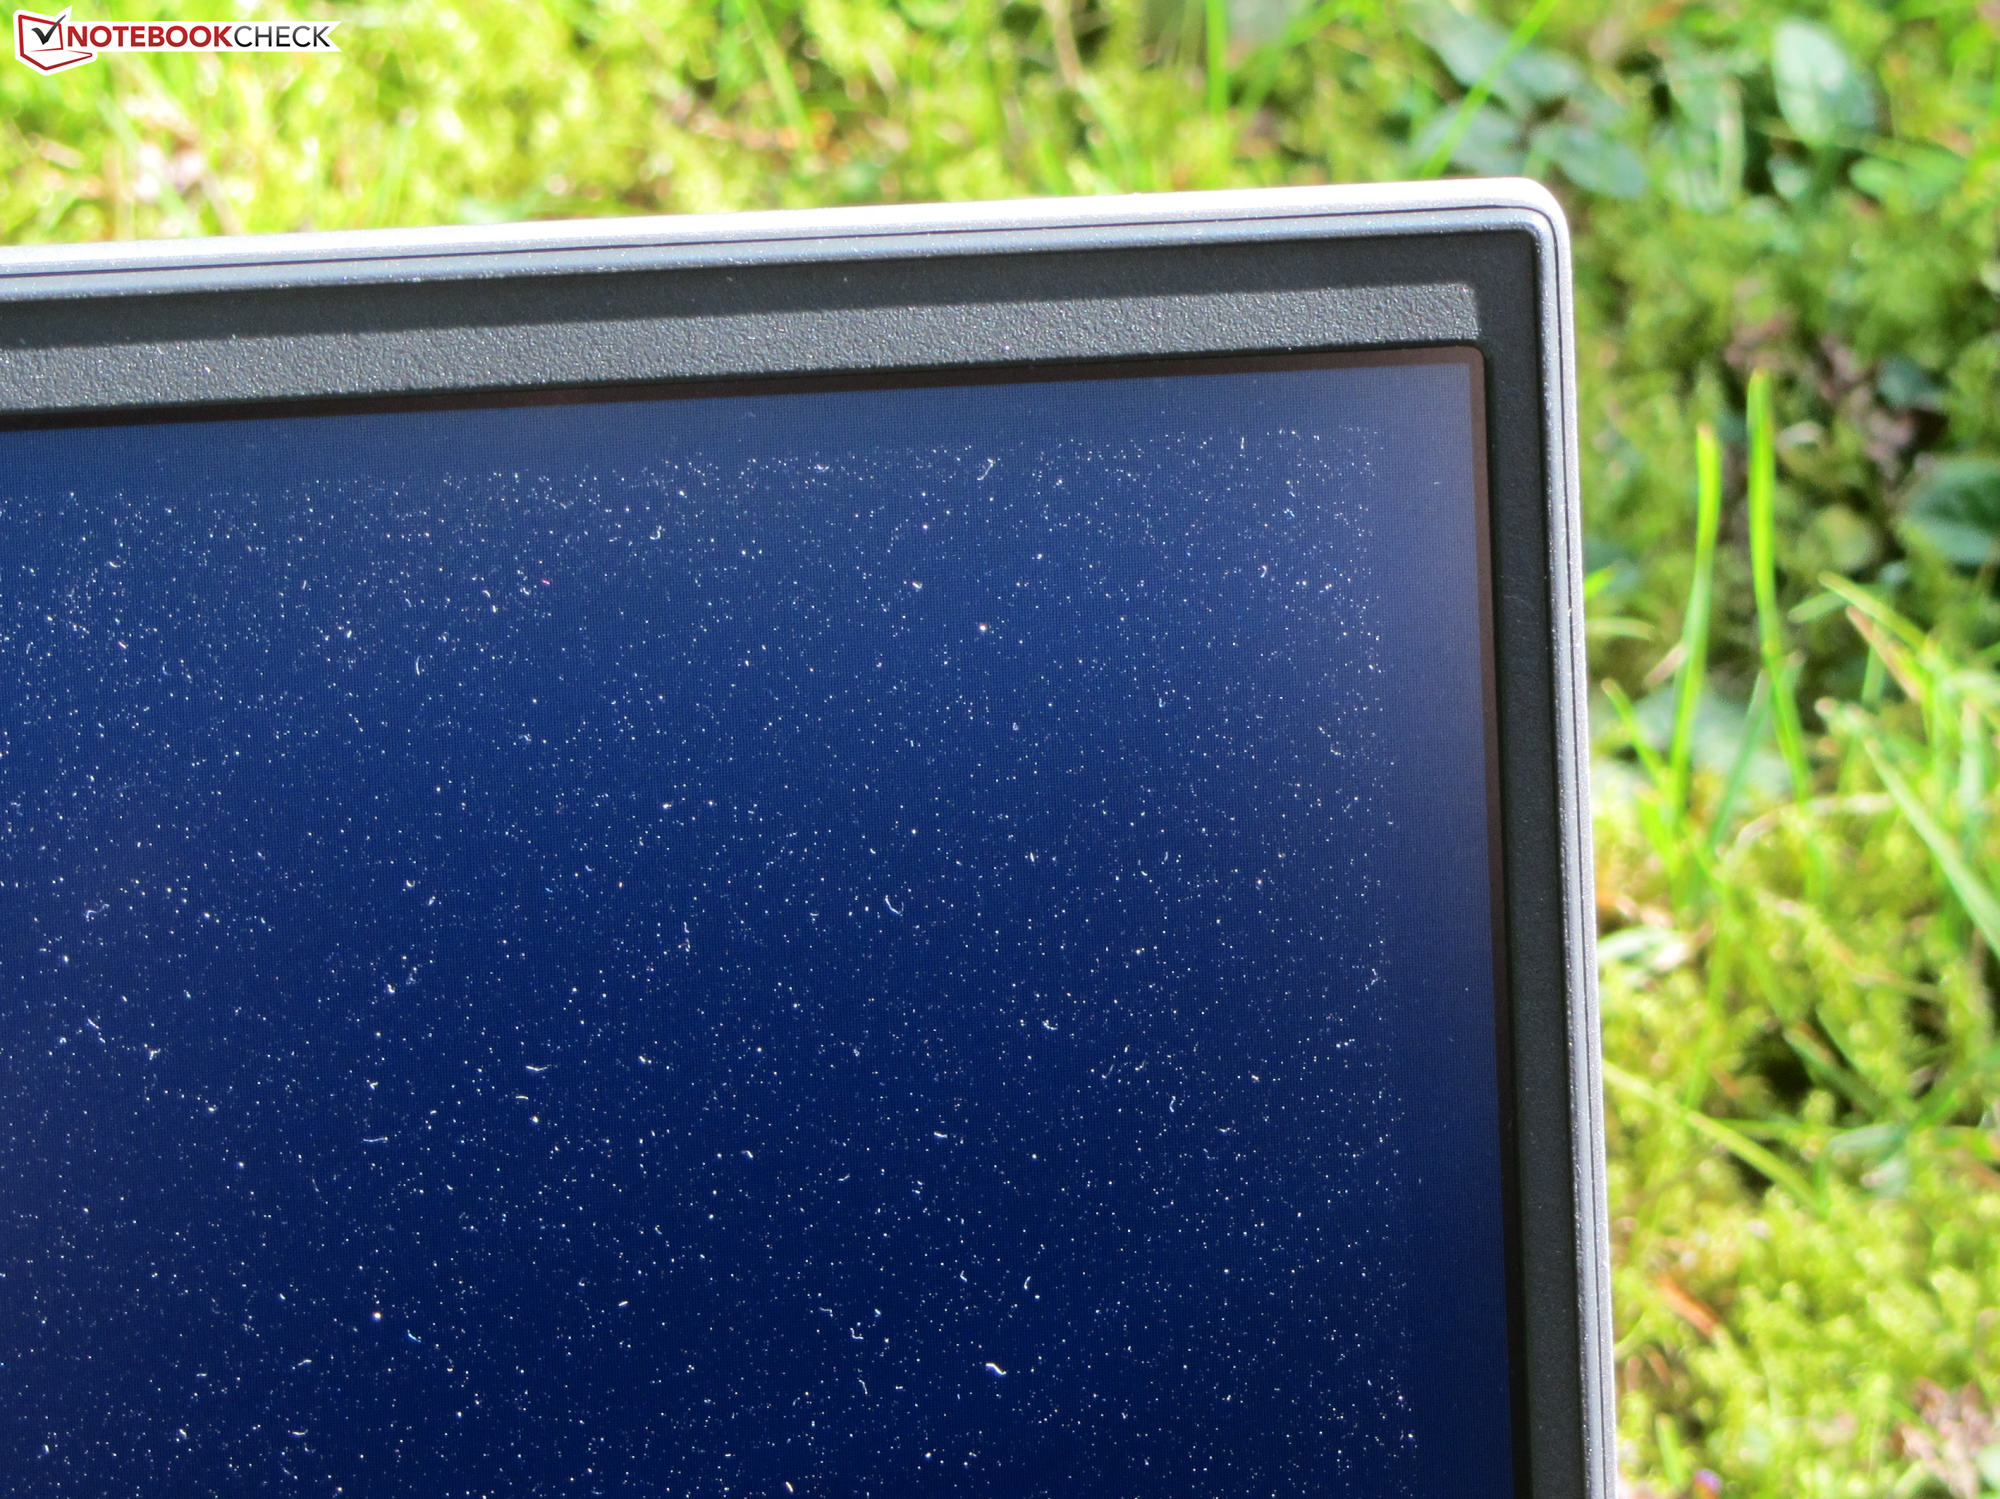
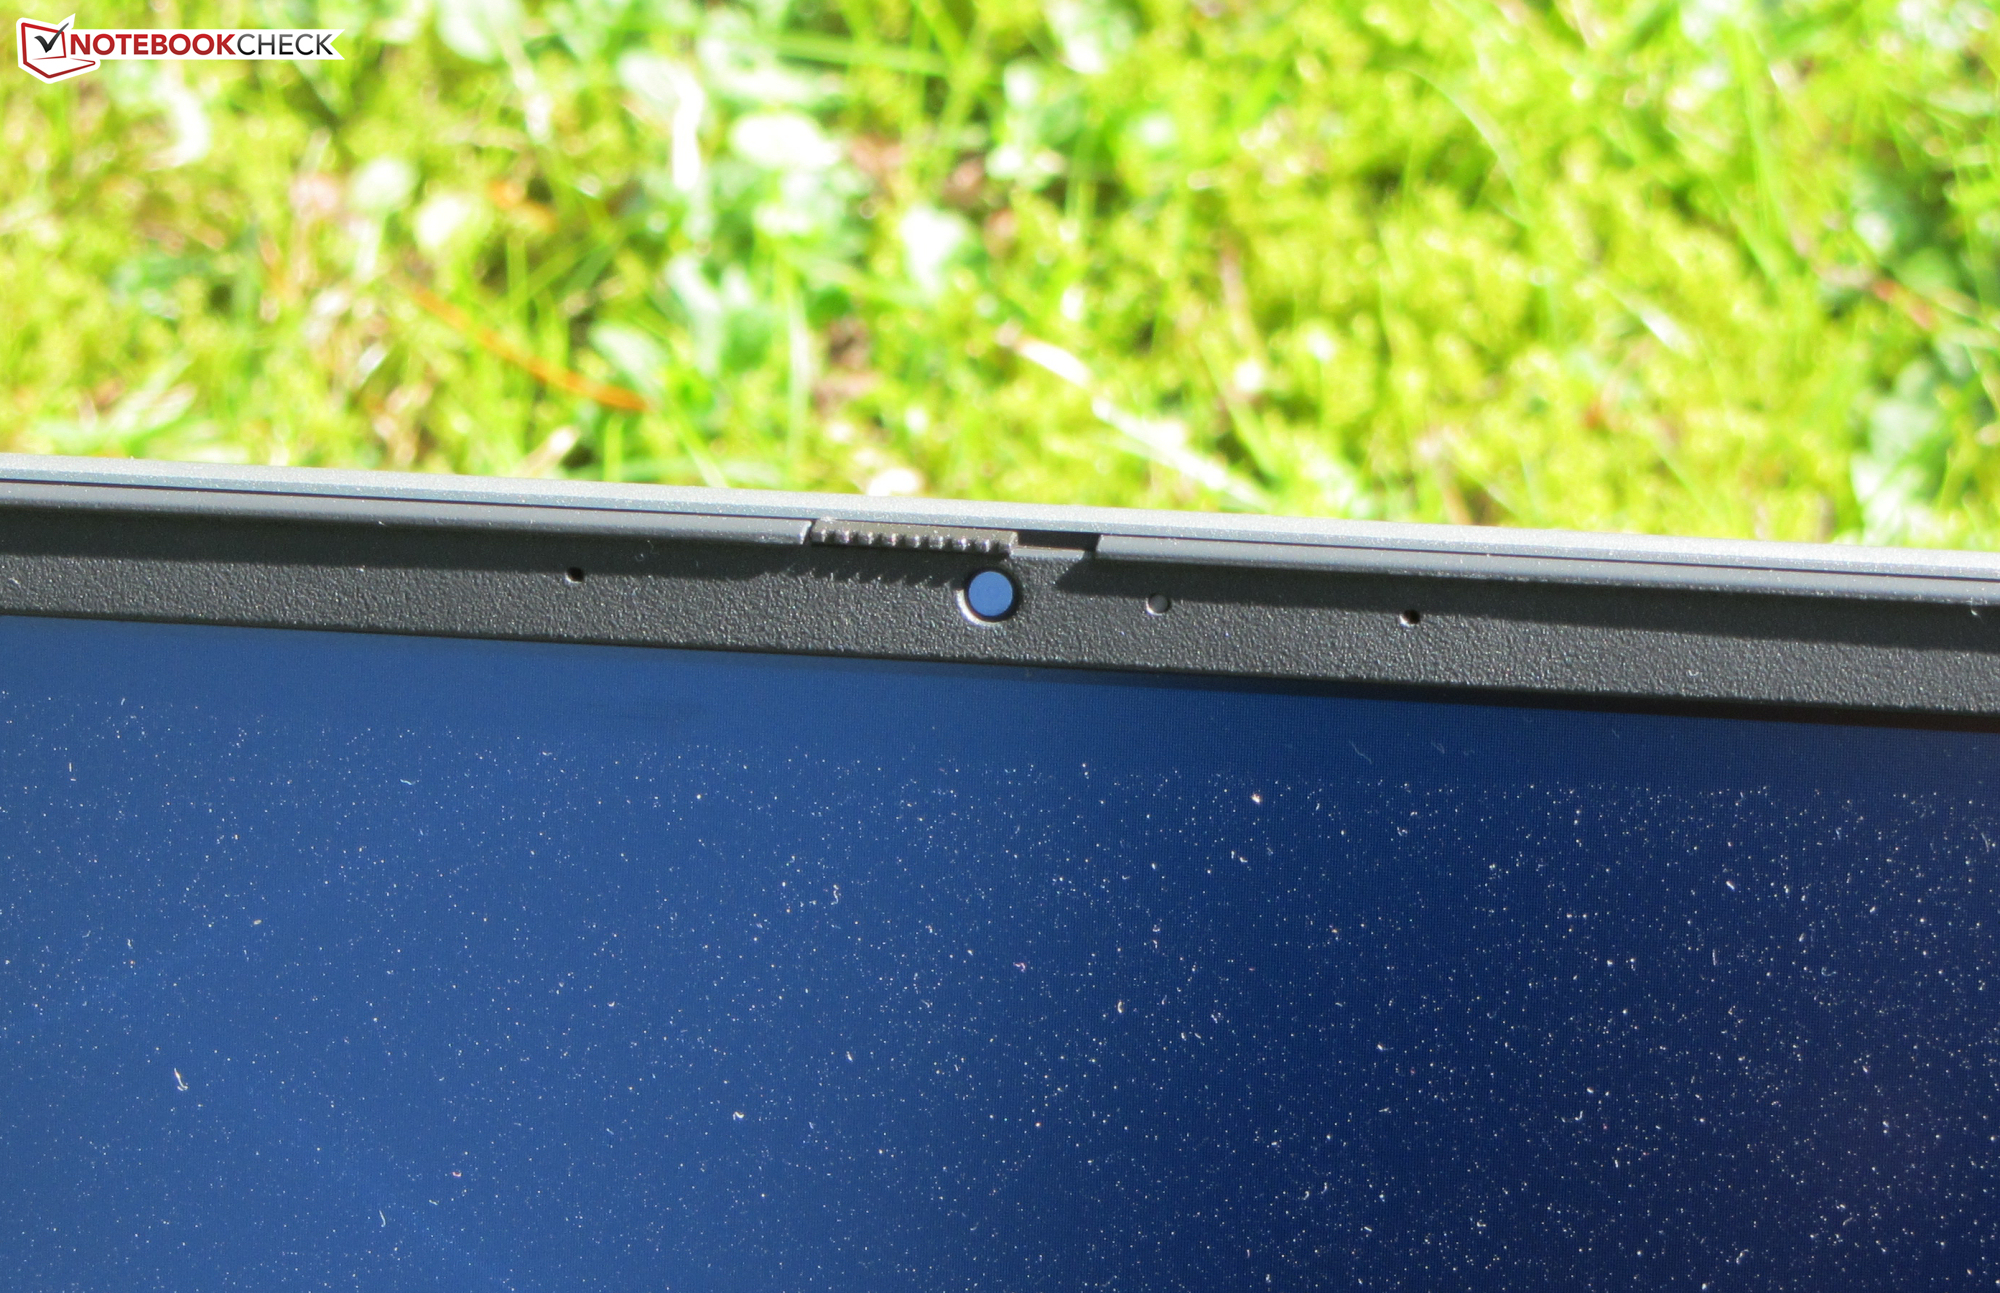
Il portatile non produce molto rumore nell'uso quotidiano (ufficio, Internet), e lo sviluppo di calore è su un livello accettabile. Lo schermo opaco (FHD, IPS) offre angoli di visione stabili, un buon contrasto e una riproduzione dei colori decente. La luminosità e la copertura dello spazio colore sono troppo basse.
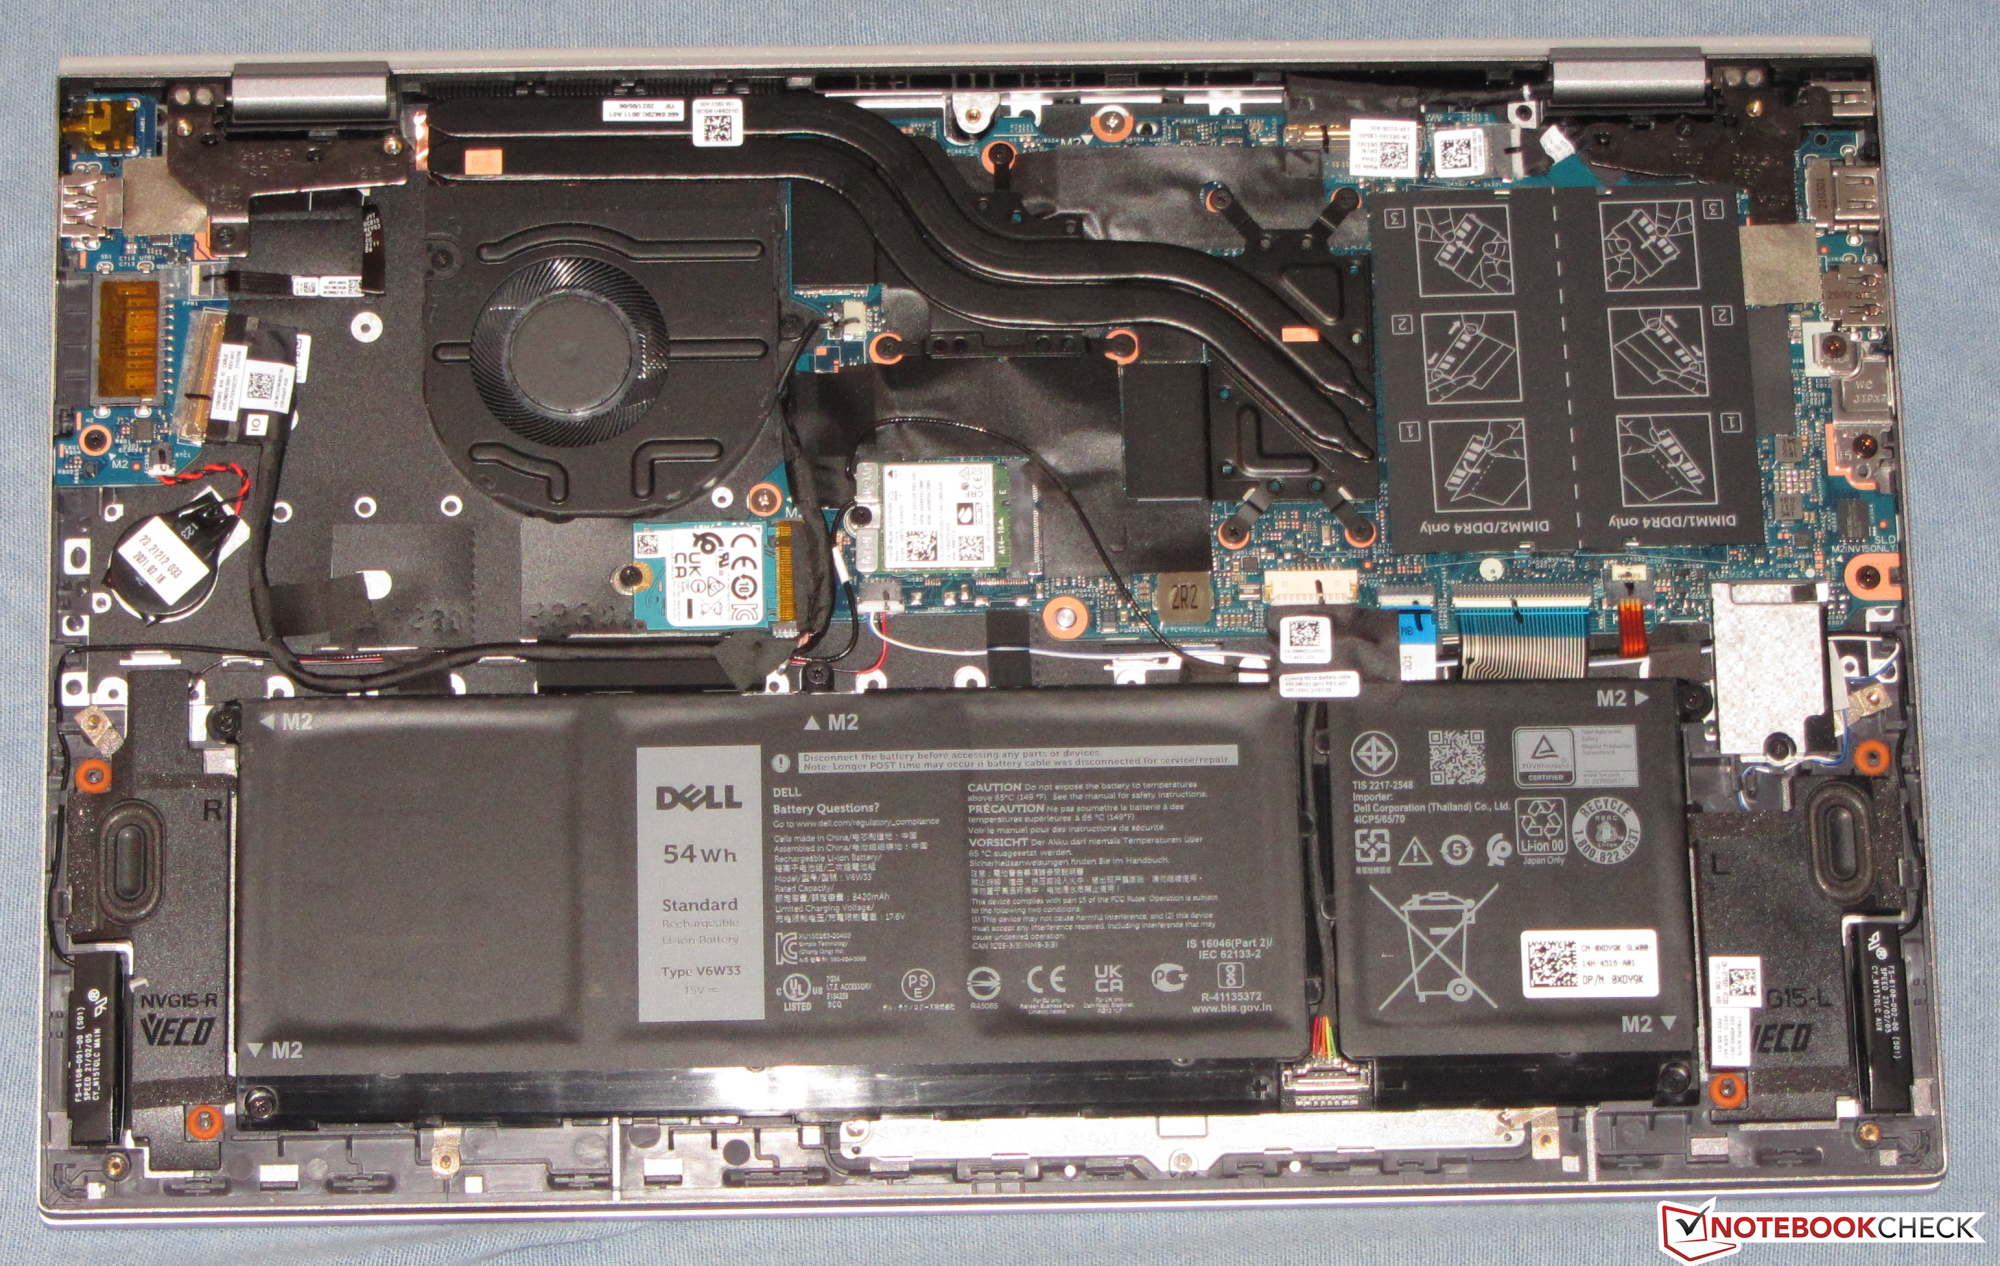
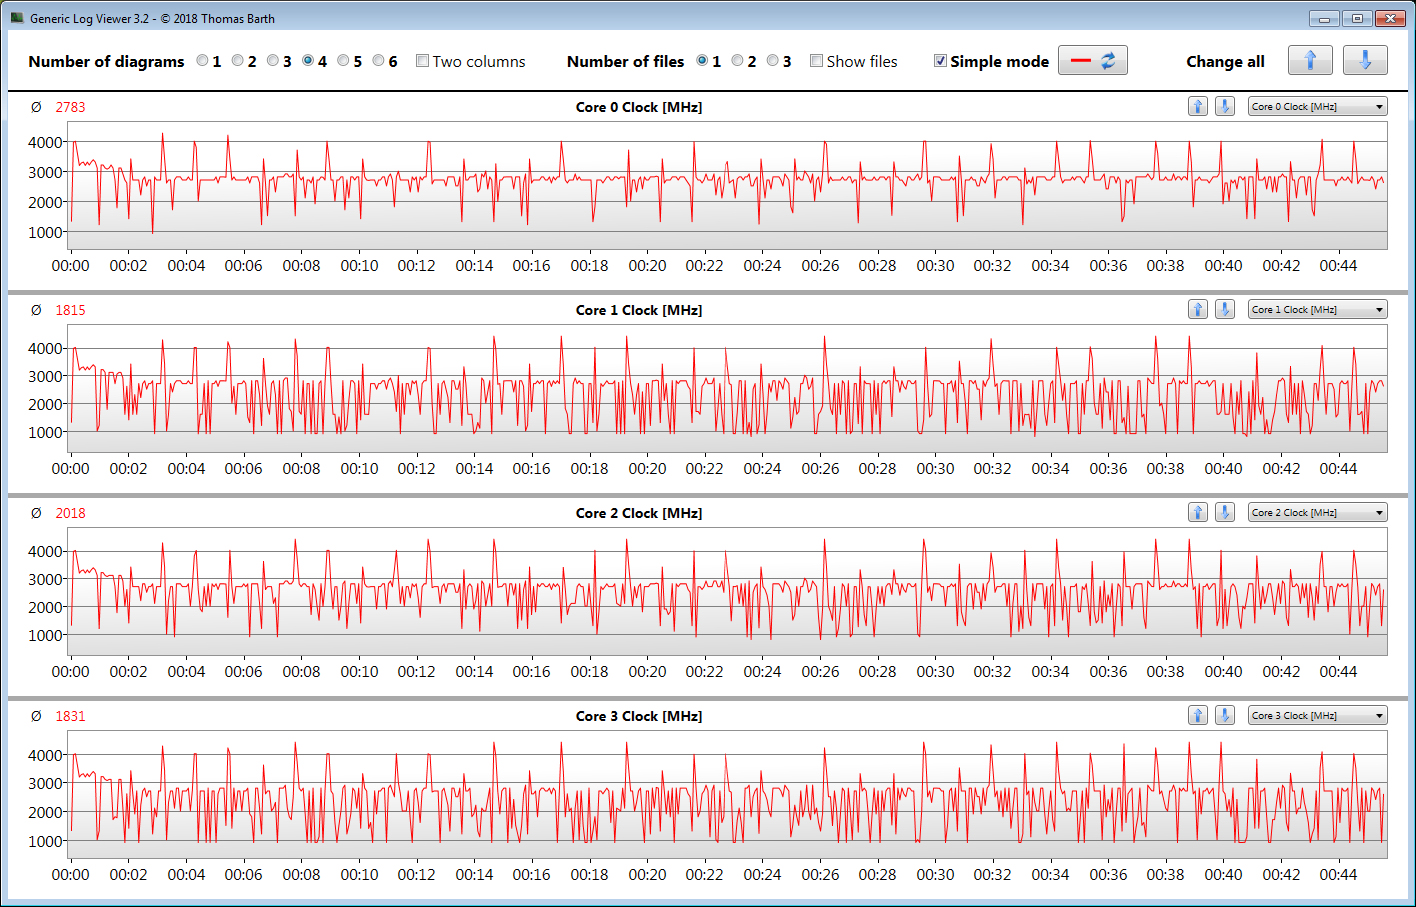
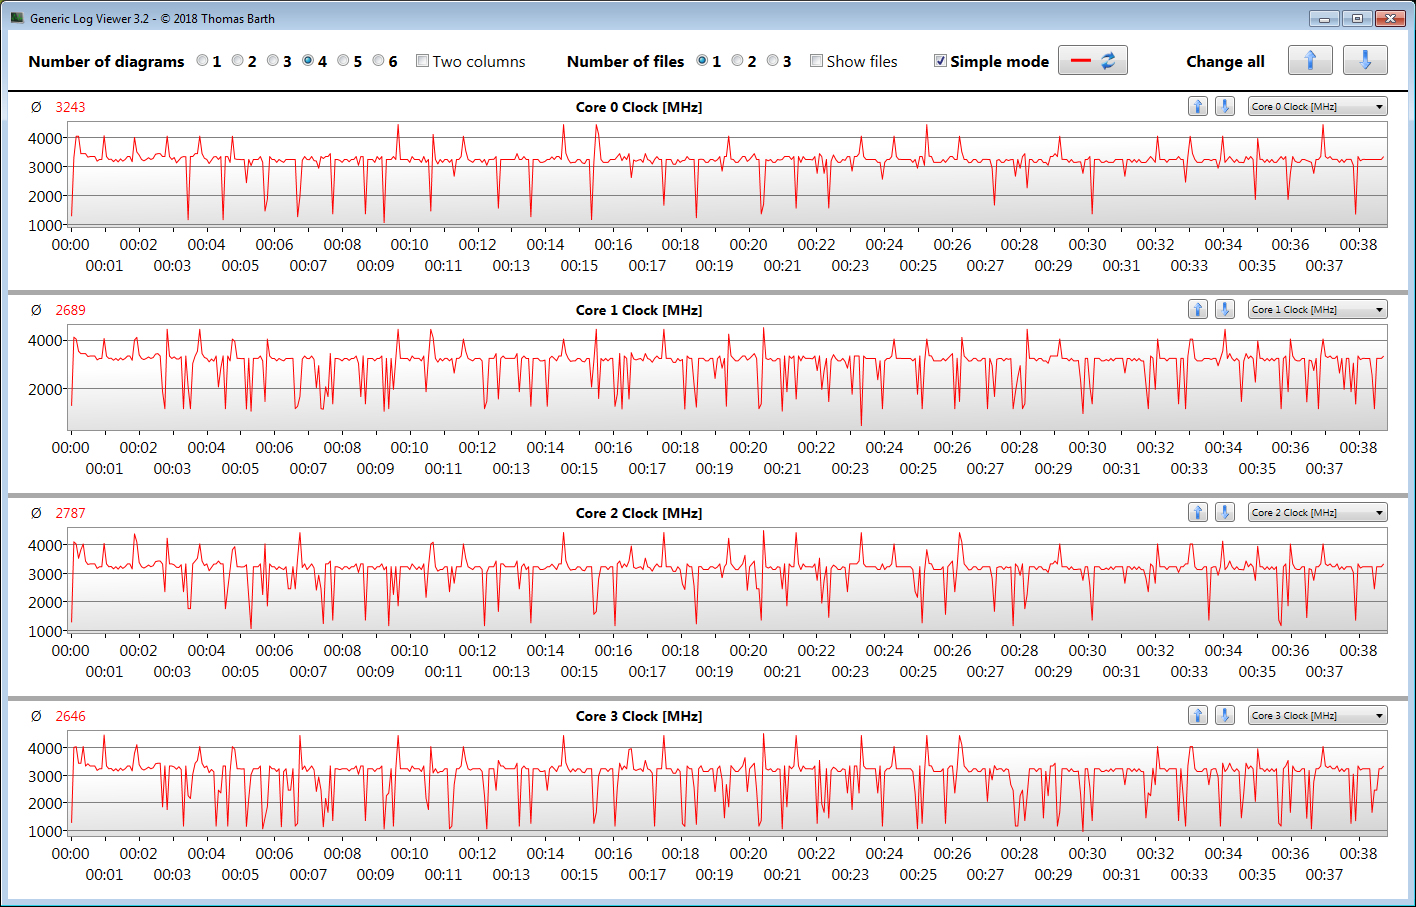
Il processore è al di sotto delle sue capacità a causa dei bassi limiti di potenza. La memoria di lavoro (1x 8 GB, DDR4-3200) che funziona in modalità single-channel costa ulteriori prestazioni. Questo potrebbe essere migliorato installando un secondo modulo di memoria. Il case in alluminio manca di rigidità.
Un'alternativa all'Inspiron nel segmento degli 800 Euro (~$939) potrebbe essere il Lenovo IdeaPad 5 15ALC05. Ha molte prestazioni della CPU multi-thread, uno schermo luminoso, basse emissioni e un'eccellente durata della batteria. I punti deboli: La memoria di lavoro è saldata e lo schermo offre un basso contrasto.
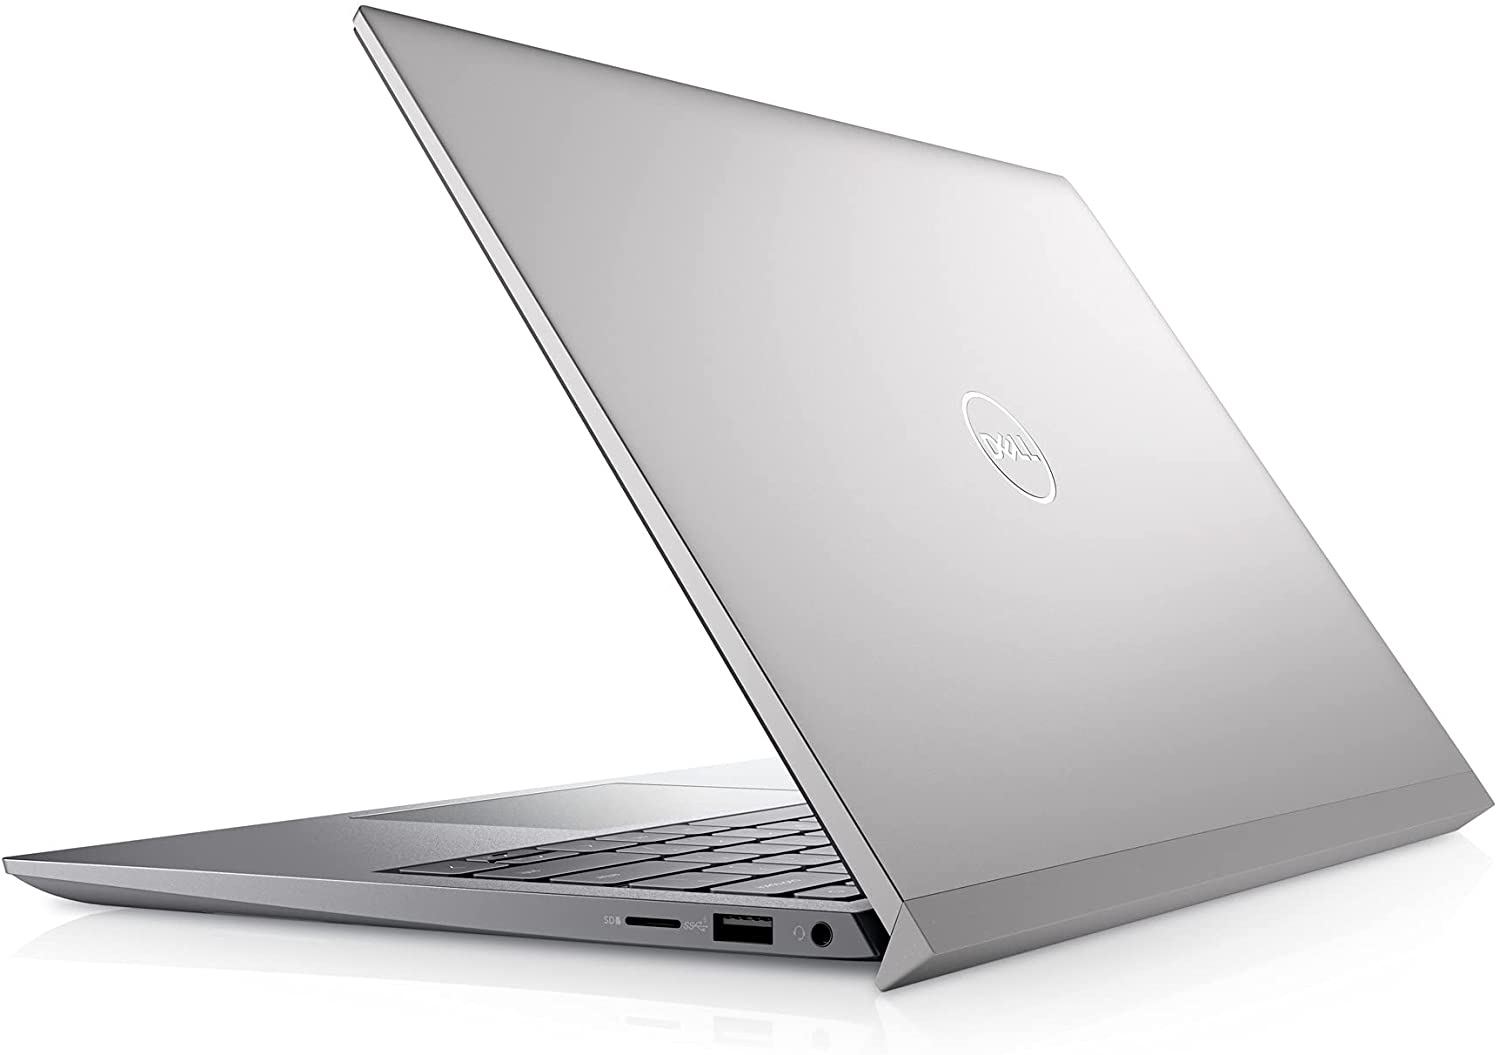
Dell Inspiron 15 5518-2X3JR
- 09/14/2021 v7 (old)
Sascha Mölck
Price comparison
