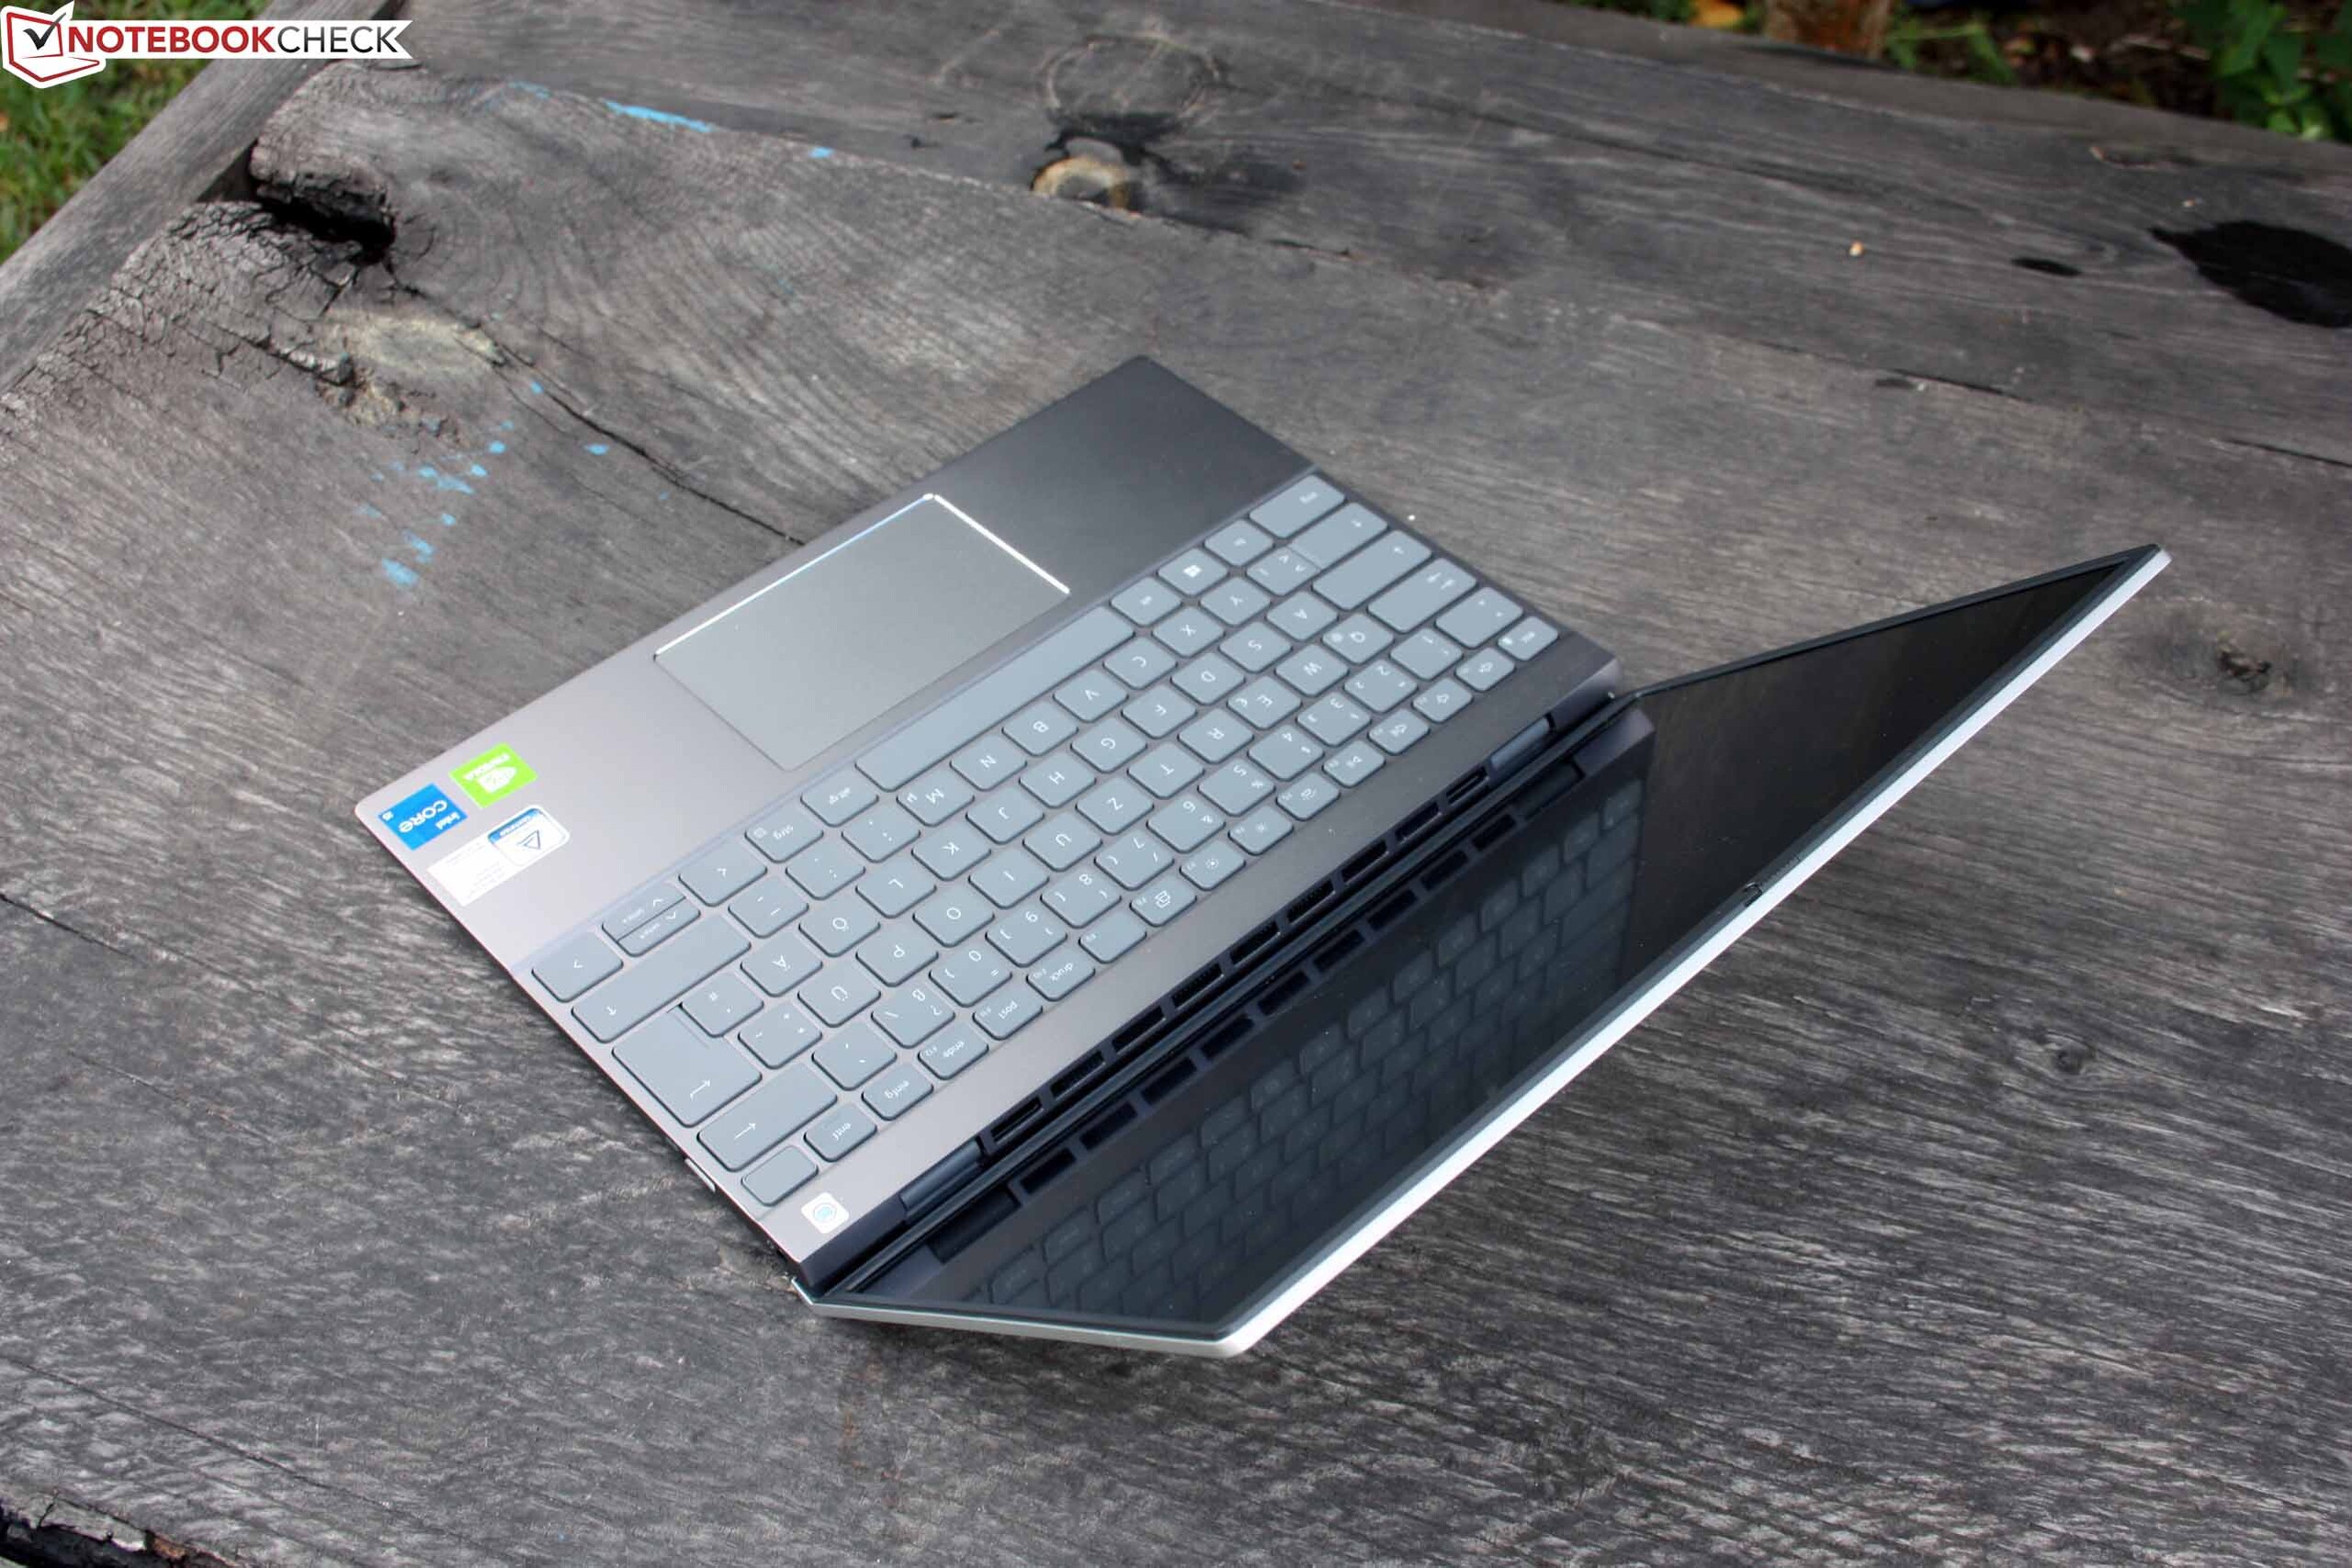
Recensione del Dell Inspiron 13 5310: Più grafica, maggiore autonomia
Confronto con i potenziali concorrenti
Punteggio | Data | Modello | Peso | Altezza | Dimensione | Risoluzione | Prezzo |
|---|---|---|---|---|---|---|---|
| 85.7 % v7 (old) | 09/2021 | Dell Inspiron 13 5310-NJ24J i5-11300H, GeForce MX450 | 1.3 kg | 15.9 mm | 13.30" | 1920x1200 | |
| 85.3 % v7 (old) | 05/2021 | HP Envy 13-ba1475ng i7-1165G7, GeForce MX450 | 1.3 kg | 17 mm | 13.30" | 1920x1080 | |
| 84.4 % v7 (old) | 08/2021 | HP Pavilion Aero 13 be0097nr R7 5800U, Vega 8 | 953 gr | 17 mm | 13.30" | 1920x1200 | |
| 88.5 % v7 (old) | 05/2021 | Asus ZenBook 13 UM325S R7 5800U, Vega 8 | 1.2 kg | 13.9 mm | 13.30" | 1920x1080 | |
| 88.9 % v7 (old) | 05/2021 | Asus ZenBook 13 UX325EA i7-1165G7, Iris Xe G7 96EUs | 1.2 kg | 13.9 mm | 13.30" | 1920x1080 | |
| 85.7 % v7 (old) | 06/2021 | Acer Spin 3 SP313-51N-56YV i5-1135G7, Iris Xe G7 80EUs | 1.4 kg | 16 mm | 13.30" | 2560x1600 |
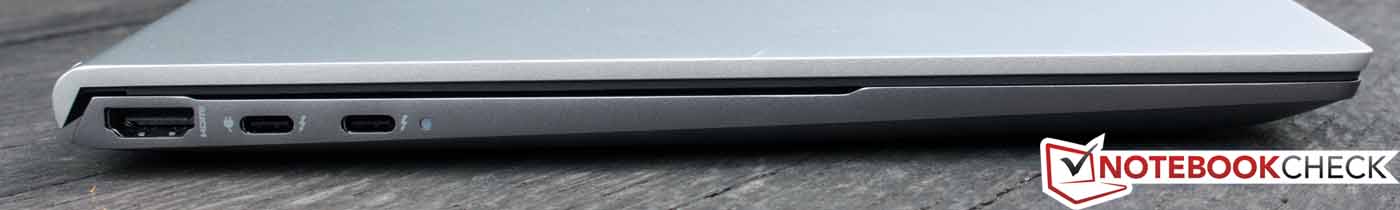
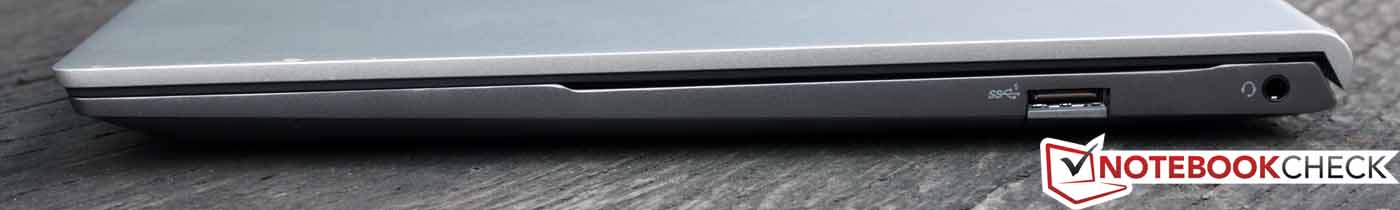
Connessioni


| |||||||||||||||||||||||||
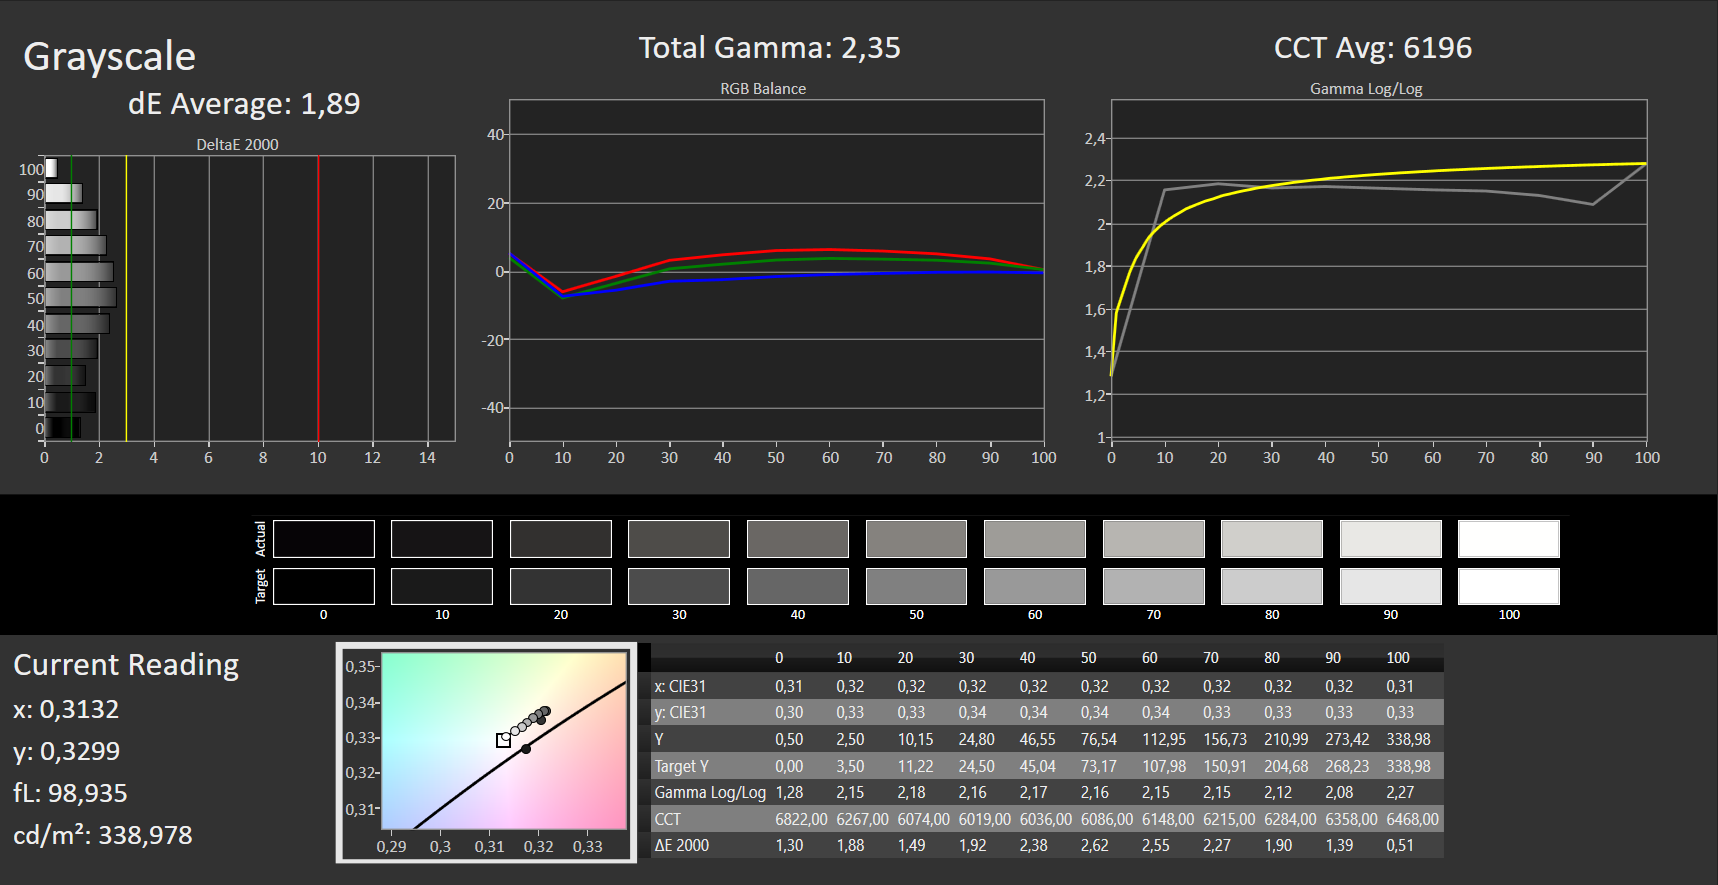
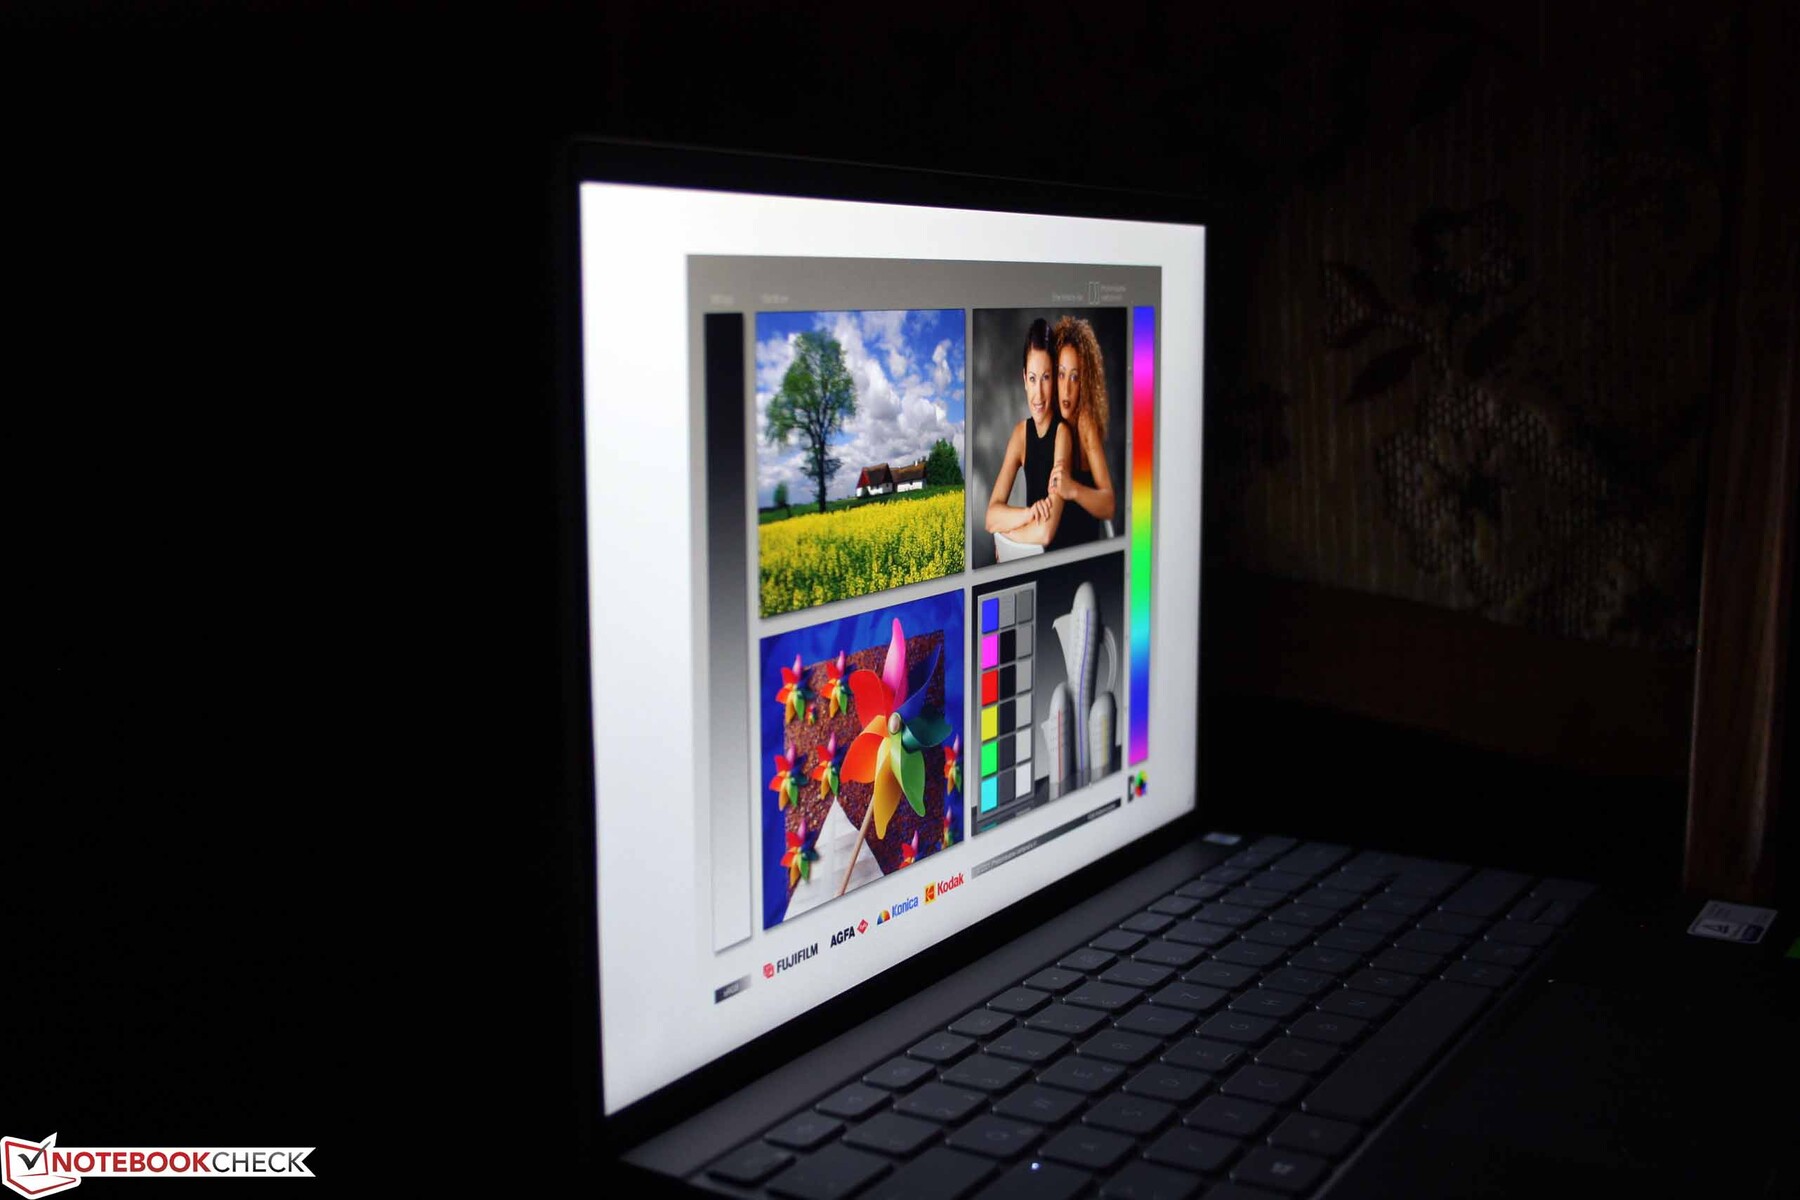
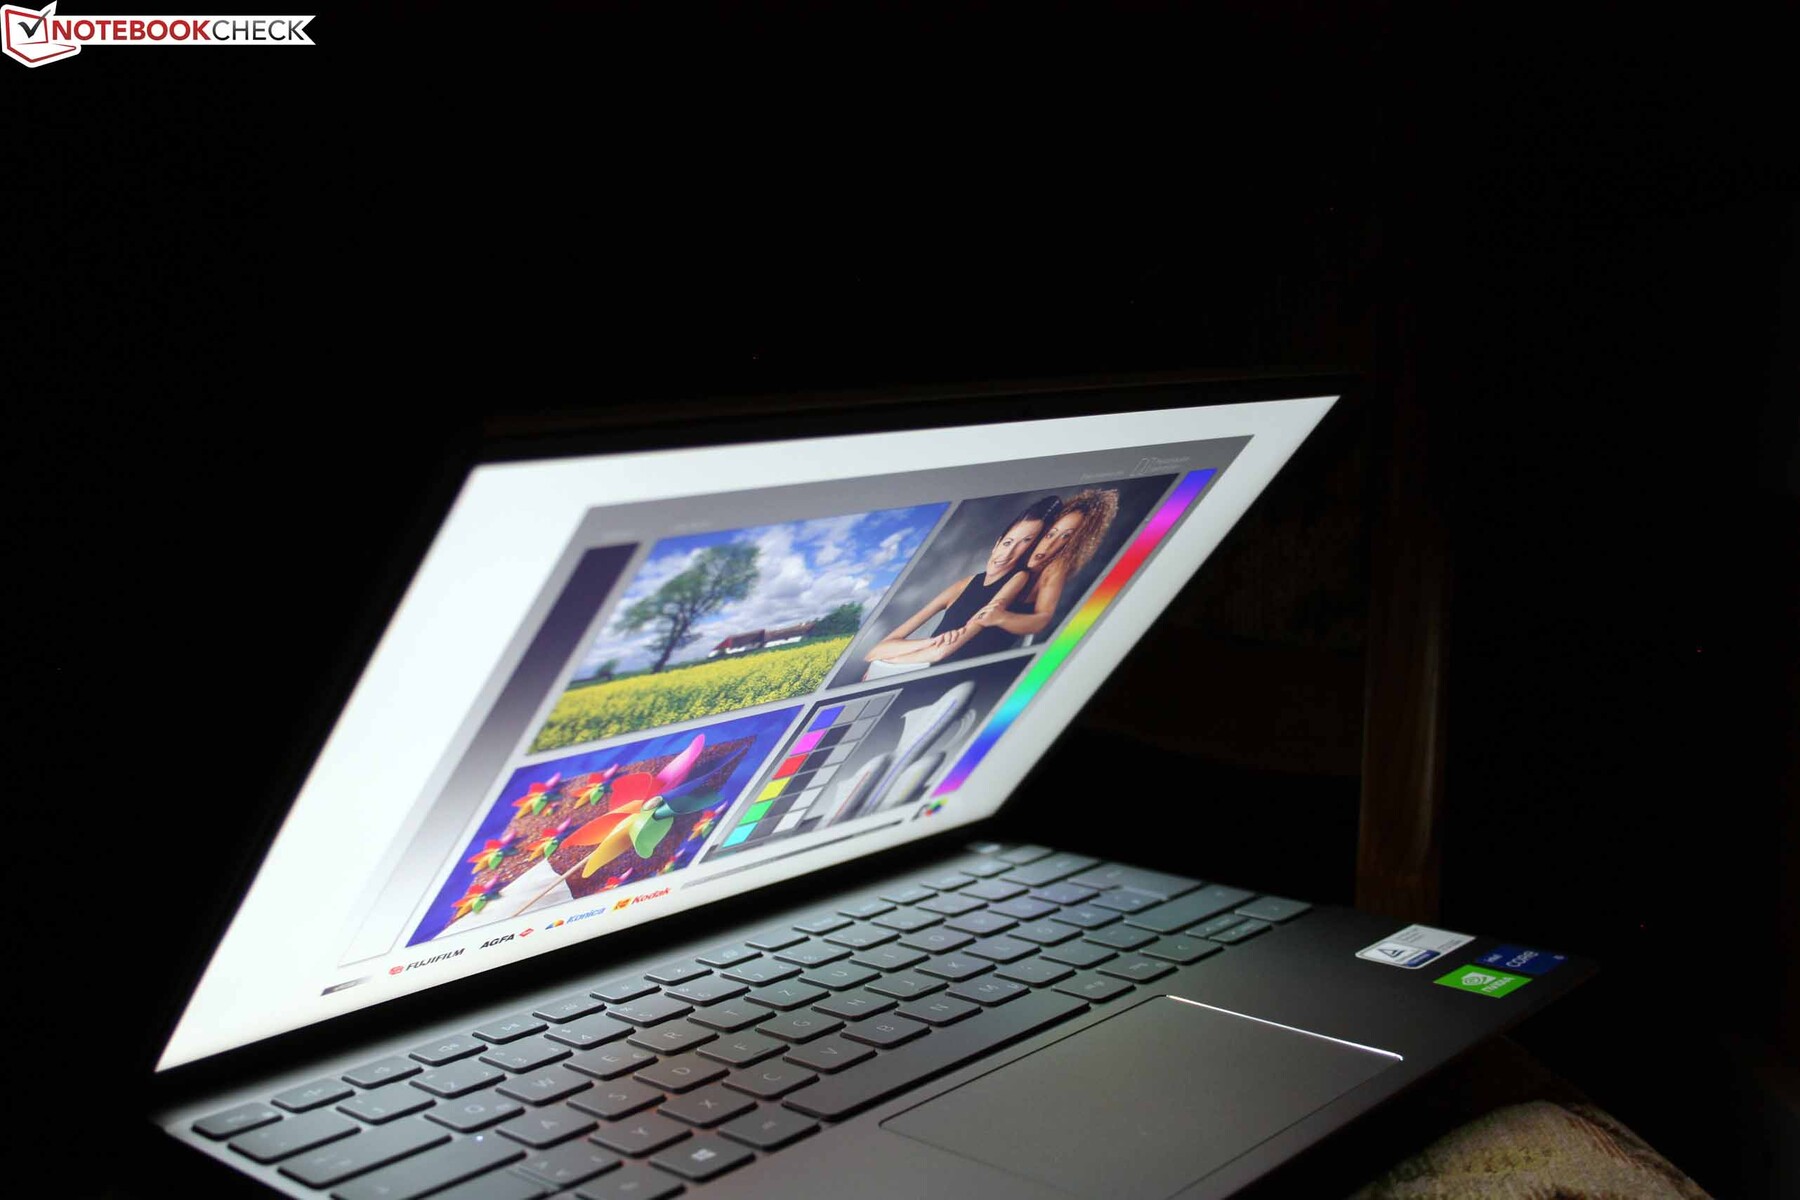
Distribuzione della luminosità: 88 %
Al centro con la batteria: 338 cd/m²
Contrasto: 914:1 (Nero: 0.37 cd/m²)
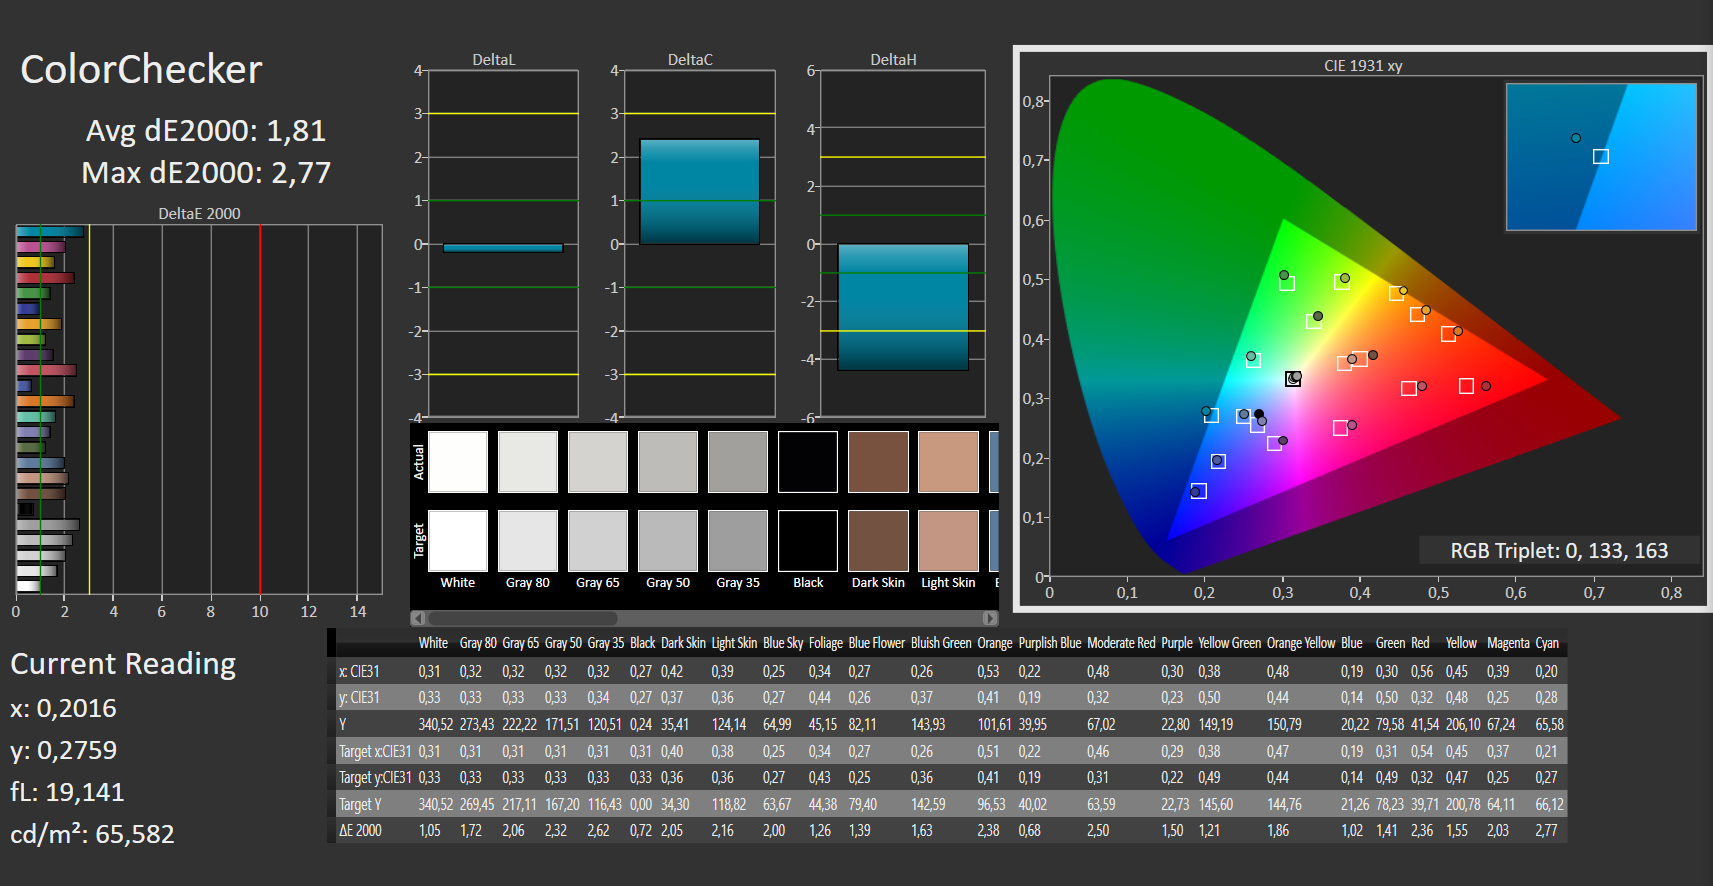
ΔE ColorChecker Calman: 1.81 | ∀{0.5-29.43 Ø4.73}
ΔE Greyscale Calman: 1.89 | ∀{0.09-98 Ø4.97}
74.6% AdobeRGB 1998 (Argyll 3D)
100% sRGB (Argyll 3D)
72.9% Display P3 (Argyll 3D)
Gamma: 2.35
CCT: 6196 K
| Dell Inspiron 13 5310-NJ24J AUO B133UAN, IPS, 1920x1200, 13.3" | HP Envy 13-ba1475ng CMN139D, IPS, 1920x1080, 13.3" | HP Pavilion Aero 13 be0097nr AU Optronics AUO6496, IPS, 1920x1200, 13.3" | Asus ZenBook 13 UM325S Samsung (SDC4158), OLED, 1920x1080, 13.3" | Asus ZenBook 13 UX325EA Samsung SDC4155 (ATNA33XC09-0), OLED, 1920x1080, 13.3" | Acer Spin 3 SP313-51N-56YV AU Optronics AUOB493, IPS, 2560x1600, 13.3" | |
|---|---|---|---|---|---|---|
| Display | -7% | 0% | 24% | 23% | 4% | |
| Display P3 Coverage (%) | 72.9 | 66.4 -9% | 73.4 1% | 99.9 37% | 99.9 37% | 78.8 8% |
| sRGB Coverage (%) | 100 | 97.6 -2% | 99.8 0% | 100 0% | 100 0% | 99.8 0% |
| AdobeRGB 1998 Coverage (%) | 74.6 | 67.5 -10% | 74.8 0% | 99.7 34% | 97.5 31% | 77.6 4% |
| Response Times | -40% | -16% | 88% | 94% | -36% | |
| Response Time Grey 50% / Grey 80% * (ms) | 39 ? | 66 ? -69% | 42.4 ? -9% | 4 ? 90% | 2 ? 95% | 52 ? -33% |
| Response Time Black / White * (ms) | 26 ? | 28.8 ? -11% | 31.6 ? -22% | 4 ? 85% | 2 ? 92% | 36 ? -38% |
| PWM Frequency (Hz) | 26040 ? | 60 ? | 60 ? | |||
| Screen | -19% | -13% | 74% | 2% | -78% | |
| Brightness middle (cd/m²) | 338 | 423 25% | 473.9 40% | 370 9% | 390 15% | 338 0% |
| Brightness (cd/m²) | 319 | 405 27% | 458 44% | 378 18% | 368 15% | 307 -4% |
| Brightness Distribution (%) | 88 | 83 -6% | 91 3% | 96 9% | 66 -25% | 83 -6% |
| Black Level * (cd/m²) | 0.37 | 0.23 38% | 0.36 3% | 0.05 86% | 0.27 27% | |
| Contrast (:1) | 914 | 1839 101% | 1316 44% | 7400 710% | 1252 37% | |
| Colorchecker dE 2000 * | 1.81 | 3.2 -77% | 2.99 -65% | 4.33 -139% | 2.03 -12% | 4.63 -156% |
| Colorchecker dE 2000 max. * | 2.77 | 5.8 -109% | 4.35 -57% | 7.04 -154% | 3.14 -13% | 9.99 -261% |
| Greyscale dE 2000 * | 1.89 | 4.7 -149% | 4 -112% | 0.92 51% | 1.28 32% | 6.76 -258% |
| Gamma | 2.35 94% | 1.99 111% | 2.35 94% | 2.38 92% | 2.4 92% | 2.37 93% |
| CCT | 6196 105% | 6362 102% | 6269 104% | 6394 102% | 6359 102% | 5934 110% |
| Colorchecker dE 2000 calibrated * | 1 | 1.1 | 4.14 | 3.1 | 1.64 | |
| Color Space (Percent of AdobeRGB 1998) (%) | 61.9 | 89.4 | 87 | 68 | ||
| Color Space (Percent of sRGB) (%) | 97.5 | 100 | 100 | 98 | ||
| Media totale (Programma / Settaggio) | -22% /
-19% | -10% /
-10% | 62% /
64% | 40% /
24% | -37% /
-52% |
* ... Meglio usare valori piccoli
Tempi di risposta del Display
| ↔ Tempi di risposta dal Nero al Bianco | ||
|---|---|---|
| 26 ms ... aumenta ↗ e diminuisce ↘ combinato | ↗ 14 ms Incremento |  |
| ↘ 12 ms Calo | ||
| Lo schermo mostra tempi di risposta relativamente lenti nei nostri tests e potrebbe essere troppo lento per i gamers. In confronto, tutti i dispositivi di test variano da 0.1 (minimo) a 240 (massimo) ms. » 62 % di tutti i dispositivi è migliore. Questo significa che i tempi di risposta rilevati sono peggiori rispetto alla media di tutti i dispositivi testati (19.9 ms). | ||
| ↔ Tempo di risposta dal 50% Grigio all'80% Grigio | ||
| 39 ms ... aumenta ↗ e diminuisce ↘ combinato | ↗ 19 ms Incremento |  |
| ↘ 20 ms Calo | ||
| Lo schermo mostra tempi di risposta lenti nei nostri tests e sarà insoddisfacente per i gamers. In confronto, tutti i dispositivi di test variano da 0.165 (minimo) a 636 (massimo) ms. » 59 % di tutti i dispositivi è migliore. Questo significa che i tempi di risposta rilevati sono peggiori rispetto alla media di tutti i dispositivi testati (31.1 ms). | ||
Sfarfallio dello schermo / PWM (Pulse-Width Modulation)
| flickering dello schermo / PWM non rilevato |  | ||
In confronto: 52 % di tutti i dispositivi testati non utilizza PWM per ridurre la luminosita' del display. Se è rilevato PWM, una media di 7791 (minimo: 5 - massimo: 343500) Hz è stata rilevata. | |||

Cinebench R15 Multi Constant Load Test
Cinebench R20: CPU (Single Core) | CPU (Multi Core)
Cinebench R15: CPU Single 64Bit | CPU Multi 64Bit
Blender: v2.79 BMW27 CPU
7-Zip 18.03: 7z b 4 -mmt1 | 7z b 4
Geekbench 5.5: Single-Core | Multi-Core
HWBOT x265 Benchmark v2.2: 4k Preset
LibreOffice : 20 Documents To PDF
R Benchmark 2.5: Overall mean
| Cinebench R23 / Single Core | |
| Media della classe Subnotebook (358 - 2213, n=61, ultimi 2 anni) | |
| Asus ZenBook 13 UM325S | |
| Asus ZenBook 13 UX325EA | |
| HP Pavilion Aero 13 be0097nr | |
| Dell Inspiron 13 5310-NJ24J | |
| Dell Inspiron 13 5310-NJ24J | |
| HP Envy 13-ba1475ng | |
| Media Intel Core i5-11300H (1218 - 1431, n=11) | |
| Acer Spin 3 SP313-51N-56YV | |
| Cinebench R23 / Multi Core | |
| Media della classe Subnotebook (1555 - 21812, n=60, ultimi 2 anni) | |
| Asus ZenBook 13 UM325S | |
| HP Pavilion Aero 13 be0097nr | |
| Dell Inspiron 13 5310-NJ24J | |
| Media Intel Core i5-11300H (3313 - 6581, n=10) | |
| Acer Spin 3 SP313-51N-56YV | |
| HP Envy 13-ba1475ng | |
| Asus ZenBook 13 UX325EA | |
| Cinebench R20 / CPU (Single Core) | |
| Media della classe Subnotebook (128 - 832, n=57, ultimi 2 anni) | |
| Asus ZenBook 13 UM325S | |
| HP Pavilion Aero 13 be0097nr | |
| HP Envy 13-ba1475ng | |
| Dell Inspiron 13 5310-NJ24J | |
| Dell Inspiron 13 5310-NJ24J | |
| Asus ZenBook 13 UX325EA | |
| Media Intel Core i5-11300H (431 - 548, n=11) | |
| Acer Spin 3 SP313-51N-56YV | |
| Cinebench R20 / CPU (Multi Core) | |
| Media della classe Subnotebook (579 - 8541, n=57, ultimi 2 anni) | |
| Asus ZenBook 13 UM325S | |
| HP Pavilion Aero 13 be0097nr | |
| Dell Inspiron 13 5310-NJ24J | |
| Media Intel Core i5-11300H (1300 - 2533, n=10) | |
| Acer Spin 3 SP313-51N-56YV | |
| HP Envy 13-ba1475ng | |
| Asus ZenBook 13 UX325EA | |
| Cinebench R15 / CPU Single 64Bit | |
| Media della classe Subnotebook (72.4 - 322, n=57, ultimi 2 anni) | |
| HP Pavilion Aero 13 be0097nr | |
| Asus ZenBook 13 UM325S | |
| Asus ZenBook 13 UX325EA | |
| HP Envy 13-ba1475ng | |
| Acer Spin 3 SP313-51N-56YV | |
| Media Intel Core i5-11300H (123 - 211, n=8) | |
| Dell Inspiron 13 5310-NJ24J | |
| Dell Inspiron 13 5310-NJ24J | |
| Cinebench R15 / CPU Multi 64Bit | |
| Media della classe Subnotebook (327 - 3345, n=57, ultimi 2 anni) | |
| Asus ZenBook 13 UM325S | |
| HP Pavilion Aero 13 be0097nr | |
| Media Intel Core i5-11300H (632 - 990, n=11) | |
| Asus ZenBook 13 UX325EA | |
| Acer Spin 3 SP313-51N-56YV | |
| Dell Inspiron 13 5310-NJ24J | |
| HP Envy 13-ba1475ng | |
| Blender / v2.79 BMW27 CPU | |
| Asus ZenBook 13 UX325EA | |
| Acer Spin 3 SP313-51N-56YV | |
| HP Envy 13-ba1475ng | |
| Dell Inspiron 13 5310-NJ24J | |
| Media Intel Core i5-11300H (466 - 862, n=10) | |
| Media della classe Subnotebook (159 - 2271, n=58, ultimi 2 anni) | |
| Asus ZenBook 13 UM325S | |
| HP Pavilion Aero 13 be0097nr | |
| 7-Zip 18.03 / 7z b 4 -mmt1 | |
| Media della classe Subnotebook (2643 - 6699, n=59, ultimi 2 anni) | |
| HP Pavilion Aero 13 be0097nr | |
| Asus ZenBook 13 UM325S | |
| Asus ZenBook 13 UX325EA | |
| HP Envy 13-ba1475ng | |
| Media Intel Core i5-11300H (4603 - 4969, n=10) | |
| Dell Inspiron 13 5310-NJ24J | |
| Acer Spin 3 SP313-51N-56YV | |
| 7-Zip 18.03 / 7z b 4 | |
| Media della classe Subnotebook (11668 - 77867, n=57, ultimi 2 anni) | |
| HP Pavilion Aero 13 be0097nr | |
| Asus ZenBook 13 UM325S | |
| Dell Inspiron 13 5310-NJ24J | |
| Media Intel Core i5-11300H (17573 - 26001, n=10) | |
| Asus ZenBook 13 UX325EA | |
| Acer Spin 3 SP313-51N-56YV | |
| HP Envy 13-ba1475ng | |
| Geekbench 5.5 / Single-Core | |
| Media della classe Subnotebook (726 - 2224, n=48, ultimi 2 anni) | |
| Asus ZenBook 13 UX325EA | |
| HP Envy 13-ba1475ng | |
| Asus ZenBook 13 UM325S | |
| Dell Inspiron 13 5310-NJ24J | |
| Media Intel Core i5-11300H (1342 - 1462, n=10) | |
| Acer Spin 3 SP313-51N-56YV | |
| Geekbench 5.5 / Multi-Core | |
| Media della classe Subnotebook (2557 - 17218, n=48, ultimi 2 anni) | |
| Asus ZenBook 13 UM325S | |
| Asus ZenBook 13 UX325EA | |
| Dell Inspiron 13 5310-NJ24J | |
| Acer Spin 3 SP313-51N-56YV | |
| HP Envy 13-ba1475ng | |
| Media Intel Core i5-11300H (3631 - 5499, n=10) | |
| HWBOT x265 Benchmark v2.2 / 4k Preset | |
| Media della classe Subnotebook (0.97 - 25.1, n=57, ultimi 2 anni) | |
| HP Pavilion Aero 13 be0097nr | |
| Asus ZenBook 13 UM325S | |
| Media Intel Core i5-11300H (4.32 - 8.38, n=10) | |
| Dell Inspiron 13 5310-NJ24J | |
| Acer Spin 3 SP313-51N-56YV | |
| HP Envy 13-ba1475ng | |
| Asus ZenBook 13 UX325EA | |
| LibreOffice / 20 Documents To PDF | |
| Media della classe Subnotebook (39.9 - 220, n=56, ultimi 2 anni) | |
| Asus ZenBook 13 UX325EA | |
| HP Envy 13-ba1475ng | |
| Asus ZenBook 13 UM325S | |
| Dell Inspiron 13 5310-NJ24J | |
| HP Pavilion Aero 13 be0097nr | |
| Media Intel Core i5-11300H (43.6 - 59.4, n=10) | |
| Acer Spin 3 SP313-51N-56YV | |
| R Benchmark 2.5 / Overall mean | |
| Acer Spin 3 SP313-51N-56YV | |
| Dell Inspiron 13 5310-NJ24J | |
| Media Intel Core i5-11300H (0.6 - 0.644, n=10) | |
| HP Envy 13-ba1475ng | |
| Asus ZenBook 13 UX325EA | |
| Asus ZenBook 13 UM325S | |
| HP Pavilion Aero 13 be0097nr | |
| Media della classe Subnotebook (0.4024 - 1.456, n=58, ultimi 2 anni) | |
* ... Meglio usare valori piccoli
| PCMark 10 / Score | |
| Media della classe Subnotebook (4920 - 9939, n=44, ultimi 2 anni) | |
| Asus ZenBook 13 UM325S | |
| HP Pavilion Aero 13 be0097nr | |
| Dell Inspiron 13 5310-NJ24J | |
| Media Intel Core i5-11300H, NVIDIA GeForce MX450 (4899 - 5391, n=3) | |
| HP Envy 13-ba1475ng | |
| Asus ZenBook 13 UX325EA | |
| Acer Spin 3 SP313-51N-56YV | |
| PCMark 10 / Essentials | |
| Media della classe Subnotebook (8552 - 11646, n=44, ultimi 2 anni) | |
| HP Pavilion Aero 13 be0097nr | |
| Asus ZenBook 13 UM325S | |
| Asus ZenBook 13 UX325EA | |
| Acer Spin 3 SP313-51N-56YV | |
| HP Envy 13-ba1475ng | |
| Dell Inspiron 13 5310-NJ24J | |
| Media Intel Core i5-11300H, NVIDIA GeForce MX450 (8366 - 8931, n=3) | |
| PCMark 10 / Productivity | |
| Media della classe Subnotebook (5435 - 16606, n=44, ultimi 2 anni) | |
| Asus ZenBook 13 UM325S | |
| Dell Inspiron 13 5310-NJ24J | |
| HP Pavilion Aero 13 be0097nr | |
| Media Intel Core i5-11300H, NVIDIA GeForce MX450 (8292 - 9188, n=3) | |
| HP Envy 13-ba1475ng | |
| Asus ZenBook 13 UX325EA | |
| Acer Spin 3 SP313-51N-56YV | |
| PCMark 10 / Digital Content Creation | |
| Media della classe Subnotebook (5722 - 13779, n=44, ultimi 2 anni) | |
| HP Pavilion Aero 13 be0097nr | |
| Asus ZenBook 13 UM325S | |
| Dell Inspiron 13 5310-NJ24J | |
| Media Intel Core i5-11300H, NVIDIA GeForce MX450 (4600 - 5388, n=3) | |
| HP Envy 13-ba1475ng | |
| Acer Spin 3 SP313-51N-56YV | |
| Asus ZenBook 13 UX325EA | |
| PCMark 10 Score | 5391 punti | |
Aiuto | ||
| DPC Latencies / LatencyMon - interrupt to process latency (max), Web, Youtube, Prime95 | |
| Dell Inspiron 13 5310-NJ24J | |
| Acer Spin 3 SP313-51N-56YV | |
| HP Envy 13-ba1475ng | |
| Asus ZenBook 13 UX325EA | |
| HP Pavilion Aero 13 be0097nr | |
| Asus ZenBook 13 UM325S | |
* ... Meglio usare valori piccoli
| Dell Inspiron 13 5310-NJ24J Toshiba KBG40ZNS512G NVMe | HP Envy 13-ba1475ng Intel SSD 660p SSDPEKNW512G8 | HP Pavilion Aero 13 be0097nr Intel SSD 660p SSDPEKNW512G8 | Asus ZenBook 13 UM325S SK Hynix HFM001TD3JX013N | Media Toshiba KBG40ZNS512G NVMe | Media della classe Subnotebook | |
|---|---|---|---|---|---|---|
| CrystalDiskMark 5.2 / 6 | -9% | -2% | 54% | 1% | 99% | |
| Write 4K (MB/s) | 131.3 | 133.5 2% | 128.3 -2% | 151.6 15% | 126.4 ? -4% | 154.6 ? 18% |
| Read 4K (MB/s) | 47.63 | 39.66 -17% | 50.9 7% | 63.2 33% | 50 ? 5% | 64.2 ? 35% |
| Write Seq (MB/s) | 1328 | 907 -32% | 971 -27% | 2292 73% | 1207 ? -9% | 2846 ? 114% |
| Read Seq (MB/s) | 1365 | 1481 8% | 1540 13% | 2073 52% | 1567 ? 15% | 3299 ? 142% |
| Write 4K Q32T1 (MB/s) | 381.2 | 446.2 17% | 538 41% | 505 32% | 347 ? -9% | 431 ? 13% |
| Read 4K Q32T1 (MB/s) | 388.7 | 335.1 -14% | 344.4 -11% | 413.5 6% | 425 ? 9% | 500 ? 29% |
| Write Seq Q32T1 (MB/s) | 1186 | 975 -18% | 980 -17% | 3137 165% | 1224 ? 3% | 4622 ? 290% |
| Read Seq Q32T1 (MB/s) | 2328 | 1874 -20% | 1829 -21% | 3604 55% | 2278 ? -2% | 5783 ? 148% |
| Write 4K Q8T8 (MB/s) | 488.9 | 315 ? | 887 ? | |||
| Read 4K Q8T8 (MB/s) | 1276 | 854 ? | 1272 ? | |||
| AS SSD | -7% | -13% | 70% | -26% | 79% | |
| Seq Read (MB/s) | 1897 | 1608 -15% | 1616 -15% | 2916 54% | 1871 ? -1% | 4469 ? 136% |
| Seq Write (MB/s) | 741 | 659 -11% | 761 3% | 1566 111% | 810 ? 9% | 2954 ? 299% |
| 4K Read (MB/s) | 50 | 51.3 3% | 46.87 -6% | 56 12% | 45.8 ? -8% | 59.5 ? 19% |
| 4K Write (MB/s) | 122 | 151.8 24% | 126.6 4% | 159.8 31% | 110.9 ? -9% | 168.6 ? 38% |
| 4K-64 Read (MB/s) | 1060 | 322.1 -70% | 324.6 -69% | 1011 -5% | 997 ? -6% | 855 ? -19% |
| 4K-64 Write (MB/s) | 723 | 800 11% | 815 13% | 2136 195% | 452 ? -37% | 1697 ? 135% |
| Access Time Read * (ms) | 0.07 | 0.077 -10% | 0.074 -6% | 0.028 60% | 0.1024 ? -46% | 0.06543 ? 7% |
| Access Time Write * (ms) | 0.168 | 0.046 73% | 0.135 20% | 0.028 83% | 0.4026 ? -140% | 0.05129 ? 69% |
| Score Read (Points) | 1300 | 534 -59% | 533 -59% | 1359 5% | 1232 ? -5% | 1359 ? 5% |
| Score Write (Points) | 921 | 1018 11% | 1018 11% | 2452 166% | 644 ? -30% | 2161 ? 135% |
| Score Total (Points) | 2838 | 1797 -37% | 1798 -37% | 4451 57% | 2461 ? -13% | 4155 ? 46% |
| Copy ISO MB/s (MB/s) | 961 | 906 | 1983 | 1785 ? | 2587 ? | |
| Copy Program MB/s (MB/s) | 753 | 614 | 792 | 388 ? | 832 ? | |
| Copy Game MB/s (MB/s) | 896 | 539 | 1457 | 715 ? | 1762 ? | |
| Media totale (Programma / Settaggio) | -8% /
-8% | -8% /
-8% | 62% /
63% | -13% /
-15% | 89% /
87% |
* ... Meglio usare valori piccoli

Carico di lettura continuo: DiskSpd Read Loop, Queue Depth 8
| 3DMark 11 Performance | 9244 punti | |
| 3DMark Fire Strike Score | 4886 punti | |
| 3DMark Time Spy Score | 1515 punti | |
Aiuto | ||
Grafico FPS The Witcher 3
| The Witcher 3 | |
| 1920x1080 High Graphics & Postprocessing (Nvidia HairWorks Off) | |
| Media della classe Subnotebook (25.6 - 64, n=13, ultimi 2 anni) | |
| Lenovo IdeaPad 5 Pro 16IHU6 | |
| HP Envy 13-ba1475ng | |
| Media NVIDIA GeForce MX450 (21 - 46, n=16) | |
| Dell Inspiron 13 5310-NJ24J | |
| Asus ZenBook 13 UX325EA | |
| Acer Spin 3 SP313-51N-56YV | |
| HP Pavilion Aero 13 be0097nr | |
| 1920x1080 Ultra Graphics & Postprocessing (HBAO+) | |
| Media della classe Subnotebook (13.9 - 34.6, n=13, ultimi 2 anni) | |
| Lenovo IdeaPad 5 Pro 16IHU6 | |
| Dell Inspiron 13 5310-NJ24J | |
| Media NVIDIA GeForce MX450 (17.2 - 24.8, n=16) | |
| HP Envy 13-ba1475ng | |
| HP Pavilion Aero 13 be0097nr | |
| Asus ZenBook 13 UX325EA | |
| Acer Spin 3 SP313-51N-56YV | |
| Final Fantasy XV Benchmark - 1920x1080 Standard Quality | |
| Media della classe Subnotebook (15.1 - 75.2, n=54, ultimi 2 anni) | |
| Lenovo IdeaPad 5 Pro 16IHU6 | |
| Dell Inspiron 13 5310-NJ24J | |
| Media NVIDIA GeForce MX450 (25 - 34.5, n=13) | |
| Acer Spin 3 SP313-51N-56YV | |
| Asus ZenBook 13 UM325S | |
| HP Pavilion Aero 13 be0097nr | |
| basso | medio | alto | ultra | |
|---|---|---|---|---|
| The Witcher 3 (2015) | 112 | 71 | 33 | 23 |
| Dota 2 Reborn (2015) | 130 | 118 | 103 | 82.9 |
| Final Fantasy XV Benchmark (2018) | 58.3 | 31.6 | ||
| X-Plane 11.11 (2018) | 64.9 | 53.4 | 44.4 | |
| Strange Brigade (2018) | 127 | 49.6 | 42.4 | 33.1 |
Rumorosità
| Idle |
| 26 / 26 / 26 dB(A) |
| Sotto carico |
| 48 / 48.3 dB(A) |
 | ||
30 dB silenzioso 40 dB(A) udibile 50 dB(A) rumoroso |
||
min: | ||
(-) La temperatura massima sul lato superiore è di 58.4 °C / 137 F, rispetto alla media di 35.9 °C / 97 F, che varia da 21.4 a 59 °C per questa classe Subnotebook.
(-) Il lato inferiore si riscalda fino ad un massimo di 58.4 °C / 137 F, rispetto alla media di 39.2 °C / 103 F
(+) In idle, la temperatura media del lato superiore è di 27.9 °C / 82 F, rispetto alla media deld ispositivo di 30.8 °C / 87 F.
(±) Riproducendo The Witcher 3, la temperatura media per il lato superiore e' di 37.6 °C / 100 F, rispetto alla media del dispositivo di 30.8 °C / 87 F.
(+) I poggiapolsi e il touchpad sono piu' freddi della temperatura della pelle con un massimo di 28.4 °C / 83.1 F e sono quindi freddi al tatto.
(±) La temperatura media della zona del palmo della mano di dispositivi simili e'stata di 28.2 °C / 82.8 F (-0.2 °C / -0.3 F).
Dell Inspiron 13 5310-NJ24J analisi audio
(+) | gli altoparlanti sono relativamente potenti (88.4 dB)
Bassi 100 - 315 Hz
(-) | quasi nessun basso - in media 21.3% inferiori alla media
(+) | bassi in lineaa (5.8% delta rispetto alla precedente frequenza)
Medi 400 - 2000 Hz
(+) | medi bilanciati - solo only 3.1% rispetto alla media
(+) | medi lineari (4.2% delta rispetto alla precedente frequenza)
Alti 2 - 16 kHz
(±) | alti elevati - circa 5.5% superiori alla media
(+) | alti lineari (6.4% delta rispetto alla precedente frequenza)
Nel complesso 100 - 16.000 Hz
(±) | la linearità complessiva del suono è media (17% di differenza rispetto alla media
Rispetto alla stessa classe
» 43% di tutti i dispositivi testati in questa classe è stato migliore, 8% simile, 49% peggiore
» Il migliore ha avuto un delta di 5%, medio di 18%, peggiore di 53%
Rispetto a tutti i dispositivi testati
» 30% di tutti i dispositivi testati in questa classe è stato migliore, 8% similare, 62% peggiore
» Il migliore ha avuto un delta di 4%, medio di 24%, peggiore di 134%
Asus ZenBook 13 UX325EA analisi audio
(±) | potenza degli altiparlanti media ma buona (79.4 dB)
Bassi 100 - 315 Hz
(-) | quasi nessun basso - in media 18.1% inferiori alla media
(±) | la linearità dei bassi è media (13.4% delta rispetto alla precedente frequenza)
Medi 400 - 2000 Hz
(+) | medi bilanciati - solo only 3.1% rispetto alla media
(+) | medi lineari (4.8% delta rispetto alla precedente frequenza)
Alti 2 - 16 kHz
(+) | Alti bilanciati - appena 4.1% dalla media
(+) | alti lineari (5.9% delta rispetto alla precedente frequenza)
Nel complesso 100 - 16.000 Hz
(+) | suono nel complesso lineare (14.2% differenza dalla media)
Rispetto alla stessa classe
» 27% di tutti i dispositivi testati in questa classe è stato migliore, 6% simile, 67% peggiore
» Il migliore ha avuto un delta di 5%, medio di 18%, peggiore di 53%
Rispetto a tutti i dispositivi testati
» 17% di tutti i dispositivi testati in questa classe è stato migliore, 4% similare, 79% peggiore
» Il migliore ha avuto un delta di 4%, medio di 24%, peggiore di 134%
| Off / Standby | |
| Idle | |
| Sotto carico |
|
Leggenda:
min: | |
Consumo energetico The Witcher 3 / Stress Test
| Dell Inspiron 13 5310-NJ24J i5-11300H, GeForce MX450, 54 Wh | HP Envy 13-ba1475ng i7-1165G7, GeForce MX450, 51 Wh | HP Pavilion Aero 13 be0097nr R7 5800U, Vega 8, 43 Wh | Asus ZenBook 13 UM325S R7 5800U, Vega 8, 67 Wh | Asus ZenBook 13 UX325EA i7-1165G7, Iris Xe G7 96EUs, 67 Wh | Acer Spin 3 SP313-51N-56YV i5-1135G7, Iris Xe G7 80EUs, 48 Wh | Media della classe Subnotebook | |
|---|---|---|---|---|---|---|---|
| Battery Runtime | 1% | -13% | -11% | 75% | -21% | 36% | |
| WiFi Websurfing (h) | 10.3 | 10.4 1% | 9 -13% | 9.2 -11% | 10.7 4% | 8.1 -21% | 14 ? 36% |
| 1920x1080 Witcher 3 ultra 150cd (h) | 1.3 | 3.2 146% | |||||
| Autonomia della batteria | |||||||
| Reader / Idle (h) | 22.3 | 18.9 -15% | 23.2 4% | 28.6 ? 28% | |||
| Media totale (Programma / Settaggio) | 1% /
1% | -14% /
-14% | -4% /
-4% | 75% /
75% | -21% /
-21% | 32% /
32% |
Pro
Contro
Valutazione complessiva: Un subnotebook sopraffatto dall'hardware
Il produttore si impegna molto sull'apparenza in questo caso, poiché il processore e la scheda grafica non sono in grado di produrre le prestazioni che dovrebbero essere possibili secondo il foglio delle specifiche (e le medie nel nostro database). Anche se il portatile contiene un SoC da 35 watt, non usa tutti i 35 watt. Lo stesso vale per la grafica MX450, e anche se Dell usa la versione da 25 watt con GDDR6, questa limita rapidamente la sua velocità, che diventa uno svantaggio nei giochi.
Quindi il nostro test porta un po' di disillusione: Il raffreddamento limitato del Dell Inspiron 13 5310 non è progettato per così tanta potenza e i portatili più spessi da 15 pollici sembrano essere più adatti al Tiger Lake-H e alla MX450.
Allo stesso tempo, tutto questo è di alto livello. Nel complesso, stiamo guardando un subnotebook moderatamente potente, ha i punti di forza nelle sue connessioni e nel suo display. Il display opaco e luminoso piace con i suoi colori accurati, e con 2 x Thunderbolt 4, si è preparati per soluzioni di docking e future periferiche fino alle schede grafiche esterne. La WLAN è abbastanza veloce, e la manutenzione è facile - anche se la memoria di lavoro è saldata. Alla fine, anche la durata della batteria e il peso giocano un ruolo, e a questo proposito 1,3 kg (~3 lb) e 10 ore sono un bonus.
Coloro che hanno bisogno di più potenza di calcolo della CPU quando sono in giro ma non vogliono spendere più soldi dovrebbero dare un'occhiata più da vicino ai modelli AMD HP Pavilion Aero 13 be0097nr e Asus ZenBook 13 UM325S.
D'altra parte, coloro che non vogliono fare a meno di una scheda grafica della classe MX450 difficilmente troveranno attualmente una scelta migliore nel formato da 13 pollici. L'unica altra opzione, l'HP Envy 13-ba1475ng utilizza la lenta MX450 da 12 watt, un processore da 15 watt e non offre alcuna Thunderbolt. Dispositivi con iGPUs come la Vega 8 o Iris Xe G7 96EU, non producono le prestazioni nei giochi reali che una MX450 da 25-Watt (N18S-G5) è in grado di fornire, anche se non funziona a piena potenza.
Dell Inspiron 13 5310-NJ24J
- 09/03/2021 v7 (old)
Sebastian Jentsch
